1. Introduction
Combined with the rapid urbanization, energy consumption, and energy-related carbon emission still have great growth potential in the short and medium term [
1]. According to NBSC in 2016 (National Bureau of Statistics of China), 37.3% of energy consumption and 12% of carbon emission are caused by transport sector, and motor vehicle ownership continues to grow at an average annual rate of 5.8% and reached 319 million units by the first half of 2018, which also generates more traffic congestion in China [
2]. Therefore, how to achieve a green and sustainable development of the transportation sector is an urgent problem that China faces right now.
As a major energy consumer, the transport sector is also one of the most significant sources of greenhouse gas and air pollutant emissions, which correspondingly pose severe problems of air pollution and increasing death rate of people [
3,
4,
5]. Therefore, there are some efforts to find a way to achieve environmental friendly transport system, including introducing carbon trading mechanism [
6], appealing to expand mass transit systems [
7], promoting electric vehicles (EV) [
8], and so on. However, these macroscopical measures could merely be a direction indicator of the transportation sector led by the government instead of solutions with specific operability that easily adopted by individuals.
Apart from some policy approaches, newly developed transportation technologies allow people to take part in the shared economy of some smartphone applications that could be a platform to share vehicles and trips with others [
9]. The research object of this paper is sharing trips between private cars owners as well as the customers who share the same destinations. This sharing trip services has become increasingly popular among individuals in China, which could be an alternative way to achieve the sustainability in transportation system by gaining the benefits of private vehicle use without the costs and responsibilities of vehicle ownership for users. This travel mode could save fuel consumption and travel costs per passenger, which can further mitigate the inner-city traffic, congestion, and environmental problems [
10,
11,
12,
13,
14,
15].
However, the service condition of ridesharing varies from area’s economic developmental level, transportation system’s infrastructure construction, users’ acceptability and using habits as well as other relevant factors, which indicates the unbalanced development of ridesharing in different regions and heterogeneous characteristics of ridesharing travel behavior and intention as well as the orders’ distribution features and environmental impact. Meanwhile, there is hardly any research paying attention to the heterogeneous features, while existing studies mainly based on survey data or the small-scale trip data instead of the raw observed order information [
16,
17,
18]. Thus, we conducted a joint research with DiDi Chuxing, a Chinese transportation network company offering the enormous of ridesharing services in China. We have established an analysis model to reveal the spatial heterogeneous characteristics of ridesharing.
We divide this regional heterogeneity into two aspects, travel pattern characteristics and environmental impact. Firstly, it is meaningful to conduct an in-depth research on ridesharing, which regarded as an emerging alternative travel mode. It reveals trip-related characteristics such as order’s distribution, service time and distance, and then links the travel-related information to demographic, geographic, and economic data for analysis. Secondly, the difference of travel pattern could result in a different condition of environmental impact which is a significant concern in transportation research and policymakers. By exploring the differences in environmental impacts, it could offer more policy evidence to promote ridesharing in different regions case by case and achieve greater environmental benefits accordingly. A survey was conducted by the DiDi’s platform though smart phones to reveal users’ demographics, original travel mode, and attitude variation after using ridesharing service. Also, the first-hand data of ridesharing trips from DiDi company is employed to summarize the travel behavior of customers. Moreover, lifecycle analysis of fuel and environmental input–output analysis are applied in this research to estimate the environmental impact in short and long-term separately.
Based on the analysis model, Beijing–Tianjin–Hebei (BTH) region is picked as the empirical target. BTH region is chosen for its unbalanced regional development from the perspective of economic development level, infrastructure construction and the citizen’s awareness of protecting the environment, etc. For the reason that it is facing many problems of transportation (e.g., vehicle purchasing constraints, plate number-based traffic rationing, insufficient public transport capacity, and parking difficulties), it is worthwhile to estimate the environmental impact of ridesharing. The extensive regional disparities make BTH region a good research target to reveal the spatial heterogeneity within this region for ridesharing service.
The remaining of the paper is structured as follows: The related research is systematically depicted in
Section 2. The methods and data are presented in
Section 3. The results of direct and indirect environmental impacts of ridesharing are revealed in
Section 4. Finally,
Section 5 provides conclusions and corresponding policy implications.
2. Literature Review
Ridesharing is recognized as an innovative mobility system that makes travel cheaper, cleaner, and more accessible, particularly in cities, although it causes a little governance of risk and customer’s safety issue during the operation [
19,
20,
21]. Moreover, even though it is not easy to promote consumer’s acceptance, it is still believed to be a low-carbon approach to establish a sustainable and environmentally friendly transport system [
19,
22,
23]. Comparing with the government-oriented measures, promoting ridesharing could be a more tangible and market-oriented way to realize sustainable and environmental friendly development in transportation system. In recent years, a good deal of research on ridesharing have appeared.
Although ridesharing is a new way of travel, it has been more and more popular and is believed to have the ability to alter user’s behavior and pattern of daily travel. Recent studies suggest that some critical elements will influence user heterogeneity in personal mobility, including personality traits, past mobility behavior, and lifestyle [
24,
25,
26]. Specifically, it is widely accepted that the prototype user is relatively young, affluent, and well educated based on a survey conducted in two German cities [
27]. Then, it is believed that ridesharing could and increasing the interconnectivity between different travel modes, which would further change user’s choice of travel mode [
18]. Therefore, the shift of travel mode might affect travel behavior and provide extra options to vehicle ownership, which may further spread to the environment [
28,
29]. However, some opinions of scholars are in conflict. For example, some scholars state that ridesharing could reduce user’s travel time, while others believe that the benefit of time consumption is not significant for the reason that there is a tradeoff between the original cost of travel time and the time to pick up additional passengers [
14]. Moreover, some scholars insist that ridesharing would reduce the use of private cars and ease the pressure of traffic congestion, while others scholars believe that ridesharing could stimulate more travel demand for the accessibility of the mobility in San Francisco and Montreal [
30].
However, regional heterogeneity has not been taken into consideration in the previous research. Some research proves that it could change citizen’s travel behavior [
31,
32]. The reason for this phenomenon could be the unbalance in development of economy and transportation system, the different functional zone designing, and so on. However, relevant research hasn’t shed light on the services of ridesharing. Given the limited literature on ridesharing, the spatial features on travel behavior are still to be further studied.
Another significant research interest of ridesharing lies in the environmental impacts of energy saving and greenhouse gas emission reductions of ridesharing. Some models are introduced to evaluate the environmental benefits of carsharing services in a graded hypothetical city, Dublin and Paris, including an introduced COPERT4 model, an agent-based simulation model and an integrated transport land-use model [
10,
33,
34]. Due to the limitation of real ridesharing operating data, questionnaire survey is the most widely adopted method to conduct research with an area [
16,
35]. For example, the effect of ridesharing on greenhouse gas emissions is estimated by 9635 ridesharing users’ survey data in Canada and the U.S [
36]. However, the limitation of these studies is that this research is mainly focused on limited survey data and only taking the environmental impact related to trip distance and fuel into consideration. Furthermore, Yu had taken the direct and long-term environmental impact into consideration, but this research is only limited in one city of Beijing [
37].
To sum up, after summarizing the existing ridesharing studies, we find that the study focusing on the ridesharing travel mode and travel behavior is limited, especially from the spatial heterogeneous characteristics perspective of the comprehensive travel pattern and environmental impact.
Therefore, the major contribution and innovation point of this paper is that we firstly answered two questions: (1) what is the regional heterogeneity of ridesharing’s travel pattern? And (2) what is the regional heterogeneity of ridesharing’s environmental impacts? Moreover, the analysis model combines the travel pattern with the environmental impact, which could perform an in-depth and comprehensive analysis of ridesharing.
3. Methods and Data
As the follow-up research in a series on ridesharing impacts [
37], the scope of this paper is defined as exploring spatial heterogeneity analysis model of ridesharing. The following analysis reveals the analytical method of ridesharing’ spatial characteristics.
3.1. Research Approach
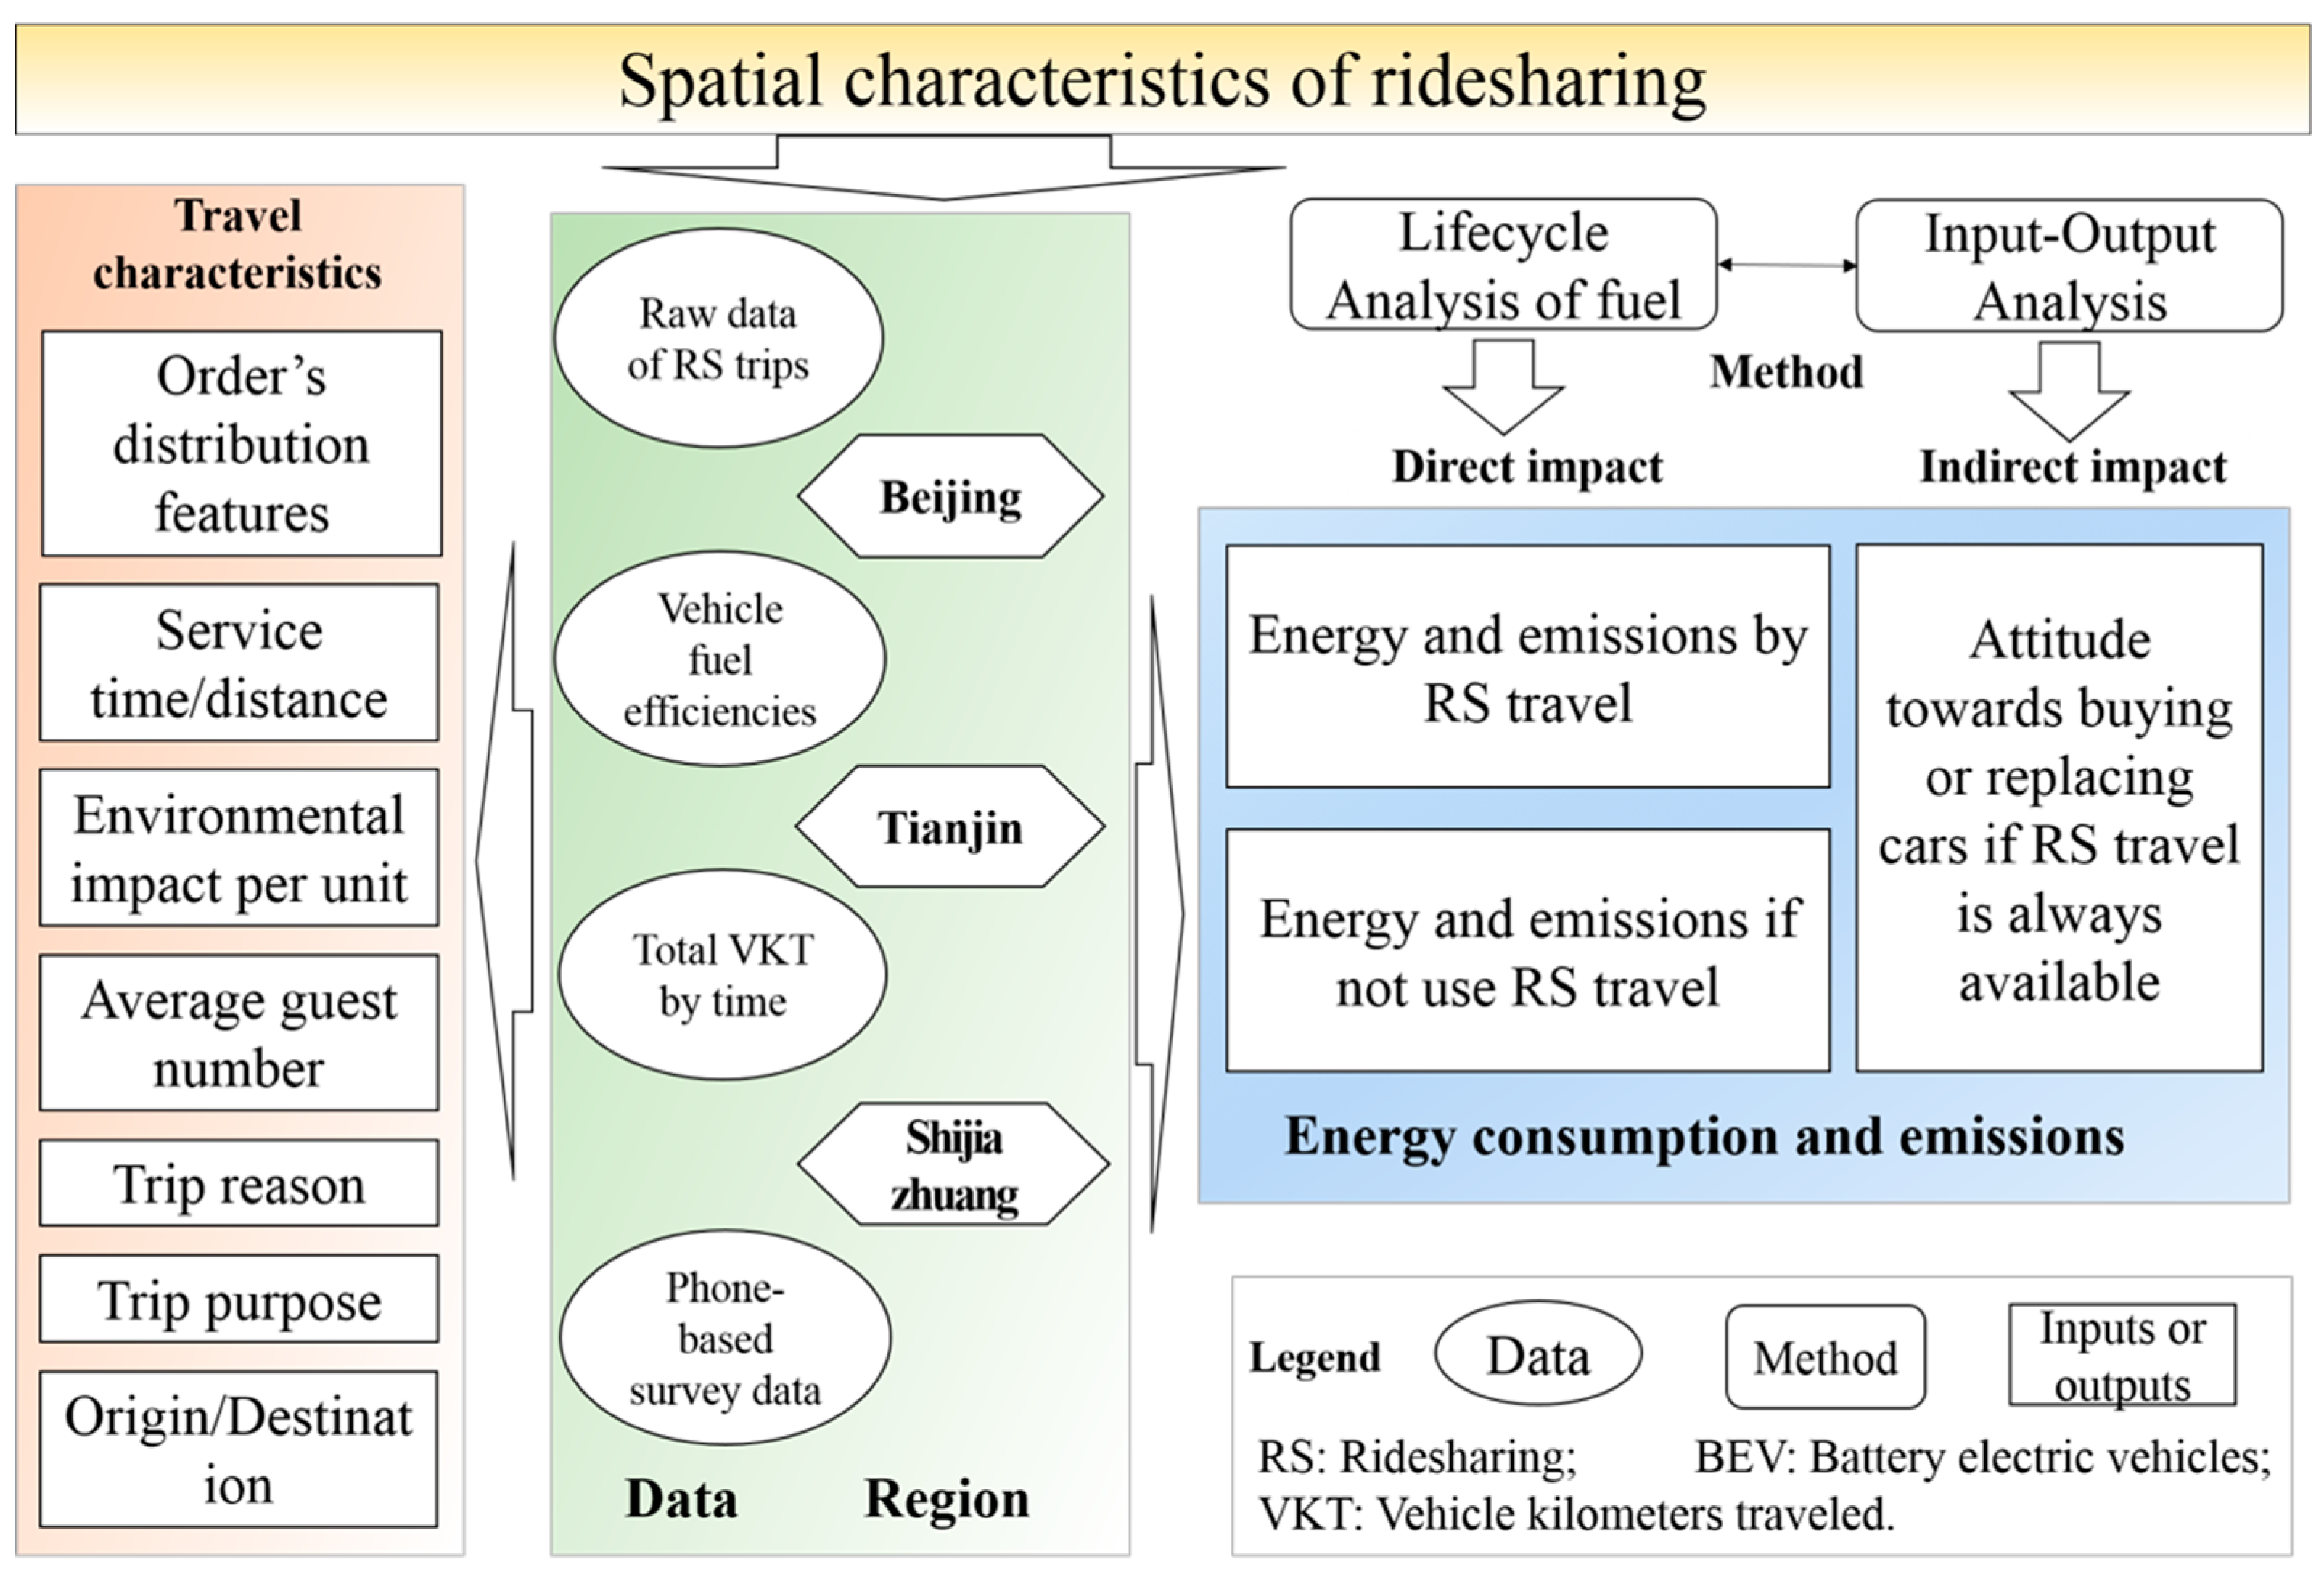
We firstly capture the regional characteristics of travel pattern characteristics, including order’s distribution features, service time/distance, the environmental impact per unit, average guest number, trip reason, and purpose, as well as origin and destination of trips. Following this analysis framework, the homogeneity and heterogeneity are revealed coupling with the demographic, geographic, and economic status of different regions.
In order to evaluate the indirect breadth of environmental impact that ridesharing can facilitate, two classifications of impacts are defined in this research by considering visible emissions that would have occurred in the absence of ridesharing. One impact is named as the “direct impact” while the other is “indirect impact”. Then, the lifecycle analysis of fuel and environmental input–output analysis is applied in this research to calculate energy consumption and emission caused by ridesharing (see
Figure 1).
Direct impact includes the environmental impact that results from a direct change caused by ridesharing. The direct impact dues to changes that happen and are physically measurable. It is mainly derived from the users’ mode shift, the direct impact is further results in the change of fuel consumption. Ridesharing service needs the efforts from two agents, including drivers who shift from private car owners, and the individuals who initially travel by others traditional ways. Based on the lifecycle analysis of fuel, the impact can be calculated as follows [
38,
39,
40]:
Equation (1) shows the energy consumption (
) of electric vehicle (
EV):
and Equation (2) shows the energy consumption (
) of conventional passenger vehicle (
CPV):
here,
r is different regions,
denotes the vehicle kilometers traveled (VKT),
denotes the level of electricity or petrol consumption per kilometer. For EV,
denotes the share of the total electricity generated by primary energy resources
i.
refers to the efficiency during the life cycle of fuel. It includes efficiency of primary energy resources’ exploitation (
), transportation (
), and generation (
), as well as the efficiency of power grid’s electricity transmission (
). For CPV,
Q and
donate petrol’s calorific value and density per unit.
θR and
θT refer to the efficiency of crude oil refinement and transportation [
37].
Equation (3) shows the gas emission (
) of
EV:
and Equation (4) shows the gas emission (
) of
CPV:
here,
g refers to gas types including CO
2, SO
2, NO
X and PM
2.5 in this research. And
e refers to the emission factors. For EV, it includes the emission factors of primary energy resources’ exploitation (
eexp,i,g), transportation (
etran,i,g), and generation (
egen,i,g). For CPV, it includes the emission factors of crude oil exploration (
eR,g) and transportation (
eT,g) as well as the petrol’s combustion (
ec,g). For the value of the parameter, please see the article of Reference [
37].
Furthermore, the existence of ridesharing service is likely to reduce the demand for vehicles and then the total amount of cars in the society [
41]. Correspondingly, this change will lead the decline of energy consumption and emissions (CO
2 and air pollutant emissions) during the processes of vehicle manufacturing, transportation and disposal. This research defines this impact as “indirect impact”. Based on the input–output analysis, the impact can be calculated as follows [
42,
43,
44]:
Assuming there are n sectors in the economy, the basic linear equations of this system are:
where
X = (
xi) denotes the industrial output vector with
xi representing the output of sector
i,
Y = (
yi) denotes the final demand vector with
yi representing final consumption in sector
i,
A is the input coefficient matrix, and
L is the Leontief inverse matrix of
A,
L = (
I −
A)
−1.
Let
E = (
eik) be the final energy intensity matrix and
be the emission coefficient vector, with k being the energy type. Accordingly, the total energy-related emissions can be written as follows:
and the change of ridesharing users’ willingness to buy new cars or to replace old cars will lead to output change
LΔ
V, thereby resulting in a change in total emissions:
3.2. Empirical Study Target
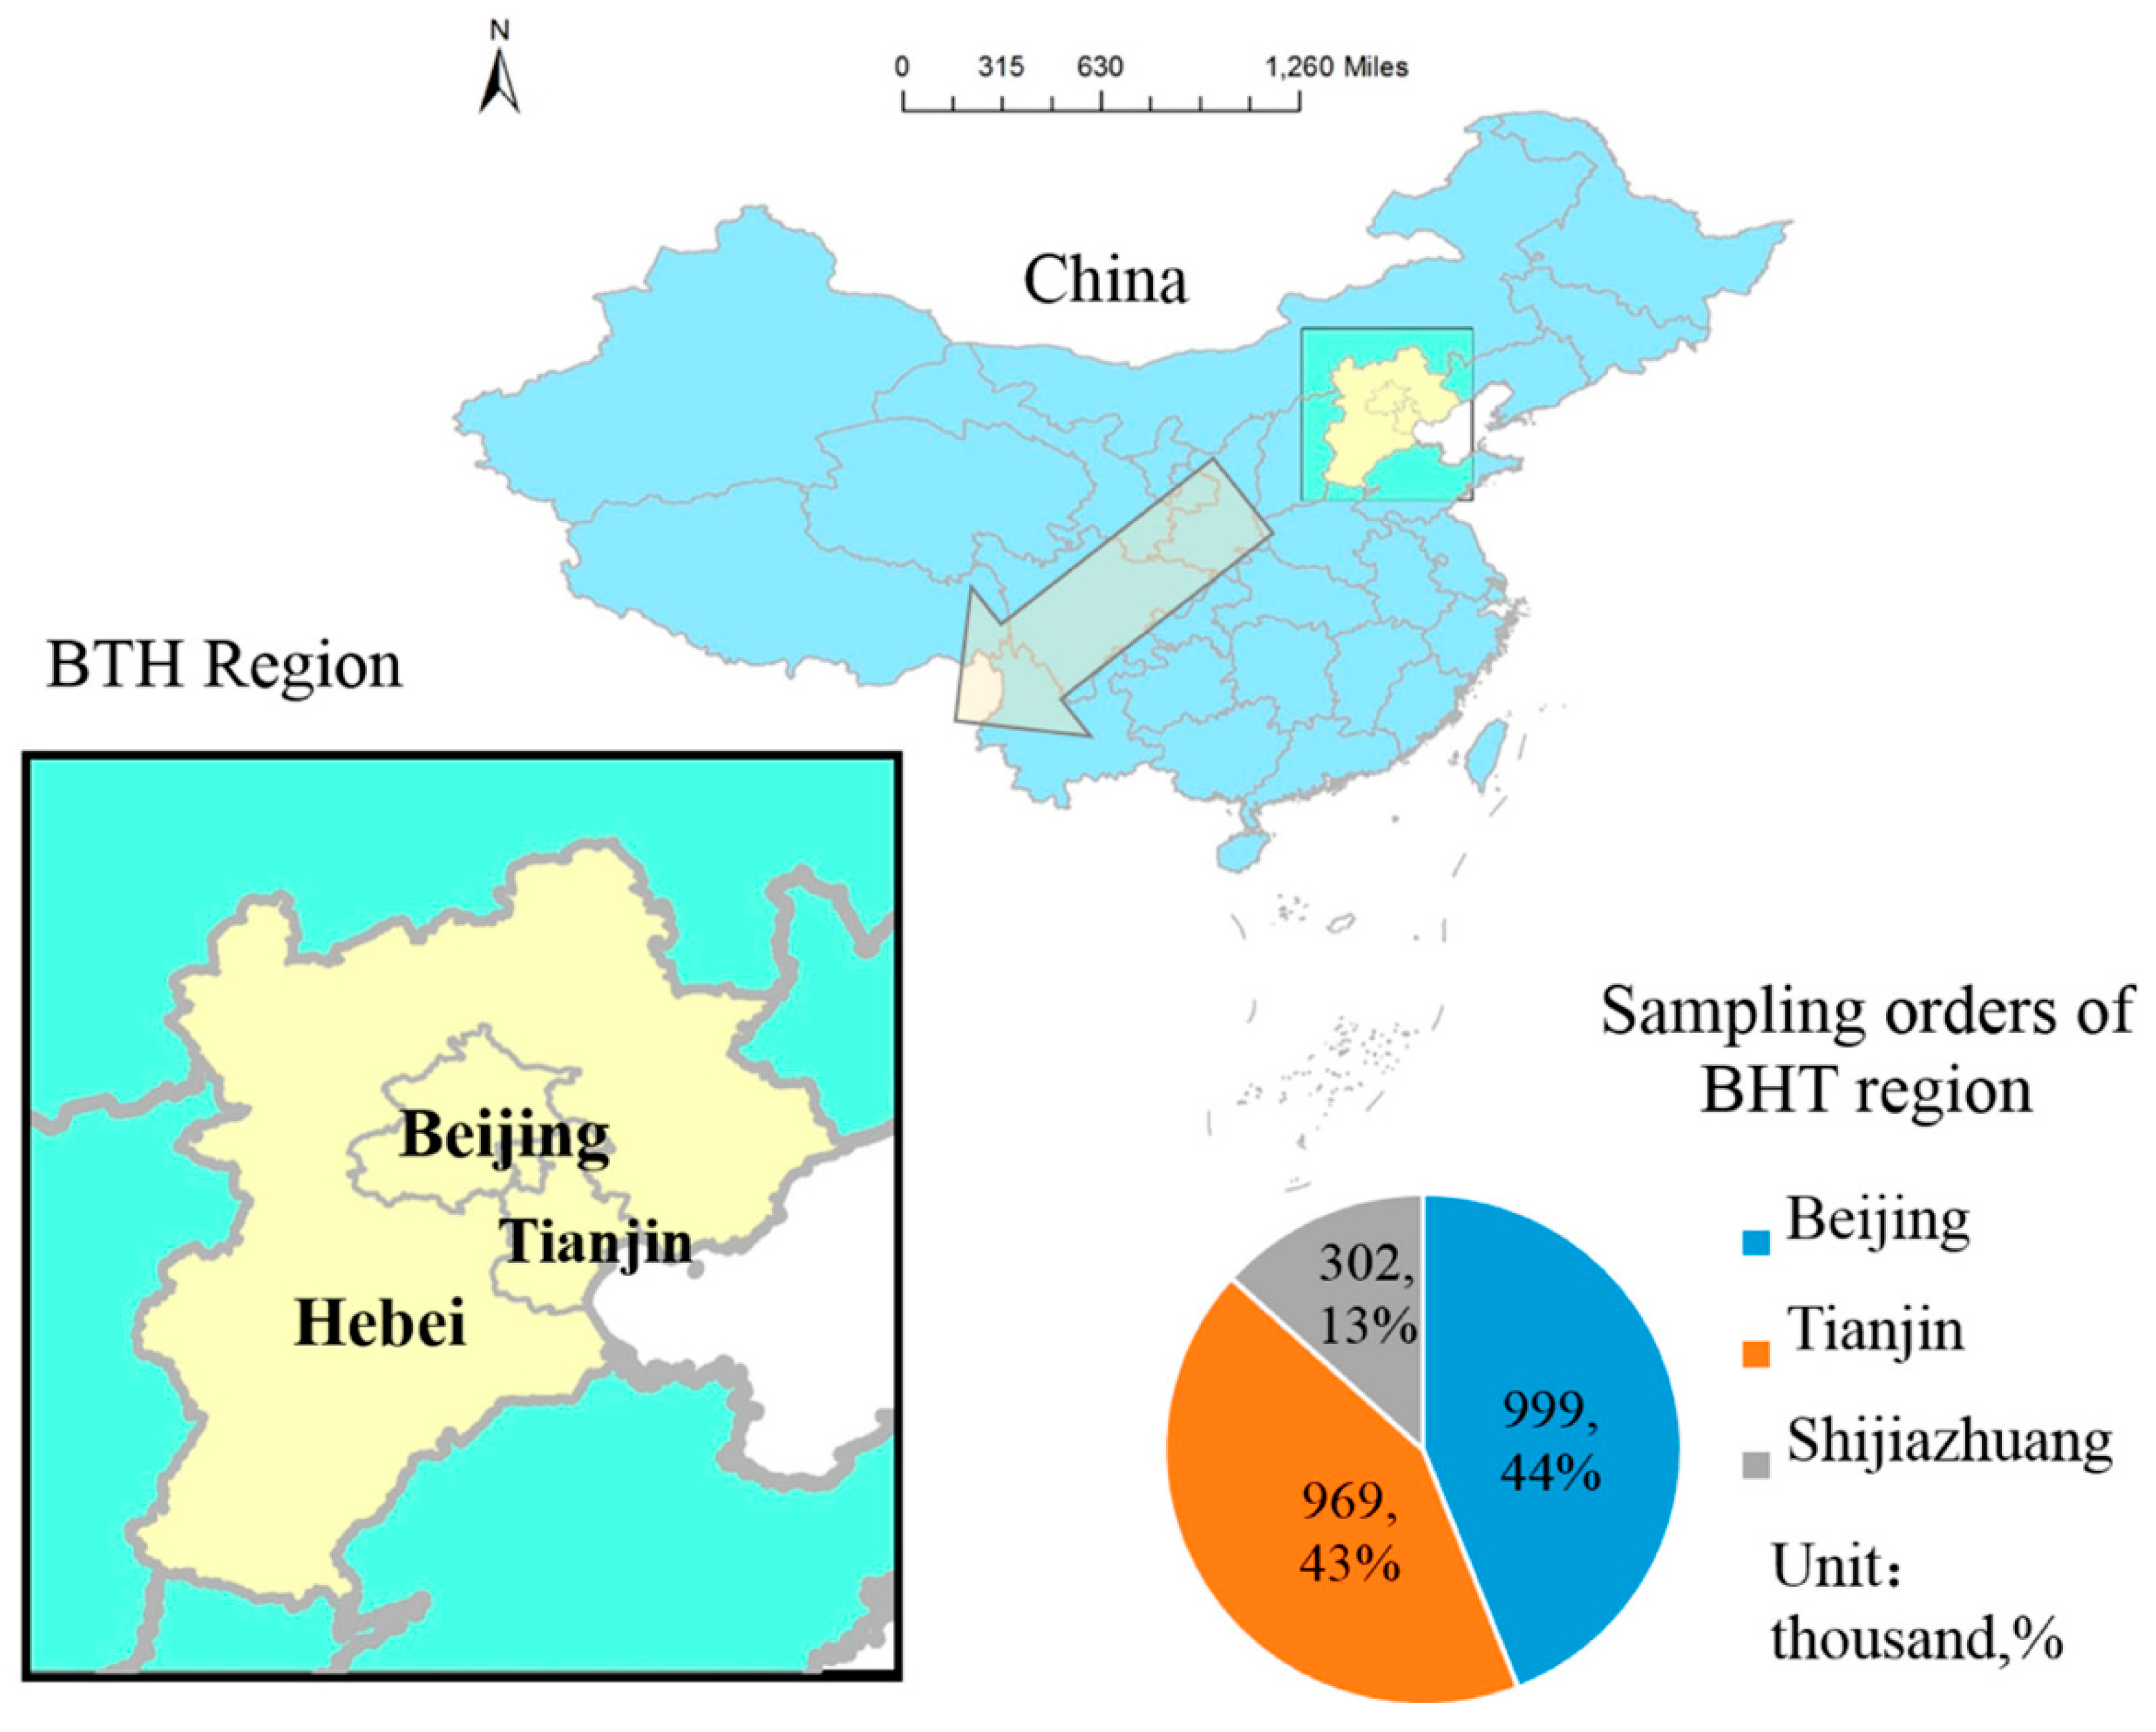
Based on the research methods developed above, we choose Beijing–Tianjin–Hebei (BTH) region as our empirical target. It is located in northern China and includes two municipalities (Beijing and Tianjin) and one province (Hebei), see
Figure 2. It is positioned as an essential region to enhance national competitiveness, a critical population, and economic concentration area and simultaneously one of China’s major traffic hubs. However, this region is confronted with some problems of disparate development. Beijing is by far the most important and dominant city in all aspects, while other cities in the area, excluding Tianjin, are mostly unknown and insignificant on an economic level. According to the National Bureau of Statistics of China in 2016 (
Table 1), the GDP of Beijing was at 2.5 trillion RMB, followed by Tianjin and Shijiazhuang.
Furthermore, BTH owns 3.6% of the nationwide automobile in 2016, among which the ownership is 5.7 million in Beijing, 2.3 million in Tianjin and 1.4 in Shijiazhuang (the capital city of Hebei province) [
45]. When it comes to traffic infrastructure construction, Beijing’s average density of railway and highway is the highest, followed by Tianjin and Hebei province. At the same time, the proportion of car trips in urban centers is high, which makes air pollution the most severe environmental problem within the region, especially causing a substantial economic loss in Beijing [
46].
Actually, for the reason that BTH is aiming to achieve regional integration development, it indeed derives a lot of attention to regional homogeneity and heterogeneity. However, the regional research of ridesharing in BTH region in China are few. And the existing studies focusing on BTH region’s spatial heterogeneity are merely covering topics about the regional development status [
47] and regional spatial structure [
48], while some research pays attention to the traffic demand due to the more frequent internal and external connections between different these cities [
49]. Moreover, apart from several scientific papers on ridesharing with the topic about app-based dynamic ridesharing services abroad [
50,
51], correlational research about the “Internet + transportation” as well as the intraregional difference caused by disparate development and type of cities in BTH region are also insufficient.
All these factors mentioned above could lead to spatial heterogeneity of various transportation demand and citizen’s travel choices among this region, which could further change the environmental impact on ridesharing services. Based on this, this section is aiming at introducing the dataset we applied, summarizing the characteristics of ridesharing travel pattern in BTH region and making a further inquiry of intraregional differences in different cities.
3.3. Data Collection
In this research, our data composes of operation data of ridesharing as well as survey data. We firstly dig into ridesharing order data and summaries the regional heterogeneity of travel characteristics of this services, from aspects of orders’ distribution features, service time and distance, and so on. Then we use the survey result to value the customer’s behavioral preference of ridesharing.
In the aspect of trip data, we applied the data from DiDi Chuxing. We randomly extracted sampling orders during in January, March, and May in 2016. In total, approximately 2.3 million ridesharing trips are included in this research, covering 24 h in 93 days in Beijing, Tianjin, and Shijiazhuang to summarize the regional characteristics of travel pattern and get some information to support the evaluation of environmental impact. The big sample data offer us sufficient evidence to precisely reveal the research result.
Moreover, based on the sampling trip data of ridesharing and survey results, the environmental impact could be calculated. Besides, the total VKT data for all trips is also taken into consideration, which is disaggregated by hours and days in January to May in 2016.
In the aspect of survey data, in order to comprehensively estimate the environmental impacts of ridesharing service, it is necessary to know users’ alternative travel mode and private car’s purchase willingness change if ridesharing has high accessibility in the future. To that end, a phone-based questionnaire survey (25 questions) is conducted via the platform of DiDi Chuxing. Aiming at the active users of ridesharing service as respondents, this survey was carried out on a weekday in June 2016. In total, 1938 valid questionnaires were collected with 42.3% of Beijing, 36.6% of Tianjin and 21.1% of Shijiazhuang.
In our survey, we asked some questions about respondents’ overall shift of original travel mode to car sharing services and the possible change of their vehicle purchase behavior if car sharing is always available. Then, other inquiries are about respondents’ car ownership and demographic information. These questions could help us to estimate the environmental impact.
Then, to understand the characteristic of DiDi Chuxing users’ travel pattern, it is relevant to acquire the demographics of the sampling population. In this survey, we firstly offer some questions about respondents’ basic information, which is summarized in
Table 2. As is shown in this table, the demographic characteristics of ridesharing users are diverse and the users who are relatively younger but have a slightly higher level of education. The highest acquired education level concentrated on college or associates degree for ridesharing users [
52]. Also, it was found to be much higher, relative to China as a whole. Based on the statistical data of 2010, about 8.98% of all Chinese citizens had a college or associates degree, whereas more than 50% of ridesharing members had a college or associates degree or higher in Beijing, followed by Tianjin and Shijiazhuang [
53]. Then, the income level of members suggests that although ridesharing has mostly served the middle class, nearly 90% of the population had an income of ¥50,000 or higher [
54]. Comparing with Tianjin and Shijiazhuang, the income level of Beijing’s DiDi Chuxing users is a little higher, especially in the group of ¥250,000–¥300,000 and above, which means that high-income groups of people possess a stronger willingness to choose sharing model of travel.
When it comes to residential places, the characteristics of these three cities are different. More than 70% of Beijing’s respondents are living in the suburban district of the city, but for Tianjin and Shijiazhuang respondents, the ratio is not so disparate. This indicated that DiDi Chuxing’s ridesharing travel demand is dominant in Beijing’s suburb area, which may result in the fast expansion of Beijing’s city scale as well as the separation of urban functional areas [
37]. On the contrary, there are no significant differences between the urban center or central business district (CBD) and suburb area in Tianjin and Shijiazhuang, although the central area’s travel demand is a little bit larger. It suggests that Tianjin and Shijiazhuang have a relatively steady travel demand between urban and rural area. At the same time, DIDI’s ridesharing service could be complementary of transportation shortage between urban and rural area.
Finally, we also want to find out the demographic composition of the family.
Table 2 shows that in BTH region, and demographic distinctions between the cities are small. They exhibit that couple and two-generation family rank top 2 among all types of family, which suggests that the scale of users’ family tends to be small and young.
4. Travel Pattern Characteristics of Ridesharing in Beijing–Tianjin–Hebei
4.1. Distribution of Ridesharing Trips
Based on trip data, some temporal and spatial distribution features of the sampled ridesharing trips across 24 h and a week in BTH region could be found cumulatively and averagely. The data in holidays like the Spring Festival have been eliminated, in order to prevent outliers distorts the average standard of the order distribution.
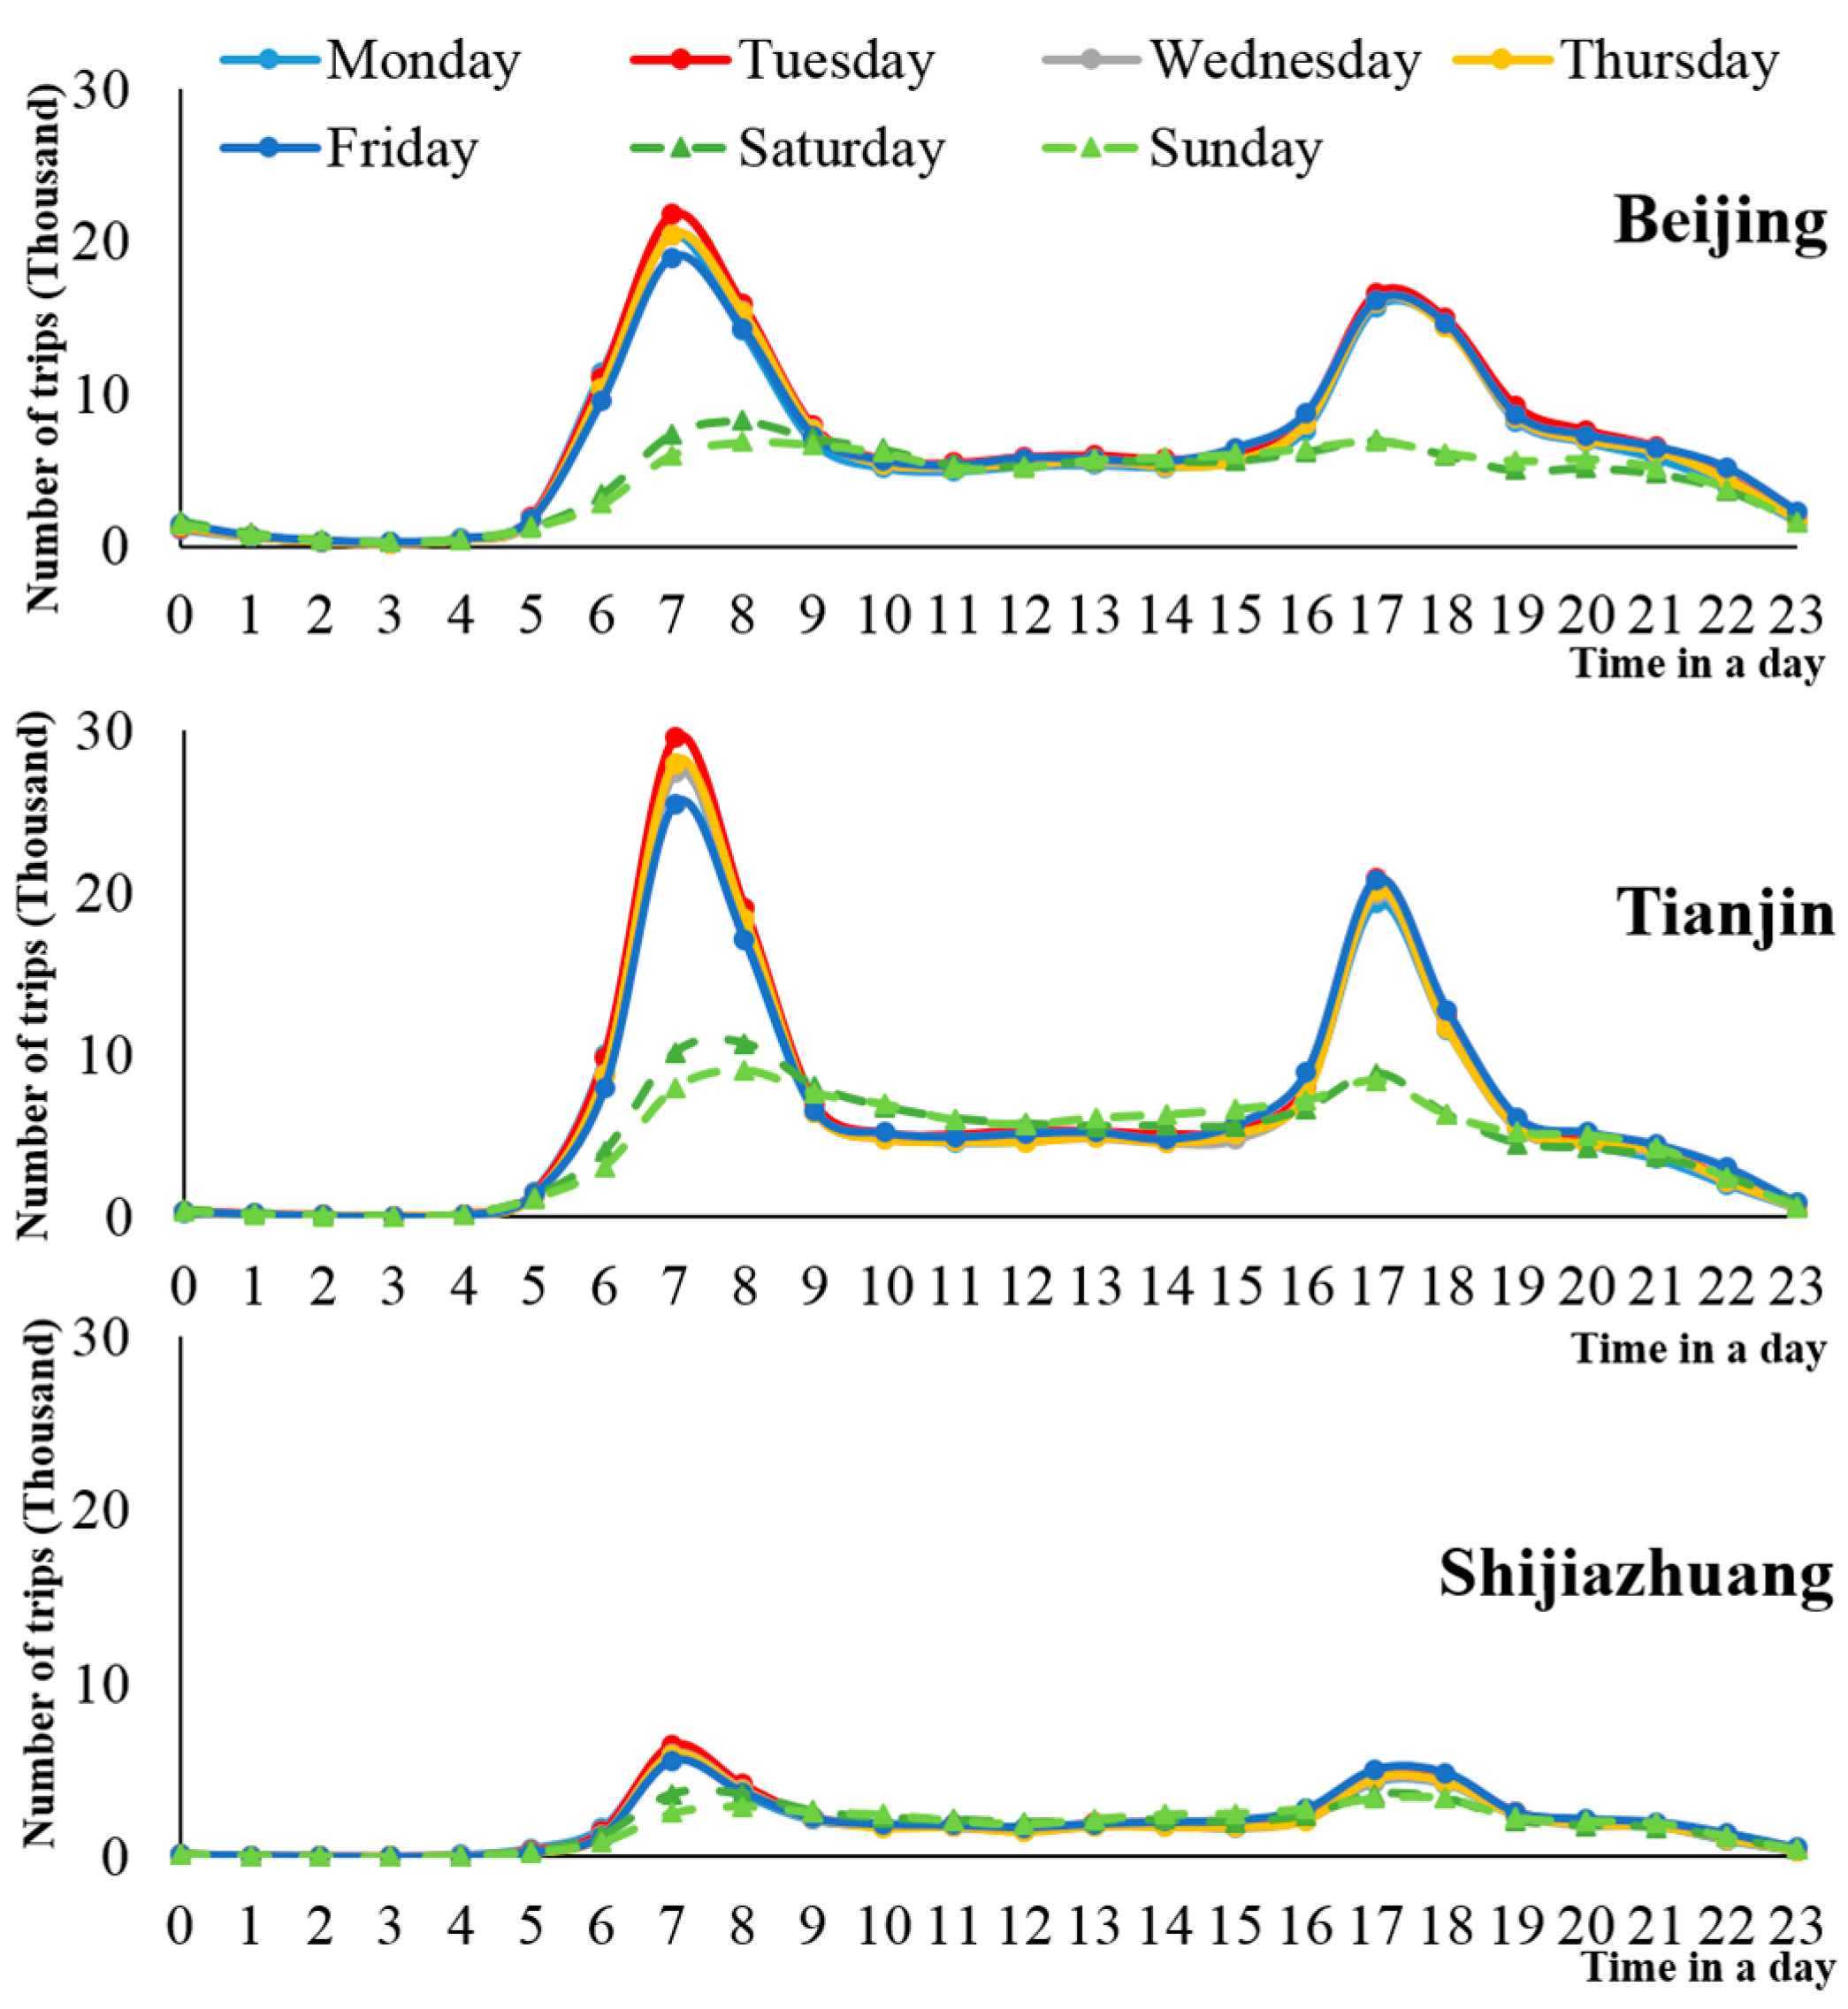
Figure 3 shows that for the commute trip on weekdays, there are apparent mornings (6:00–9:00) and evening peaks (16:00–19:00). In Beijing and Tianjin, the number of working days far exceeds the weekend, and the heterogeneity of Shijiazhuang’s workdays and weekend trips is not significant. This implies that ridesharing service is mainly used for daily commuting [
37,
55,
56]. Besides the daily commuting, the purpose of Shijiazhuang’s trips remains to be revealed.
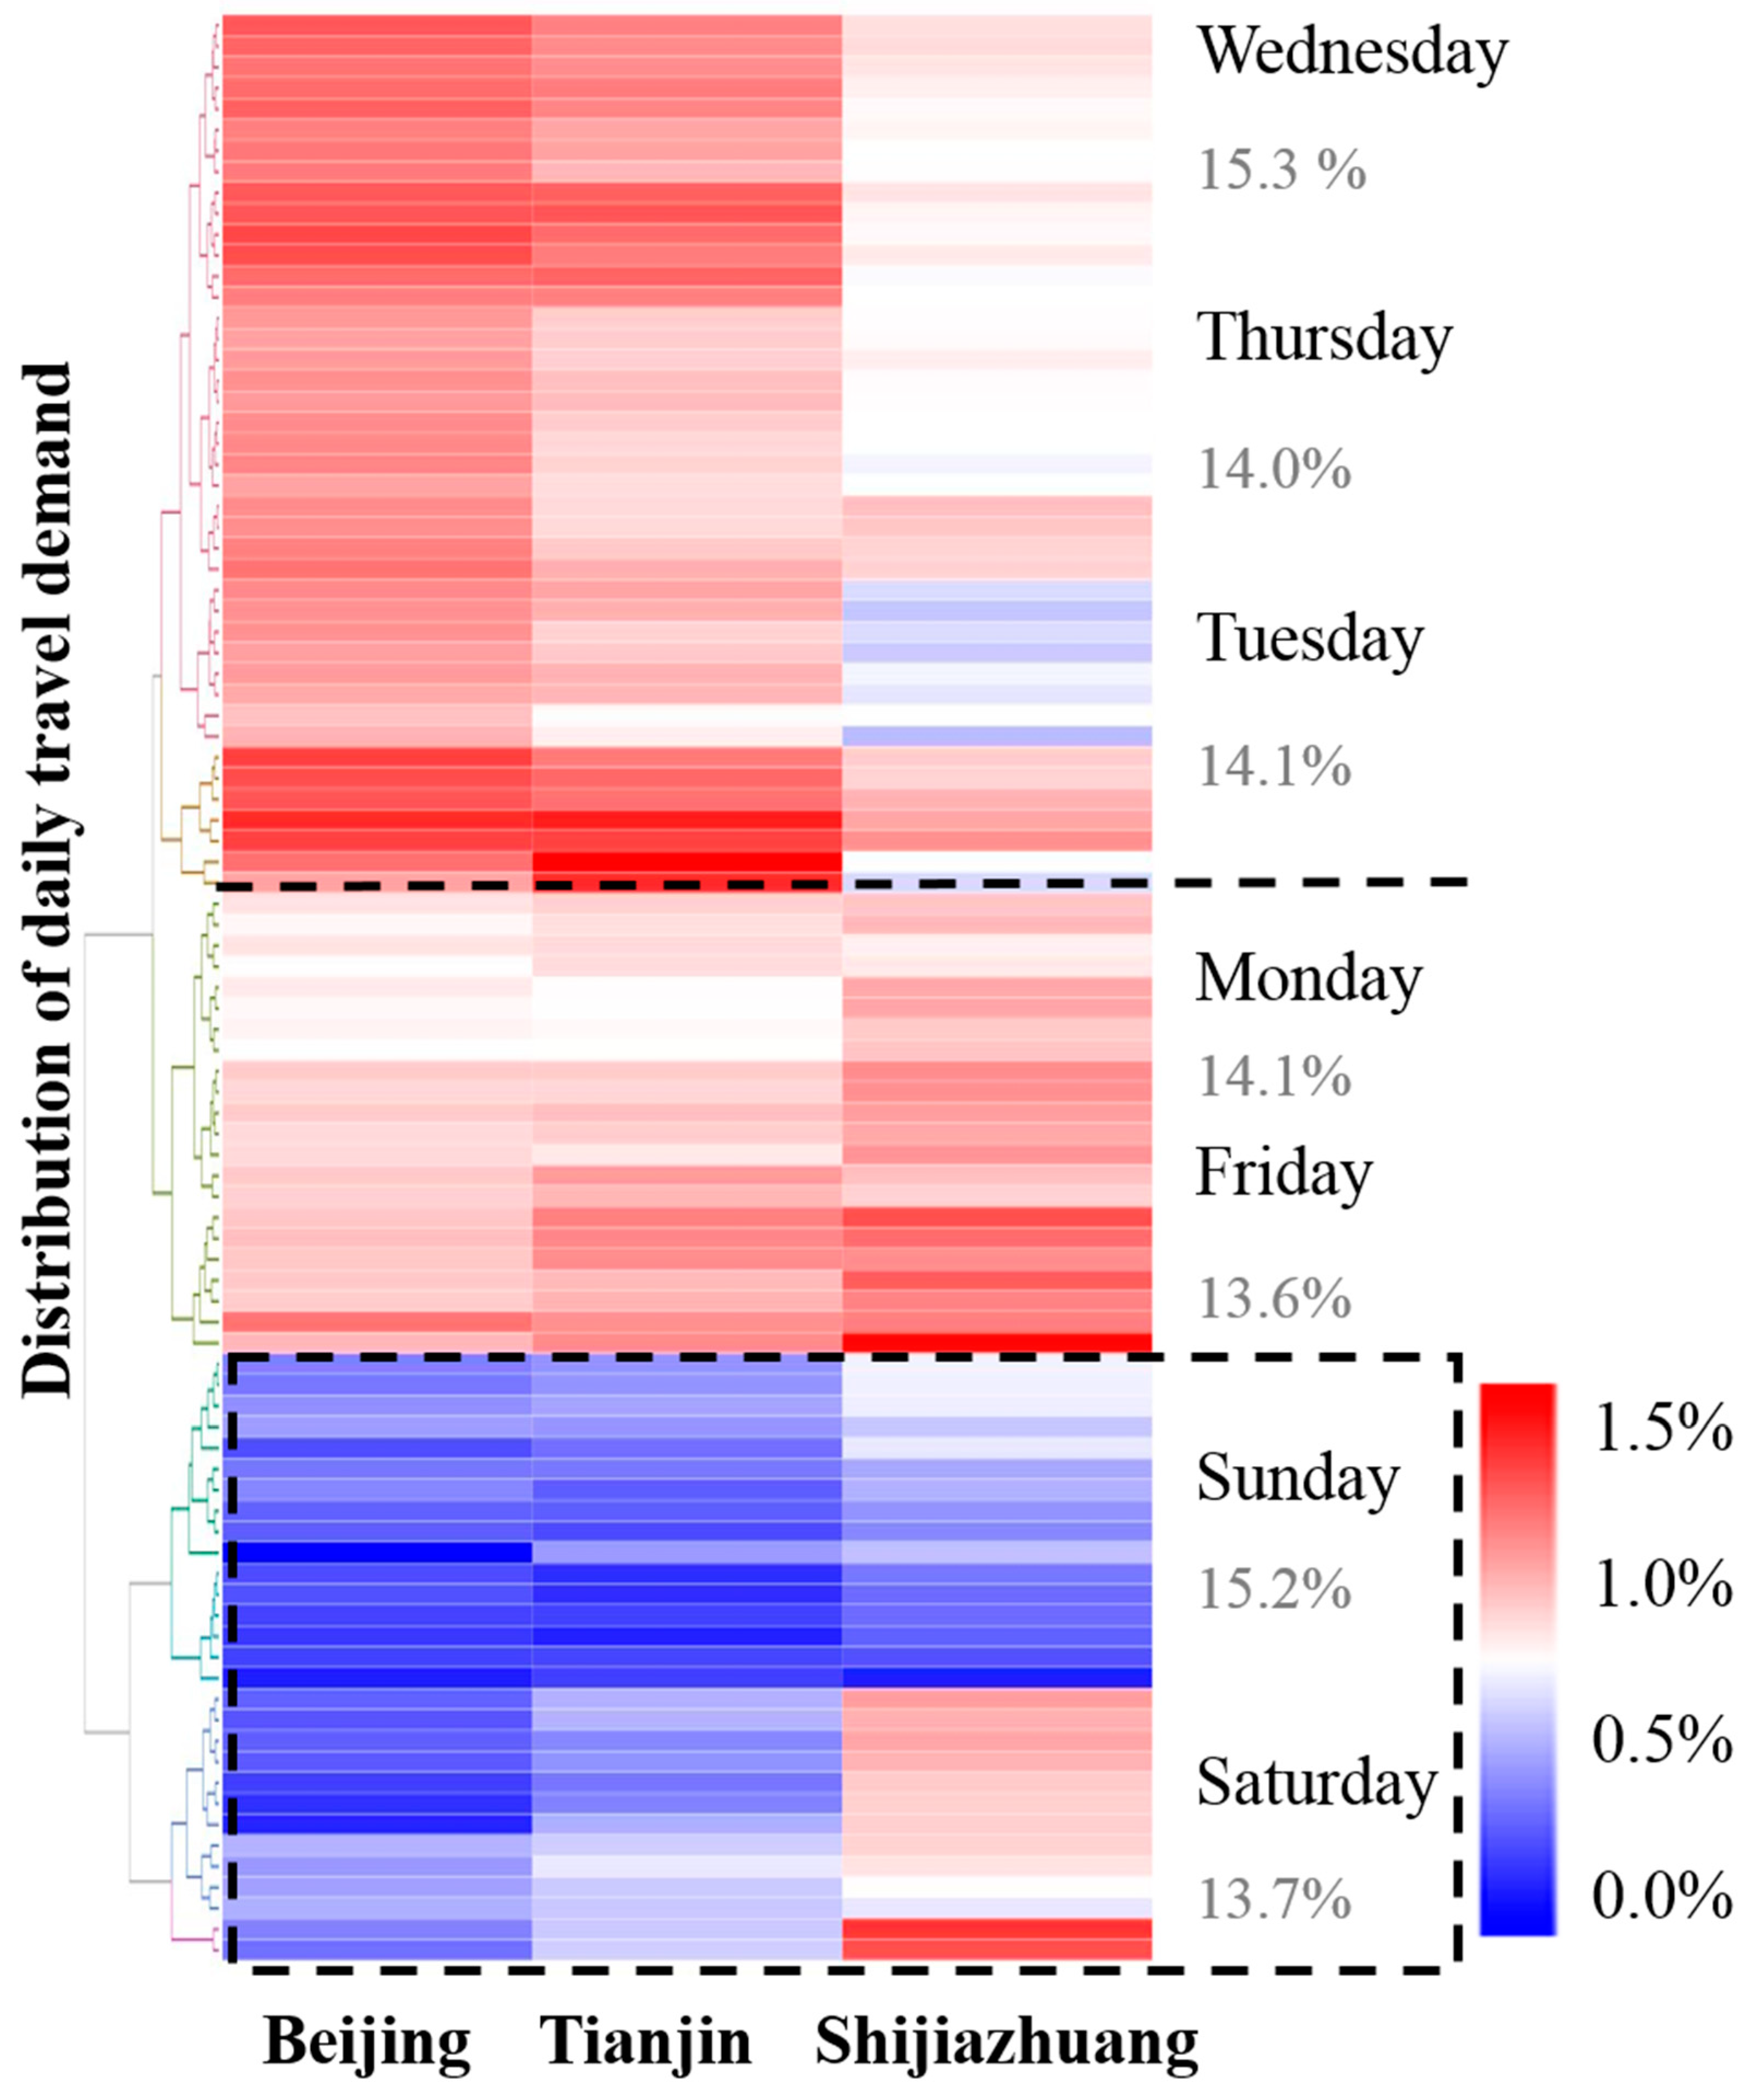
In order to reveal the otherness of trip demand, we aggregate hourly trip share by the Hierarchical Methods, a method of cluster analysis by distance matrix [
57]. It can be seen that the distribution of DIDI’s daily travel demand in BTH region contains two categories, including weekday and weekend (
Figure 4). Moreover, the category of the weekend is distinguished from other subcategories because the travel demand is relatively small. This could illustrate that ridesharing services mainly satisfied the travel demand in peak hours and weekdays, especially in Beijing and Tianjin. Then, we can find that the order’s distribution in Shijiazhuang is more balanced than that of Beijing and Tianjin. Also, the order’s distribution at peak hours is more leptokurtic than the other two cities for weekdays in Tianjin. The peak hours of Tuesday, Wednesday and Thursday are more distinct, which induces these three days into the same subcategory, while the distribution characteristics of Monday and Friday tend to be same for the travel demand is relatively small.
4.2. Order Features of Ridesharing
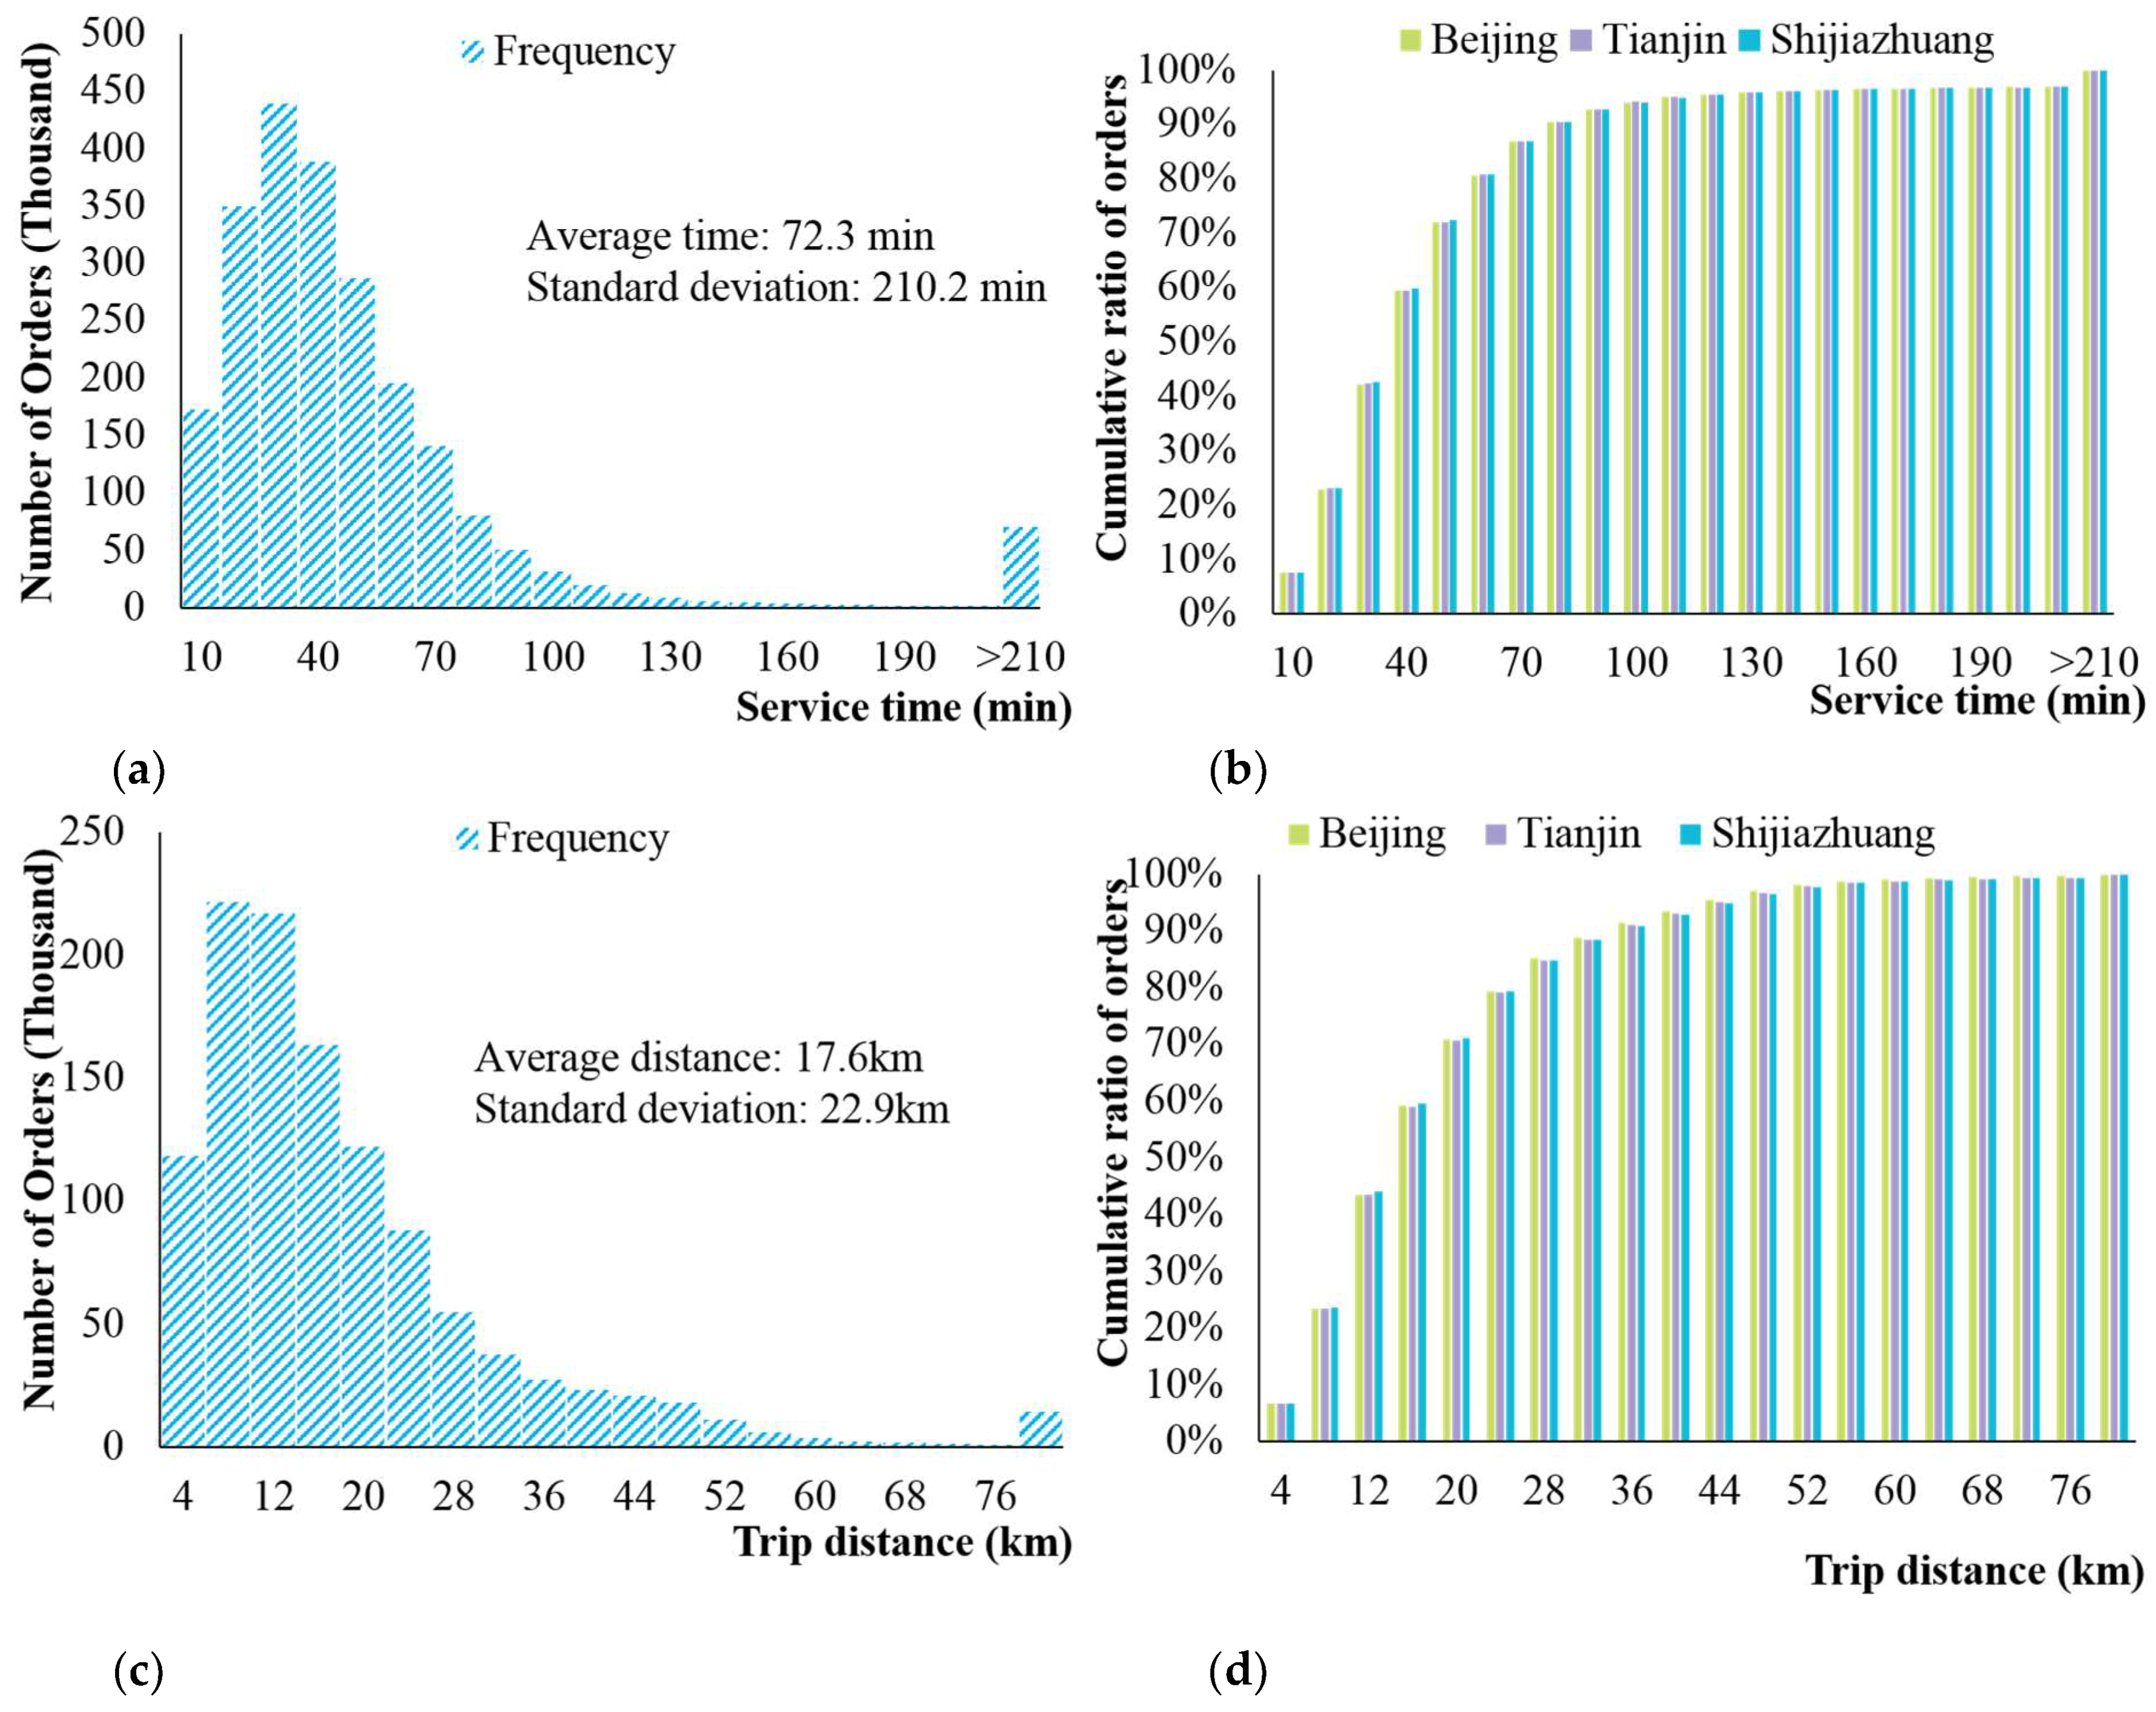
Figure 5 shows the homogeneity features of sampling order’s service time and distance. Overall, the distribution characteristics of services time and trip distance of ridesharing are almost convergent, which indicates that ridesharing features on these two aspects are not significantly influenced by the developing level of an area.
Figure 5a,b shows that the average ridesharing trip service time is approximately 72.3 min in BTH region with around 41% ridesharing trip service time being longer than 40 min. Based on related research, the average commuting time for the residential in the north China is around 40 min, which indicates that ridesharing could be a convenient choice for solving the longtime travel demand shortage of urban residents.
Then,
Figure 5c,d illustrate that the average ridesharing trip distance is approximately 17.6 km in BTH region with the most constant ridesharing trip distance ranging between 8 km to 14 km. Overall, more than 66% of trips are longer than 10 km, suggesting ridesharing service mainly help to meet the demand for mid- and long-length trips in BTH region.
4.3. Traveling Reason and Purpose of Users
In order to reveal customer’s behavioral preference and get a better understanding of the determinants of the consumers’ intention to use ridesharing services [
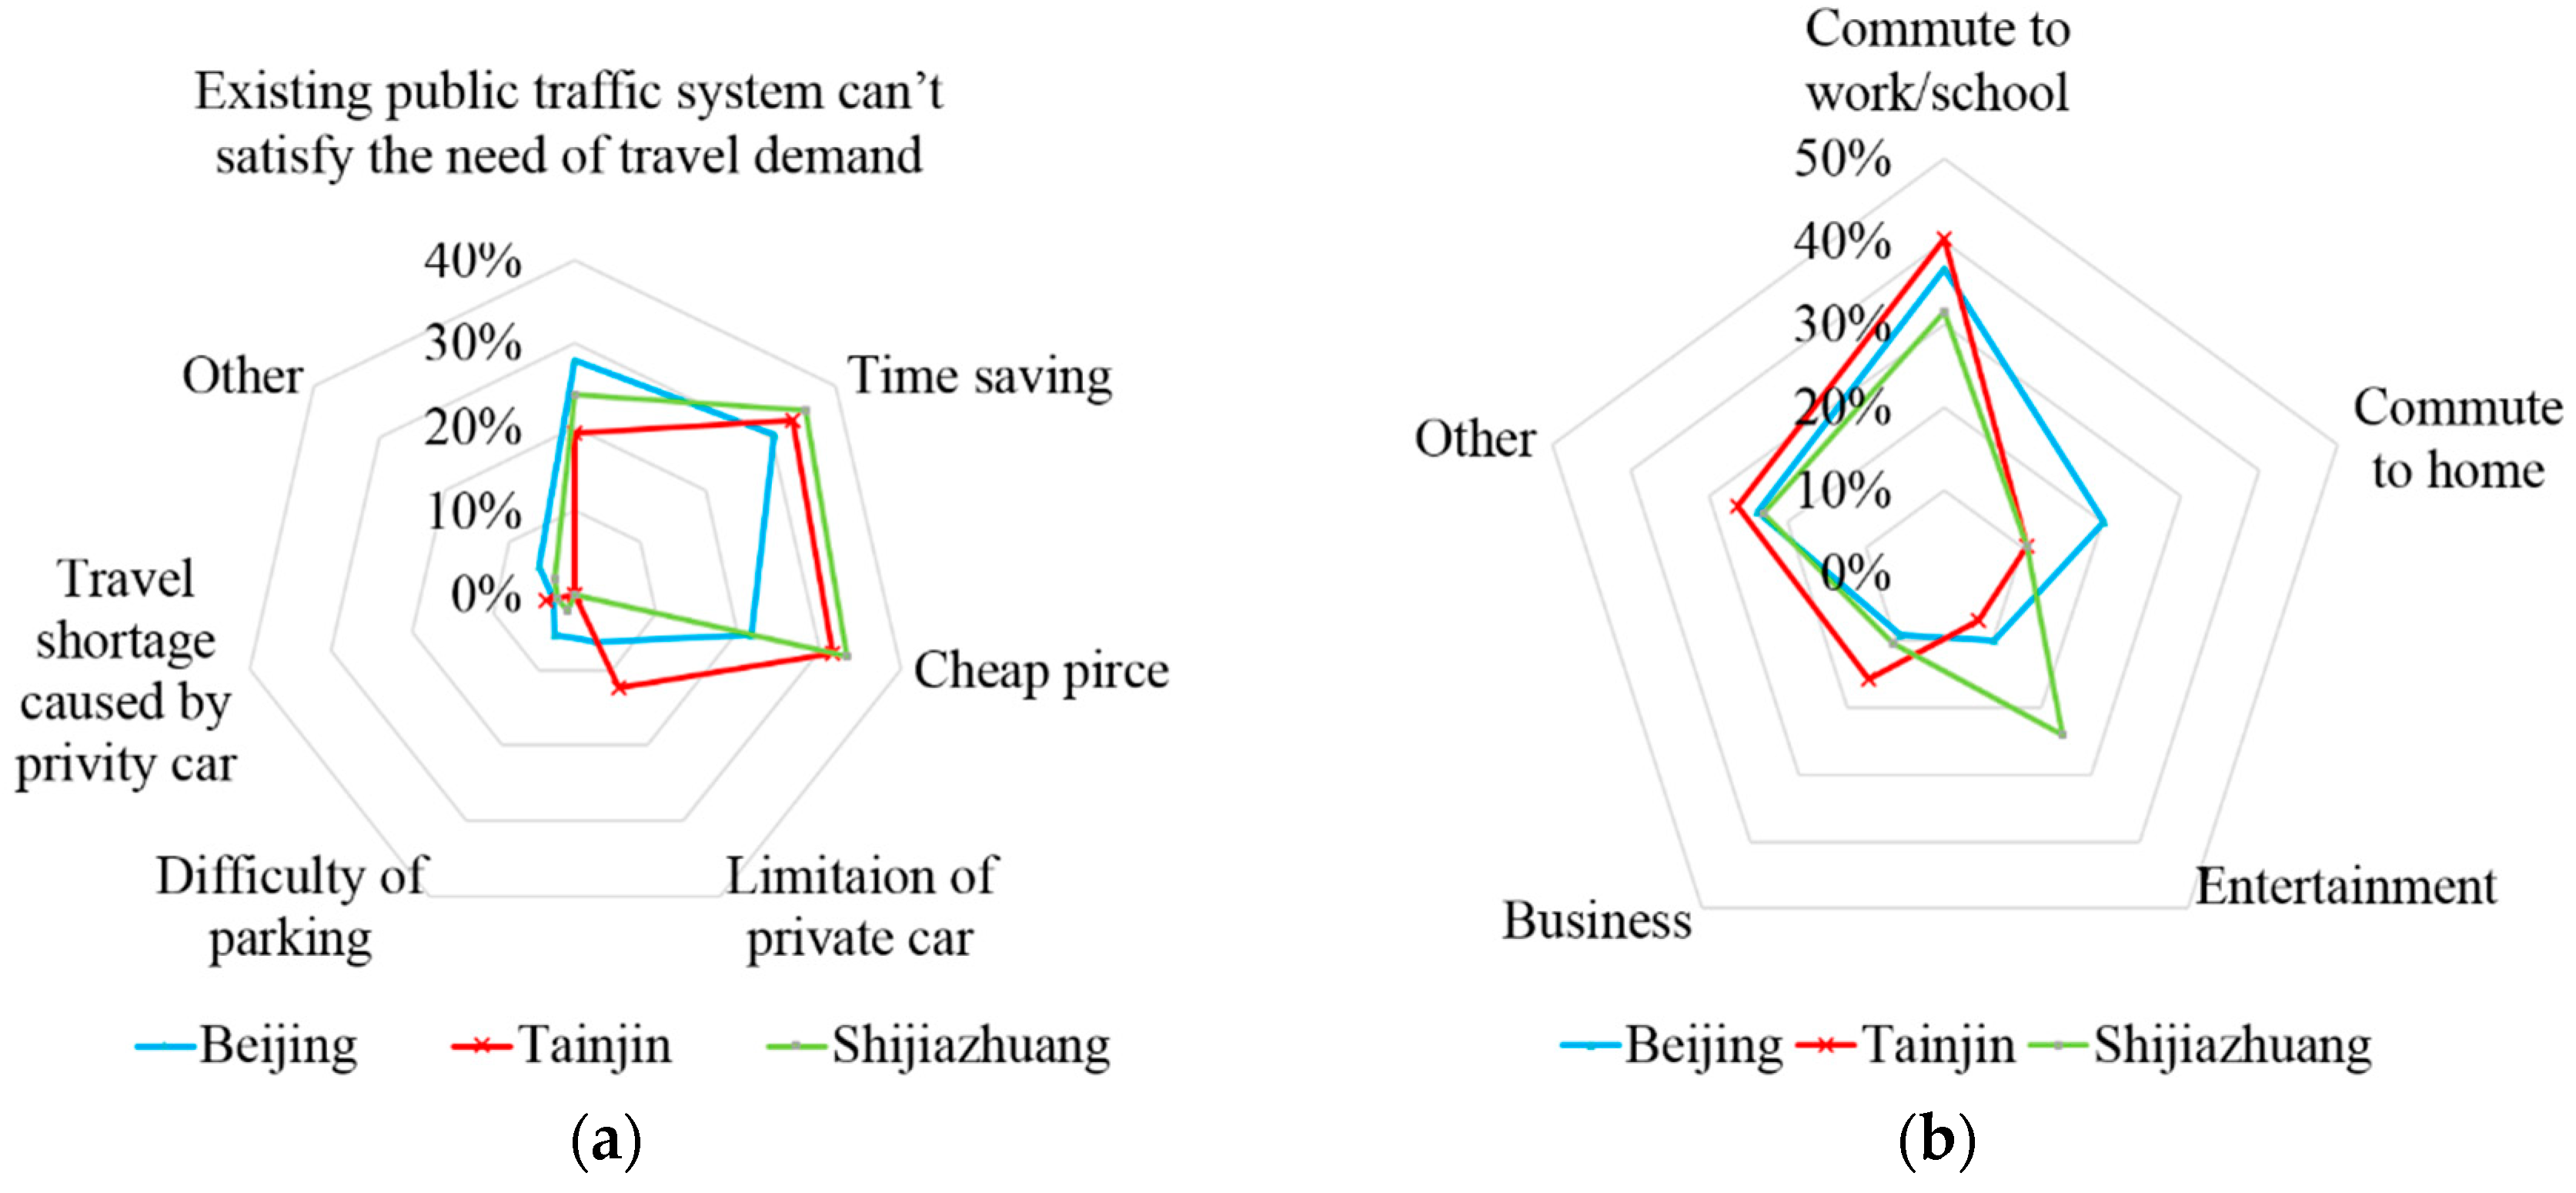
58]. This section explores the reason and purpose that users choose ridesharing service. And the result illustrates that around 33% of people in BTH consider time-saving is the most important reason which influences their choice in BTH region, see
Figure 6a. Trip cost of ridesharing service is the second significant reason in Tianjin and Shijiazhuang, while is the third significant reason in Beijing, which means that the existing charging policy of ridesharing is competitive among all travel modes. The shortage of public transport capacity is also an essential reason for ridesharing users, especially for them in Beijing, which suggests that there is a substitutional relation between public traffic system and ridesharing services. Combining with
Figure 7a, this substitutional relation could be more intense in peak hours.
Apart from the motivation, the traveling purpose of users is also an essential characteristic of ridesharing. As
Figure 6b shown, commuting to work or school is the primary purpose of ridesharing in BTH region. Taking the proportion of commuting to home into consideration, ridesharing service has played a significant role in people’s daily commuting, which is an excellent supplement of public transportation. The entertainment and business are also some specific purposes for using the DIDI ridesharing service. To be specific, 16% of Tianjin’s ridesharing users use this service to satisfy their business travel demand, which could be commercially oriented. 24% of Shijiazhuang’s ridesharing users is for entertainment travel demand, which could be relaxation-oriented. This presents unique inner differences within this entire area.
4.4. Origin–Destination Analysis
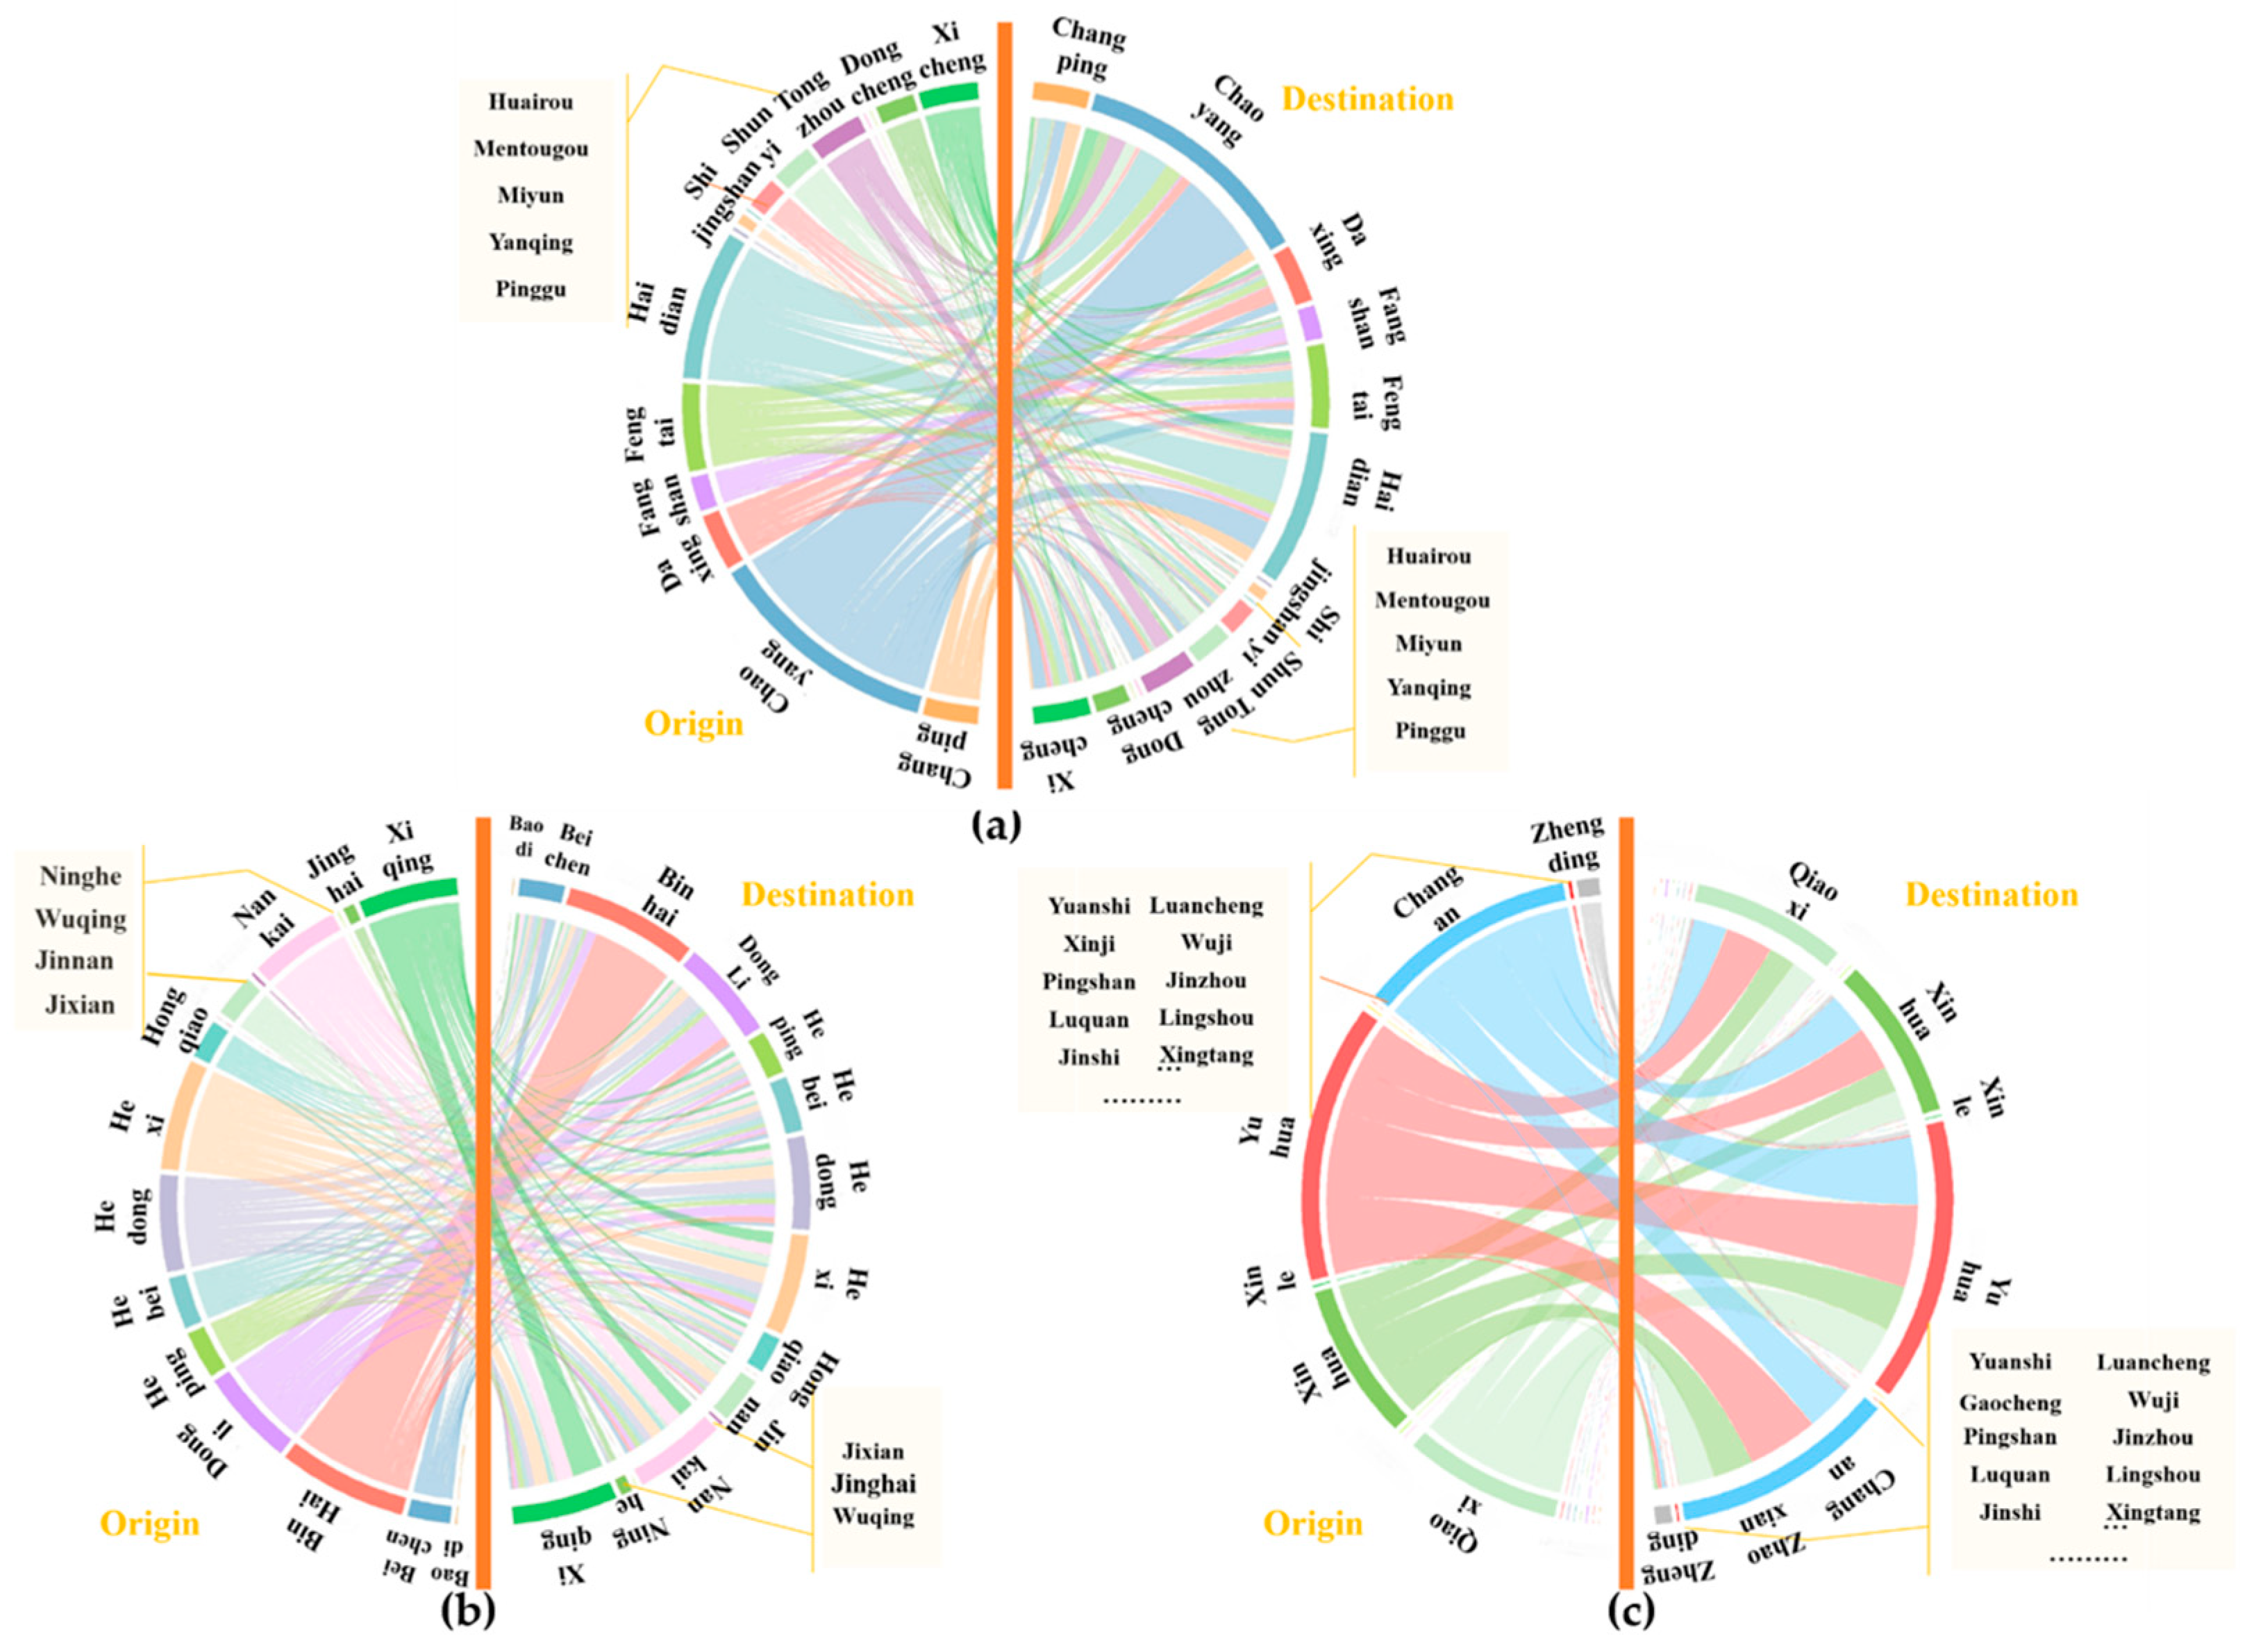
Figure 7a shows the trip demand within and between districts in Beijing, which is centralized on macroscopical scale. Based on Beijing’s main functional area planning by the government, Beijing’s districts have been divided into four categories which are the Capital Core Zone, the Expanded Functional Zone, the New Developing Zone and the Ecological Conservation Zone. The travel demand could reflect the functional zone in a certain way. Generally speaking, the amounts of service’s origin and destination are unbalanced in Beijing. We can find that ridesharing trip demand mainly gathers in the Capital Core Zone and the Expanded Functional Zone like Chaoyang, Haidian, Xicheng and Dongcheng with approximately half of the ridesharing trips starting and ending within the same district. While the trips whose destinations are outside the departing districts dominate in the Expanded Functional Zone like Changping, Daxing, and Tongzhou districts, account for limited portion in total orders. These districts themselves are not pure functional centers in the certain areas and generates more travel demand for other districts. Then, for the Ecological Conservation Zones like Yanqing, Miyun, Huairou and Pinggu, the total order’s number is limited neither origin or destination, which means a relative little travel demand in these areas. Moreover, this figure clearly displays where the ridesharing trips come from and where to go, which further identifies the key areas in which existing transport facilities do not meet demand. Therefore, as it suggests, the travel demand of ridesharing is in accordance with the functional planning of a city. In central functional center, there is some transportation shortage within the center district. Besides, ridesharing could also satisfy some transportation shortage between center districts and surrounding districts. This can help the government design area-specific traffic management schemes.
Figure 7b shows the trip demand within and between districts in Tianjin. Tianjin’s central districts are more concentrated than Beijing which further shows a more balanced travel demand of ridesharing demand. Apart from peripheral districts like Ninghe, Jixian, Jinghai, and Wuqing districts whose origin and destination are cross-regional, the amounts of service’s origin and destination are more balanced for other districts. Based on Tianjin’s city planning, there are ten districts in the core city zone. Nankai, Xiqing, Hedong, and Hexi districts belong to the core city zone and possess approximately 40% of the ridesharing trips that start and end within the same district. Apart from these four districts, other districts like Heping, Hongqiao, and Dongli districts also share a considerable share of travel demand in a slightly less standard, which indicated a relative dispersive travel demand in central Tianjin. Then, Binhai districts are regarded as the high and new technology industrial development zone. Along with Binhai’s development, it has generated a large travel demand, though the demand of Binhai is mainly within itself, which further identifies existing transport facilities do not meet demand in this district, then traffic infrastructure should be updated, and more travel option should be offered. Along with the development of Binhai, there would generate more travel demand between itself and other central districts. As a municipality, the scale of Tianjin is smaller than Beijing, so does developing level, which further changes the demand feature of ridesharing demand.
Figure 7c shows the trip demand within and between districts in Shijiazhuang. Taking Beijing and Tianjin into consideration, the amounts of service’s origin and destination are extremely unbalanced in Shijiazhuang. The trips whose destinations are inside the departing districts dominate in Changan, Yuhua, Xinhua, and Qiaoxi districts, while the travel demand in outside districts is minimal. Based on Shijianzhuang’s city planning, these four districts are the most central areas in the city and possess significant functions in science, education, culture, governance, and health. Moreover, the area of these four districts accounts only 2.5% of Shijiazhuang while the population accounts for more than 25.8%. On the contrary, other districts are relatively less developed and cannot generate a lot of travel demand. Comparing with Beijing and Tianjin, Shijiazhuang is only the capital city of Hebei province with relatively simple and clear urban functional zone, and it illustrates that the travel demand of ridesharing in Shijiazhuang is unbalanced. According to its characteristics of travel demand, DIDI Chuxing may be promoted in surrounding districts and offer more services in central districts. Besides, Zhengding districts could be a breakthrough point, as it is regarded as the newly developing area of Shijiazhuang and has a lot of political benefits of transportation development.
Combined with the preceding context, the characteristic of ridesharing trip demand on an average day could be an aspect to reflect the developing level of different areas and urban function design. Furthermore, there is a significant polarization distribution of regional traffic demand within BTH region. As a super first-tier city, the travel demand in Beijing is much more than that in Shijiazhuang. Moreover, though the function division of Beijing is more complicated than other cities, the travel demand of ridesharing is centralized, especially in the Capital Core Zone and the Expanded Functional Zone. Comparing with Beijing, the travel demand features of Tianjin and Shijiazhuang are balanced and centralized. What’s more, the order’s distribution features vary with different districts, which indicated an unbalanced urban traffic development status in the BTH region. With this in mind, on the one hand, government policies and regulations should guide the balanced development of urban transportation. On the other hand, ridesharing could play a more significant role in the districts with high transportation supply and demand.
4.5. Environmental Impact and Guest Number per Unit
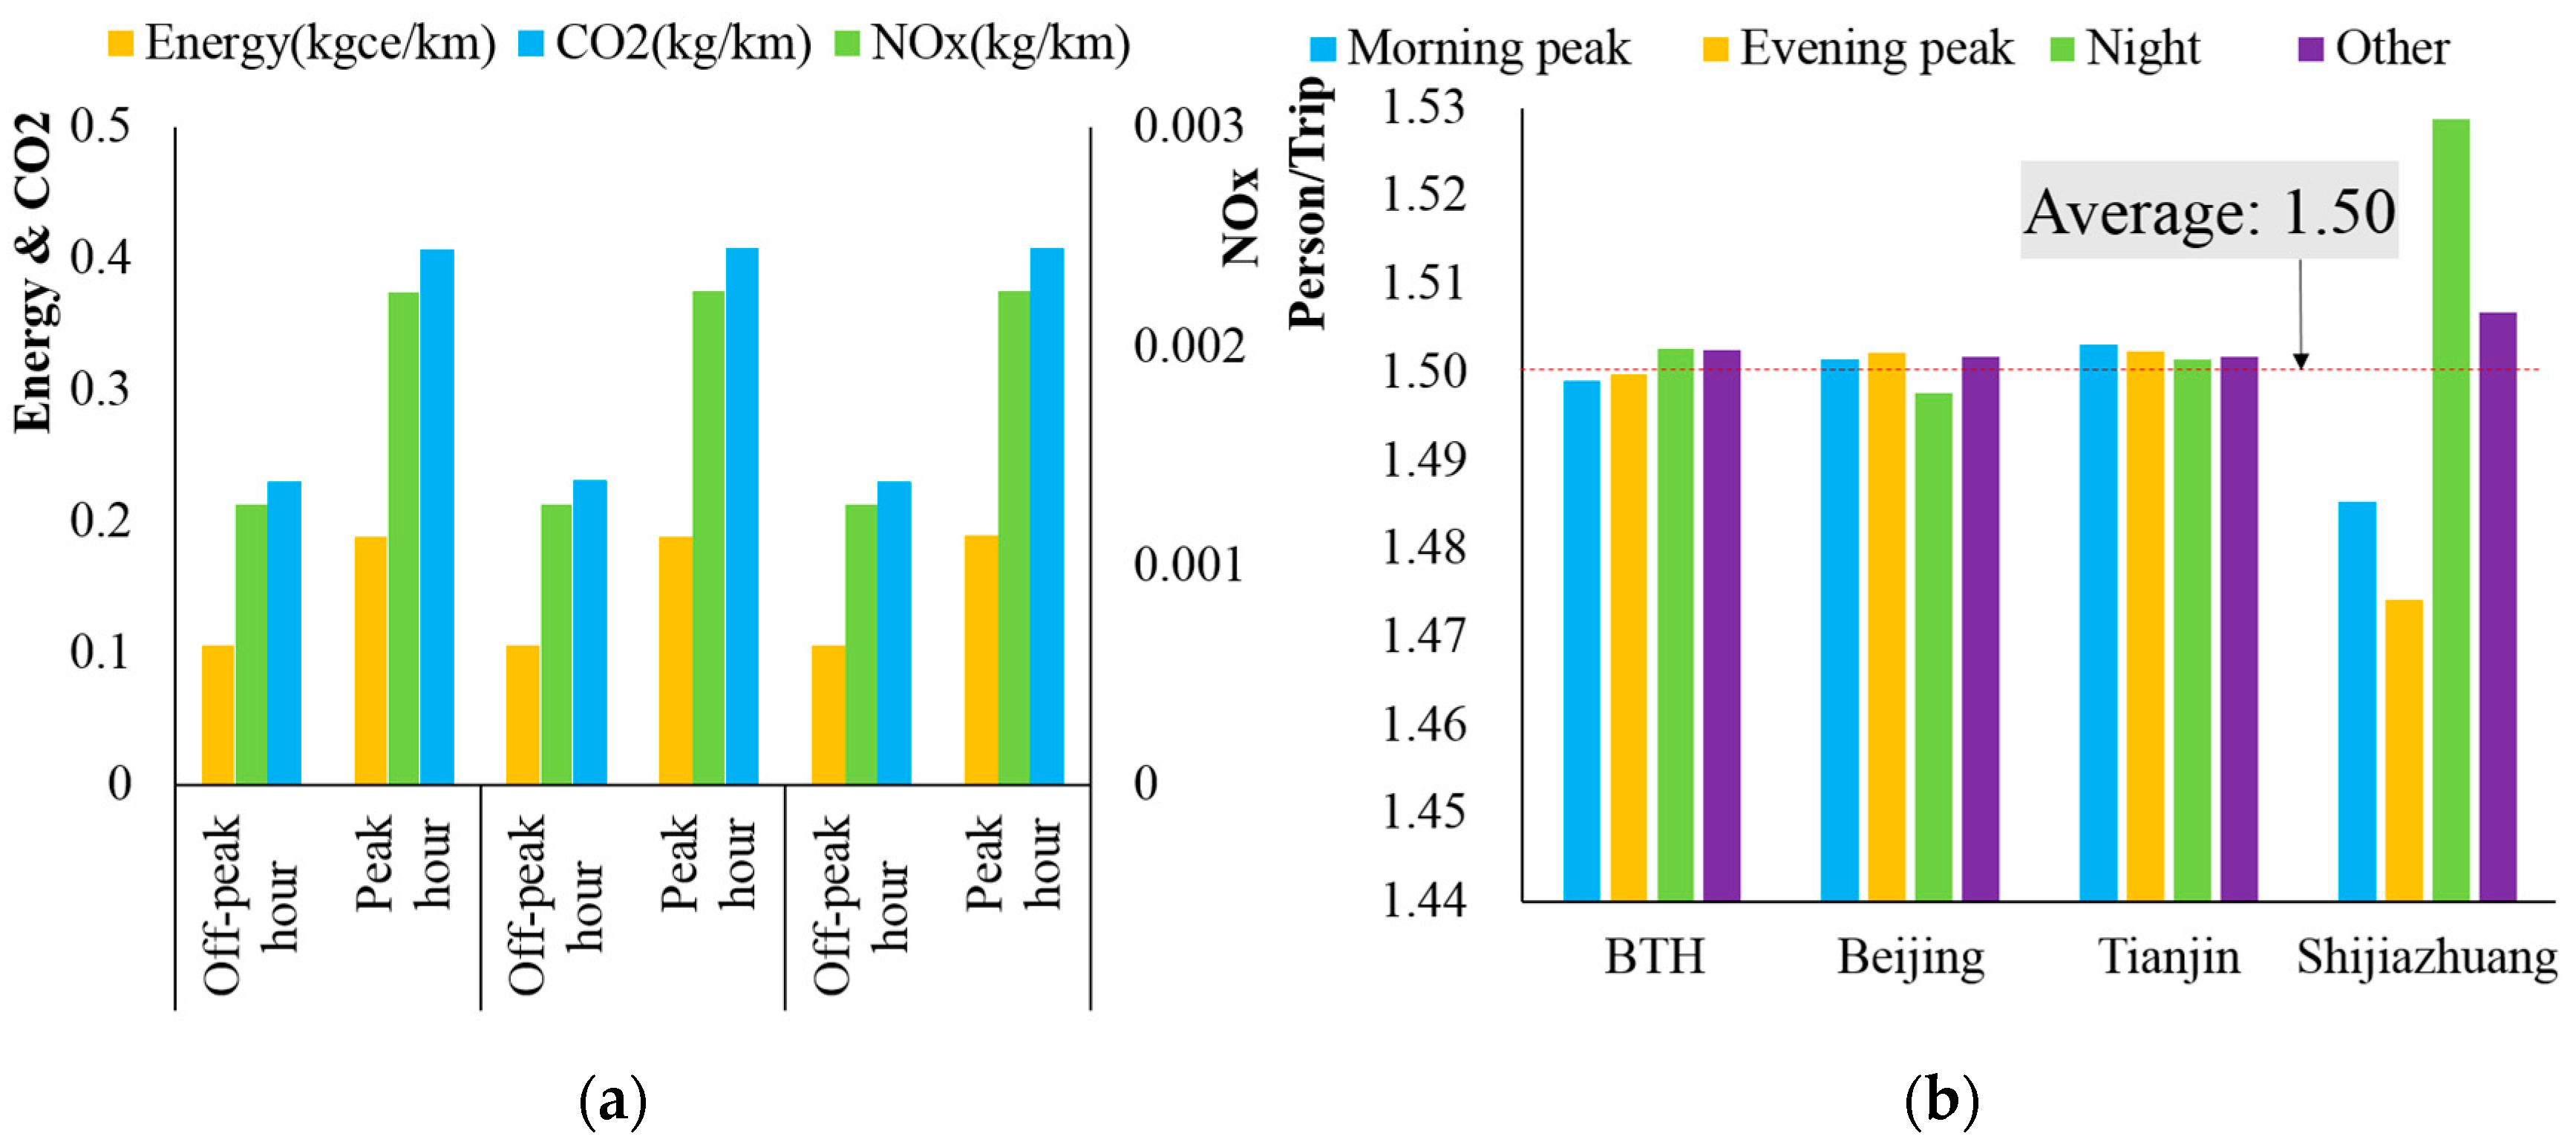
Based on the trip data, the sample’s energy consumption and emission per kilometer in different cities can be calculated by the lifecycle analysis of fuel model, see
Figure 8a. We find that Beijing, Tianjin, and Shijiazhuang almost share the same character during the same period. In BTH region, energy consumption and emission level in peak hours are higher than that in off-peak hours, which is both influenced by the congested traffic condition and low fuel efficiency of slow travel speed in peak hours. Therefore, if we take the difference of environmental impact into account, the promotion of ridesharing in peak hours could lead to more energy saving and emission reduction, which introduces a necessity to find out the guest number of ridesharing during the different period, see
Figure 8b. As
Figure 8b shows, the ridesharing service in BTH region is balanced between different time periods and the average guest number of sampling ridesharing orders is 1.5 in BTH region, which means that averagely 60% of negative environmental impact could be reduced compared with a car who does not offer a sharing service. Specifically, the characteristic of guest number tends to be close between Beijing and Tianjin, although Beijing’s users prefer to bring guests for ridesharing in the evening peak hours while Tianjin users’ preference is morning peak hours. Then, the average guest number in Shijiazhuang is fluctuant among different times. The magnitude of it in Shijiazhuang is much small during peak hours while is larger in the night followed by other time. Thus, ridesharing could be a better supplementary travel mode for people in Shijiazhuang in non-peak hours. On the contrary, Beijing’s users have a relative week preference to use ridesharing during this period. This exciting phenomenon could result from the relatively poor development level of the transportation system as well as citizen’s environmental awareness in Shijiazhuang [
59,
60]. Combining with the
Figure 5b, one of the significant travel purposes of Shijiazhuang’s users is amusement which is not as urgent as commuting. It would influence people’s willingness to share the ride with more people and explain the reason why the guest number in the Night and Other period is higher than that of the Morning and Evening peak hours. Nevertheless, in light of the guest number could reflect the urgency of shared travel and a relatively small number indicates that travel time for customer is limited. If we want to achieve energy saving and air pollution reduction by promoting ridesharing service in peak hours, more shared cars require to be available.
5. Environmental Impact of Ridesharing Service
As mentioned in
Section 3.1, this part applies the raw trip data and survey data into ridesharing analysis of direct and indirect impacts on the environment.
5.1. Direct Environmental Impacts of Ridesharing Service
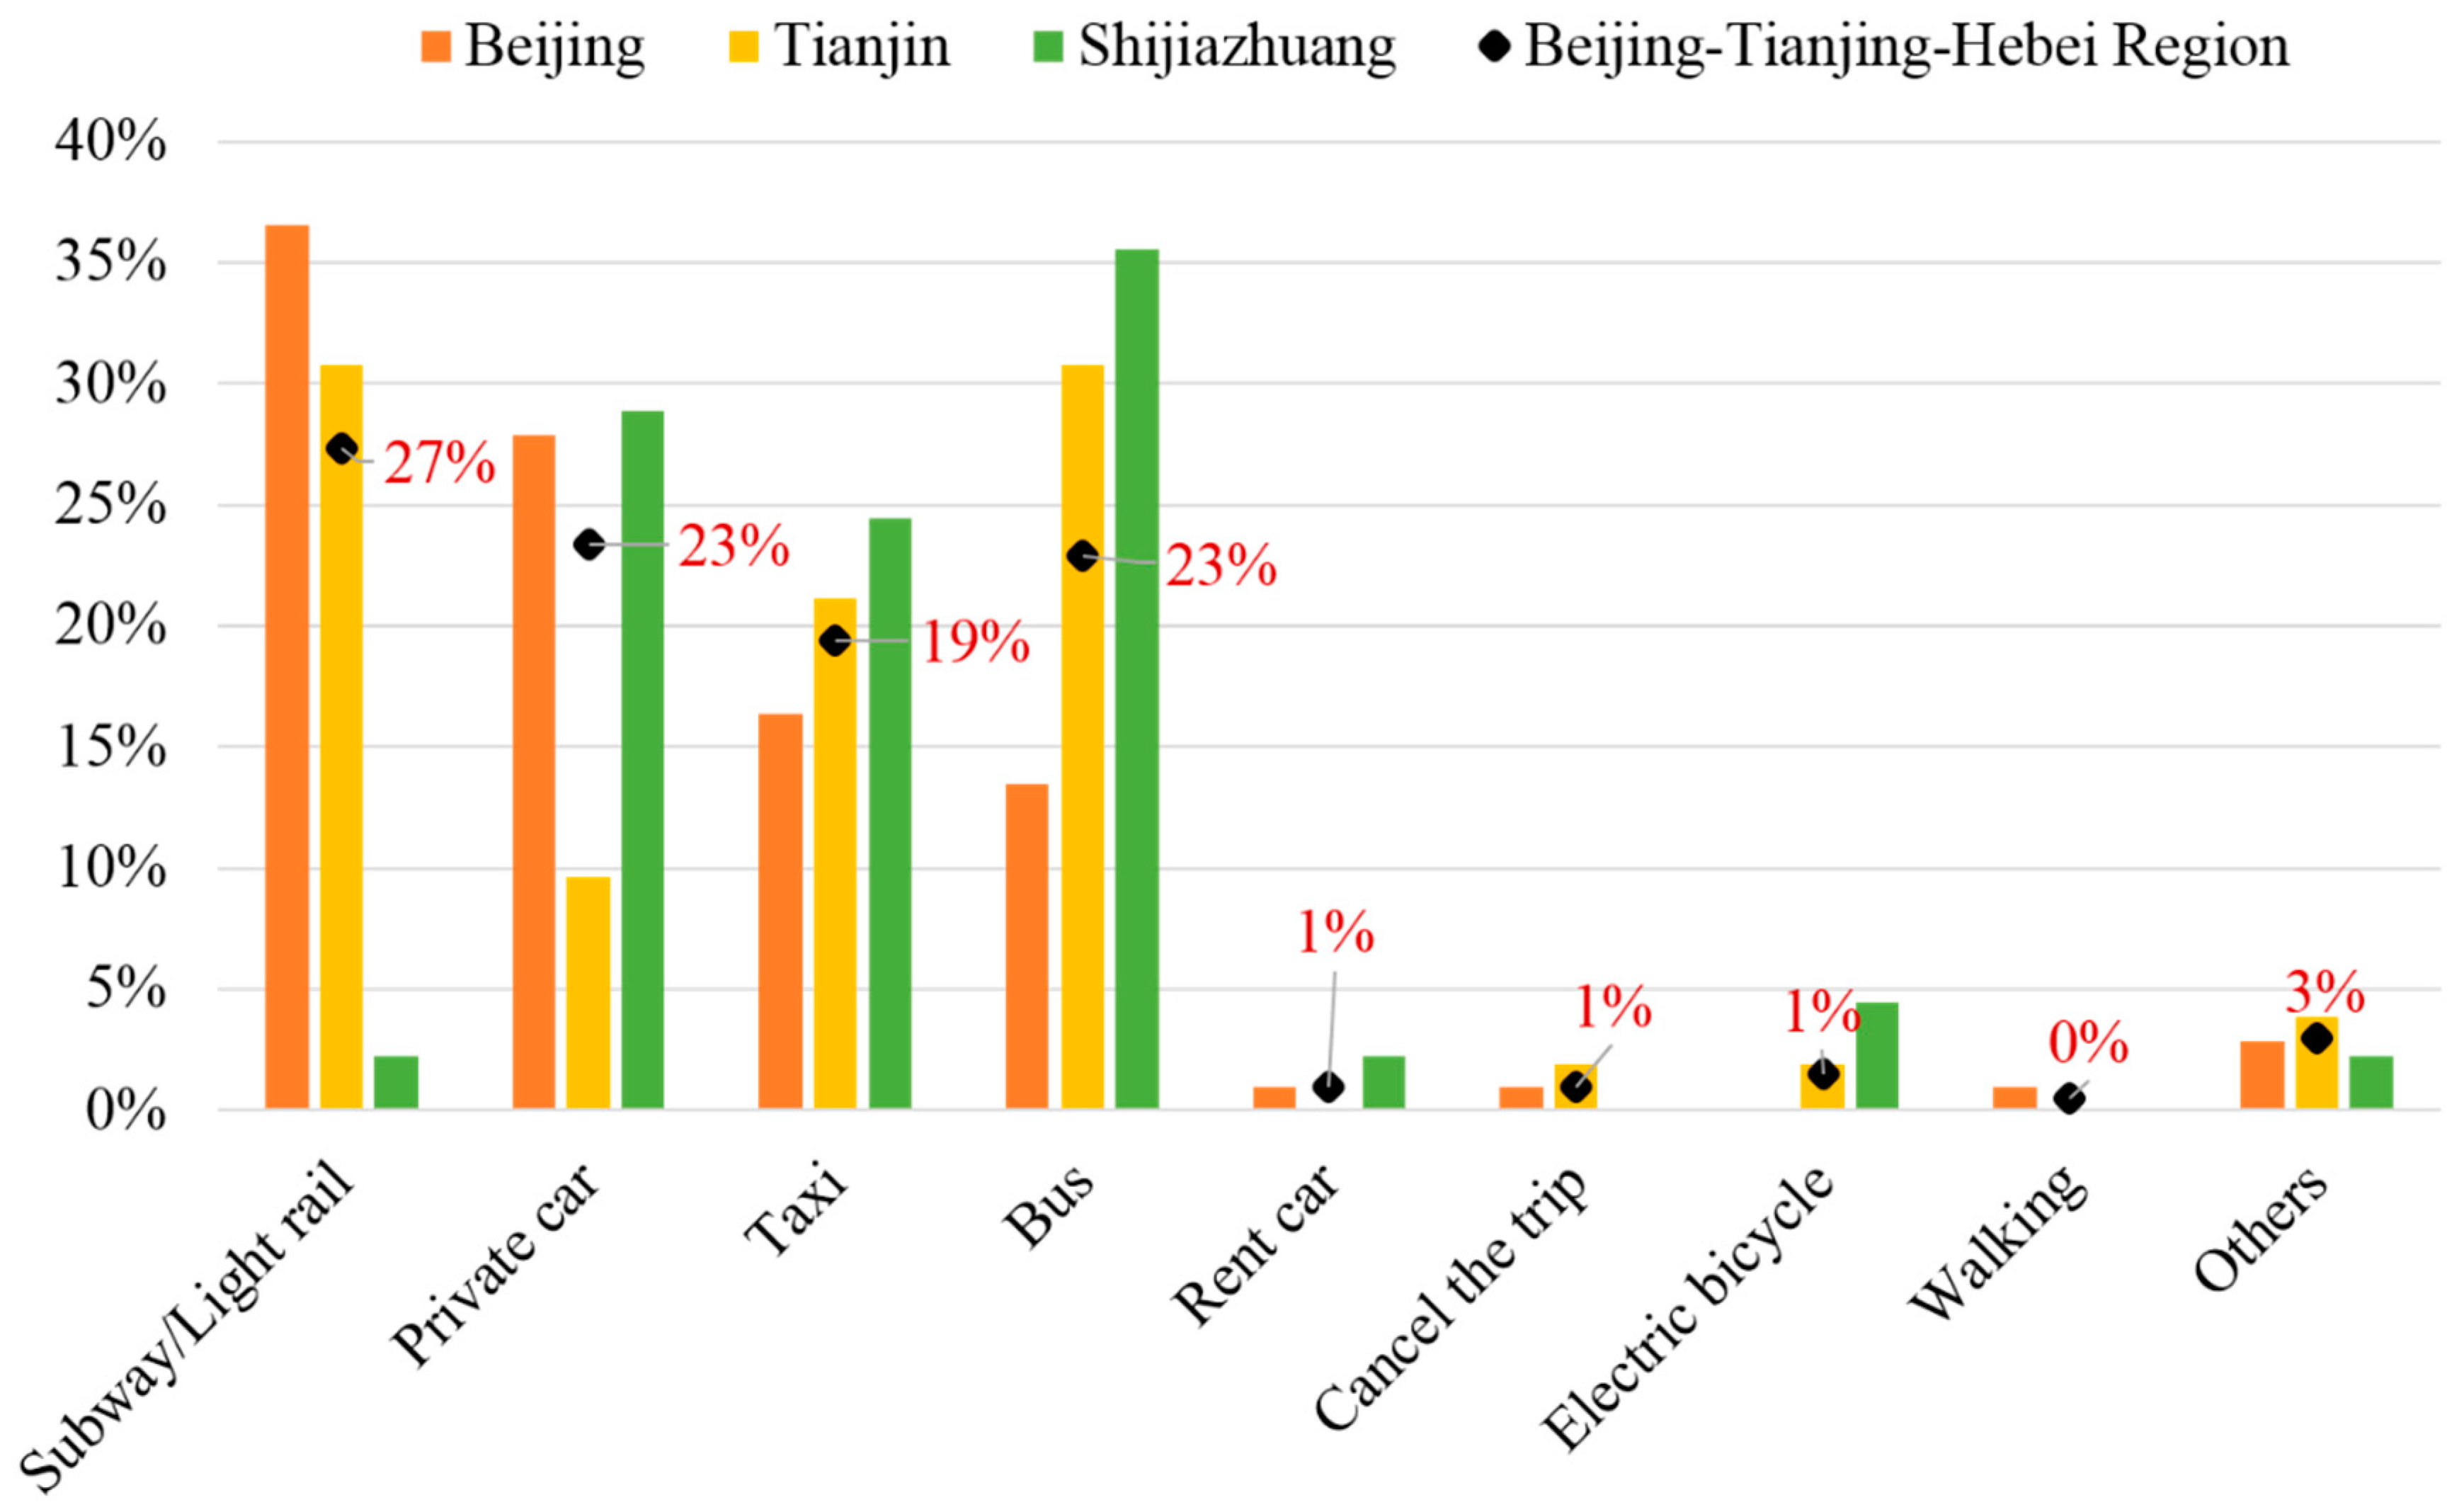
For the reason that there is no additional energy consumption and emissions for ridesharing users, the direct energy conservation and emission reductions by ridesharing service is produced by the original travel modes. To comprehensively estimate the environmental impacts of car sharing service, it is necessary to know the overall shift of original travel mode to car sharing services and the possible change of their vehicle purchase behavior if car sharing is always available in the future. According to the phone-based survey results, subway, private cars, taxi, and bus is generally the main alternative travel mode in BTH region, see
Figure 9.
Within the BTH region, the results show that subway or light trail is Beijing’s respondents’ main alternative travel mode, just like the bus to Tianjin’s respondents and private car to Shijiazhuang’s respondents, which could reflect the development difference of public transportation system. In particular, combining with the analysis in
Section 4.1, we can find that average ridesharing trip distance in Beijing is close to the average travel distance of subway (17.8 km) in Beijing, implying that ridesharing service may make up the current shortage of railway system over taxi services. Then, according to
Table 1, the passenger flows of the bus is quintuple as much as the subway in Tianjin, which means that the bus has played a more important role in Tianjin’s transport system. It could further explain why major travel mode shift of ridesharing in Tianjin is the bus. Moreover, for the reason that entertainment is a major reason why users in Shijiazhuang choose DIDI’s services, the private car turns out to be the significant shift travel mode accordingly.
Besides, these numbers clearly show that ridesharing mainly attracted the trips undertaken by the low fuel-efficient modes. Thus, ridesharing could contribute to releasing the insufficient capacity of public transport and taxies, and meanwhile, reducing the vehicles on the road. In addition to the options of traditional travel modes, “Cancel the trip” option is set to see whether ridesharing triggers extra travel demand or not. The survey results show that negligible of passengers reported canceling the trip, suggesting ridesharing does not increase trip demand. Particularly, slightly more people in Shijiazhuang would cancel the trip, which would be caused by the relatively undeveloped level in transportation.
The direct environmental impact of ridesharing is illustrated in
Table 3, including 34.1 thousand tce of energy consumption, and 55.5 thousand tons of CO
2 emission, 12.9 tons of primary PM
2.5 emission, 48.1 tons of SO
2 and 262.0 tons of NOx emissions in BTH region yearly. Beijing’s total impact is the most significant followed by Tianjin and Shijiazhuang. Taking the carbon dioxide emission as an example to interpret, the CO
2 emissions saved from ridesharing travel is approximately equivalent to cumulative emissions of 51.8 thousand cars driving on the road for one year in BTH region (assuming the VKT per year as ten thousand kilometers) [
61].
5.2. Indirect Environmental Impacts of Ridesharing Service
Under the limitation of parking space and purchasing a new car, ridesharing service may influence passengers’ vehicle purchasing behavior for a supplement of public transport, let alone its convenience and economic benefit.
According to our survey results (
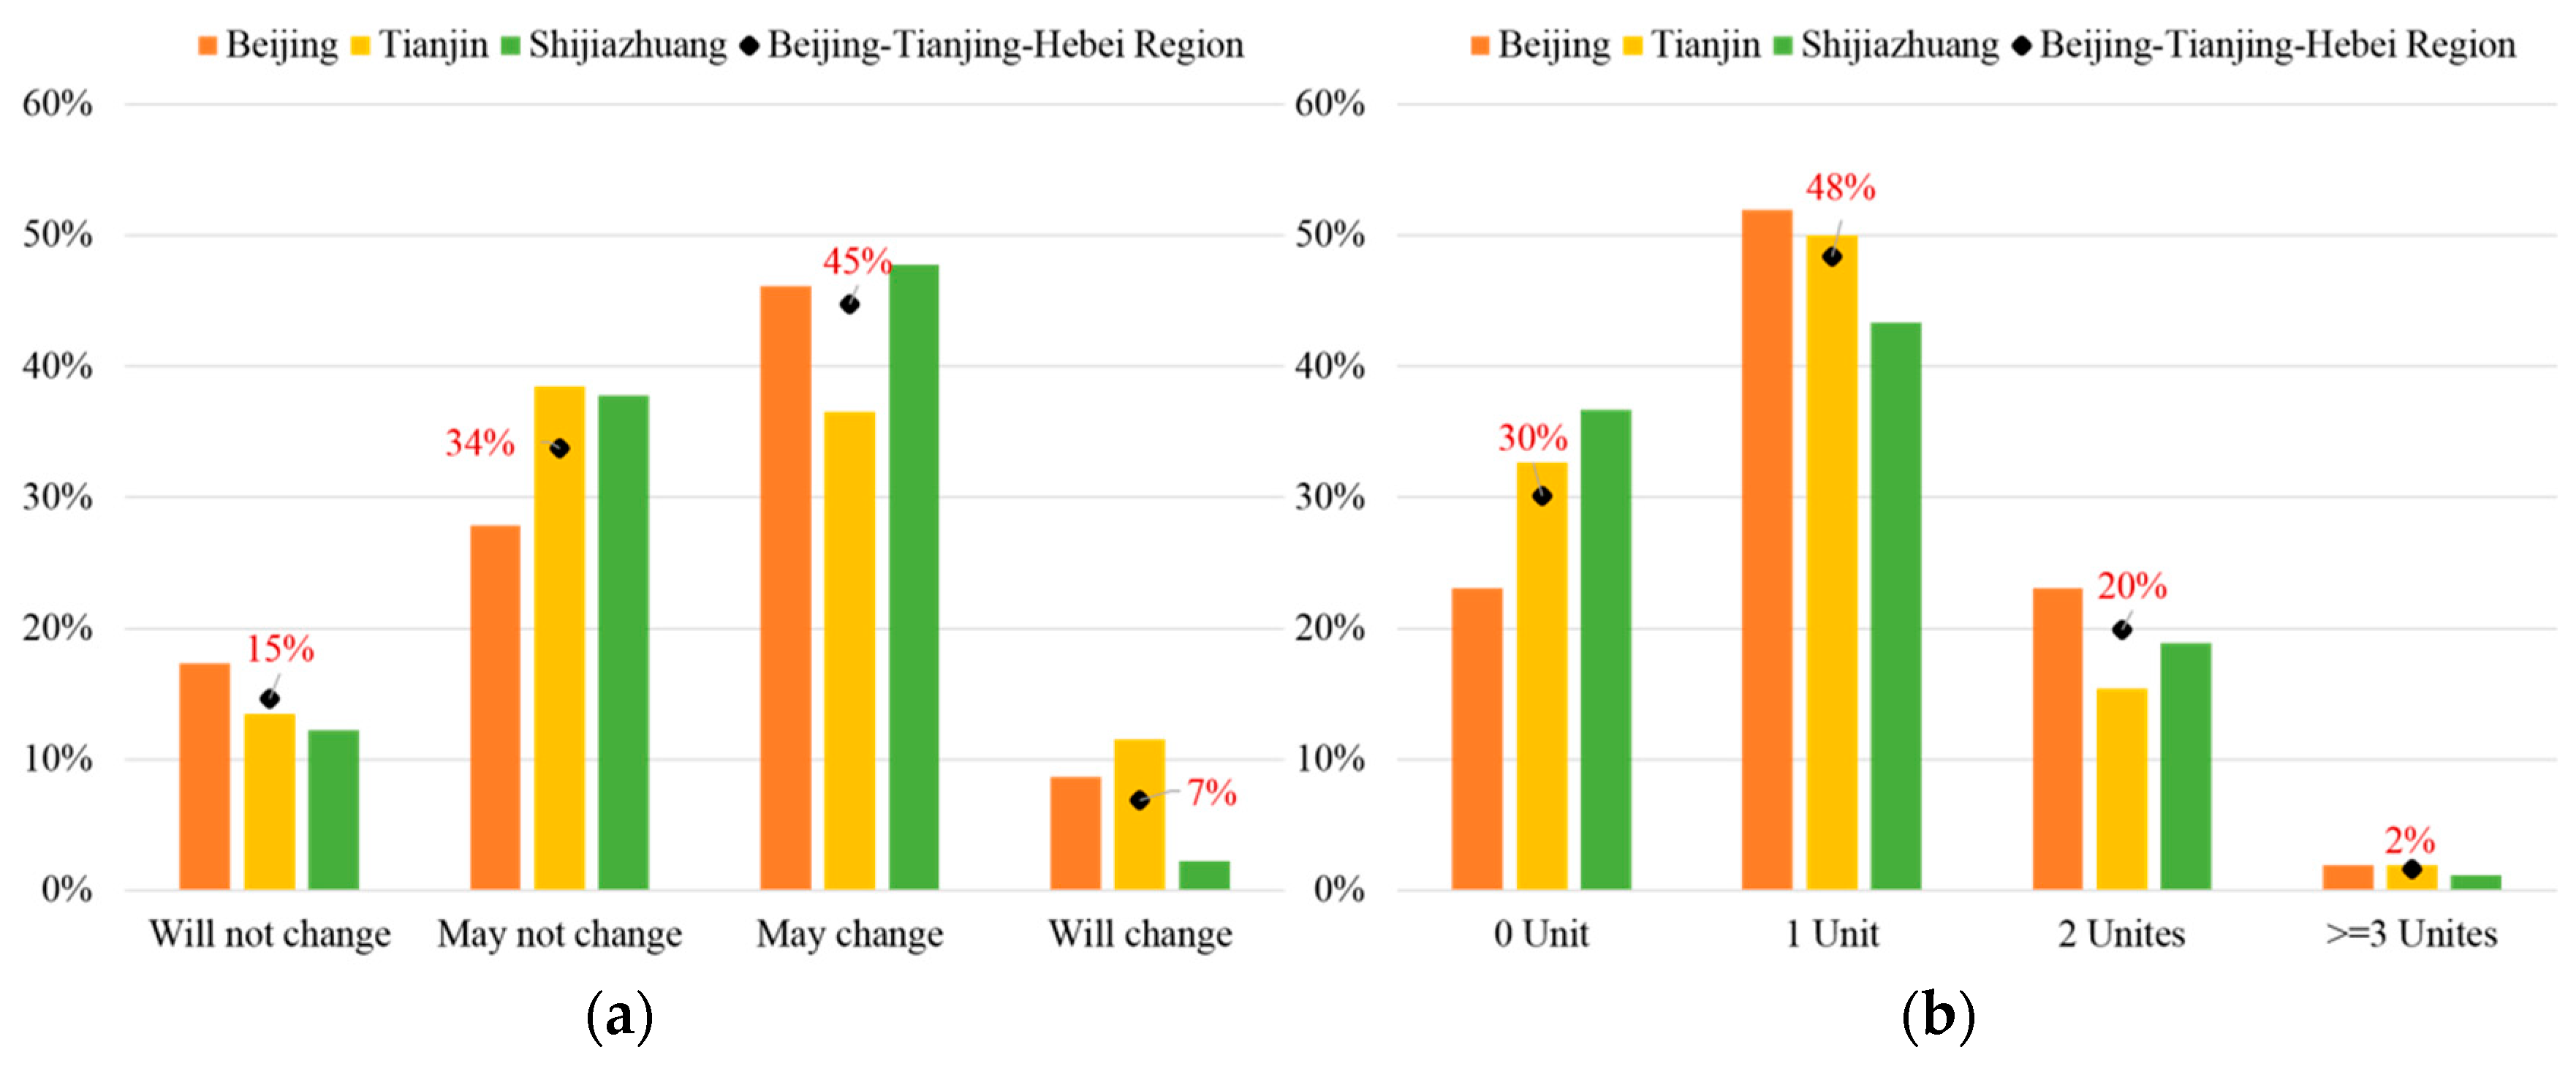
Figure 10a), 70% of ridesharing users own at least one car in their households, with lowest ownership rate in Shijiazhuang and highest ownership rate in Beijing. This implies that ridesharing service is more attractive to car owners, and it can significantly help lessen the trips made by private vehicles in addition to the existing car restraint policies, especially for Beijing that imply the most strict private vehicle restraint policy, like a plate number’s driving restriction as well as plate lottery.
Concerning the influence of ridesharing on passengers’ attitudes towards purchasing cars in the future, we specifically asked whether they will change their plan for purchasing new vehicles or replacing their current vehicles if ridesharing is always available. After the passengers had the ridesharing experiences, more than 86% of them reported that they will reduce the usage of their cars (
Figure 10b), with lowest changing willingness rate in Shijiazhuang and highest changing willingness rate in Beijing, which illustrates that users in Beijing keep a more open mind to ridesharing services. Besides, according to
Table 1, the private car’s ownership per capita is the highest in Beijing, followed by Tianjin and Shijiazhuang. It suggests that ridesharing could be a better way to reduce the superfluous car ownership and traffic congestion that result from car ownership.
The indirect impact is a mid- or long-term effect, which implies that it is very likely for the passengers to give up buying the cars in the future, which may reduce the total number of vehicles in the society, and then the energy consumption and emissions during the processes of vehicle manufacturing, transportation and disposal in the automotive industries. The results of the environmental input–output analysis show that existence of ridesharing service may save energy consumption by 208.1 thousand tce and reduce CO
2 emissions by 650.7 thousand tons, primary PM
2.5 by 325.8 tons, SO
2 by 1220.2 tons and NOx by 1527.2 tons, see
Table 4.
6. Conclusions and Suggestions
This study has enriched previous literature by recognizing the spatial heterogeneous basing on the big operating trip data of ridesharing. After revealing the intraregional influence over people’s travel demand and behavior, this paper also investigates the direct and indirect environmental impacts of ridesharing. The findings of this paper can fill the gap in our understanding of this newborn travel model in big cities.
- (1)
Some similarities for ridesharing are founded in Beijing, Tianjin, and Shijiazhuang. Firstly, Ridesharing service is mainly undertaking mid- and long-length commuting trips in BTH region, which could be a convenient choice for solving the longtime travel demand shortage of urban residents. Overall, there are clear morning and evening peaks revealed on weekdays for ridesharing trips, and the amount of weekday trips is much more than that of the weekend. Then, the customers are relatively young but highly educated, and most of them believe that current travel model choice and their future attitudes towards purchasing new vehicles or replacing the old vehicles will change. Our survey results show that ridesharing did not stimulate new travel demand while replaced original travel demand undertaken by public transit, taxi, and private vehicle. Thirdly, there is a significant polarization distribution of regional traffic demand within Beijing, Tianjin and Shijiazhuang and the order’s distribution are not balanced in three cities between different districts, which indicated an unbalanced urban traffic development status in BTH region. Hence, on the one hand, policies and regulations from the government should guide an equilibrium development of urban transportation, on the other hand, ridesharing could play a more significant role in the districts with a high supply demand.
- (2)
On the contrary, our research has found some spatial heterogeneous characteristics of ridesharing. Firstly, as a supplemental travel mode, ridesharing trips mainly shift from the subway in Beijing, while the bus in Tianjin and private cars in Shijiazhuang. Also, for the availability of ridesharing in the future, private car’s purchase willingness of users will change separately. The users in Beijing have the strongest changing will, followed by Tianjin and Shijiazhuang. This could result from the ownership per capita level within BTH region.
Furthermore, ridesharing mainly satisfies the commuting purpose in BTH region, while the recreational purpose is also significant in Shijiazhuang. Secondly, a variety of users is also significant. Comparing with Tianjin and Shijiazhuang, the income level of Beijing’s DIDI users is a little higher, which means that high-income groups of people possess a stronger willingness to choose sharing model of travel. Besides, more than 70% of Beijing’s respondents are living in the suburban district of the city, while this ratio is more balanced in Tianjin and Shijiazhuang. This indicated that DIDI’s ridesharing travel demand is diverse within the BTH region and between urban and rural areas. Thirdly, there are spatial heterogeneous features of travel demand between Beijing, Tianjin and Shijiazhuang. In Beijing, the amounts of generating ridesharing trip demand and attracted demand are centralized with various performances in central districts and surrounding districts. This phenomenon provides some insights into the regions and routines that might need extra traffic capacity, which can further help design time-specific or area-specific traffic management schemes. The amounts travel demand are more balanced and relative dispersive between central and surrounding districts in Tianjin, while are extremely unbalanced for the majority of districts in Shijiazhuang showing a more agglomeration effect in main and central districts. What’s more, the variation of environmental benefit in different regions indicates the difference in travel demand, consumer acceptance as well as the shortage of other travel modes.
Based on the conclusion mentioned above, in order to promote ridesharing and enlarge the environmental benefit in the different region, some suggestions could make for policymakers and the ridesharing company.
For the government, financial incentives like the subsidy for ridesharing company could be promoted in the area where people have relatively low acceptance of ridesharing like Hebei. And command-and-control measures, such as offering certain roads for ridesharing during peak hours, could be taken in Beijing where existing significant shortage of public transportation. Then, the government could also bring the ridesharing company into the cap-and-trade system and benefit the ridesharing company by valuing the environmental impact, which could further stimulate the ridesharing market.
For the ridesharing company, they can offer more discount or coupon for the region like Hebei to develop user behavior habits and increase customer’s acceptance. Then, they can reward customers and drivers in peak hours to stimulate travel demand. This could enlarge the environmental impact of ridesharing, especially for the region where user’s alternative travel mode is private car or taxi. Finally, a more delicate path matching algorithm of service system should be developed to reduce additional time cost for customers, thus may increase the acceptance of customers and the market share.
In conclusion, this research offers evidence of further traffic system design in the sustainable transportation system. The method presented here can be applied in other global megacities in developing countries, so in other large and dense cities as well.
Although this study provides a new perspective toward the analysis and comparison of spatial heterogeneous characteristics of ridesharing, there are limitations of this preliminary research. For example, the multivariate technique could be applied to analyze the data and identify patterns, and the number of respondents could be increased to achieve higher representativeness, and the results could be compared with other mathematical models. These limitations could be possible research directions for further research.


