The Application of Improved Random Forest Algorithm on the Prediction of Electric Vehicle Charging Load

Abstract
:1. Introduction
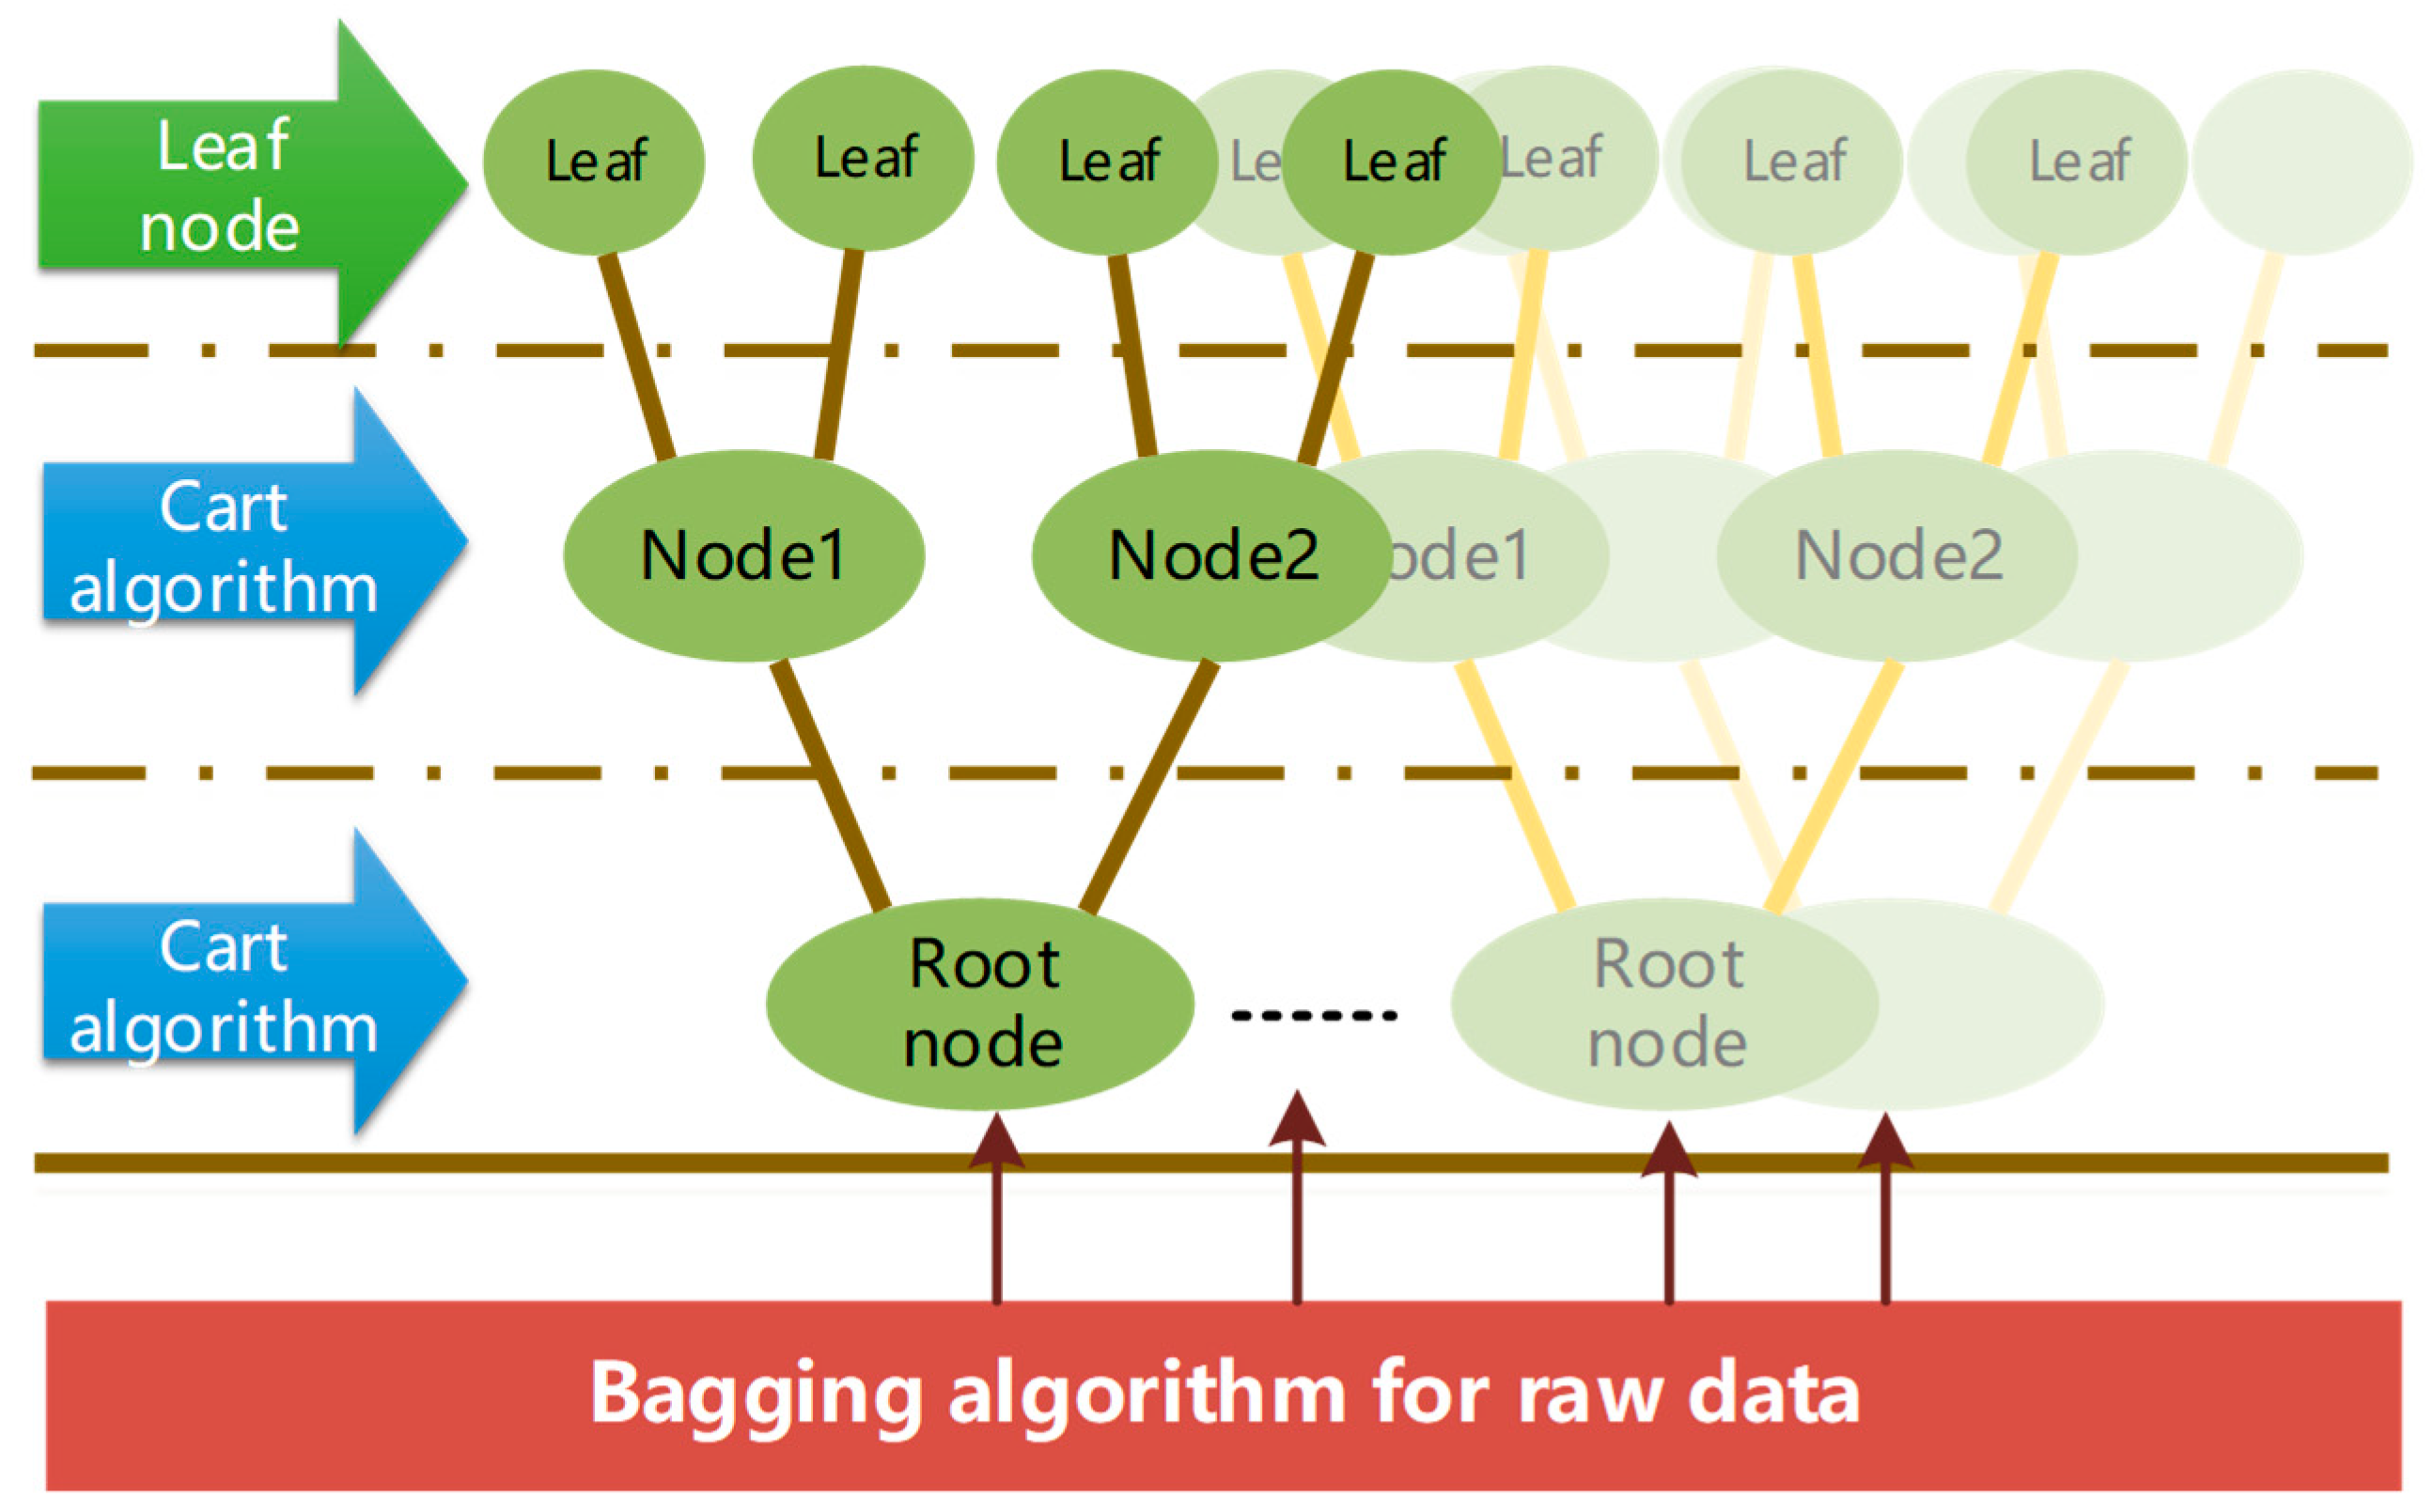
2. Random Forest Algorithm
2.1. Gini Coefficient
2.2. Decision Tree
2.2.1. Classification Decision Tree
- Load data set D on a node;
- If all the samples in D belong to the category ck, the node will not continue to generate and mark it as ck;
- If there is no optional feature, the category with the largest number of samples in D is taken as the category of the node;
- Otherwise, if feature x(j) has Sj different values which satisfy in the current data set, then:
- If the stop condition is satisfied, take the category with the largest number of samples in D at this time as the output category;
- Otherwise, according to all possible values of x(j*) (which is {a1, …, am}), divide D into {D1, …, Dm}:
- Call the algorithm from Equation (1) for each Dj.
2.2.2. Regression Decision Tree
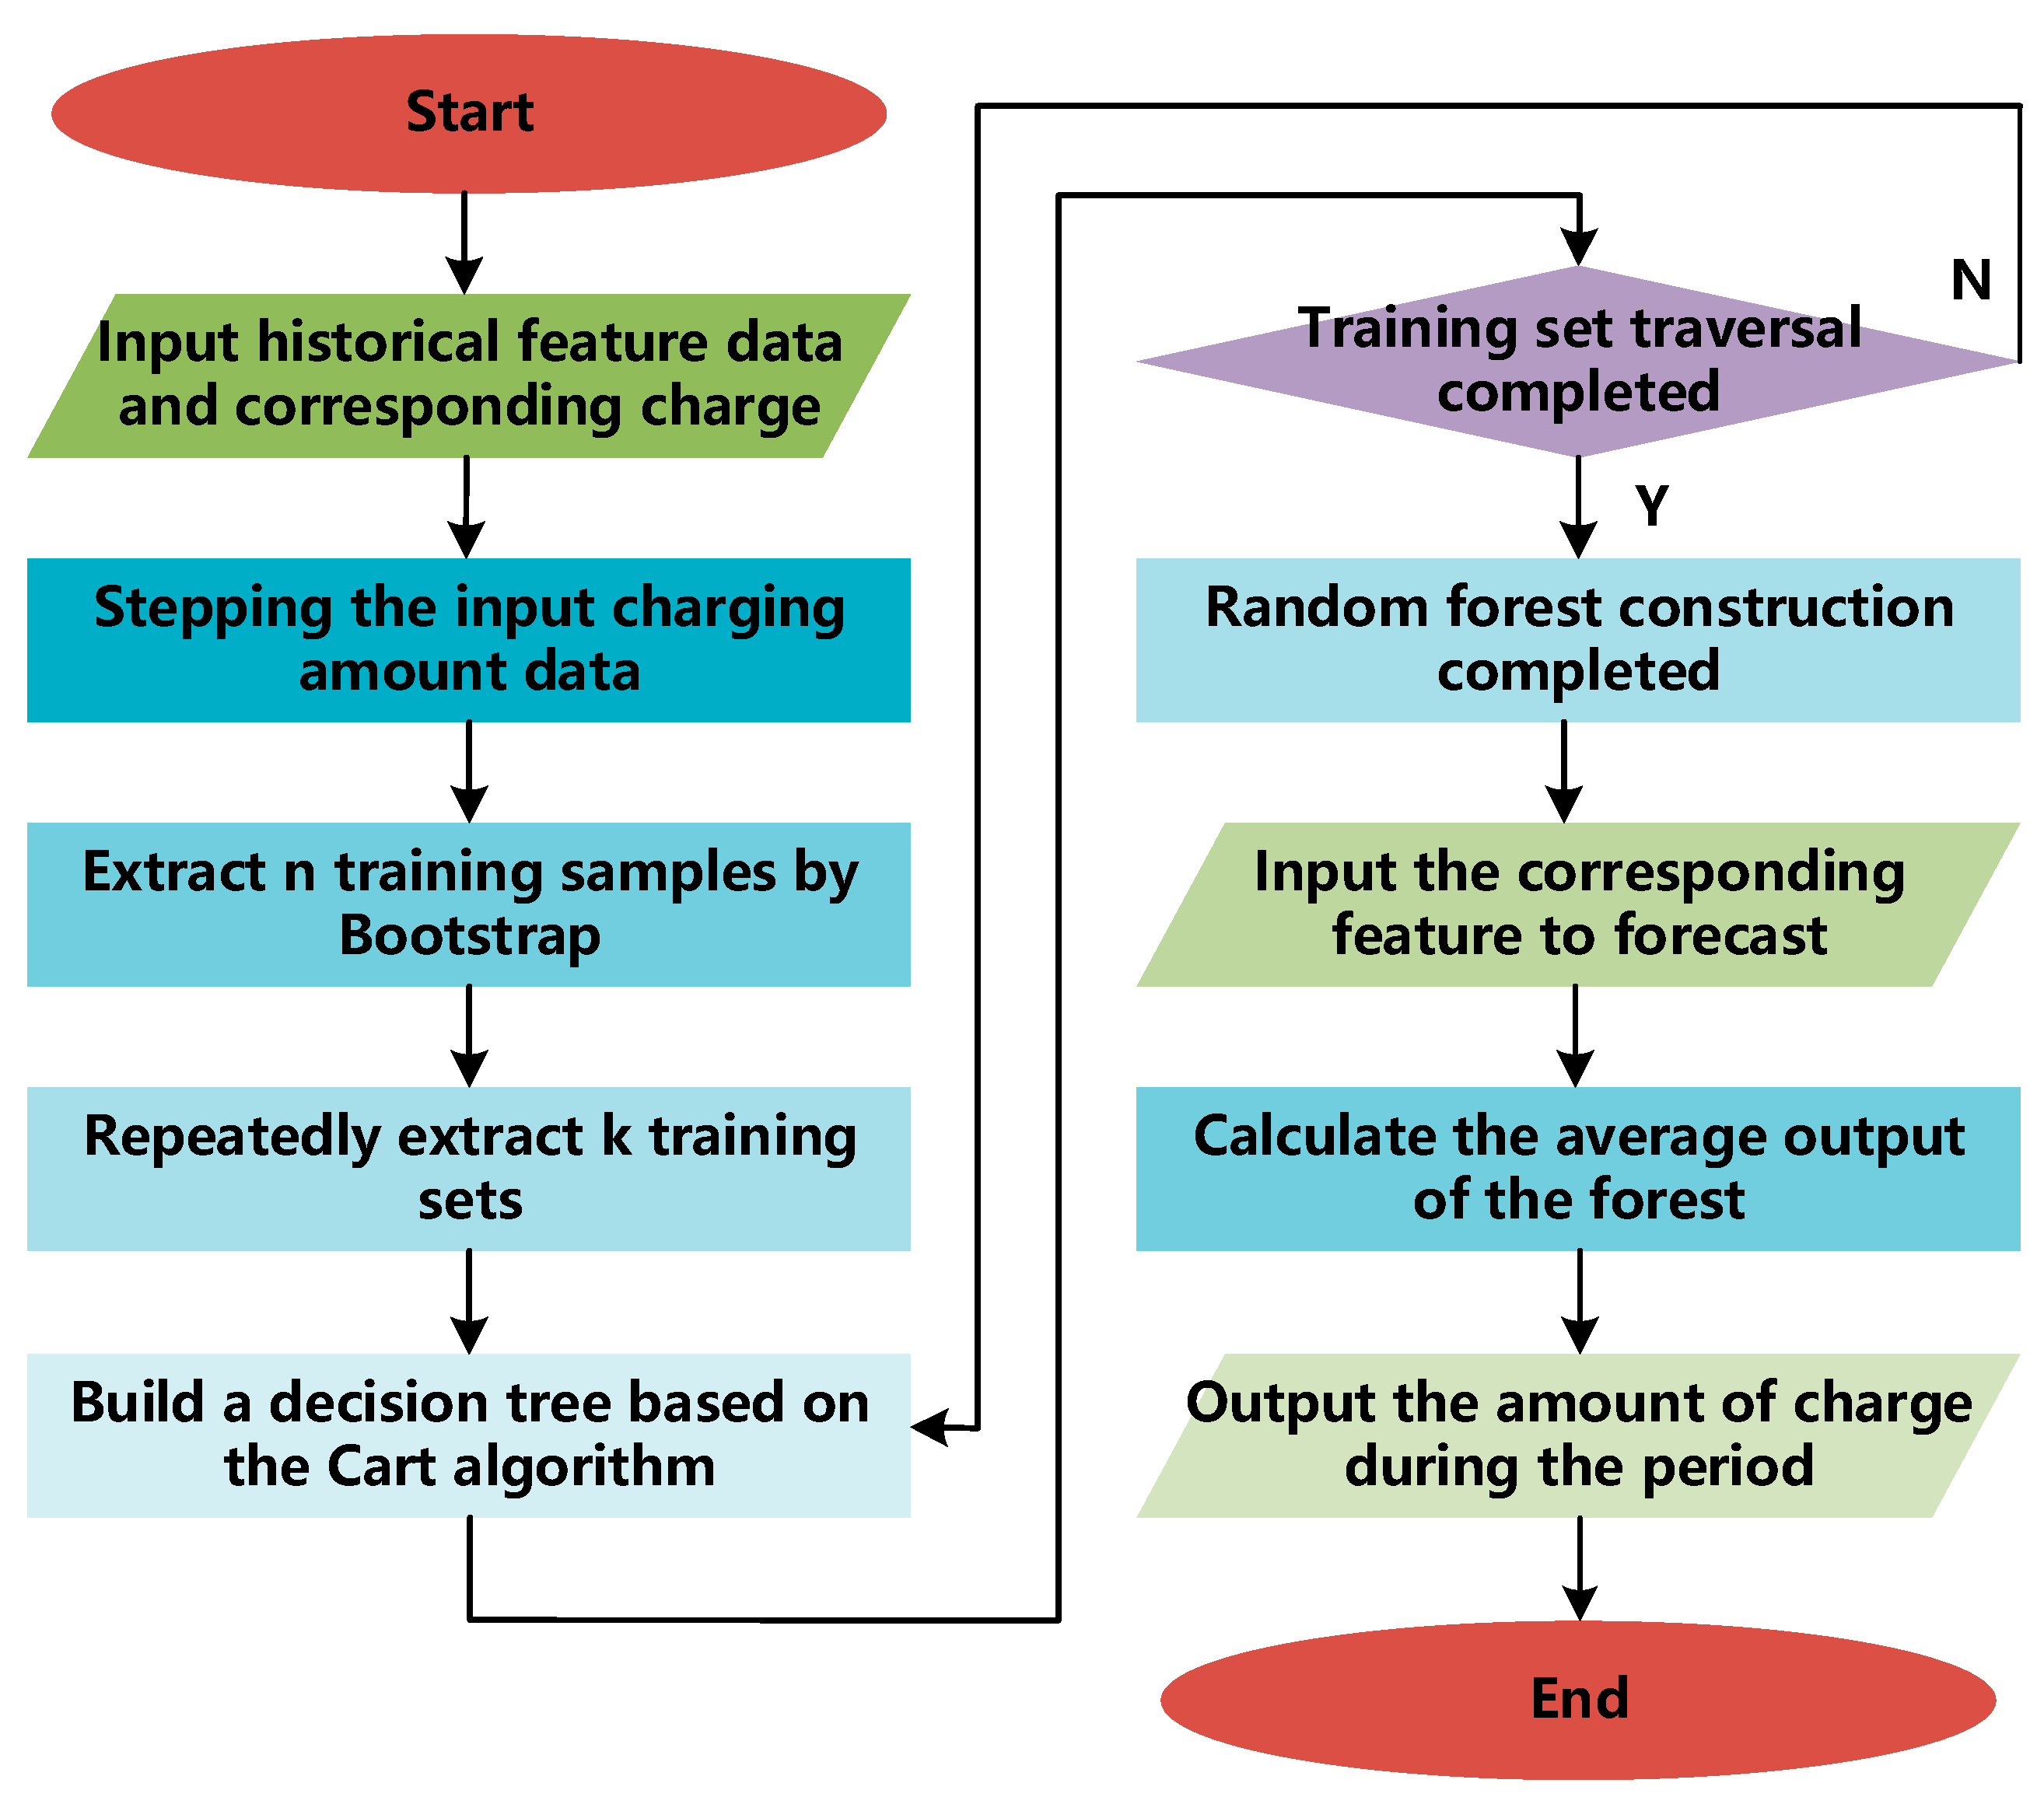
3. Design of Random Forest Algorithm Application
- Using Bootstrap, randomly extract n training samples from the original data set;
- k rounds of extraction are performed and k training sets are obtained;
- training k decision tree models for k training sets;
- For the problem of charging load prediction: the average of the prediction results of each model is used as the final prediction result.
- (1)
- The amount of data in each interval is the same, which can ensure that each step after the division occupies the same proportion of the historical data. This principle is suitable for the small charge portion in the single station prediction;
- (2)
- The length of the interval is the same. More intervals will be generated using this method, which requires a large amount of data. This principle is suitable for daily charging capacity prediction of station groups which is more uneven in data distribution.
3.1. Charging Load Prediction Algorithm of a Single Station
- Date indicator (Year, Month and Day): an accurate judgment of the influence of climatic conditions such as temperature and humidity on the behavior of EV is difficult to make. Therefore, the attributes are directly integrated into the date indicator, and the impact of climate can be minimized with large amount of data;
- quantity: the importance is represented by a numerical value, which will be limited in 15 min;
- Activity indicator: the importance can be expressed by numerical values, which will be limited in 15 min. Important activities may cause a surge in regional charging load;
- Prosperity index: The infrastructure index in the prosperous index, which will fluctuate with the renovation of buildings and roads. This is an important indicator that affects the charging habits of EV users;
- Charging capacity: before the current time, the amount of power that has been given. The charging area and the charging capacity of many EV users in a period are relatively fixed, so the accumulated charging load of the daily charging station should also be recorded. The volume will have an impact on the remaining load prediction for that day.
- Previous day’s charge: like the amount of charge, it can increase the temporality of the RF.
3.2. Charging Load Prediction Algorithm of Station Group
- (1)
- Week symbol: indicates the position of the day in a week, the data contains the information of the weekend, and can reveal the characteristic attributes of different dates;
- (2)
- Capacity indicator: indicates the rated capacity of each charging station. This value is obtained by summing the rated power of charging piles at each charging station. The capacity index reflects the prosperity of the location of the charging station to some extent.
- (3)
- Longitude: the longitude of the location of each charging station;
- (4)
- Latitude: the latitude of the location of each charging station is used to uniquely determine each charging station. The longitude and latitude indicators can effectively quantify the regional characteristics of different charging stations.
3.3. Evaluation of Prediction Results
3.3.1. Error Analysis
3.3.2. Analysis of Feature Importance
4. Case Analysis
4.1. Analysis of the Construction of Charging Facilities and Charging Data in Shenzhen
4.1.1. Temporal Analysis of Charging Data
4.1.2. Spatial Analysis of Charging Data
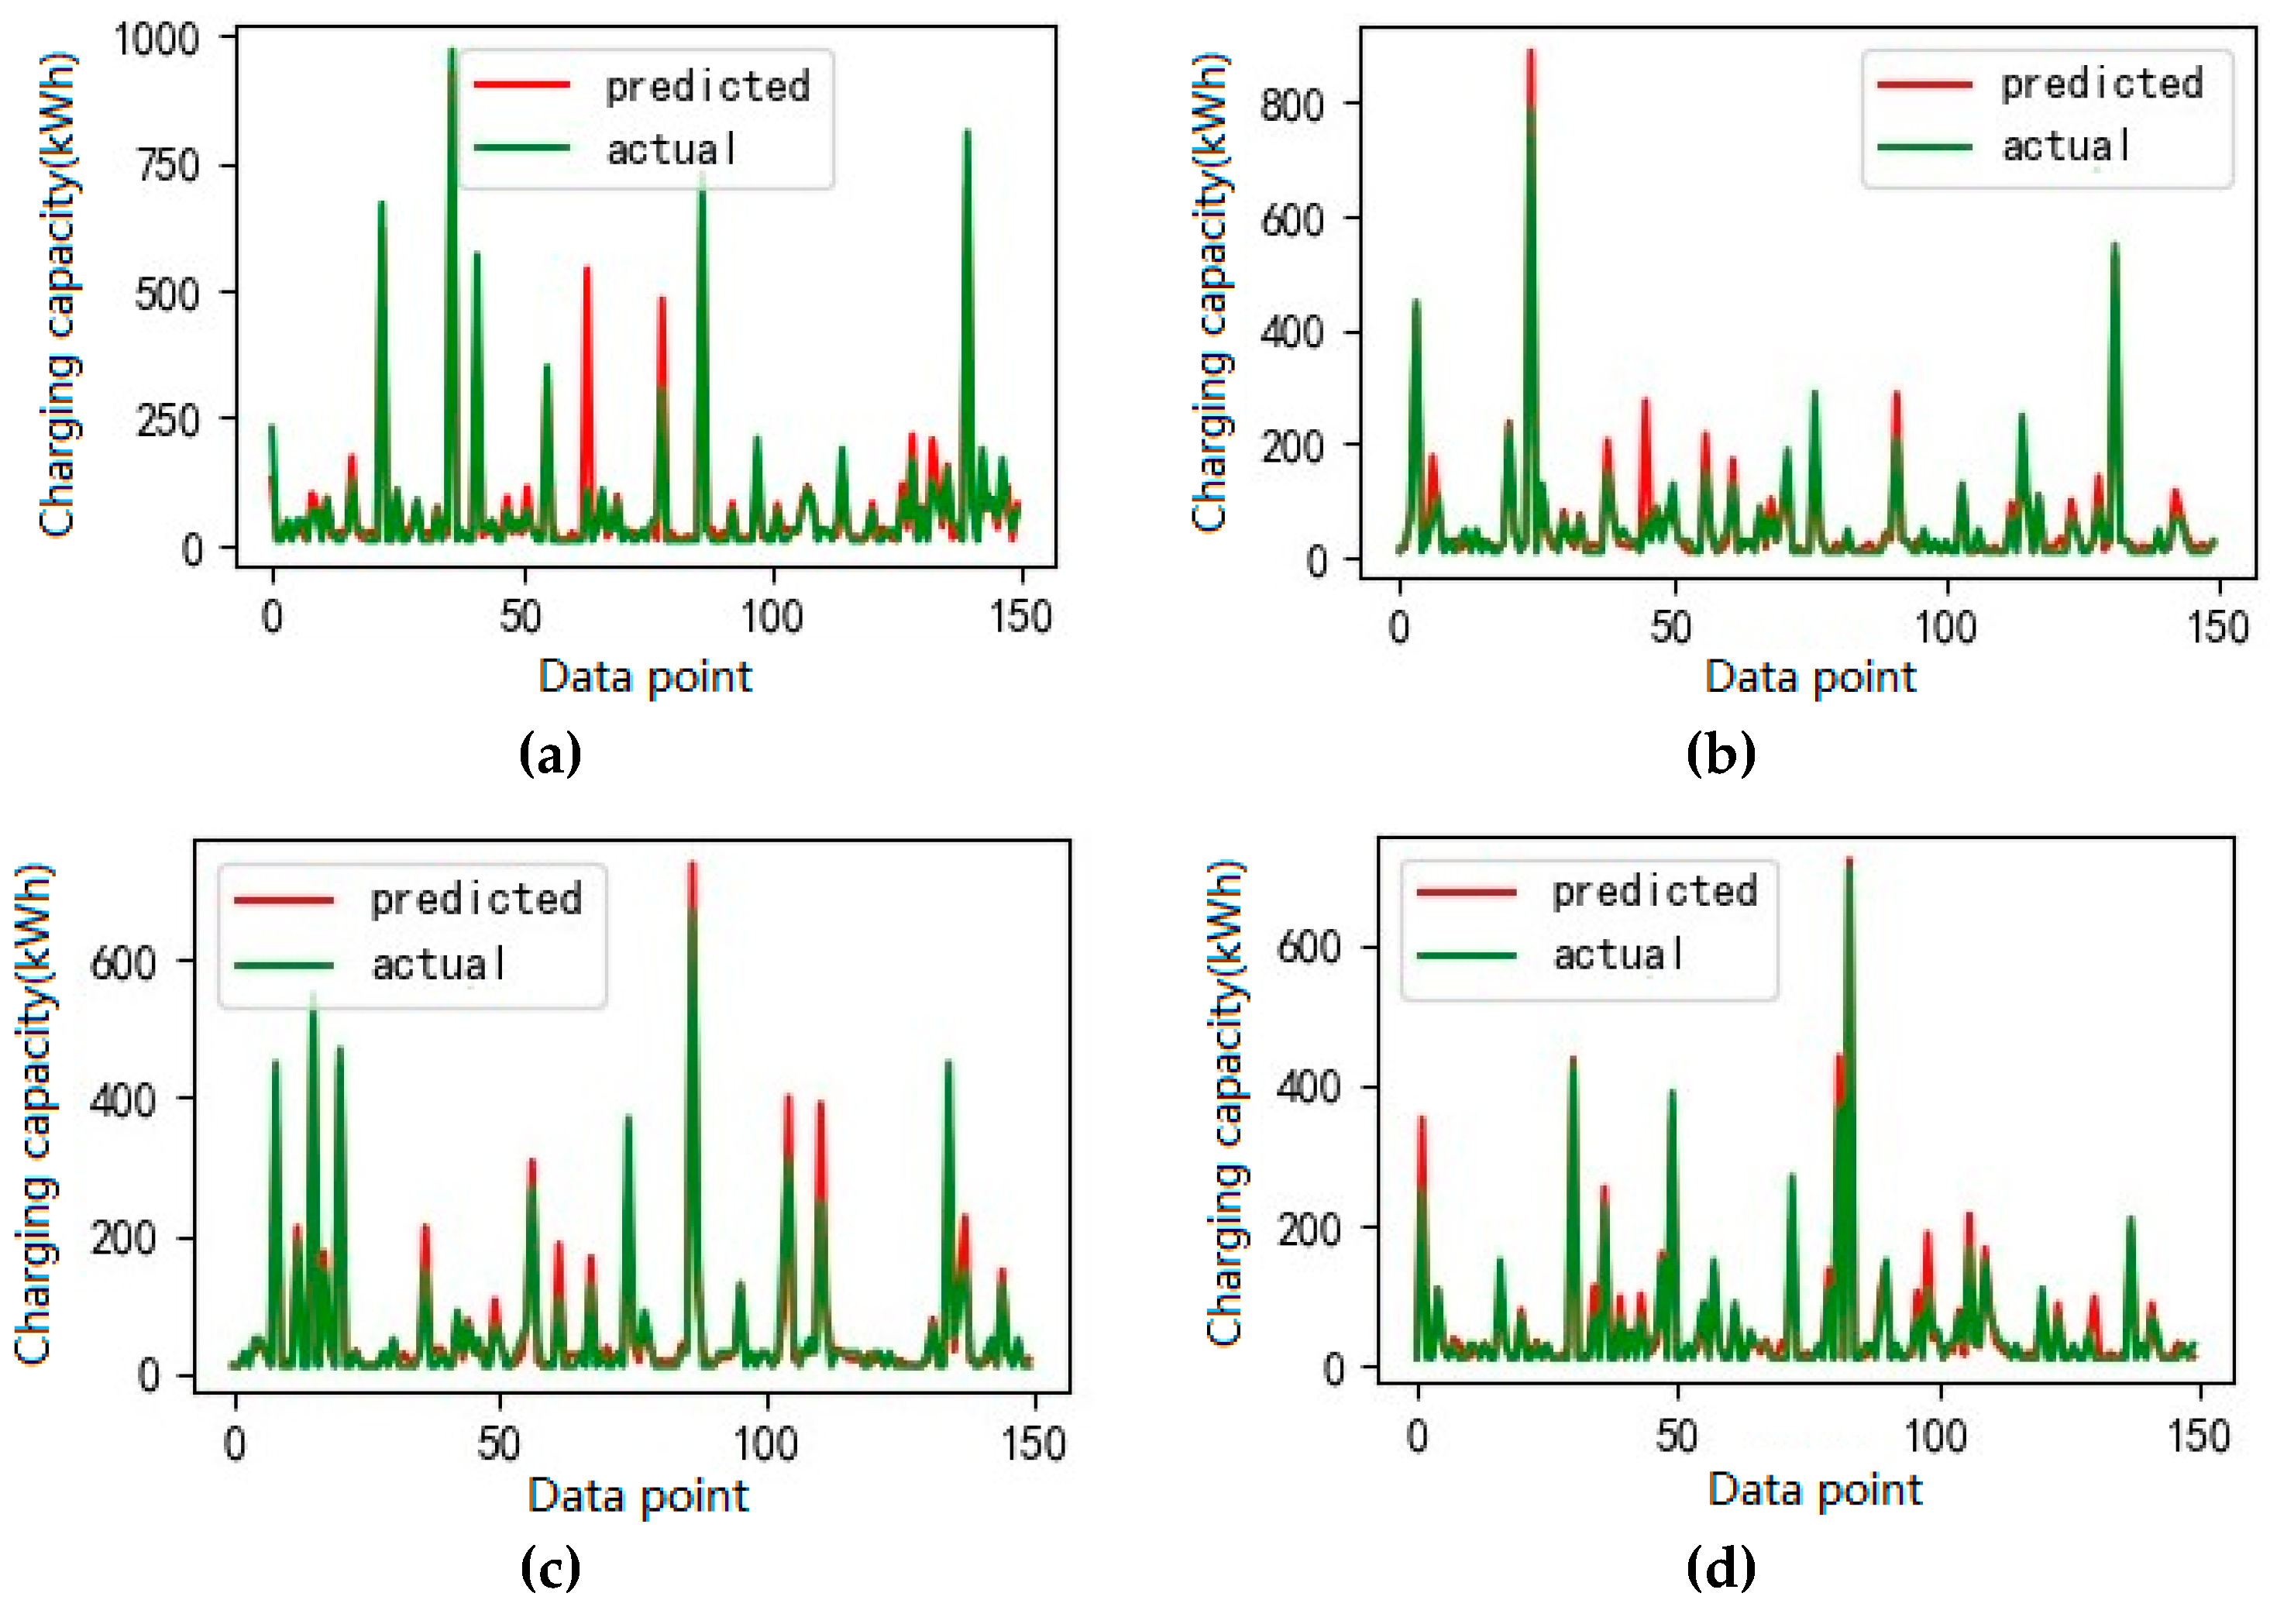
4.2. Charging Load Prediction
4.2.1. Prediction of Single Station
4.2.2. Charging Load Prediction of Station Group
5. Conclusions
- (1)
- The current EV industry in Shenzhen is still in a booming stage, and the charging load has a dispersion of small amount. After a large amount of charging data analysis, it can be observed that the charging load of EV also has temporal and spatial distribution characteristics. In terms of time, the charging load is higher in summer than in winter, and there are different distribution rules according to holidays. For space, the charging load has a distribution characteristic like that of the charging station group. Based on this, the data feature with the largest degree of discrimination is selected based on the existing data to provide the basis for the application of random forest in charging prediction.
- (2)
- The proposed charging prediction algorithm of single station can effectively track the estimated charging capacity of the station every 15 min based on the actual recorded data. According to the simulation results, the prediction can reach a εMAPE of 9.76% and a εRMSE of 2.27. It can be used as a charging prediction method to provide reference for various EV charging load control strategies.
- (3)
- The proposed charging prediction algorithm of station group can effectively track the estimated daily charging capacity of different charging stations based on the actual recorded data. According to the simulation results of the optimized forest structure, the prediction can reach a εMAPE of 10.83% and a εRMSE of 39.59. Also, it can be used for practical application.
Author Contributions
Funding
Conflicts of Interest
References
- Shahidinejad, S.; Filizadeh, S.; Bibeau, E. Profile of Charging Load on the Grid Due to Plug-In Vehicles. IEEE Trans. Smart Grid. 2012, 3, 135–141. [Google Scholar] [CrossRef]
- Weckx, S.; Driesen, J. Load Balancing with EV Chargers and PV Inverters in Unbalanced Distribution Grids. IEEE Trans. Sustain. Energy. 2015, 6, 635–643. [Google Scholar] [CrossRef]
- Wei, D.; Zhang, C.; Bo, S. A Time-of-Use Price Based Multi-Objective Optimal Dispatching for Charging and Discharging of Electric Vehicles. Power Syst. Technol. 2014, 38, 2972–2977. [Google Scholar]
- Aziz, M.; Oda, T.; Mitani, T.; Watanabe, Y.; Kashiwagi, T. Utilization of Electric Vehicles and Their Used Batteries for Peak-Load Shifting. Energies 2015, 8, 3720–3738. [Google Scholar] [CrossRef] [Green Version]
- Zhang, W.; Zhang, D.; Mu, B.; Wang, L.Y.; Bao, Y.; Jiang, J.; Morais, H. Decentralized Electric Vehicle Charging Strategies for Reduced Load Variation and Guaranteed Charge Completion in Regional Distribution Grids. Energies 2017, 10, 147. [Google Scholar] [CrossRef]
- Chen, L.; Nie, Y.; Zhong, Q. A model for electric vehicle charging load forecasting based on trip chains. Trans. China Electrotech. Soc. 2015, 30, 216–225. [Google Scholar]
- Qian, K.; Zhou, C.; Allan, M.; Yuan, Y. Modeling of Load Demand Due to EV Battery Charging in Distribution Systems. IEEE Trans. Power Syst. 2011, 26, 802–810. [Google Scholar] [CrossRef]
- Madzharov, D.; Delarue, E.; D’Haeseleer, W. Integrating electric vehicles as flexible load in unit commitment modeling. Energy 2014, 65, 285–294. [Google Scholar] [CrossRef]
- Omran, N.G.; Filizadeh, S. Location-Based Forecasting of Vehicular Charging Load on the Distribution System. IEEE Trans. Smart Grid 2017, 5, 632–641. [Google Scholar] [CrossRef]
- Zhang, H.; Hu, Z.; Song, Y. A Prediction Method for Electric Vehicle Charging Load Considering Spatial and Temporal Distribution. Autom. Electr. Power Syst. 2014, 38, 13–20. [Google Scholar]
- Shao, Y.; Mu, Y.F.; Yu, X.D.; Dong, X.H.; Jia, H.J.; Wu, J.Z. A Spatial-temporal Charging Load Forecast and Impact Analysis Method for Distribution Network Using EVs-Traffic-Distribution Model. Proc. CSEE. 2017, 37, 5207–5219. [Google Scholar]
- Islam, M.S.; Mithulananthan, N.; Hung, D.Q. A Day-Ahead Forecasting Model for Probabilistic EV Charging Loads at Business Premises. IEEE Trans. Sustain. Energy. 2018, 9, 741–753. [Google Scholar] [CrossRef]
- Liu, Y.; Shi, J.; Yang, Y.; Lee, W. Short-Term Wind-Power Prediction Based on Wavelet Transform—Support Vector Machine and Statistic-Characteristics Analysis. IEEE Trans. Ind. Appl. 2012, 48, 1136–1141. [Google Scholar] [CrossRef]
- Jiao, R.; Zhang, T.; Jiang, Y.; He, H. Short-Term Non-Residential Load Forecasting Based on Multiple Sequences LSTM Recurrent Neural Network. IEEE Access 2018, 6, 59438–59448. [Google Scholar] [CrossRef]
- Huang, X.; Jie, C.; Chen, Y. Load Forecasting Method for Electric Vehicle Charging Station Based on Big Data. Autom. Electr. Power Syst. 2016, 40, 69–74. [Google Scholar]
- Guo, Q.; Wang, Y.; Sun, H.; Li, Z.; Xin, S.; Zhang, B. Factor Analysis of the Aggregated Electric Vehicle Load Based on Data Mining. Energies 2012, 5, 2053–2070. [Google Scholar] [CrossRef] [Green Version]
- Liu, W.; Xu, X.; Zhou, X. Daily load forecasting based on SVM for electric bus charging station. Electr. Power Autom. Equip. 2014, 34, 41–47. [Google Scholar]
- Wang, D.; Sun, Z. Big Data Analysis and Parallel Load Forecasting of Electric Power User Side. Proc. CSEE 2015, 35, 527–537. [Google Scholar]
- Wu, X.; He, J.; Yip, T.; Lu, J.; Lu, N. Power System Short-term Load Forecasting Based on Improved Random Forest with Grey Relation Projection. Autom. Electr. Power Syst. 2015, 39, 50–55. [Google Scholar]
- Wang, Y.; Xia, S.Q.; Wu, T.; Zhu, X. A Novel Consistent Random Forest Framework: Bernoulli Random Forests. IEEE Trans. Neural Netw. Learn. Syst. 2018, 29, 3510–3523. [Google Scholar] [PubMed]
- Zhang, W.; Quan, H. Dipti Srinivasan, Parallel and Reliable Probabilistic Load Forecasting via Quantile Regression Forest and Quantile Determination. Energy 2018, 160, 810–819. [Google Scholar] [CrossRef]
- Herrera, F. On the Use of MapReduce for Imbalanced Big Data Using Random Forest. Inf. Sci. 2014, 285, 112–137. [Google Scholar]
- Chen, F.; Deng, P.; Wan, J. Data Mining for the Internet of Things: Literature Review and Challenges. Int. J. Distrib. Sens. Net. 2015. [Google Scholar] [CrossRef]
- Che, J.; Wang, J. Short-term load forecasting using a kernel-based support vector regression combination model. Appl. Energy 2014, 132, 602–609. [Google Scholar] [CrossRef]
- Yang, Y.; Chen, W. Taiga: Performance Optimization of the C4.5 Decision Tree Construction Algorithm. Tsinghua Sci. Technol. 2016, 21, 415–425. [Google Scholar] [CrossRef]


| Type | Data name | Description | Symbol |
|---|---|---|---|
| Common feature | Year | Indicates the year | X9 |
| Month | Indicates the month | x7 | |
| Day | Specific date | x4 | |
| Activity indicator | 0–5 indicates the importance of activities | x2 | |
| Prosperity index | Show the quality of area facilities | x14 | |
| Unique characteristics of single charging station | Weekend symbol | 1/0 indicates whether it is a weekend | x13 |
| Holiday symbol | 1/0 indicates whether it is a holiday | x12 | |
| 15-min quantity | Time passed that day | x11 | |
| Charged amount | The amount of charge that day | X10 | |
| Unique characteristics of charging station group | Week symbol | From Monday to Sunday | x3 |
| Capacity indicator | Rated charging power of the station | x8 | |
| Longitude | longitude of the station | x6 | |
| Latitude | Latitude of the station | x5 | |
| Previous day’s charge | The amount of charge the day before | x1 | |
| Output | Charging capacity | Predict charge capacity every 15 min | y1 |
| Charging times | Predict charge times every 15 min | y2 |
| No. | Date | 15-min Quantity | True Value | Prediction |
|---|---|---|---|---|
| 1 | 6.26 | 33 | 62.79 | 64.20 |
| 2 | 6.25 | 17 | 42.67 | 40.22 |
| 3 | 6.25 | 59 | 33.14 | 33.15 |
| 4 | 6.24 | 10 | 29.36 | 27.45 |
| 5 | 6.24 | 80 | 23.01 | 22.82 |
| 6 | 6.22 | 56 | 28.79 | 28.53 |
| 7 | 6.18 | 34 | 60.03 | 57.38 |
| 8 | 6.17 | 64 | 25.25 | 25.94 |
| 9 | 6.14 | 4 | 11.36 | 12.70 |
| 10 | 6.14 | 71 | 8.84 | 14.36 |
| εMAPE | 9.76% | |||
| εRMSE | 2.27 | |||
| No. | True Value | RF_Prediction2 | SVR_Prediction | C4.5_Prediction |
|---|---|---|---|---|
| 1 | 36.5 | 28.8 | 34.8 | 36.9 |
| 2 | 19.8 | 20.1 | 18.3 | 25.6 |
| 3 | 26.8 | 27.2 | 32.5 | 34.7 |
| 4 | 27.4 | 24.8 | 33.0 | 15.9 |
| 5 | 66.0 | 67.5 | 20.1 | 54.2 |
| 6 | 11.9 | 18.3 | 34.7 | 15.2 |
| 7 | 18.4 | 21.2 | 30.2 | 14.8 |
| 8 | 288.9 | 249.9 | 33.3 | 276.0 |
| 9 | 149.9 | 147.2 | 32.7 | 143.5 |
| 10 | 31.8 | 29.3 | 34.8 | 25.6 |
| εMAPE | 12.8% | 55.5% | 19.5% | |
| εRMSE | 12.85 | 90.50 | 7.98 | |
© 2018 by the authors. Licensee MDPI, Basel, Switzerland. This article is an open access article distributed under the terms and conditions of the Creative Commons Attribution (CC BY) license (http://creativecommons.org/licenses/by/4.0/).
Share and Cite
Lu, Y.; Li, Y.; Xie, D.; Wei, E.; Bao, X.; Chen, H.; Zhong, X. The Application of Improved Random Forest Algorithm on the Prediction of Electric Vehicle Charging Load. Energies 2018, 11, 3207. https://doi.org/10.3390/en11113207
Lu Y, Li Y, Xie D, Wei E, Bao X, Chen H, Zhong X. The Application of Improved Random Forest Algorithm on the Prediction of Electric Vehicle Charging Load. Energies. 2018; 11(11):3207. https://doi.org/10.3390/en11113207
Chicago/Turabian StyleLu, Yiqi, Yongpan Li, Da Xie, Enwei Wei, Xianlu Bao, Huafeng Chen, and Xiancheng Zhong. 2018. "The Application of Improved Random Forest Algorithm on the Prediction of Electric Vehicle Charging Load" Energies 11, no. 11: 3207. https://doi.org/10.3390/en11113207
APA StyleLu, Y., Li, Y., Xie, D., Wei, E., Bao, X., Chen, H., & Zhong, X. (2018). The Application of Improved Random Forest Algorithm on the Prediction of Electric Vehicle Charging Load. Energies, 11(11), 3207. https://doi.org/10.3390/en11113207