Article

PV Module Monitoring System Based on Low-Cost Solutions: Wireless Raspberry Application and Assessment

by
José Miguel Paredes-Parra
1,
Antonio Mateo-Aroca
2,
Guillermo Silvente-Niñirola
3,
María C. Bueso
4 and
Ángel Molina-García
3,*
1
Technological Center for Energy and Environment (CETENMA), 30353 Cartagena, Spain
2
Department of Electronic Technology, Universidad Politécnica de Cartagena, 30202 Cartagena, Spain
3
Department of Electrical Engineering, Universidad Politécnica de Cartagena, 30202 Cartagena, Spain
4
Department of Applied Mathematics and Statistics, Universidad Politécnica de Cartagena, 30202 Cartagena, Spain
*
Author to whom correspondence should be addressed.
Energies 2018, 11(11), 3051; https://doi.org/10.3390/en11113051
Submission received: 20 September 2018 / Revised: 19 October 2018 / Accepted: 28 October 2018 / Published: 6 November 2018

Abstract

:
The integration of renewables into power systems has led to multiple studies and analysis in terms of grid-power quality, reliability, and/or feasibility. Among different resources to be considered as alternative energy systems, wind and solar emerge as the most mature technologies. With regard to photovoltaic (PV) installations, monitoring problems requires detailed analysis, since solar-radiation fluctuations, soiling on solar panels, or deficiency of PV-panel performance can involve unexpected power-output oscillations and, subsequently, undesirable power-generation oscillations. Under this framework, this paper describes and assesses a wireless low-cost PV-module monitoring system based on open-source solutions. Our proposal allows us to monitor installations at the PV-module level, giving detailed information regarding PV power-plant performance. The proposed monitoring system is based on the IEC-61724 standard requirements, as a flexible and ad hoc solution with relevant connectivity options. Meteorological and electrical data are collected from the developed nodes and available for subsequent analysis. Detailed information of the solution, as well as extensive results collected in Spanish PV power plants connected to the grid, are also included in the paper.

1. Introduction

Most developed countries have promoted policies and initiatives to achieve sustainability by reducing energy dependence and emissions. These initiatives aim to limit climate change and lead to a decarbonized energy system [1]. Indeed, the deployment of renewables and energy efficiency are considered key agents to fulfilling emission reductions and conforming to the Paris Agreement objectives [2]. In addition, this general situation, combined with the rapid cost decrease of renewable technologies (mainly photovoltaic (PV) installations—the price of solar PV modules was reduced by around 85% from 2010 to 2015 [3]), has promoted the rise of renewable-solution deployment and investment. As an example, the renewable sector globally added 167 GW of new generation capacity in 2017. This accounts for a growth of 8.3% over the previous year, maintaining similar rates since 2010, with 8–9% on average per year. This target has been mainly achieved as a result of new PV solar installations and wind power plants connected to the grid. In 2017, 94 GW were added from PV power plants and 47 GW from wind power plants, including 4 GW from offshore wind power plants [4]. Best et al. [5] affirms that solar and wind resources are on the upper rungs of the energy ladder, their integration being predominant in higher-income countries. Recent contributions, focused on future electricity systems, also assume that renewable assets can be considered a mix between wind- and solar-power generation [6]. In [7], and apart from wind and PV solar deployment, a slight increase has been estimated during the past few years for other renewable energy sources for electricity. In addition, Ellabban et al. [8] establishes a direct connection between technological maturity and economic barriers, mainly when the cost of a technology is above the cost of other competing alternatives. Therefore, wind and PV solar resources are currently the most integrated renewable energy sources into power systems, excluding hydropower-generation units. Nevertheless, there are no large-area power systems in the world where wind and solar power generate more than 50% of electricity [9].
The integration of wind and PV power plants into power systems involves certain technical problems, mainly focused on reliability, power quality, and stability [10]. The intermittent nature of such sources may increase grid stress, mainly due to undesirable oscillations on the supply side [11] that may affect voltage regulation of transmission systems [12]. At a low/medium-voltage level, different reactive power control strategies have also been proposed to facilitate renewables integration [13], including active power curtailment [14]. As an additional solution to guarantee a balance between generation and demand, with reduced capacity and costs of operating reserves [15], short-term forecasting of PV production emerges as a relevant topic of interest. In fact, several methods for forecasting PV power over a short-term horizon can be found in the specific literature [16,17,18]. These methods depend on weather conditions and previous PV power-production data. Therefore, updated weather and electric values would allow us to more accurately forecast short-term PV power production. Moreover, real-time monitoring technologies can provide relevant local and accurate information to ensure the control and reliability of the grid [19]. To achieve these goals, and according to Colak et al. [20], current power systems should be modernized in terms of sensing, communication, measurement, and automation technologies.
With regard to PV monitoring systems, prior efforts can be found in the specific literature. Low-cost solutions have been considered as a priority during the last decade, proposing different monitoring and communication systems. In [21], a low-cost microcontroller-based data-acquisition system (DAQS) for remote PV water-pumping systems is proposed. Communications are based on the GSM network and, in particular, on the Short text-Message Service (SMS). Contributions that focused on power-line communication (PLC) modules can be also found in the specific literature. In [22], a PLC compliant with HomePlug is proposed to monitor each PV module. Another example based on a PLC module is evaluated in [23], where four PV panels are simultaneously monitored. Nevertheless, recent contributions affirm that the level of noise in a power-line network is considered much higher than any other type of communication network [24]. A semiautomated solution for testing and monitoring PV-module performances is described in [25]. A modified rheostat is used to estimate the I-V characteristics of a PV module. Communication between nodes is carried out through a wired RS485 communication protocol, and a solution is built around wired/wireless devices and the Internet of Things (IoT), a concept that is described in [26]. PV installation is monitored at the inverter level. An extensive comparison of monitoring and transmission systems is also included in this contribution. Another solution based on wired/wireless sensor-network technologies for in situ solar-panel monitoring is discussed in [27]. The proposed architecture used low-cost open-source tools based on an Arduino platform, including wireless ZigBee connectivity. ZigBee-based wireless technology is also proposed in [28] to provide online monitoring systems for PV power plants connected to the grid. An overview of ZigBee devices and modules is described in [29], including a PV energy system belonging to a water treatment and distribution company. Evaluation of measurement accuracy is discussed in [30]. A recent review of PV monitoring systems can be found in [31], mainly focused on low-cost monitoring proposals. A detailed overview of PV monitoring-system components, such as sensors, controllers, data transmission, and storage solutions, is also included in this work.
According to previous works and contributions of the authors in PV monitoring [32], this paper proposes a flexible, low-cost, and user-friendly monitoring system based on open-source prototyping boards for PV power plants according to the IEC-61724 standard requirements. The main contributions of this paper are summarized as follows:
  • PV installations are monitored at the PV-module level according to the current IEC-61724 standard, estimating PV-module performances and providing predictive maintenance.
  • Low-cost and open-source wireless solutions are used to facilitate the integration of the proposed system in PV power plants.
  • The wireless solution is flexible and can be adapted according to the layout and configuration of the PV modules.
The rest of the paper is structured as follows: Section 2 gives a detailed description about the proposed low-cost monitoring solution. Section 3 describes experimental field tests carried out in a Spanish PV installation connected to the grid. Extensive results and assessment of the proposed solution are also included in this section. Finally, the conclusion is given in Section 4.

2. Proposed Low-Cost Solution

2.1. Preliminaries

This monitoring system aims to collect electrical and environmental data at the PV-module level. In addition, it allows us to evaluate PV-module performance and identify abnormal behaviors. The proposed solution is in line with one of the most relevant references for PV system monitoring, standard IEC 61724: ’Photovoltaic system performance monitoring. Guidelines for measurement data exchange and analysis’. Recent contributions based on this IEC standard can be found in [33], where a battery monitoring system based on the IoT is proposed. This IEC describes the general guidelines for monitoring and analysis of PV power-plant performance. Parameters to be monitored concerning grid-connected PV power plants are summarized in Table 1. According to this standard, the proposed system architecture is also addressed to meet flexibility and scalability requirements for different types of PV installations. Indeed, it can be implemented on PV modules independent of their configuration. Additionally, the selected wireless-distributed architecture allows us to modify nodes according to the layout of the PV modules without any additional wiring. Under this flexible wireless topology, the selected hardware is based on the Arduino and Raspberry Pi platforms. They are well-known low-cost, open-source, and extensible-prototyping solutions, allowing us to provide a detailed monitoring system at PV-module level.
Arduino was initially proposed for educational development and subsequently extended for commercial purposes. Arduino boards usually involve an onboard power supply, USB ports, and an ATMEL microcontroller chip. It provides communication and control support, avoiding sophisticated PCB design and implementation. A large variety of sensors and additional components can be integrated through custom library and drive support by the manufacturers. Arduino platforms have recently been proposed in other data-collection efforts, including embedding wireless sensor networks [34,35]. On the other hand, Raspberry Pi [36] is a credit card-sized ARM-based single-board computer (SBC). It was initially proposed by the Raspberry Pi Foundation [37] to support computer-programming learning. This initial objective was extended toward a great number of applications, mainly due to the advantages in terms of low cost, full customization, and excellent scalability. Nowadays, a relevant number of solutions can be found in the specific literature. Recent projects based on Raspberry Pi equipment and focused on real-time data-monitoring purposes are proposed in [38,39,40]. A recent review of energy-management systems for homes based on the current IoT era can be found in [41]. In addition, low cost, high accuracy, and great flexibility solutions for wireless industrial-energy monitoring platforms are presented in [42].

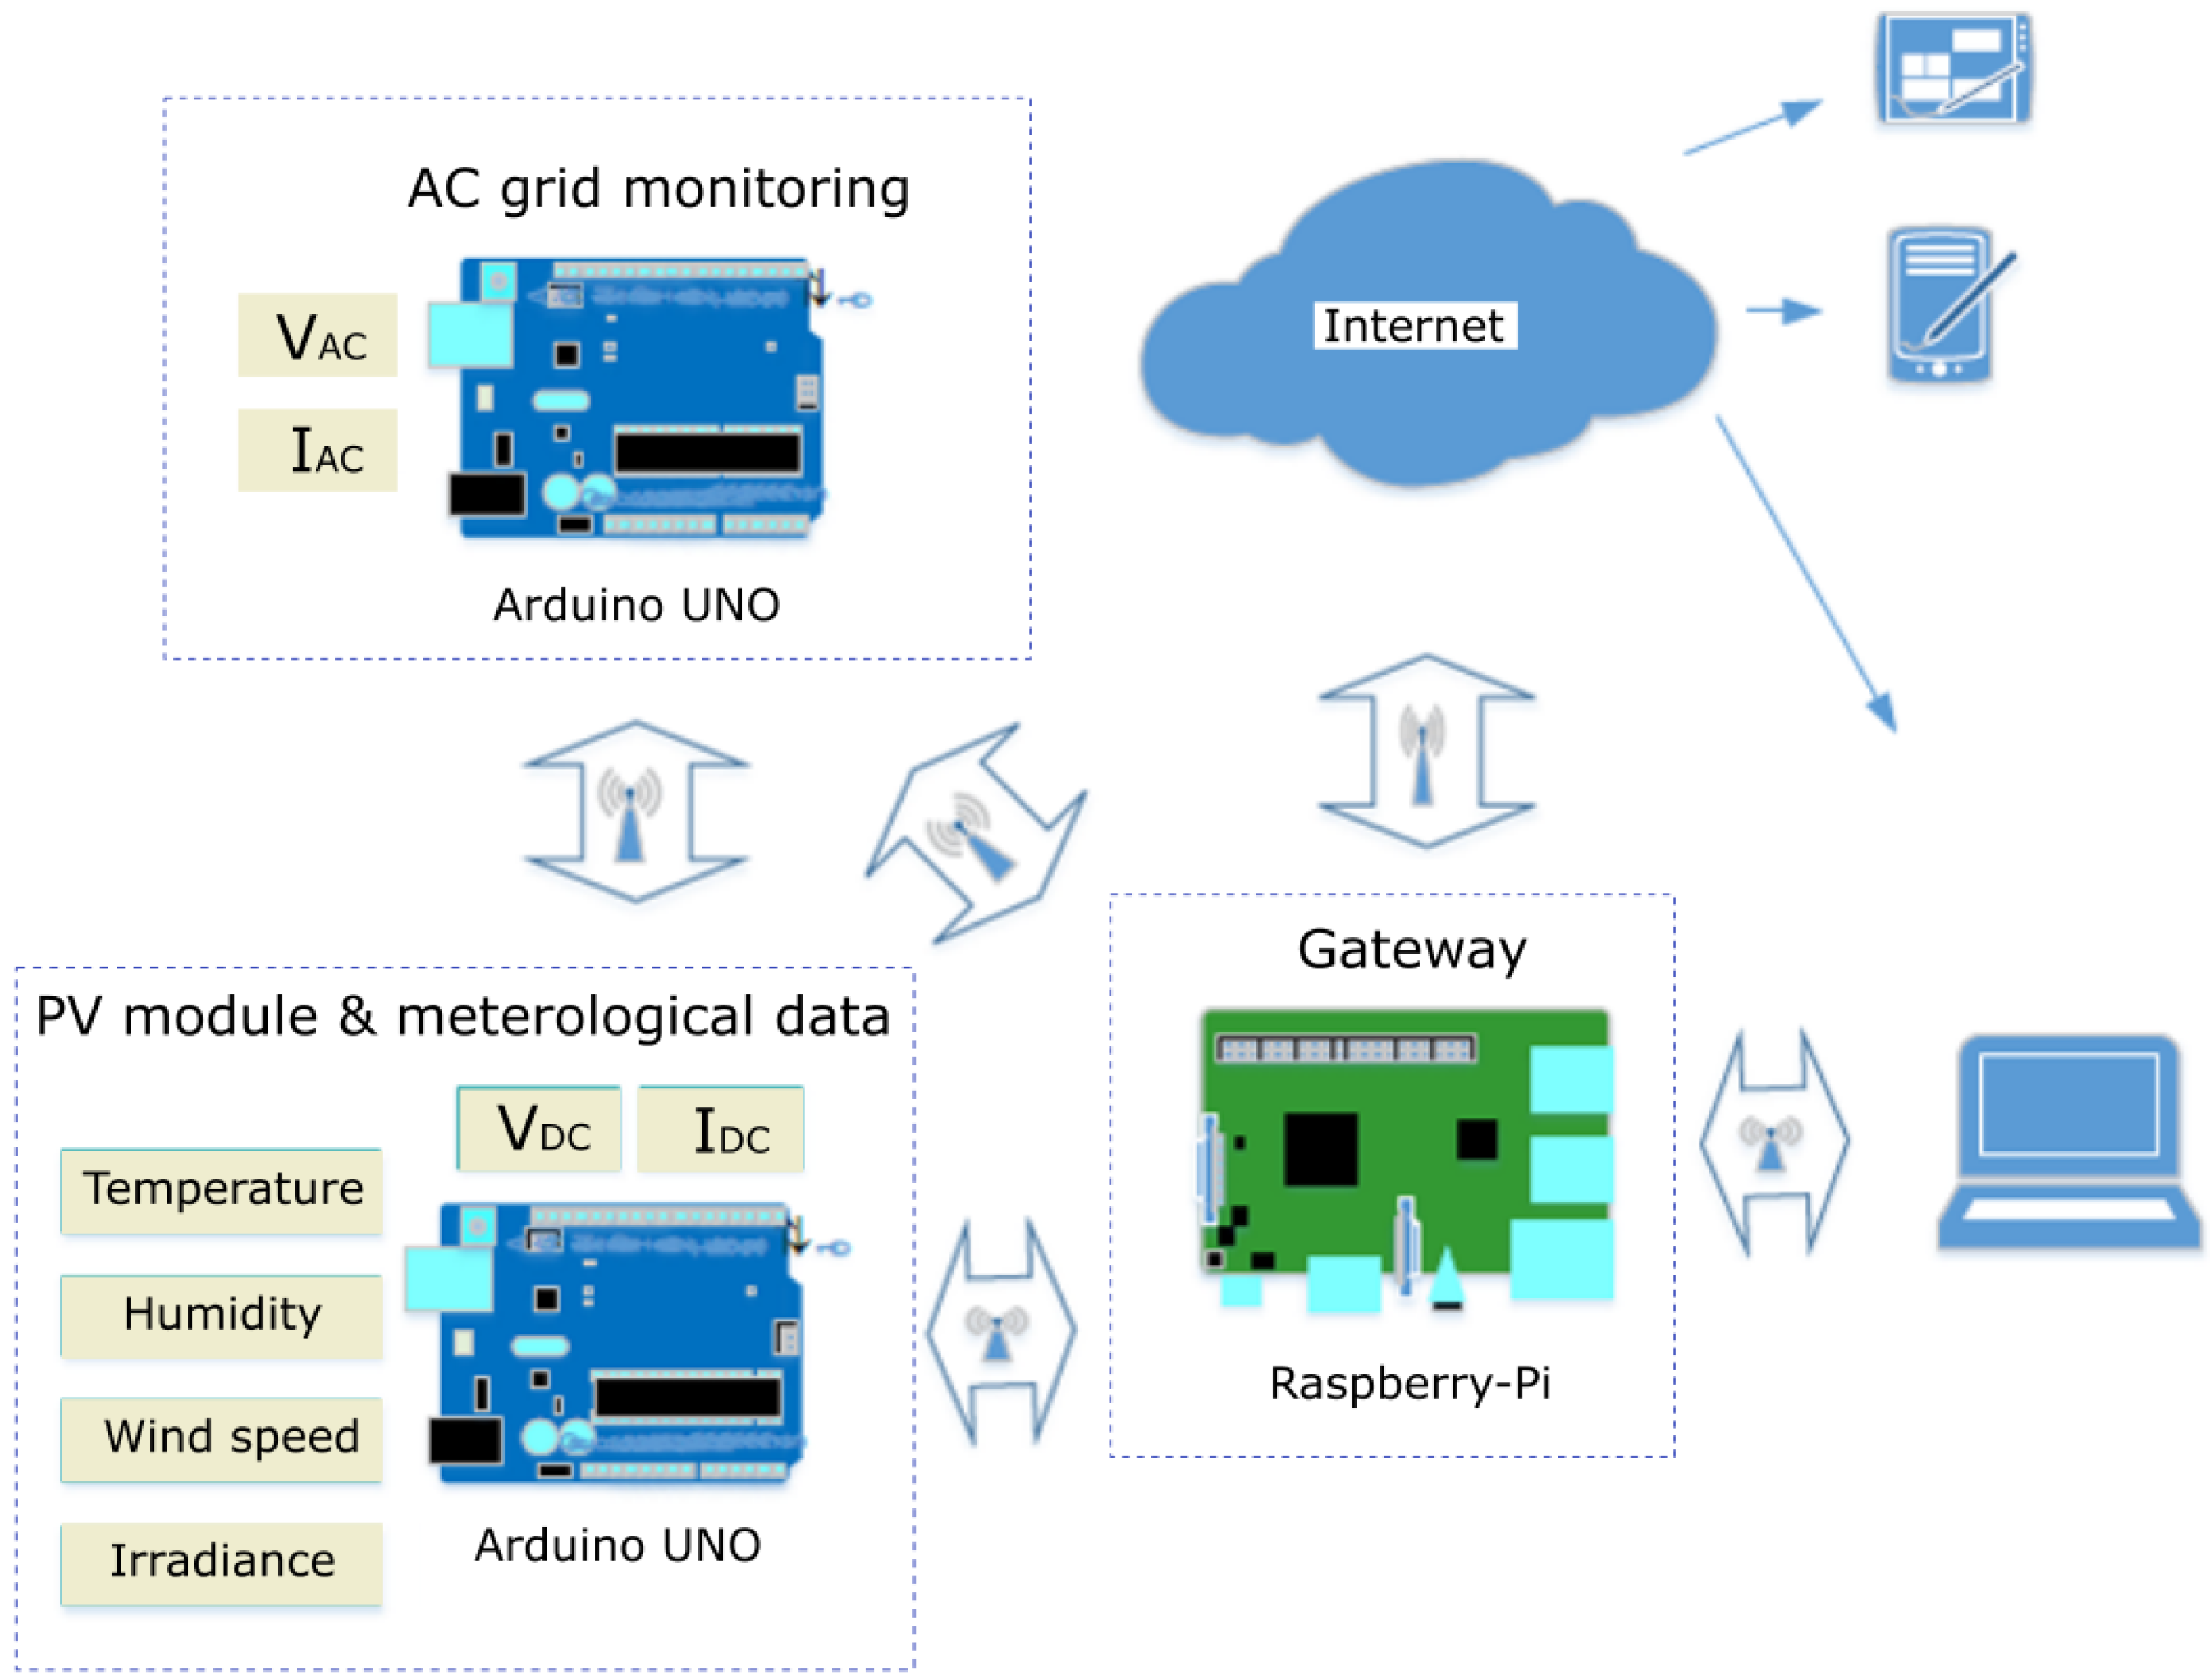
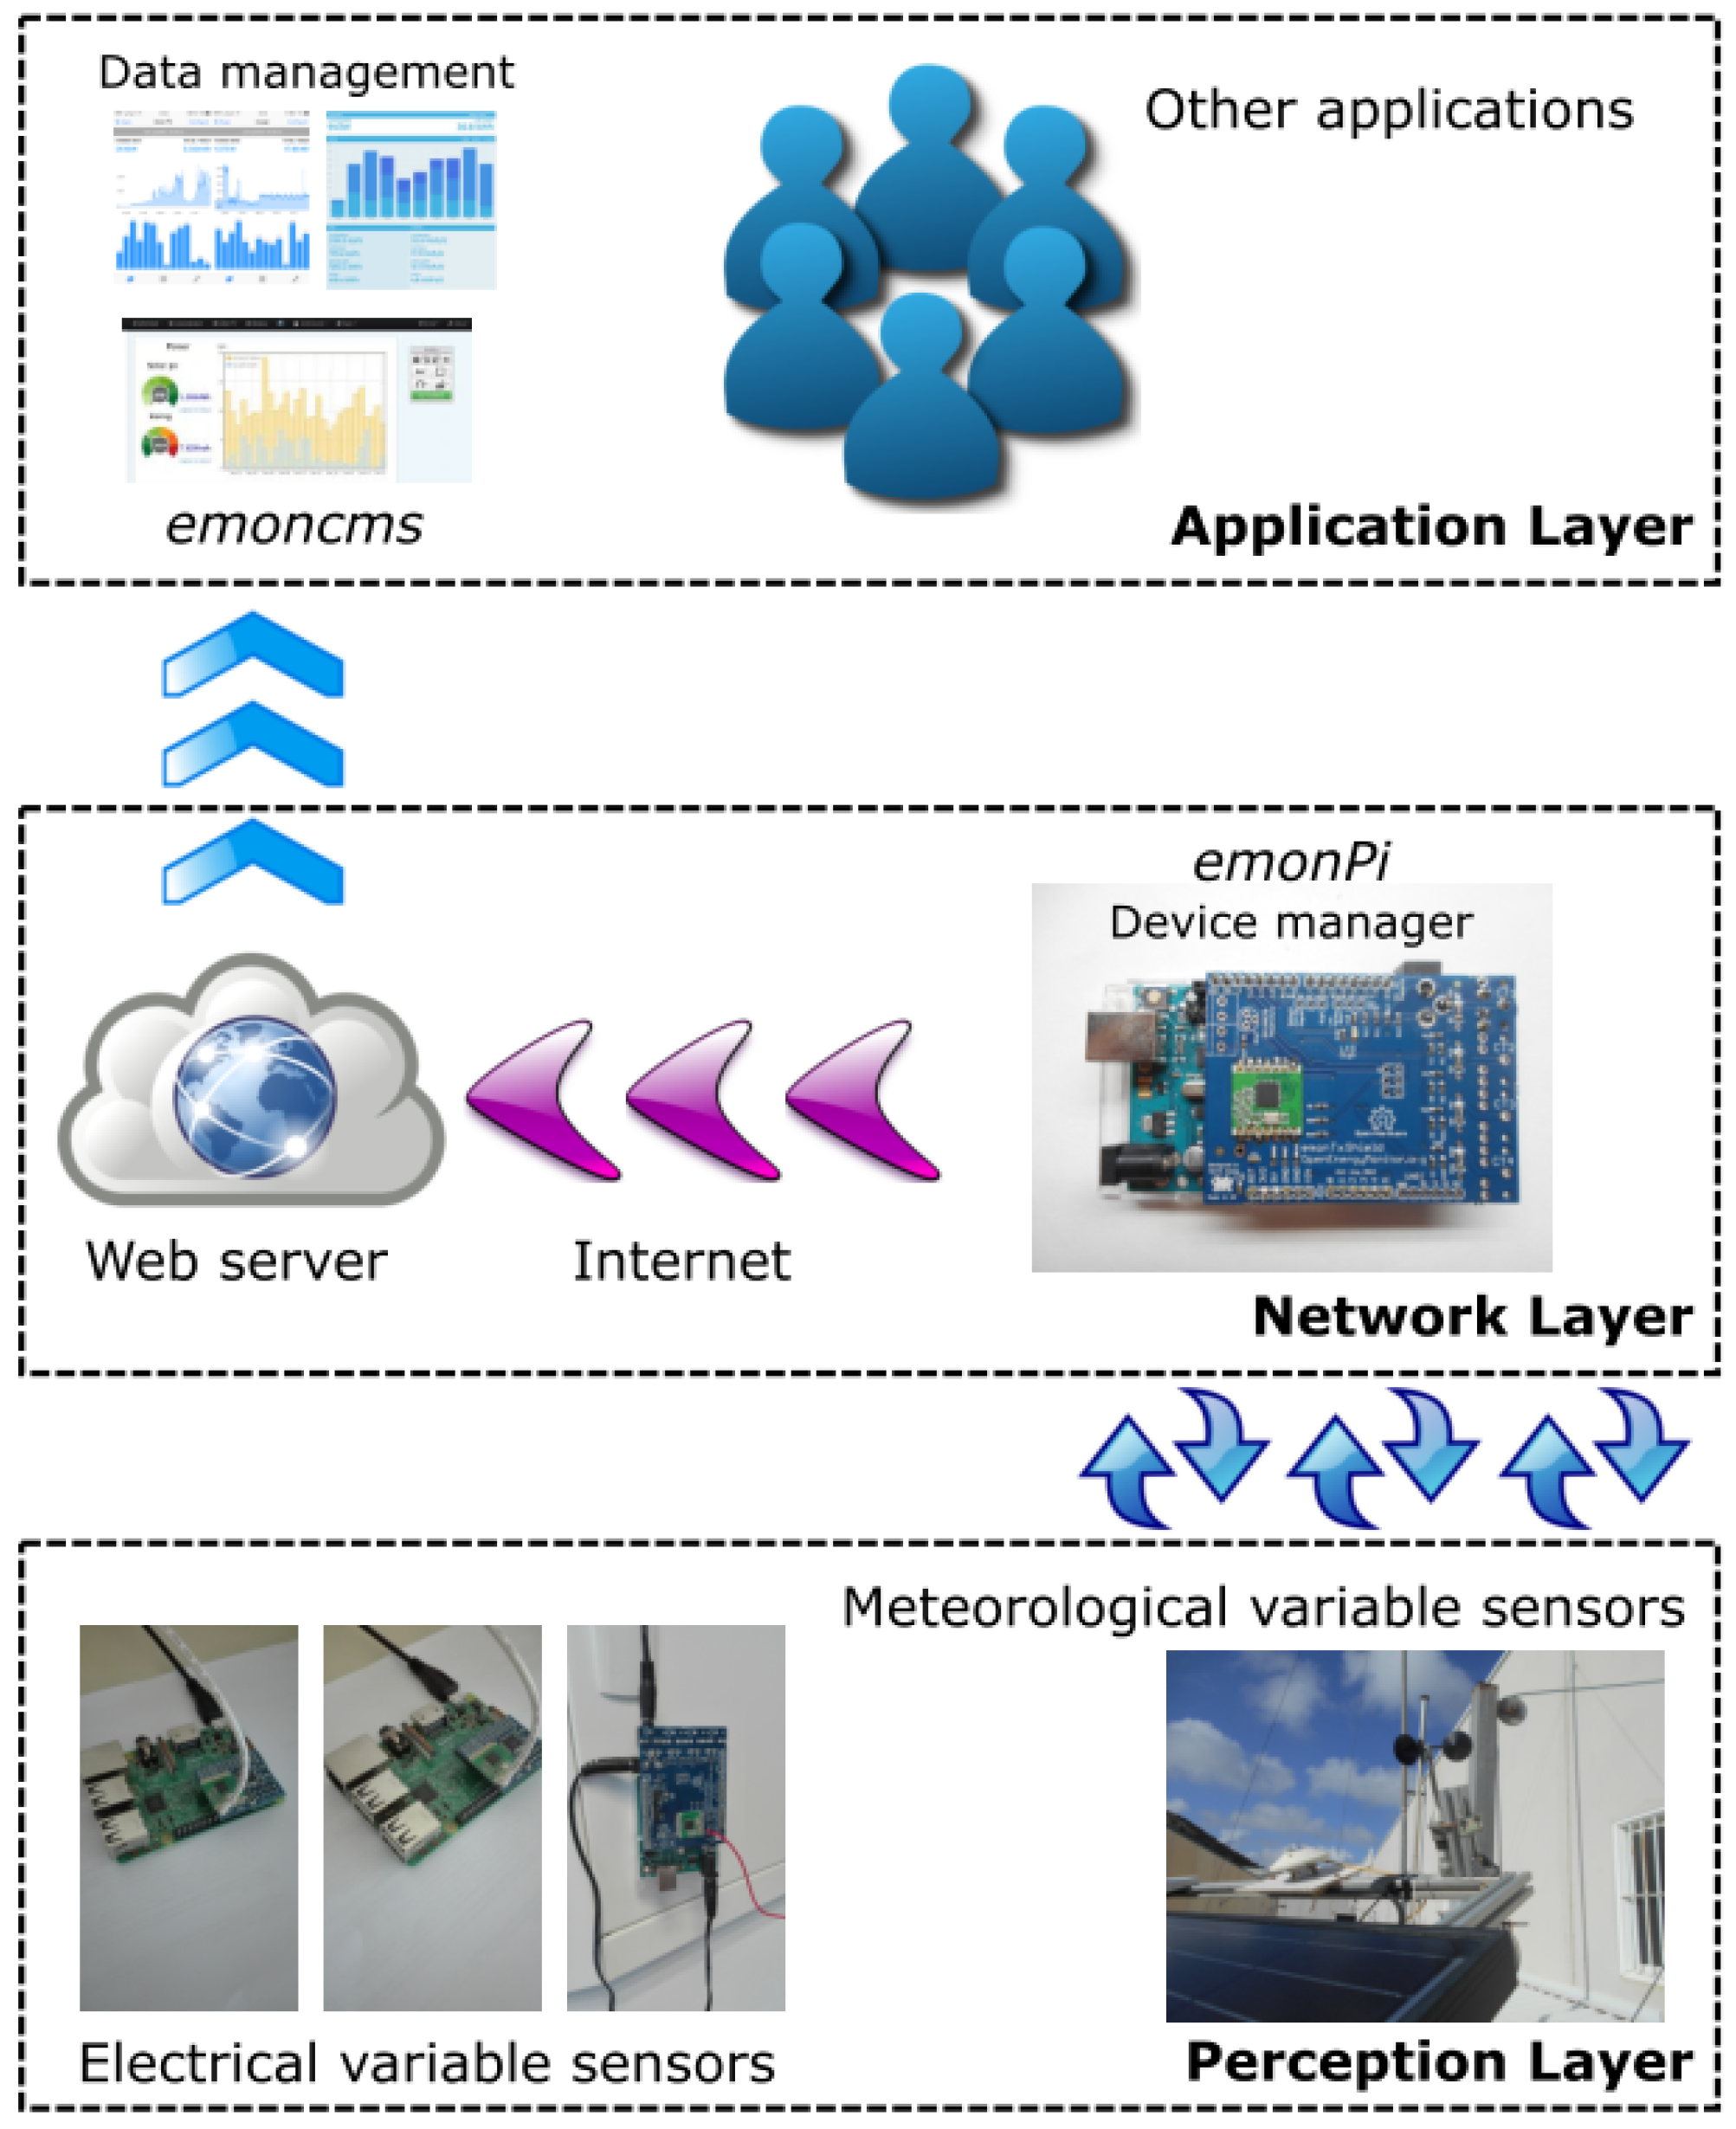
2.2. General Architecture

Figure 1 shows an example of the general architecture, where electrical and environmental nodes are schematically depicted. These nodes are based on Arduino UNO technology, including wireless communication. It is a flexible solution, adaptable under different PV module configurations and arrays. Both environmental and DC electrical data at the PV-module level are then collected and sent to the sink node, based on Raspberry Pi technology. This sink node allows us to collect parameters at the inverter level, depending on different PV power-plant configurations. These collected data are sent to a gateway, providing subsequent analysis and monitoring applications.
To offer an open-source and low-cost solution, the prototype was based on OpenEnergyMonitor equipment [43]. OpenEnergyMonitor is a recent open-source project with different solutions, mainly focused on home energy-monitoring applications. Designs and codes are available online, and they are supported by a relevant community of developers. This solution includes Arduino technology for sensors and the data-collecting process, and Raspberry Pi equipment as a server for wireless communications (433 MHz RF). For RF data transmission, a HopeRF RFM69CW module is included [44]. This RF module offers low power demand and low transmission costs, and it is suitable for the proposed system where data exchanges between sensor nodes and the gateway are frequently required. Figure 2 shows examples of the assembled node and the corresponding gateway based on Raspberry-Pi solutions.

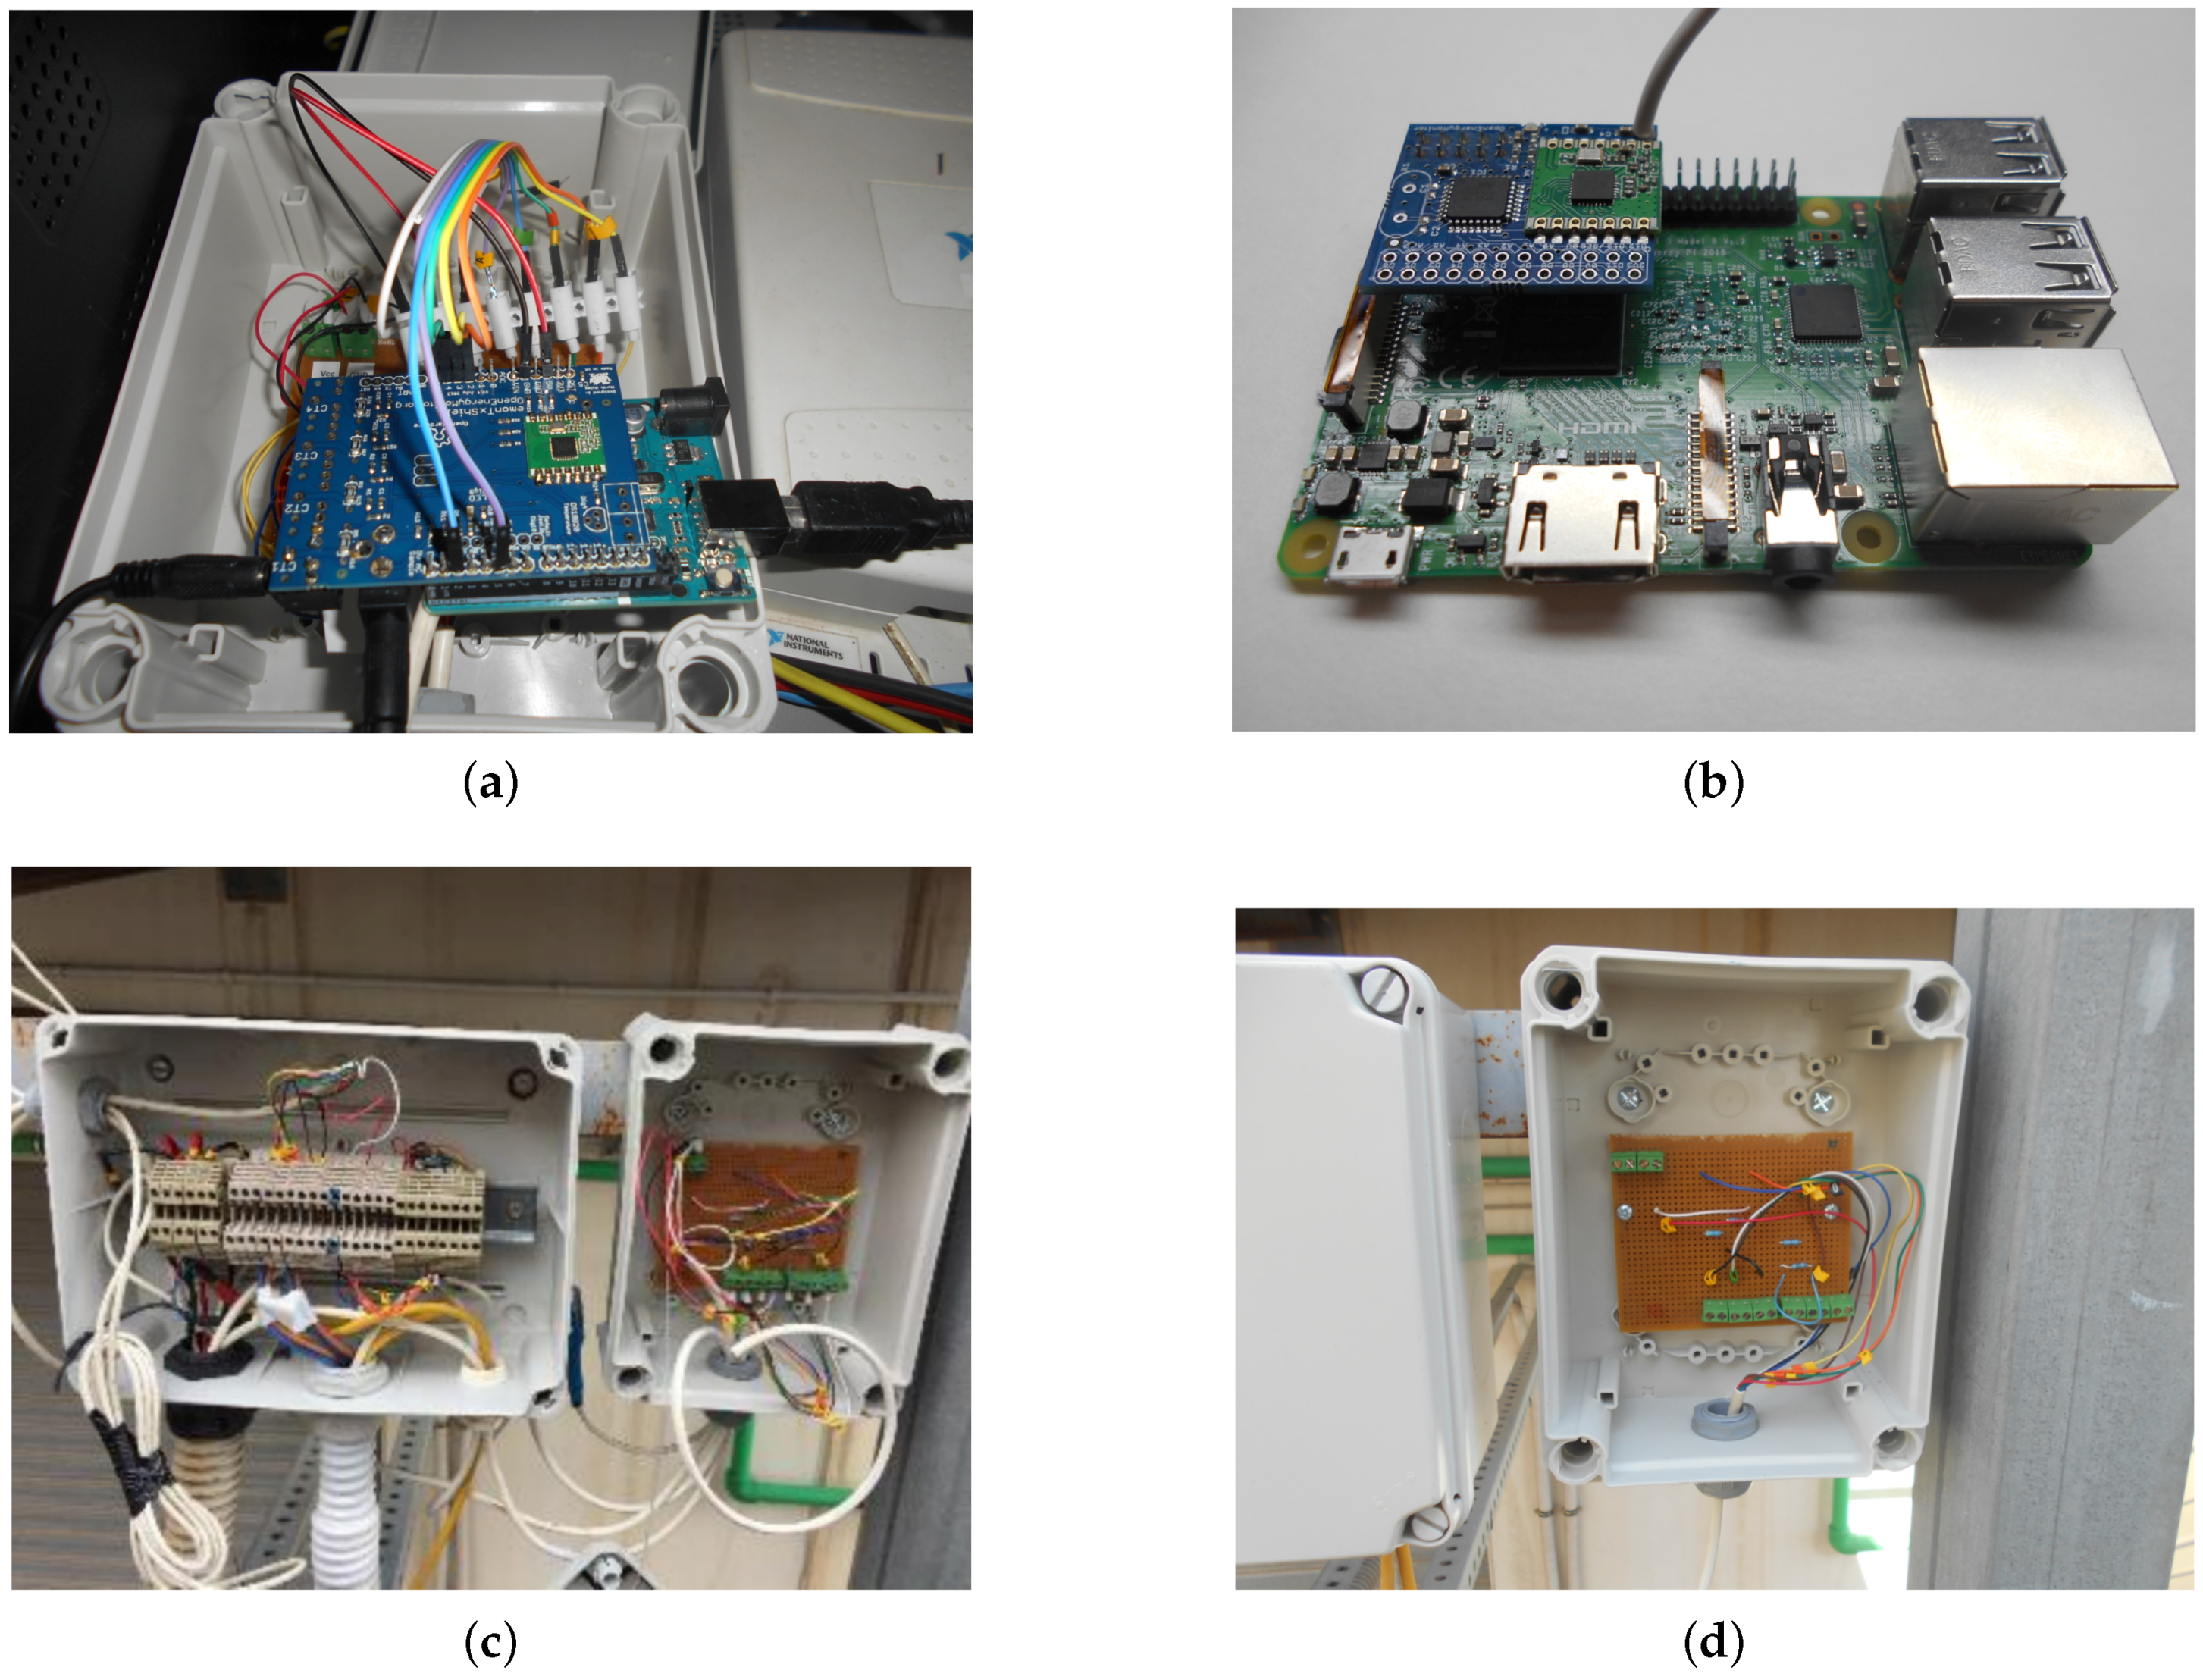
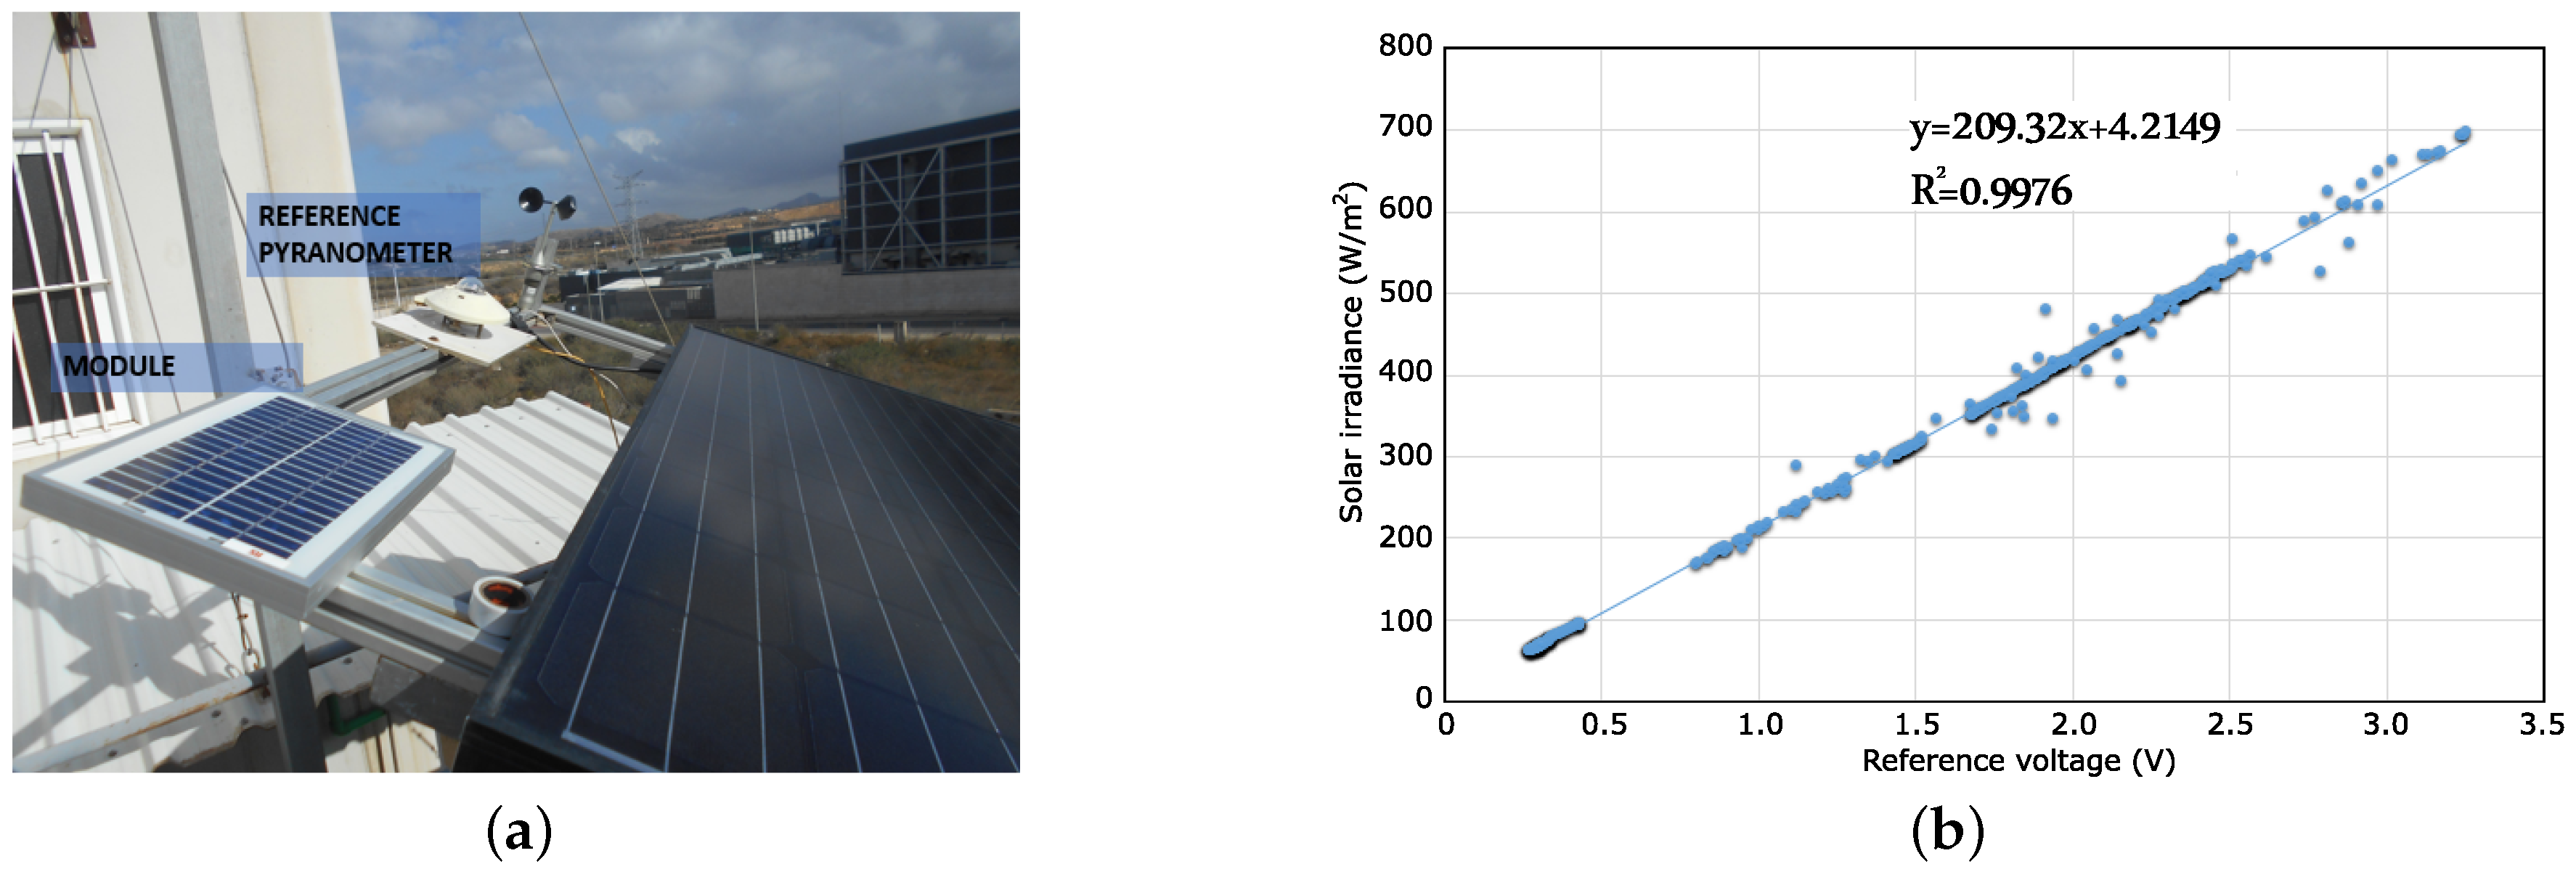
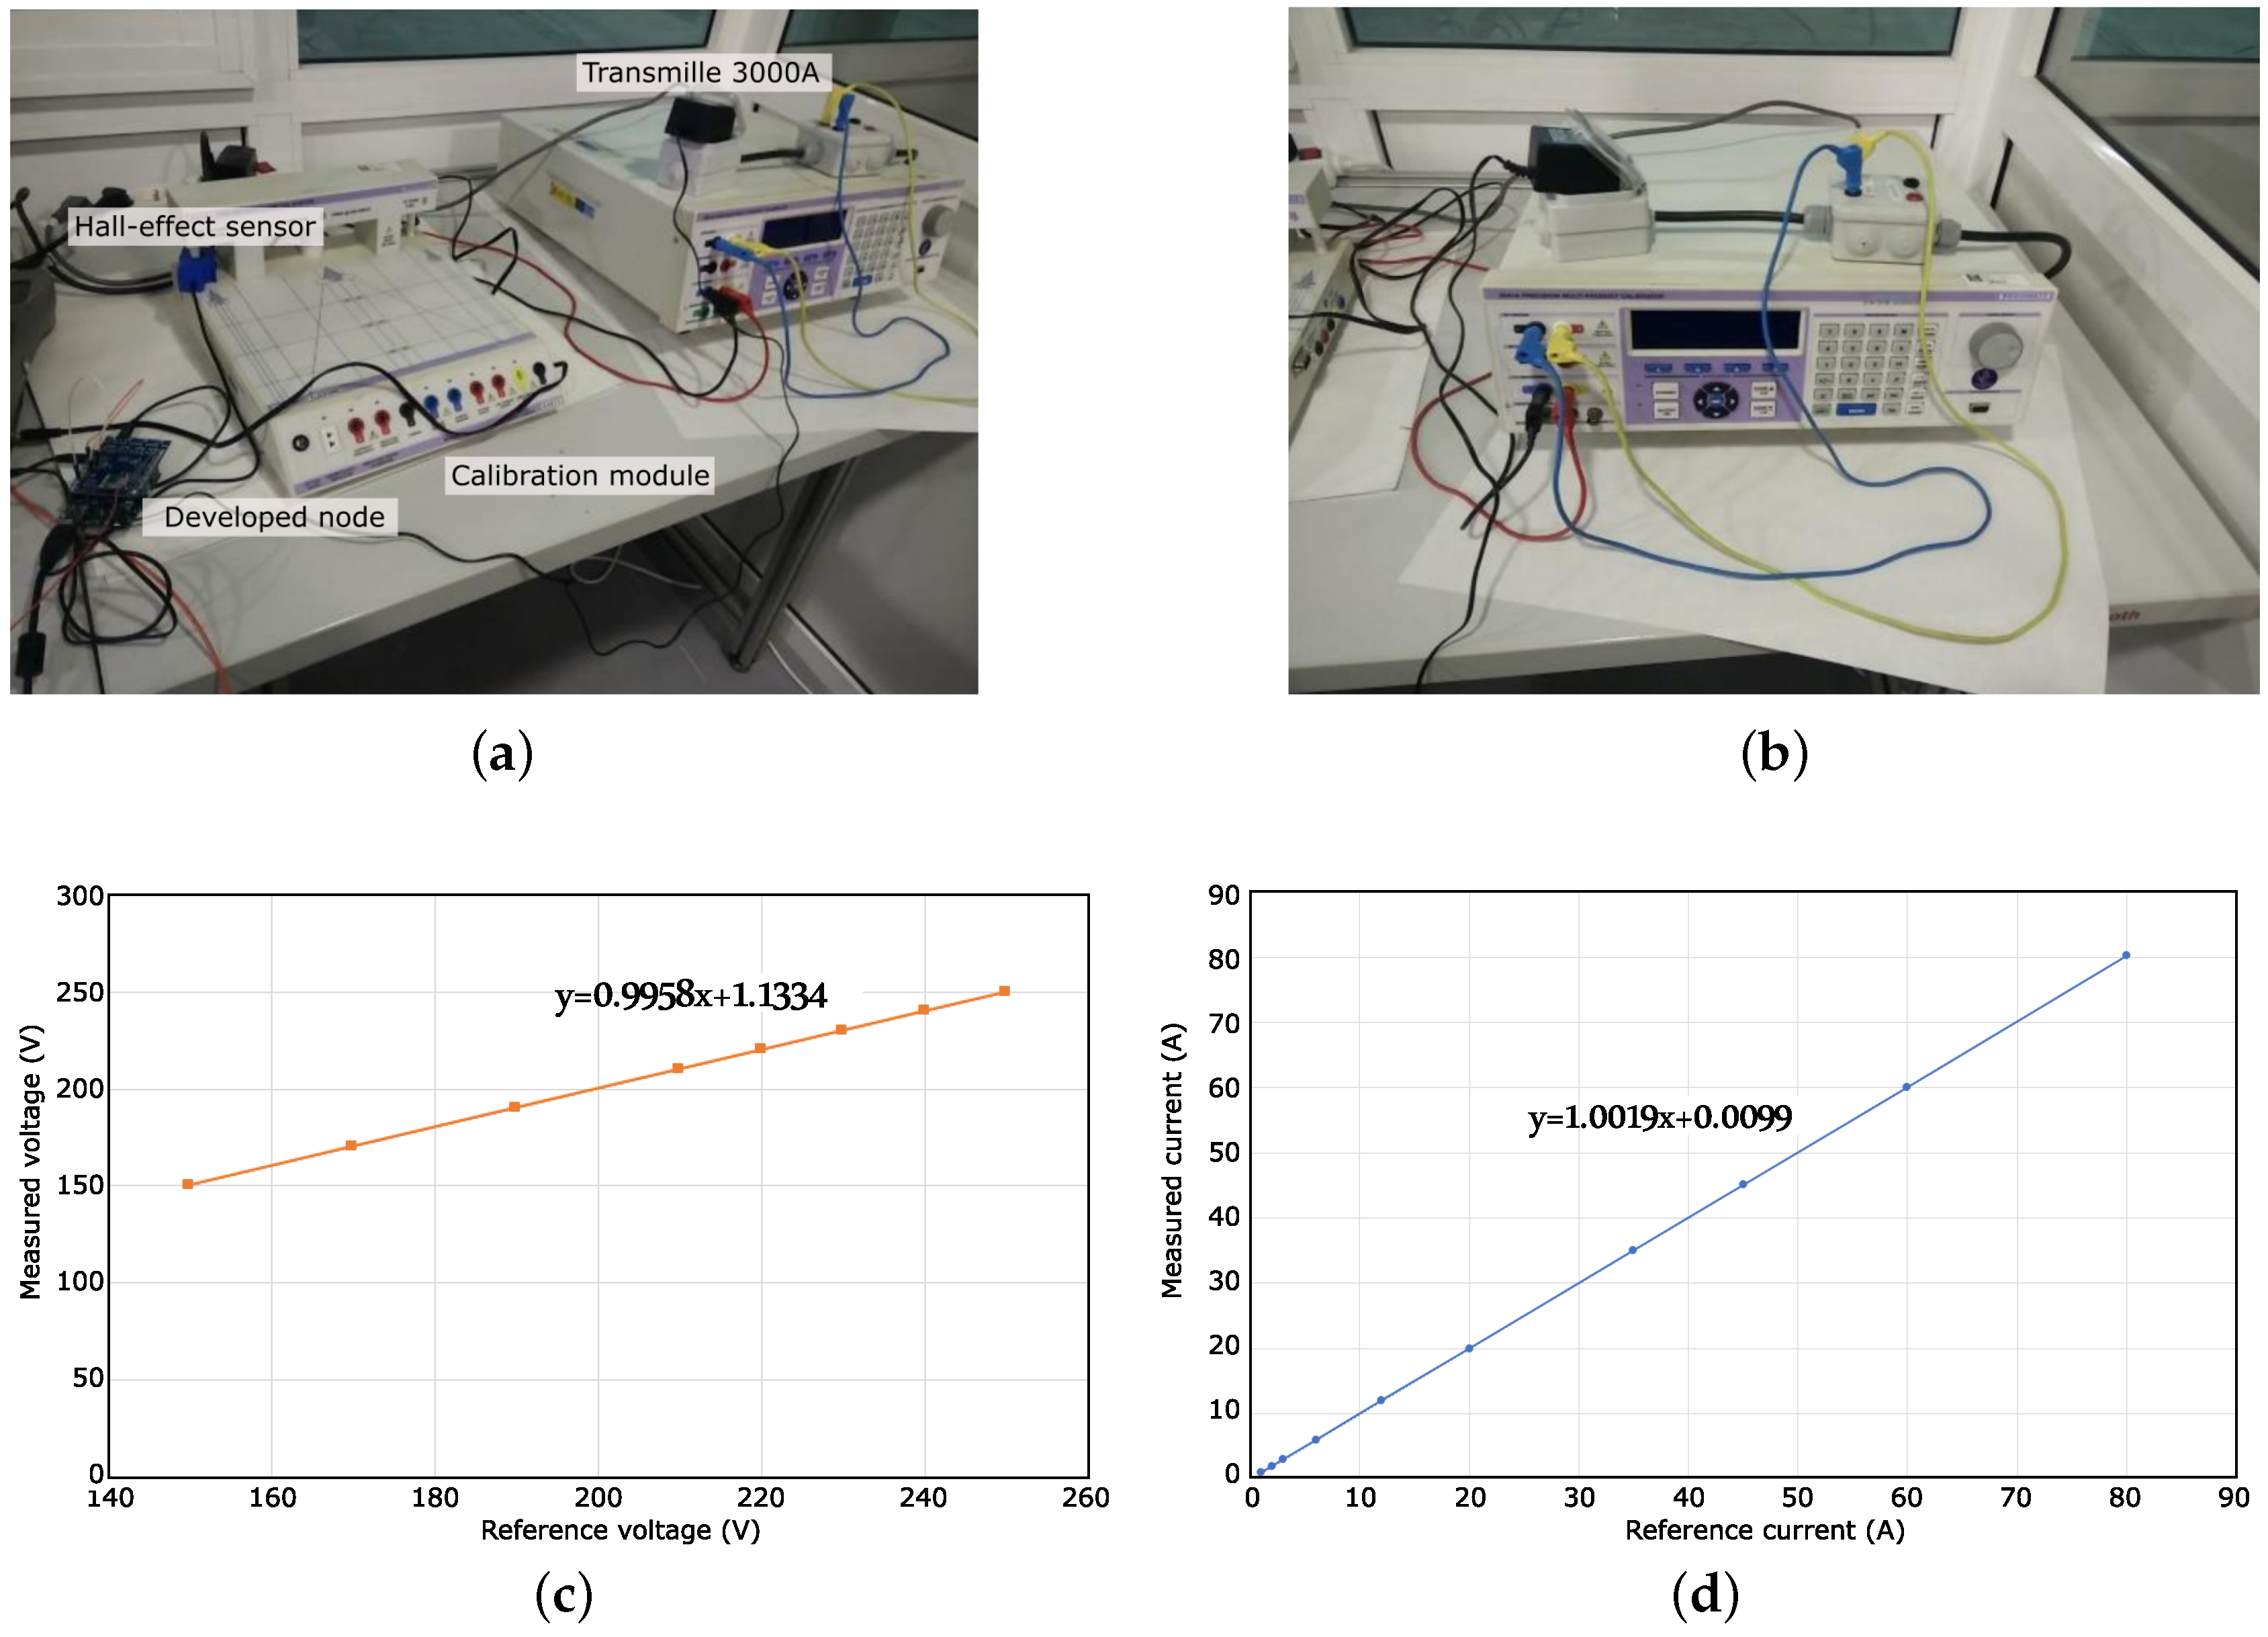
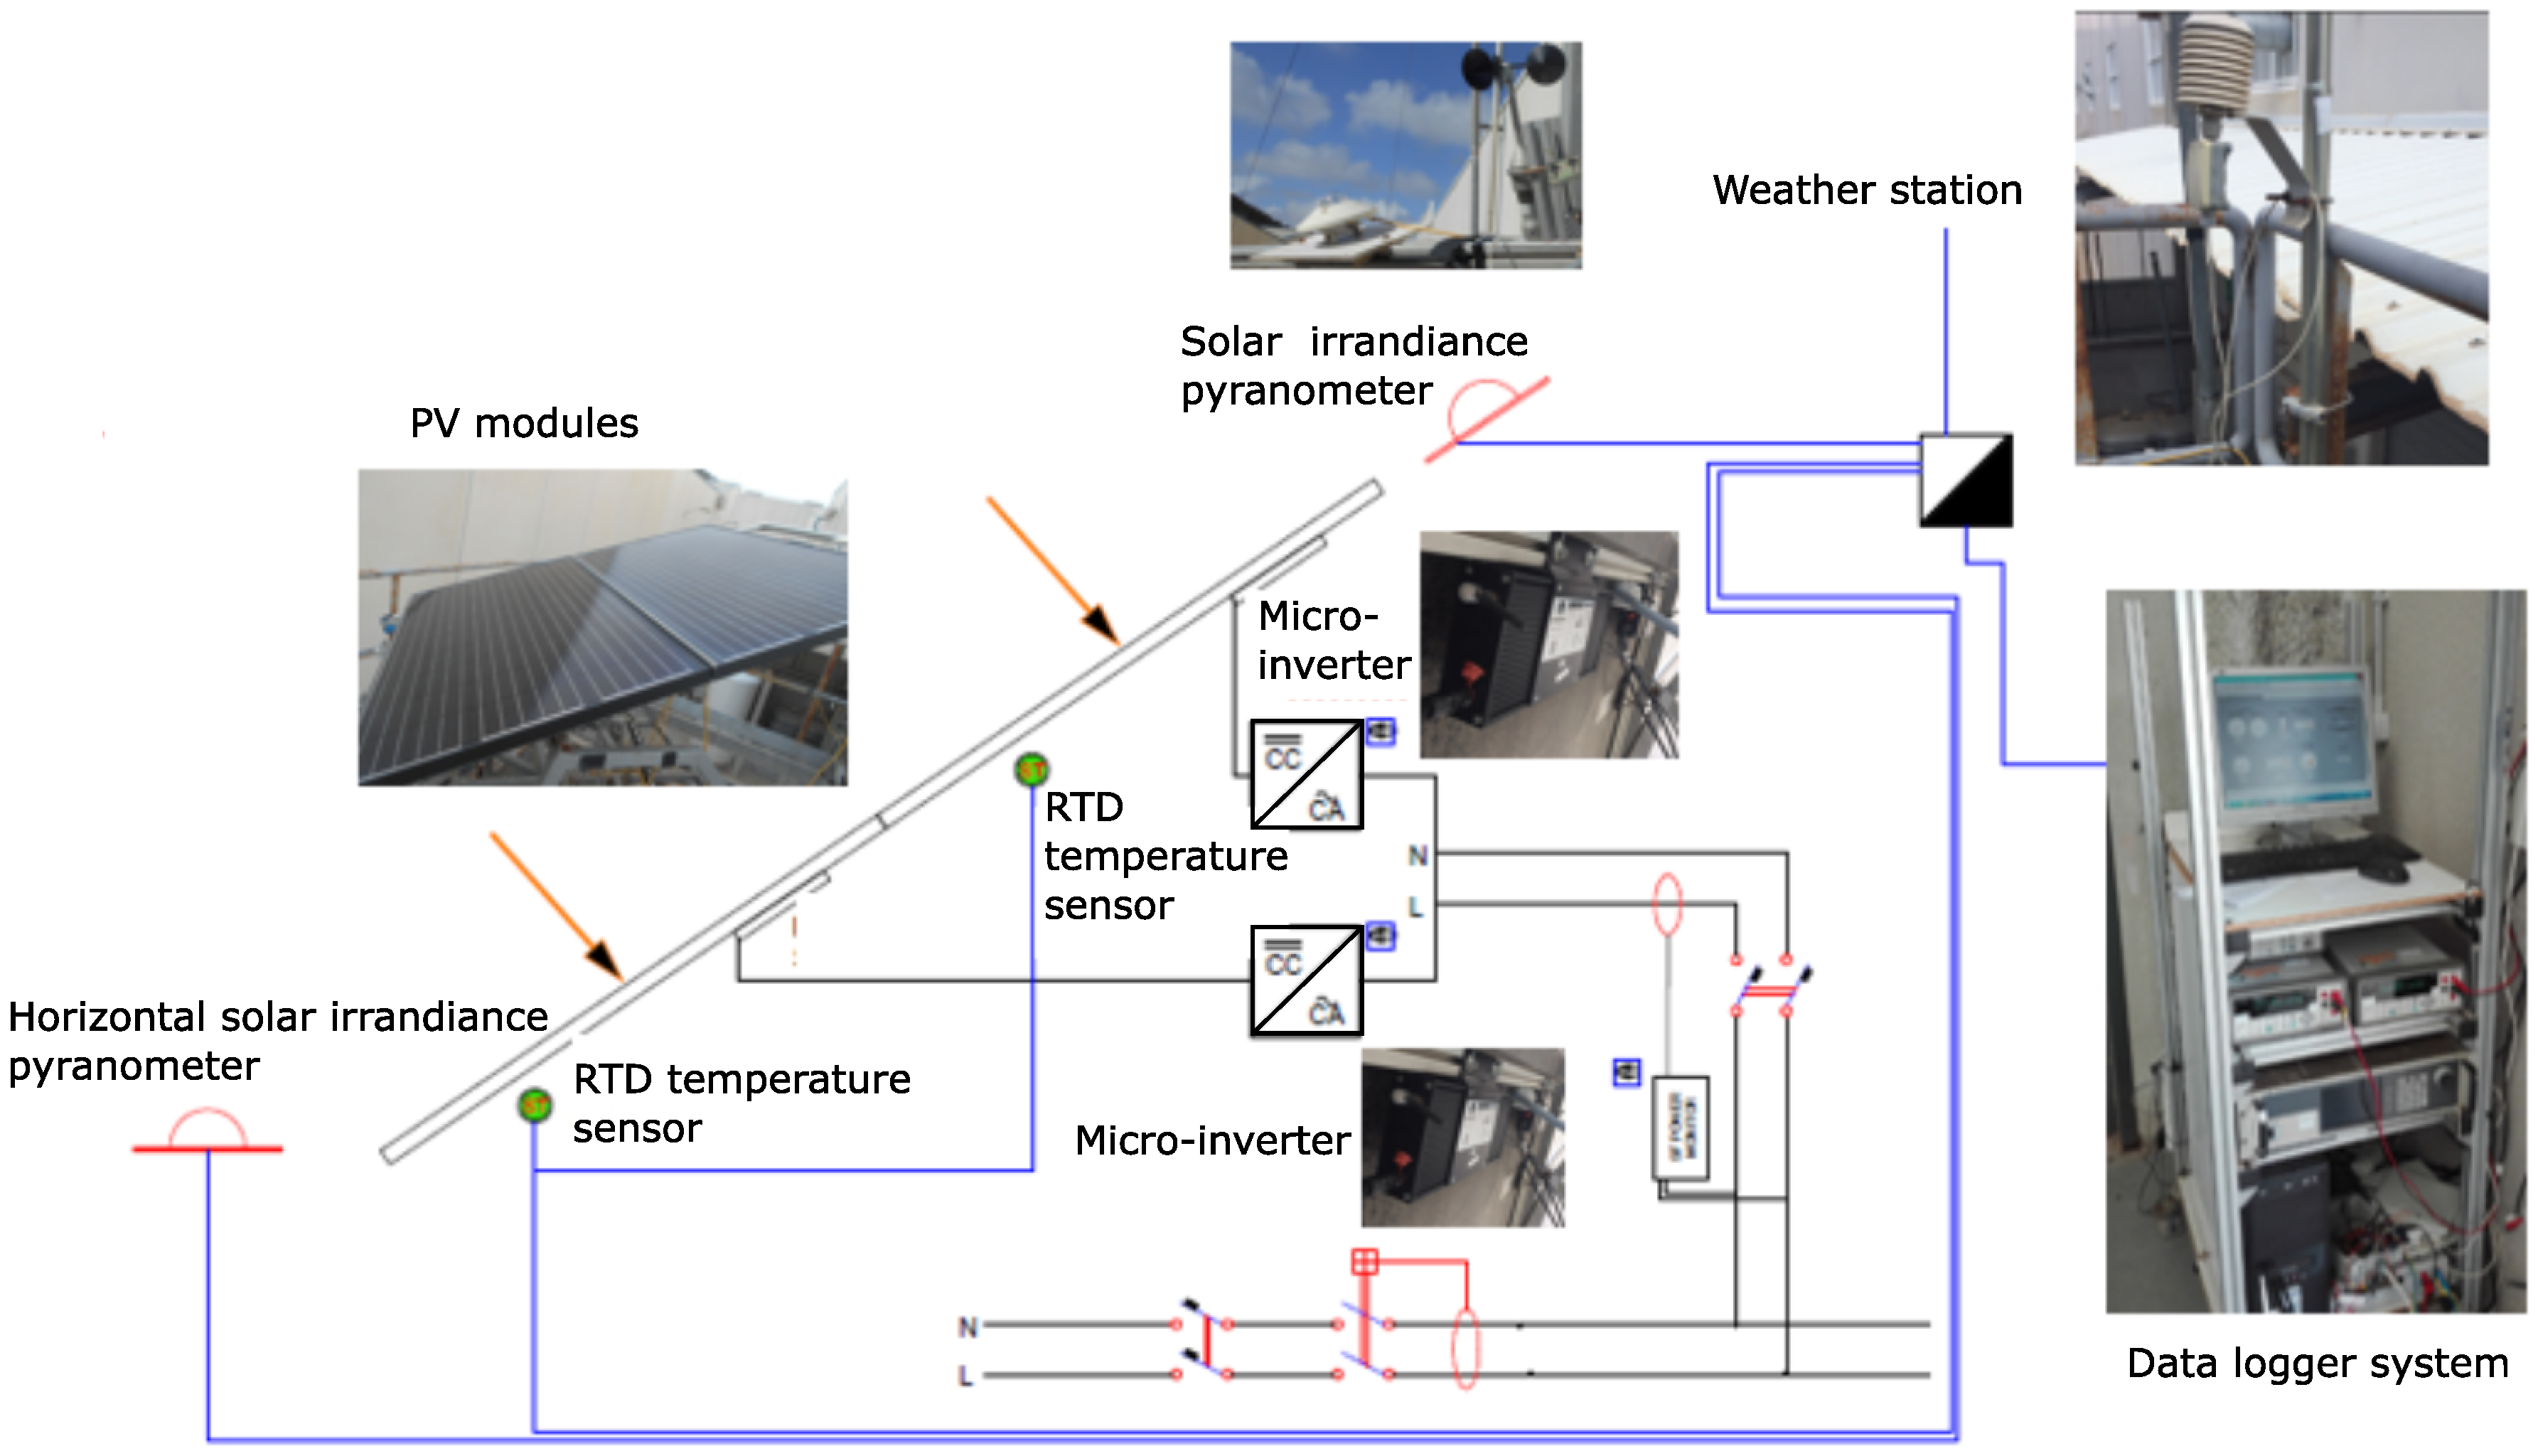
2.3. Hardware Solution: Sensors

Nowadays, and under low-cost requirements, a wide range of sensors are currently available for electrical and environmental parameter monitoring [45]. Moreover, most of them provide additional characteristics based on the IoT [46,47] or they allow extensive connection with Arduino-based solutions [48,49]. Based on the IEC-61724 requirements [50], a set of low-cost sensors to measure and collect meteorological and electrical parameters is selected by the authors. With regard to environmental variables, recent contributions propose to monitor temperature and humidity by a wireless low-cost solution with PV microcells [51]. In our case, temperature is measured near PV modules as an attempt to more accurately estimate real-environmental PV-module conditions. A DHT-22 temperature/humidity sensor with digital output is selected for this application. The DHT sensor is directly supported by Arduino IDE technology and, according to Priya et el. [52], it provides very accurate results and refreshes very quickly. Other recent DTH22 applications can be found in [53,54]. Assuming that the short-circuit current (ISC) is nearly proportional to irradiance [55], solar irradiance (W/m 2 ) is measured by a 5 Wp short-circuit encapsulated polycrystalline silicon module. Shunt resistance is selected and implemented to give a voltage range suitable for Arduino analog inputs. Calibration of this module was carried out by the authors through the CETENMA Solar TestBed, based on the global sunlight method available in [56]. This silicon module is installed outdoors, along with a CMP21 ISO secondary-standard pyranometer manufactured by Kipp and Zonen. Recent CMP21 applications to estimate diffuse and global horizontal irradiation can be found in [57]. Both signals, the encapsulated polycrystalline silicon module monitored by the Arduino and the pyranometer voltage outputs measured using an Agilent 34401A digital multimeter, were simultaneously and accordingly collected. The Agilent 34401A Digital multimeter has been widely used in PV and PV/thermal solar studies [58]. Figure 3 shows an example of a real PV installation and the reference pyranometer (CMP21). Calibration results are also included in this figure.
In general, commonly used standard approaches to model cell temperature do not include the influence of wind on cell temperature [59], limited only to ambient air and inplane irradiance measurements [60]. Moreover, according to Copper et al. [61], wind speed should be measured if the array is subjected to extreme weather conditions. Wind speed thus has less impact on PV-module performance than temperature. Nevertheless, it affects PV-system performance by increasing convective heat loss and reducing PV-module temperature [62]. For the proposed system and this case study, we monitored wind-speed data by using a hemispherical cup anemometer with a linear-frequency output variable. In line with IEC-61724, uncertainty including instrumentation should be lower than 0.5 m/s for wind speeds <5 m/s, and lower than 10% for monitored wind speeds >5 m/s.
Most correlations found in the specific literature for PV electrical power as a function of the cell/module operating temperature and basic environmental variables are linear [63]. Indeed, Dubey and Skoplaki et al. [64,65] affirm that the PV-module power output practically depends linearly but rather strongly on operating temperature. Module temperature should be collected at the center of the back surface of the PV module and in the center of the array field (location on module given in IEC 61829 method A) [66]. Nevertheless, where to measure the temperature of a PV is still debated by researchers [67]. In the proposed system, a low-cost solution based on analog sensors, such as probe LM35, is used with this aim. The LM35 series are precision integrated-circuit temperature sensors made by National Semiconductor [68]. The output voltage is linearly proportional to temperature (in Celsius), and this output does not require any external calibration [69]. For this specific application, output-voltage measurement was previously checked assuming that 0 V was proportional to 0 °C. In addition, several field-test campaign measurements were carried out by the authors to verify these temperature values. Estimated LM35 temperature values were compared to a calibrated RTD sensor, monitored by an Agilent Datalogger. Figure 4 shows the extensive results obtained in these field-test campaigns.
An STC-013-000 hall-effect sensor was used for the current measurements [70]. The inductive current sensor gives low-voltage output suitable to be collected by the Arduino. In line with [71], this sensor was chosen due to the extended work made available by the OpenEnergyMonitor Project [72], and its accuracy and ease of use. Other STC-013 applications for residential smart-power management systems can be also found in the specific literature [73]. The same configuration was used at nodes 2 and 3 to measure grid parameters. Finally, voltage and current-sensor calibration was carried out by the authors at an electrical calibration laboratory. With this aim, a Transmille 3000A Series precision multiproduct calibrator was used (see Figure 5). Results are summarized in Table 2.

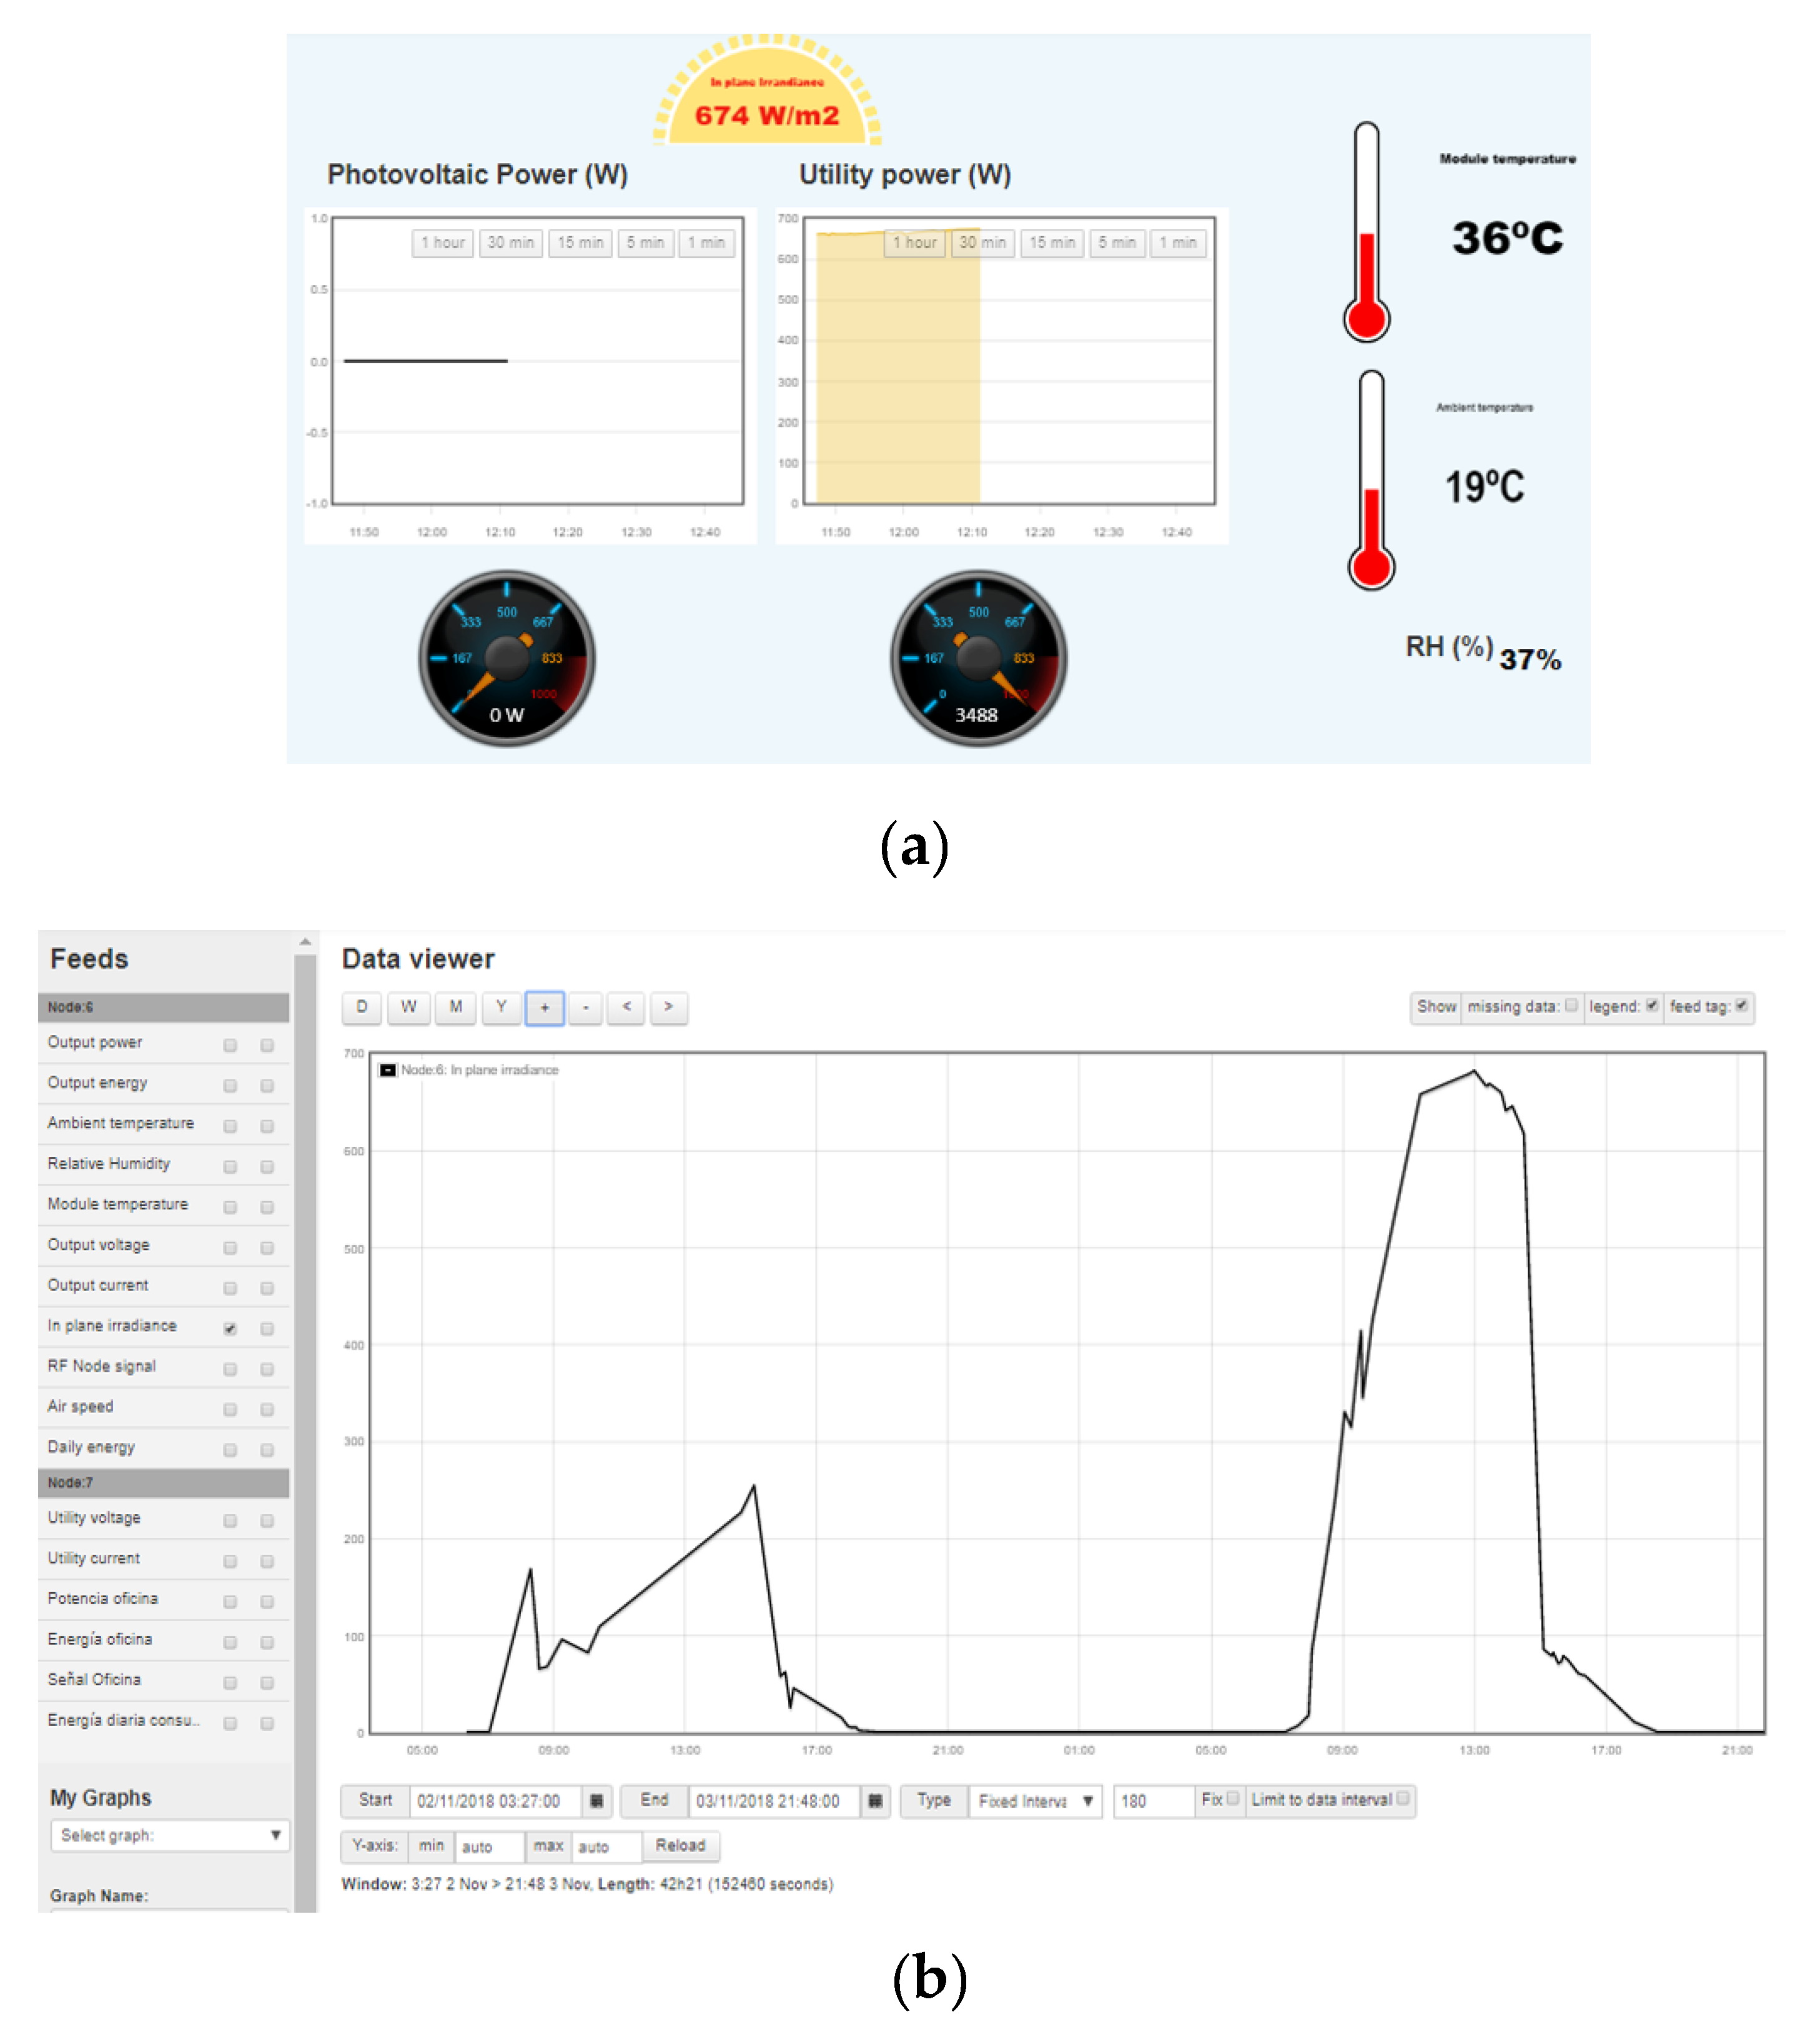
2.4. Software Design

Layered architecture for IoT applications has usually been used to provide suitable frameworks for devices, data storage, and processing management. Under these requirements, several IoT architectures can be deployed at the device, gateway, and cloud layers [74]. Although there is no single consensus of IoT architecture, different contributions propose a three-layer architecture: perception, network, and application layers [75]. In our case, the first layer includes data-acquisition sensors according to IEC-61724 requirements. Access to the sensors and devices is coordinated by the device manager, which is responsible for maintaining a map of devices/sensors. Nodes collect electrical and environmental data with a 30 s sample-time interval. All data are then managed on a database, i.e., the network layer responsible for connecting to other servers or network devices. The connection from end units to the Internet or the Cloud is established at an edge system serving as communication gateway to bridge local networks with cloud systems [76]. Figure 6 summarizes the proposed global solution based on three-layer architecture.
With regard to the application layer, OpenEnergyMonitor Project provides a popular low-cost energy and environmental monitoring solution based on emonPi. It has been recently used for the cost-saving potential of dynamic electricity rates [77], and for the management and administration of consumption records as well [78]. Under this framework, emoncms is an open-source web application for processing, logging, and visualizing energy and other environmental data [79]. A web-server interface is included to provide external client connection and monitoring. Data management and visualization can also be suitable through smartphones, tablets, or devices supporting an Internet connection. This web application has thus been adapted and customized by the authors to process and visualize data collected from the nodes. Figure 7 gives some examples of the front-end web-application panel developed by the authors and available to users.

2.5. Economic Evaluation: Cost-Effectiveness

According to the main objectives and characteristics discussed in Section 1, the proposed monitoring system is a flexible and low-cost solution. The flexibility is included through a distributed architecture, where the information is exchanged among nodes by means of a wireless protocol solution. To guarantee a low cost system, the selected hardware components are based on open-source projects with a relevant cost effectiveness threshold.
Table 3 summarizes the monitoring node cost. This node is in charge of collecting electrical and meteorological data. All hardware components are included according to the prototype node described in Section 2.2 and Section 2.3. Table 4 gives the costs corresponding to the utility grid monitoring node. Finally, the costs of the gateway node are depicted in Table 5. The global costs of the proposed system is less than 100 Euro. Nevertheless, this cost can be reduced depending on the number of nodes to be produced and/or purchased. This cost is lower than other commercial solutions that usually provide less information and a reduced number of parameters, such as Efergy Pro [80], Victron Energy [81] or Solar Monitor [82]. Moreover, these commercial solutions usually need some additional components to store and manage data for subsequent analysis.

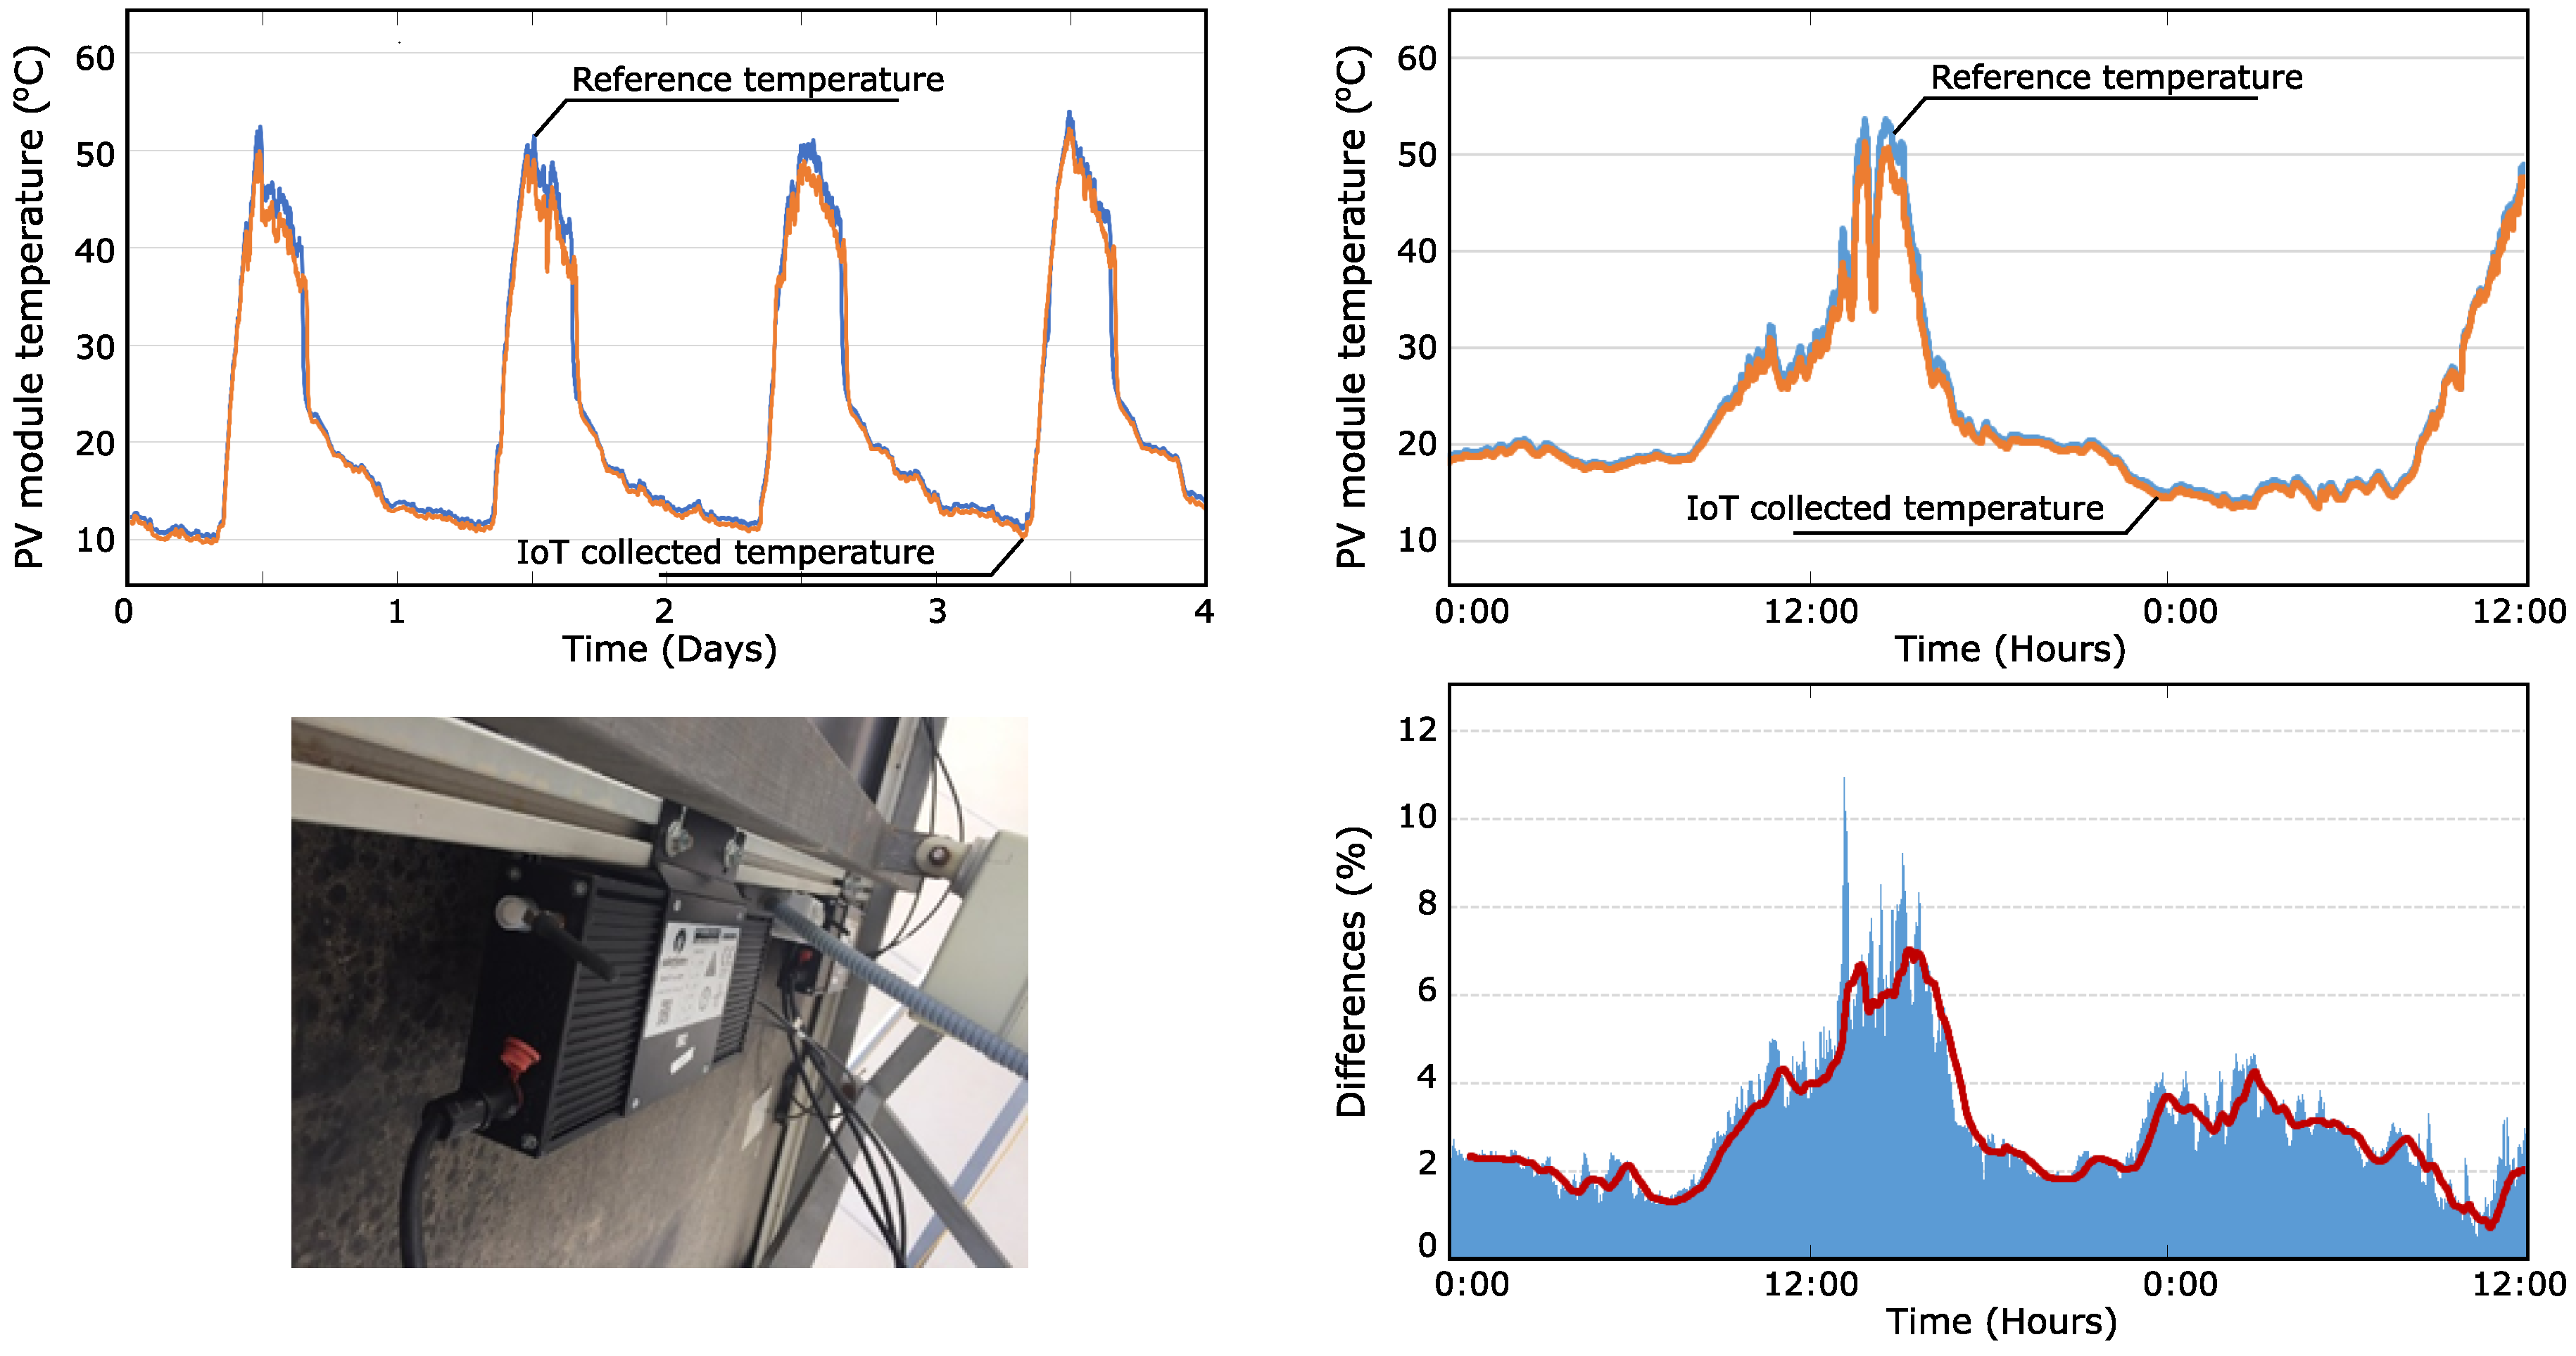
3. Results and Solution Assessment

From the calibrated hardware low-cost solution (Section 2.3) and the web-application described in Section 2.4, the proposed system has been tested and assessed in a Spanish PV power plant under real conditions. With this aim, PV Soltec Solar-trakers 250 Wp modules connected to the grid were monitored in the CETENMA SOLAR installations for several months [83]. To assess the proposed solution, all variables were also measured with standard equipment. Both sets of data were then compared to evaluate the suitability of the proposed low-cost solution. Indeed, solar irradiance was monitored by the Kipp and Zonen CM21 standard pyranometer, also used for calibration purposes in the specific literature [84]. Meteorogical data, including temperature, relative humidity, and wind speed, were collected using data-acquisition system NI PCI 6221. This data-acquisition card has recently been used for monitoring PV electrical-power generation [85] and for relative humidity measurement [86]. Finally, electrical parameters were collected through a HAMEG HM8115-2 wattmeter and Fluke 434 Power grid analyzer. All variables were monitored and managed under an application developed by the authors under a LabView environment. Figure 8 depicts the monitored PV installation and the equipment used to assess the proposed low-cost solution.
As was previously mentioned, the proposed low-cost system was assessed for several months to provide the suitability of this solution under real PV-installation conditions. From the monitored variables, the proposed low-cost system was also able to detect possible PV solar-panel abnormalities in line with other contributions [87]. Figure 9 compares temperature and solar-irradiance data collected by the proposed low-cost solution and standard equipment. In addition, Figure 10 shows the PV-generated power data from the low-cost solution and the commercial data-logger system, as well as the AC grid voltage. Differences between both collected results have been determined and compared under IEC-61724 requirements. Table 6 summarizes these differences, including limits of IEC-61724 permissible errors and providing the suitability of the present solution.
The proposed system was also implemented in a real PV solar installation (5 kWp) to monitor and collect electrical and meteorological data during different weeks. This PV power plant is an over-roof installation connected to the grid and located in the Universidad Politécnica de Cartagena, southeast Spain. It involves 18 PV modules Saclima AMS 310 Wp comprising two strings connected in parallel. The selected inverter was Ingeteam 4.6 TL 5 kW. The power demand of this building is always considerably higher than the maximum active power supplied by this PV power plant. Therefore, the generated active power is totally used to reduce the active power demanded by the building.
By considering meteorological and electrical collected data, Figure 11 summarizes some details of the proposed solution implementation in this real PV installation connected to the grid. Nodes for electric and meteorological monitored data are included in the figure according to the isolation levels required by the nodes under outdoor conditions. PV-module variables are also monitored. As an example of the PV module collected data, Figure 12 shows electrical data corresponding to both DC and AC variables. PV-module DC current and global DC current provided by the PV installation are also shown. Figure 13 compares irradiance levels and the active power generated by the PV installations, which are also monitored by the proposed solution. The collected PV-module and ambient-temperature data are also included in the figure. According to these results, the suitability and flexibility of this solution is shown to be able to be applied not only in new installations, but also in PV power plants currently in force.

4. Conclusions

An alternative monitoring system for PV installations is described and assessed. The solution is based on a low-cost and open-source system according to IEC-61724 requirements. The proposed monitoring system collects both meteorological and electrical data at the PV-module level, providing a flexible and wireless architecture capable of being implemented in most PV installations. Sensors have been calibrated in a laboratory environment and the results fulfill the IEC-61724 minimum-accuracy values in terms of current, voltage, and power. PV-module temperature is also available from the proposed solution, with an average error lower than 4%. With regard to economic impact, the proposed monitoring solution cost is lower than current commercial solutions. Indeed, detailed cost information is given in the paper, including sensors and hardware requirements for the gateway and the corresponding nodes.
Different field-test campaigns have been carried out in Spanish PV installations connected to the grid. To assess the proposed solution, monitored data have been compared to data collected from commercial data-logger equipment, obtaining errors lower than 2% for meteorological and electrical variables. Extensive results are also included in the paper. Finally, a web-server interface has also been included to provide external client connection and monitoring. It is based on emoncms, an open-source web application for processing, logging, and visualizing energy and other environmental data.

Author Contributions

Data curation, J.M.P.-P., G.S.-N. and M.C.B.; Formal analysis, A.M.-A.; Funding acquisition, A.M.-A.; Investigation, G.S.-N.; Resources, J.M.P.-P.; Software, G.S.-N.; Supervision, A.M.-A.; Visualization, M.C.B; Writing—original draft, A.M.-A.; Writing—review and editing, A.M.-A.

Funding

This work was partially supported by the Spanish agreement (2017) between the Institute for Development of the Region of Murcia (INFO) and the Technological Center for Energy and Environment (CETENMA). The paper includes results of the activity conducted under the “Research Program for Groups of Scientific Excellence at Region of Murcia (Spain)”, the Seneca Foundation, and the Agency for Science and Technology of the Region of Murcia (Spain).

Acknowledgments

The authors thank the staff of the Universidad Politécnica de Cartagena (Spain) for services and facilities provided.

Conflicts of Interest

The authors declare no conflict of interest.

References

  1. International Energy Agency. Perspectives for the Energy Transition: Investment Needs for a Low-Carbon Energy System; Technical Report, OECD/IEA and IRENA 2017; IEA Publications, Printed by German Federal Ministry for Economic Affairs and Energy; March 2017; Available online: http://www.irena. org/DocumentDownloads/Publications/Perspectives_for_the_Energy_Transition_2017.pdf (accessed on 27 October 2018).
  2. Nieto, J.; Carpintero, O.; Miguel, L. Less than 2C? An Economic-Environmental Evaluation of the Paris Agreement. Ecol. Econ. 2018, 146, 69–84. [Google Scholar] [CrossRef]
  3. IRENA. Solar PV Costs 2010–2015. Available online: http://www.irena.org/costs/ (accessed on 27 October 2018).
  4. IRENA. Renewable Capacity Statistics 2018; International Renewable Energy Agency (IRENA): Abu Dhabi, UAE, 2018; Available online: http://irena.org/-/media/Files/IRENA/Agency/Publication/2018/Mar/IRENA_RE_Capacity_Statistics_2018.pdf (accessed on 27 October 2018)ISBN 978-92-9260-057-0.
  5. Best, R.; Burke, P.J. Adoption of solar and wind energy: The roles of carbon pricing and aggregate policy support. Energy Policy 2018, 118, 404–417. [Google Scholar] [CrossRef]
  6. Kraan, O.; Kramer, G.; Nikolic, I. Investment in the future electricity system—An agent-based modelling approach. Energy 2018, 151, 569–580. [Google Scholar] [CrossRef]
  7. Trujillo-Baute, E.; del Rio, P.; Mir-Artigues, P. Analysing the impact of renewable energy regulation on retail electricity prices. Energy Policy 2018, 114, 153–164. [Google Scholar] [CrossRef] [Green Version]
  8. Ellabban, O.; Abu-Rub, H.; Blaabjerg, F. Renewable energy resources: Current status, future prospects and their enabling technology. Renew. Sustain. Energy Rev. 2014, 39, 748–764. [Google Scholar] [CrossRef]
  9. Pietzcker, R.C.; Ueckerdt, F.; Carrara, S.; de Boer, H.S.; Després, J.; Fujimori, S.; Johnson, N.; Kitous, A.; Scholz, Y.; Sullivan, P.; et al. System integration of wind and solar power in integrated assessment models: A cross-model evaluation of new approaches. Energy Econ. 2017, 64, 583–599. [Google Scholar] [CrossRef] [Green Version]
  10. Kamaruzzaman, Z. Effect of grid–connected photovoltaic systems on static and dynamic voltage stability with analysis techniques—A review. Przegląd Elektrotech. 2015, 1, 136–140. [Google Scholar] [CrossRef]
  11. Hung, D.Q.; Shah, M.R.; Mithulananthan, N. Technical Challenges, Security and Risk in Grid Integration of Renewable Energy. In Smart Power Systems and Renewable Energy System Integration; Jayaweera, D., Ed.; Springer International Publishing: Cham, Switzerland, 2016; pp. 99–118. [Google Scholar] [CrossRef]
  12. Chiandone, M.; Sulligoi, G.; Massucco, S.; Silvestro, F. Hierarchical Voltage Regulation of Transmission Systems with Renewable Power Plants: An overview of the Italian case. In Proceedings of the 3rd IET Renewable Power Generation Conference, Naples, Italy, 24–25 September 2014; pp. 261–265. [Google Scholar]
  13. Bonfiglio, A.; Brignone, M.; Delfino, F.; Procopio, R. Optimal Control and Operation of Grid-Connected Photovoltaic Production Units for Voltage Support in Medium-Voltage Networks. IEEE Trans. Sustain. Energy 2014, 5, 254–263. [Google Scholar] [CrossRef]
  14. Weckx, S.; D’hulst, R.; Driesen, J. Locational Pricing to Mitigate Voltage Problems Caused by High PV Penetration. Energies 2015, 8, 4607–4628. [Google Scholar] [CrossRef] [Green Version]
  15. Smith, J.C.; Milligan, M.R.; DeMeo, E.A.; Parsons, B. Utility Wind Integration and Operating Impact State of the Art. IEEE Trans. Power Syst. 2007, 22, 900–908. [Google Scholar] [CrossRef]
  16. Shi, J.; Lee, W.; Liu, Y.; Yang, Y.; Wang, P. Forecasting Power Output of Photovoltaic Systems Based on Weather Classification and Support Vector Machines. IEEE Trans. Ind. Appl. 2012, 48, 1064–1069. [Google Scholar] [CrossRef]
  17. Bracale, A.; Caramia, P.; Carpinelli, G.; Di Fazio, A.R.; Ferruzzi, G. A Bayesian Method for Short-Term Probabilistic Forecasting of Photovoltaic Generation in Smart Grid Operation and Control. Energies 2013, 6, 733–747. [Google Scholar] [CrossRef] [Green Version]
  18. Zamo, M.; Mestre, O.; Arbogast, P.; Pannekoucke, O. A benchmark of statistical regression methods for short-term forecasting of photovoltaic electricity production, part I: Deterministic forecast of hourly production. Sol. Energy 2014, 105, 792–803. [Google Scholar] [CrossRef]
  19. Petrone, G.; Spagnuolo, G.; Teodorescu, R.; Veerachary, M.; Vitelli, M. Reliability Issues in Photovoltaic Power Processing Systems. IEEE Trans. Ind. Electron. 2008, 55, 2569–2580. [Google Scholar] [CrossRef]
  20. Colak, I.; Sagiroglu, S.; Fulli, G.; Yesilbudak, M.; Covrig, C.F. A survey on the critical issues in smart grid technologies. Renew. Sustain. Energy Rev. 2016, 54, 396–405. [Google Scholar] [CrossRef]
  21. Mahjoubi, A.; Mechlouch, R.; Brahim, A. A Low Cost Wireless Data Acquisition System for a Remote Photovoltaic (PV) Water Pumping System. Energies 2011, 4, 68–89. [Google Scholar] [CrossRef] [Green Version]
  22. Han, J.; Choi, C.; Park, W.; Lee, I.; Kim, S. PLC-based photovoltaic system management for smart home energy management system. IEEE Trans. Consum. Electron. 2014, 60, 184–189. [Google Scholar] [CrossRef]
  23. Han, J.; Jeong, J.D.; Lee, I.; Kim, S.H. Low-cost monitoring of photovoltaic systems at panel level in residential homes based on power line communication. IEEE Trans. Consum. Electron. 2017, 63, 435–441. [Google Scholar] [CrossRef]
  24. Wang, Y.; Wen, H.; Hou, X.; Tang, H.; Sun, H.; Zheng, K.; Li, S. Comparison of Differential-Mode and Mixed-Mode Conducted Emission for Household Appliances in Power-Line Communication System. IEEE Trans. Electromagn. Compat. 2017, 59, 2023–2028. [Google Scholar] [CrossRef]
  25. Pop-Calimanu, I.M.; Anna, T.; Popescu, V.; Muntean, G. A Low Cost System for Testing and Monitoring the Performance of Photovoltaic Module. Adv. Electr. Comput. Eng. 2013, 13, 93–98. [Google Scholar] [CrossRef]
  26. Dhimish, M.; Holmes, V.; Mehrdadi, B. Grid-connected PV monitoring system (GCPV-MS). In Proceedings of the 2016 4th International Symposium on Environmental Friendly Energies and Applications (EFEA), Belgrade, Serbia, 14–16 September 2016; pp. 1–6. [Google Scholar] [CrossRef]
  27. Papageorgas, P.; Piromalis, D.; Antonakoglou, K.; Vokas, G.; Tseles, D.; Arvanitis, K. Smart Solar Panels: In-situ Monitoring of Photovoltaic Panels based on Wired and Wireless Sensor Networks. Energy Procedia 2013, 36, 535–545. [Google Scholar] [CrossRef]
  28. Shariff, F.; Rahim, N.A.; Hew, W.P. ZigBee-based data acquisition system for online monitoring of grid-connected photovoltaic system. Expert Syst. Appl. 2015, 42, 1730–1742. [Google Scholar] [CrossRef]
  29. Batista, N.; Melicio, R.; Matias, J.; Catalao, J. Photovoltaic and wind energy systems monitoring and building/home energy management using ZigBee devices within a smart grid. Energy 2013, 49, 306–315. [Google Scholar] [CrossRef]
  30. Fuentes, M.; Vivar, M.; Burgos, J.; Aguilera, J.; Vacas, J. Design of an accurate, low-cost autonomous data logger for PV system monitoring using Arduino™ that complies with IEC standards. Sol. Energy Mater. Sol. Cells 2014, 130, 529–543. [Google Scholar] [CrossRef]
  31. Madeti, S.R.; Singh, S. Monitoring system for photovoltaic plants: A review. Renew. Sustain. Energy Rev. 2017, 67, 1180–1207. [Google Scholar] [CrossRef]
  32. Molina-García, A.; Campelo, J.; Blanc, S.; Serrano, J.; García-Sánchez, T.; Bueso, M. A Decentralized Wireless Solution to Monitor and Diagnose PV Solar Module Performance Based on Symmetrized-Shifted Gompertz Functions. Sensors 2015, 15, 18459–18479. [Google Scholar] [CrossRef] [PubMed] [Green Version]
  33. Friansa, K.; Haq, I.N.; Santi, B.M.; Kurniadi, D.; Leksono, E.; Yuliarto, B. Development of Battery Monitoring System in Smart Microgrid Based on Internet of Things (IoT). Procedia Eng. 2017, 170, 482–487. [Google Scholar] [CrossRef]
  34. Wang, Y. Design and Implementation of a Wireless Sensor Network Node Based on Arduino. Int. J. Online Eng. 2017, 13, 128. [Google Scholar] [CrossRef]
  35. Sipani, J.P.; Patel, R.H.; Upadhyahya, T.; Desai, A. Wireless Sensor Network for Monitoring & Control of Environmental Factors using Arduino. Int. J. Interact. Mob. Technol. 2018, 12, 15. [Google Scholar] [CrossRef]
  36. Raspberry Pi Foundation. Available online: https://www.raspberrypi.org/ (accessed on 27 October 2018).
  37. Cleevely, D. Annual Review; Technical Report; Raspberry-Pi Foundation: Cambridge, UK, 2017. [Google Scholar]
  38. Anire, R.B.; Cruz, F.R.G.; Agulto, I.C. Environmental wireless sensor network using raspberry Pi 3 for greenhouse monitoring system. In Proceedings of the 9th IEEE International Conference on Humanoid, Nanotechnology, Information Technology, Communication and Control, Environment and Management, Manila, Philippines, 1–3 December 2017. [Google Scholar] [CrossRef]
  39. Othman, N.A.; Zainodin, M.R.; Anuar, N.; Damanhuri, N.S. Remote monitoring system development via Raspberry-Pi for small scale standalone PV plant. In Proceedings of the 2017 7th IEEE International Conference on Control System, Computing and Engineering, Penang, Malaysia, 24–26 November 2017. [Google Scholar] [CrossRef]
  40. Pereira, R.I.; Dupont, I.M.; Carvalho, P.C.; Jucá, S.C. IoT embedded linux system based on Raspberry Pi applied to real-time cloud monitoring of a decentralized photovoltaic plant. Measurement 2018, 114, 286–297. [Google Scholar] [CrossRef]
  41. Lobaccaro, G.; Carlucci, S.; Lofstrom, E. A Review of Systems and Technologies for Smart Homes and Smart Grids. Energies 2016, 9, 348. [Google Scholar] [CrossRef]
  42. Lu, X.; Wang, S.; Li, W.; Jiang, P.; Zhang, C. Development of a WSN based real time energy monitoring platform for industrial applications. In Proceedings of the 19th International Conference on Computer Supported Cooperative Work in Design, Calabria, Italy, 6–8 May 2015; pp. 337–342. [Google Scholar] [CrossRef]
  43. Openenergymonitor. Available online: https://openenergymonitor.org/ (accessed on 27 October 2018).
  44. HOPE MicroElectronics Co., Ltd. RFM69CW Datasheet; Technical Report; Available online: http://www. hoperf.com/upload/rf/RFM69CW-V1.1.pdf (accessed on 27 October 2018).
  45. Kumar, A.; Hancke, G.P. Energy Efficient Environment Monitoring System Based on the IEEE 802.15.4 Standard for Low Cost Requirements. IEEE Sens. J. 2014, 14, 2557–2566. [Google Scholar] [CrossRef] [Green Version]
  46. Fuertes, W.; Carrera, D.; Villacís, C.; Toulkeridis, T.; Galárraga, F.; Torres, E.; Aules, H. Distributed System as Internet of Things for a New Low-Cost, Air Pollution Wireless Monitoring on Real Time. In Proceedings of the 2015 IEEE/ACM 19th International Symposium on Distributed Simulation and Real Time Applications (DS-RT), Chengdu, China, 14–16 October 2015; pp. 58–67. [Google Scholar] [CrossRef]
  47. Ram, S.A.; Siddarth, N.; Manjula, N.; Rogan, K.; Srinivasan, K. Real-time automation system using Arduino. In Proceedings of the 2017 International Conference on Innovations in Information, Embedded and Communication Systems (ICIIECS), Coimbatore, India, 17–18 March 2017; pp. 1–5. [Google Scholar] [CrossRef]
  48. Nisio, A.D.; Noia, T.D.; Carducci, C.G.C.; Spadavecchia, M. Design of a low cost multipurpose wireless sensor network. In Proceedings of the 2015 IEEE International Workshop on Measurements Networking (M&N), Coimbra, Portugal, 12–13 October 2015; pp. 1–6. [Google Scholar] [CrossRef]
  49. Rahim, A.; Ali, Z.; Bharti, R.; Sabeel, S.; Ramya, B.K. Design and Implementation of a Low Cost Wireless Sensor Network using Arduino and nRF24L01(+). Int. J. Sci. Res. Eng. Technol. 2016, 5, 307–309. [Google Scholar]
  50. IEC 61724-1. Photovoltaic System Performance Monitoring—Guidelines for Measurement, Data Exchange, and Analysis (Part 1); Technical Report 1; International Electrotechnical Commission (IEC)’: Switzerland, Geneva, 2017. [Google Scholar]
  51. del Ama Gonzalo, F.; Hernandez, J.A.; Moreno, B. Wireless low cost temperature and humidity sensors with PV microcells. Determination of design parameters by means of experimental measurements. In Proceedings of the 2016 5th International Conference on Electronic Devices, Systems and Applications (ICEDSA), Ras Al Khaimah, UAE, 6–8 December 2016; pp. 1–4. [Google Scholar] [CrossRef]
  52. Priya, C.G.; AbishekPandu, M.; Chandra, B. Automatic plant monitoring and controlling system over GSM using sensors. In Proceedings of the 2017 IEEE Technological Innovations in ICT for Agriculture and Rural Development (TIAR), Chennai, India, 7–8 April 2017; pp. 173–176. [Google Scholar] [CrossRef]
  53. Hulea, M.; Mois, G.; Folea, S.; Miclea, L.; Biscu, V. Wi-sensors: A low power Wi-Fi solution for temperature and humidity measurement. In Proceedings of the IECON 2013 39th Annual Conference of the IEEE Industrial Electronics Society, Vienna, Austria, 10–13 November 2013; pp. 4011–4015. [Google Scholar] [CrossRef]
  54. Saha, S.; Majumdar, A. Data centre temperature monitoring with ESP8266 based Wireless Sensor Network and cloud based dashboard with real time alert system. In Proceedings of the 2017 Devices for Integrated Circuit (DevIC), Kalyani, India, 23–24 March 2017; pp. 307–310. [Google Scholar] [CrossRef]
  55. Vicente, E.M.; Moreno, R.L.; Ribeiro, E.R. MPPT Technique Based on Current and Temperature Measurements. Int. J. Photoenergy 2015, 1–9. [Google Scholar] [CrossRef]
  56. Muellejans, H.; Zaaiman, W.; Dunlop, E.; Ossenbrink, H.A. Calibration of photovoltaic reference cells by global sunlight method. Metrologia 2005, 42, 360–367. [Google Scholar] [CrossRef]
  57. Stokler, S.; Schillings, C.; Kraas, B. Solar resource assessment study for Pakistan. Renew. Sustain. Energy Rev. 2016, 58, 1184–1188. [Google Scholar] [CrossRef]
  58. Hussain, F.; Othman, M.; Yatim, B.; Ruslan, H.; Sopian, K.; Anuar, Z.; Khairuddin, S. An improved design of photovoltaic/thermal solar collector. Sol. Energy 2015, 122, 885–891. [Google Scholar] [CrossRef]
  59. Skoplaki, E.; Palyvos, J. Operating temperature of photovoltaic modules: A survey of pertinent correlations. Renew. Energy 2009, 34, 23–29. [Google Scholar] [CrossRef]
  60. Kaldellis, J.; Kapsali, M.; Kavadias, K. Temperature and wind speed impact on the efficiency of PV installations. Experience obtained from outdoor measurements in Greece. Renew. Energy 2014, 66, 612–624. [Google Scholar] [CrossRef]
  61. Copper, J.; Bruce, A.; Spooner, T.; Calais, M.; Pryor, T.; Watt, M. Australian Technical Guidelines for Monitoring and Analysing Photovoltaic Systems; Technical Report; Australian PV Institute (APVI): Sydney, Australia, 2013. [Google Scholar] [CrossRef]
  62. Schwingshackl, C.; Petitta, M.; Wagner, J.E.; Belluardo, G.; Moser, D.; Castelli, M.; Zebisch, M.; Tetzlaff, A. Wind effect on PV module temperature: Analysis of different techniques for an accurate estimation. Energy Procedia 2013, 40, 77–86. [Google Scholar] [CrossRef]
  63. Skoplaki, E.; Palyvos, J. On the temperature dependence of photovoltaic module electrical performance: A review of efficiency/power correlations. Sol. Energy 2009, 83, 614–624. [Google Scholar] [CrossRef]
  64. Dubey, S.; Sarvaiya, J.N.; Seshadri, B. Temperature Dependent Photovoltaic (PV) Efficiency and Its Effect on PV Production in the World—A Review. Energy Procedia 2013, 33, 311–321. [Google Scholar] [CrossRef]
  65. Skoplaki, E.; Boudouvis, A.; Palyvos, J. A simple correlation for the operating temperature of photovoltaic modules of arbitrary mounting. Sol. Energy Mater. Sol. Cells 2008, 92, 1393–1402. [Google Scholar] [CrossRef]
  66. Emery, K.; Smith, R. Monitoring System Performance; Technical Report; National Renewable Energy Laboratory (NREL): Golden, CO, USA, 2011.
  67. Yaácob, M.E.; Hizam, H.; Radzi, M.A.M.; Kadir, M. Field Measurement of PV Array Temperature for Tracking and Concentrating 1 kWp Generators Installed in Malaysia. Int. J. Photoenergy 2013, 1–8. [Google Scholar] [CrossRef]
  68. Arunachalam, B.; Devi, R.; Patvardhan, A.; Aiswarya, R.; Prasen, V. Embedded Temperature Monitoring and Control Unit. In Proceedings of the International Conference on Recent Trends in Information, Telecommunication and Computing, Kerala, India, 12–13 March 2010; pp. 293–297. [Google Scholar] [CrossRef]
  69. Ozemoya, A.; Swart, A.; Pienaar, H.; Schoeman, R. Factors impacting on the surface temperature of a PV panel. In Proceedings of the Southern Africa Telecommunication Networks and Applications Conference (SATNAC), Hermanus, South Africa, 6–9 Setptember 2013; pp. 1–5. [Google Scholar]
  70. Dechang Electric Co. SCT013-000 Current Transformer Datasheet; Technical Report; Dechang Electric Co., Ltd. (CN): Shenzhen, China, 2015. [Google Scholar]
  71. Pocero, L.; Amaxilatis, D.; Mylonas, G.; Chatzigiannakis, I. Open source IoT meter devices for smart and energy-efficient school buildings. HardwareX 2017, 1, 54–67. [Google Scholar] [CrossRef]
  72. Openenergymonitor. Measuring AC Voltage with an AC to AC Power Adapter. Available online: https://learn.openenergymonitor.org/electricity-monitoring/voltage-sensing/measuring-voltage-with-an-acac-power-adapter (accessed on 27 October 2018).
  73. Gabriele, T.; Pantoli, L.; Stornelli, V.; Chiulli, D.; Muttillo, M. Smart power management system for home appliances and wellness based on wireless sensors network and mobile technology. In Proceedings of the XVIII AISEM Annual Conference, Trento, Italy, 3–5 February 2015; pp. 1–4. [Google Scholar] [CrossRef]
  74. Gyrard, A.; Datta, S.K.; Bonnet, C.; Boudaoud, K. A Semantic Engine for Internet of Things: Cloud, Mobile Devices and Gateways. In Proceedings of the 9th International Conference on Innovative Mobile and Internet Services in Ubiquitous Computing, Santa Cantarina, Brazil, 8–10 July 2015; pp. 336–341. [Google Scholar] [CrossRef]
  75. Sethi, P.; Sarangi, S. Internet of Things: Architectures, Protocols, and Applications. J. Electr. Comput. Eng. 2017, 1–25. [Google Scholar] [CrossRef]
  76. Lee, Y.; Nair, S. A Smart Gateway Framework for IOT Services. In Proceedings of the 2016 IEEE International Conference on Internet of Things (iThings) and IEEE Green Computing and Communications (GreenCom) and IEEE Cyber, Physical and Social Computing (CPSCom) and IEEE Smart Data (SmartData), Chengdu, China, 15–18 December 2016; pp. 107–114. [Google Scholar] [CrossRef]
  77. Vaupel, S.; Segura, L.L.O.; Vaupel, H. SmartCalculator: The individual and general cost-saving potential of dynamic electricity rates. In Proceedings of the 2016 IEEE International Conference on Industrial Technology (ICIT), Taipei, Taiwan, 14–17 March 2016; pp. 558–563. [Google Scholar] [CrossRef]
  78. Sacoto-Cabrera, E.; Rodriguez-Bustamante, J.; Gallegos-Segovia, P.; Arevalo-Quishpi, G.; León-Paredes, G. Internet of Things: Informatic system for metering with communications MQTT over GPRS for smart meters. In Proceedings of the CHILEAN Conference on Electrical, Electronics Engineering, Information and Communication Technologies, Pucon, Chile, 18–20 October 2017; pp. 1–6. [Google Scholar] [CrossRef]
  79. Openenergymonitor. Emoncms. Available online: http://emoncms.org (accessed on 27 October 2018).
  80. Efergy. Efergy Pro. Available online: https://efergy.com/efergypro/ (accessed on 27 October 2018).
  81. Victron Energy. Available online: https://www.victronenergy.com/ (accessed on 27 October 2018).
  82. Solar Monitor. Available online: https://shop.solarmonitor.cz/en/7-solar-monitor-2 (accessed on 27 October 2018).
  83. Soltec. Solar-Traker Soltec. 2017. Available online: http://www.soltec.com (accessed on 27 October 2018).
  84. Martinez, M.; Andujar, J.; Enrique, J. A New and Inexpensive Pyranometer for the Visible Spectral Range. Sensors 2009, 9, 4615–4634. [Google Scholar] [CrossRef] [PubMed] [Green Version]
  85. Bayrak, G.; Cebeci, M. Monitoring a grid connected PV power generation system with labview. In Proceedings of the 2013 International Conference on Renewable Energy Research and Applications (ICRERA), Madrid, Spain, 20–23 October 2013; pp. 562–567. [Google Scholar] [CrossRef]
  86. Ocoleanu, C. Solution for humidity measurement using NI PCI 6221 and LabVIEW. In Proceedings of the IEEE 2nd International Forum on Research and Technologies for Society and Industry Leveraging a better tomorrow (RTSI), Bologna, Italy, 7–9 September 2016; pp. 1–5. [Google Scholar] [CrossRef]
  87. Daliento, S.; Chouder, A.; Guerriero, P.; Pavan, A.M.; Mellit, A.; Moeini, R.; Tricoli, P. Monitoring, Diagnosis, and Power Forecasting for Photovoltaic Fields: A Review. Int. J. Photoenergy 2017, 1–13. [Google Scholar] [CrossRef]
Figure 1. Proposed wireless architecture.
Energies 11 03051 g001
Figure 2. Examples of the prototype nodes and connections: (a) assembled node 1; (b) gateway Raspberry Pi; (c) external connections; and (d) detail of external connections.
Energies 11 03051 g002
Figure 3. Pyranometer module calibration: (a) real PV installation; and (b) pyranometer calibration.
Energies 11 03051 g003
Figure 4. LM35 temperature validation. Example of field-test measurements.
Energies 11 03051 g004
Figure 5. Voltage and current-sensor calibration: (a) calibration laboratory details; (b) multi-product calibrator equipment; (c) voltage calibration results; and (d) current calibration results.
Energies 11 03051 g005
Figure 6. Three layers of Internet of Things architecture.
Energies 11 03051 g006
Figure 7. Customized Emoncs web application. Front-end example: (a) dashboard panel; and (b) PV data front-end.
Energies 11 03051 g007
Figure 8. Photovoltaic (PV) module installation: monitoring and assessment.
Energies 11 03051 g008
Figure 9. Temperature and solar-irradiance data comparison: low-cost proposed system vs. standard equipment.
Energies 11 03051 g009
Figure 10. PV-generated power comparison: low-cost proposed system vs. data-logger comparison.
Energies 11 03051 g010
Figure 11. Low-cost proposed system: implementation and details: (a) meteorological data monitor; (b) DC electrical data (outdoor node); (c) AC electrical data (indoor node); and (d) DC electrical data (outdoor node).
Energies 11 03051 g011
Figure 12. PV installation connected to the grid: AC and DC electrical variables: (a) PV module DC current; (b) PV installation DC current; (c) PV installation AC voltage (rms); and (d) PV installation AC current (rms).
Energies 11 03051 g012
Figure 13. PV installation connected to the grid: monitored power and meteorological data: (a) ambient temperature; (b) PV module temperature; (c) PV installation: power; and (d) solar irradiance.
Energies 11 03051 g013
Table 1. IEC-61724 standard parameters.
SymbolUnits
MeteorologicalTotal irradiance (on the array) G I W/m 2
Ambient temperature T a m °C
Wind speed (optional) W S m/s
Wind direction (optional) W D degrees
Photovoltaic arrayOutput voltage V A V
Output Current I A A
Output power P A W
Module temperature T m °C
Utility gridUtility voltage V u V
Current to/from utility grid I T U A
Power to/from utility grid P T U W
Table 2. Calibration results.
ParameterIEC-61724 Minimum AccuracyResults
Current 1 % 0.11 %
Voltage 1 % 0.04 %
Power 2 % 0.22 %
Table 3. PV module and meteorological data: monitoring node cost.
DescriptionNumberUnit Price (Euro)Total Price (Euro)
emonTx Arduino Shield SMT13.143.14
RFM69HW 433 Mhz Wireless Transceiver11.851.85
PV module (5 Wp, 22 V, 30 W)18.758.75
Cement resistance 5 W 10 Ω 10R 5%10.130.13
AC-AC Power Supply Adapter14.954.95
Non-invasive AC Sensor14.314.31
30 A DC Hall Current Sensor11.581.58
5 V DC USB Power Adapter12.402.40
Digital Temperature and Humidity Sensor10.710.71
LM35 TO-220 temperature11.131.13
2.54 mm PCB Screw Connector60.171.02
Aluminum Electrolytic Capacitor 400 V20.020.04
Metal film resistance 1 M 1.2 M 1.5 M 2 M 2.2 M Ω 60.050.30
Prototype PCB Universal Board10.350.35
Outdoor enclosure and wiring13.503.50
Total 34.16
Table 4. Utility grid monitoring node cost.
DescriptionNumberUnit Price (Euro)Total Price (Euro)
emonTx Arduino Shield SMT13.143.14
RFM69HW 433Mhz Wireless Transceiver11.941.94
AC-AC Power Supply Adapter14.954.95
Non-invasive AC Sensor14.314.31
5 V DC USB Power Adapter12.062.06
2.54 mm PCB Screw Connector60.171.02
Aluminum Electrolytic Capacitor 400 V20.020.04
Metal Film Resistors 1%80.030.24
Prototype PCB Universal Board10.350.35
Outdoor enclosure and wiring13.503.50
Total 21.55
Table 5. Gategaway node cost.
DescriptionNumberUnit Price (Euro)Total Price (Euro)
Raspberry Pi 3 Model B Board132.3332.33
Sd card 32 Gb13.273.27
5 V DC USB Power Adapter12.062.06
Raspberry ABS Case Black Transparent12.052.05
RFM69HW 433 Mhz Wireless Transceiver11.851.85
RFM69 Breakout Board11.001.00
Total 42.56
Table 6. Results.
Table 6. Results.
ParameterIEC61724 Required AccuracyResults
Current 1 % 0.81 %
Voltage 1 % 0.74 %
Power 2 % 0.55 %

