Article

Impedance Modeling and Stability Analysis for Cascade System of Three-Phase PWM Rectifier and LLC Resonant Converter

1
School of Electrical Engineering, Northeast Electric Power University, Jilin 132012, China
2
China Electric Power Research Institute, Beijing 100192, China
*
Author to whom correspondence should be addressed.
Energies 2018, 11(11), 3050; https://doi.org/10.3390/en11113050
Submission received: 19 October 2018 / Revised: 1 November 2018 / Accepted: 2 November 2018 / Published: 6 November 2018
(This article belongs to the Section F: Electrical Engineering)

Abstract

:
In this paper; the impedance model of PWM rectifier and LLC resonant converter are deduced, and the stability analysis of cascade system is studied. The principle of three-phase PWM rectifier is introduced; and the small signal model in d-q coordinate system is deduced. The expression of dc side output impedance model for PWM rectifier is derived. The LLC resonant converter is operated in a fixed-frequency state, and the LLC resonant converter is modeled as a small signal model. On this basis, the input impedance model expression of the LLC resonant converter is derived. According to the impedance stability criterion, it can seen that the amplitude of input impedance is greater than the amplitude of output impedance in a certain frequency domain. In addition, the Nyquist curve is not around the point (−1,0), which can judge that the cascade system is stable. In simulation software, a cascade system simulation is built and corresponding simulation curves are obtained, which verifies the stability of the cascade system.

1. Introduction

The consumption of primary energy produces great pollution affecting the environment and the reserves are almost exhausted, which have a significant impact on the sustainable development of human beings [1,2]. Therefore, the development and utilization of renewable energy has been increasing. Large-scale distributed renewable energy access to the power grid requires a large number of power electronic devices [3]. Therefore, the interaction stability of power electronic devices and the power grid is extremely important, whose stability is of great significance for research.
At present, the stability analysis methods for power electronic converter cascade systems are mainly divided into time domain analysis and frequency domain analysis [4,5,6]. The time domain analysis of state space model is based on the small signal state space model of cascade system in time domain. The stability of the cascaded system can be judged by analyzing its the root locus [7]. However, this time domain analysis method requires knowing the details of all circuit topology and control strategies of the whole system and establishing the time-domain state space model. The modeling process is very complex [8,9,10]. In order to adapt to a complex cascade system structure, a frequency domain analysis method based on the impedance model can be used. The main impedance modeling method is based on converter topology and control circuit diagram to establish the closed-loop transfer function of the whole system [11]. Firstly, the stability of the system is analyzed by the Bode figure. Secondly, according to the need of the impedance ratio criterion, a before and after the converter output and input impedance model is set up. Finally, for the impedance stability criterion, the stability of the cascade system is analyzed. This method was first proposed by Middlebrook when he studied the design of input filters of DC systems [12,13]. When a cascade system uses impedance analysis, firstly, each subsystem in the cascade system is simplified to set up the equivalent impedance model by using Norton’s and Thevenin’s theorems. Secondly, cascade subsystem’s impedance ratio judging the stability of the system impedance is obtained by the relationship between the equivalent impedance. The system can be analyzed in combination with the Bode diagram [14,15]. Finally, the cascade system stability was studied by Nyquist stability criterion.
This paper puts forward a three-phase balanced voltage PWM rectifier and LLC resonant converter cascade system of power electronic converter. PWM rectifier is widely used because it can provide stable voltage to dc load and also provide unit power factor and sinusoidal current control on the ac grid side [16]. LLC resonant converter can achieve zero-voltage-switching (ZVS) in certain control strategies, and it can be a high efficiency of energy transfer [17,18]. The high frequency transformer in the middle can provide isolation effect, so that the fault of the load will not have a great impact on the power side, and it can also present the characteristics of a dc transformer. When we analyze the stability of the cascade system, the impedance stability criterion method is adopted in this paper [19]. That is, the PWM rectifier output impedance model and the LLC resonant converter input impedance model are deduced, and the stability of the system is analyzed by combining the impedance Bode diagram and Nyquist plot [20]. The cascade system simulation is set up in the simulation software. The correctness of the impedance stability criterion theory and the stability of the cascade system are judged by the simulation experiment.

2. The Stability Criterion of Three-Phase Balanced Voltage PWM Rectifier and LLC Resonant Converter Cascade System

The cascade system structure studied in this paper is shown in Figure 1. In order to study the stability of three-phase balanced voltage PWM rectifier and LLC resonant converter’s cascade system, we use the impedance analysis method. First, we simplify the subsystems in the cascade system by using the Thevenin’s theorem to establish the equivalent impedance model. Therefore, Figure 1 can be equivalent to Figure 2. This is the method that we need to find the PWM rectifier output impedance and the LLC resonant converter input impedance. The former converter (PWM rectifier) and its front-end input system are defined as power supply, while the latter converter (LLC resonant converter) and its back-end output system are defined as load.
Uo(s) is the no-load output voltage of PWM rectifier, Zo(s) is the output impedance model expression of the rectifier in the working state, as shown in Figure 2, and Zi(s) is the input impedance model expression of the post-grade LLC resonant converter in the working state of fixed-frequency control. The current expression can be obtained from Figure 2, as shown in Equation (1).
I ( s ) = U o ( s ) Z o ( s ) + Z i ( s ) = U o ( s ) Z i ( s ) 1 1 + Z o ( s ) / Z i ( s )
We assume that the three-phase PWM rectifier and LLC resonant converter are stable under independent operating conditions. At this time, if Zo(s)/Zi(s) satisfies the Nyquist stability criterion, the whole cascade system will be stable. That is, the Nyquist curve does not surround the (−1,0) points. The sufficient condition of system stability is simplified: |Zo(s)| < |Zi(s)| is valid in the entire frequency domain.
For a cascade system, we need to derive the output impedance model expression of the PWM rectifier and the input impedance model expression of the LLC resonant converter.

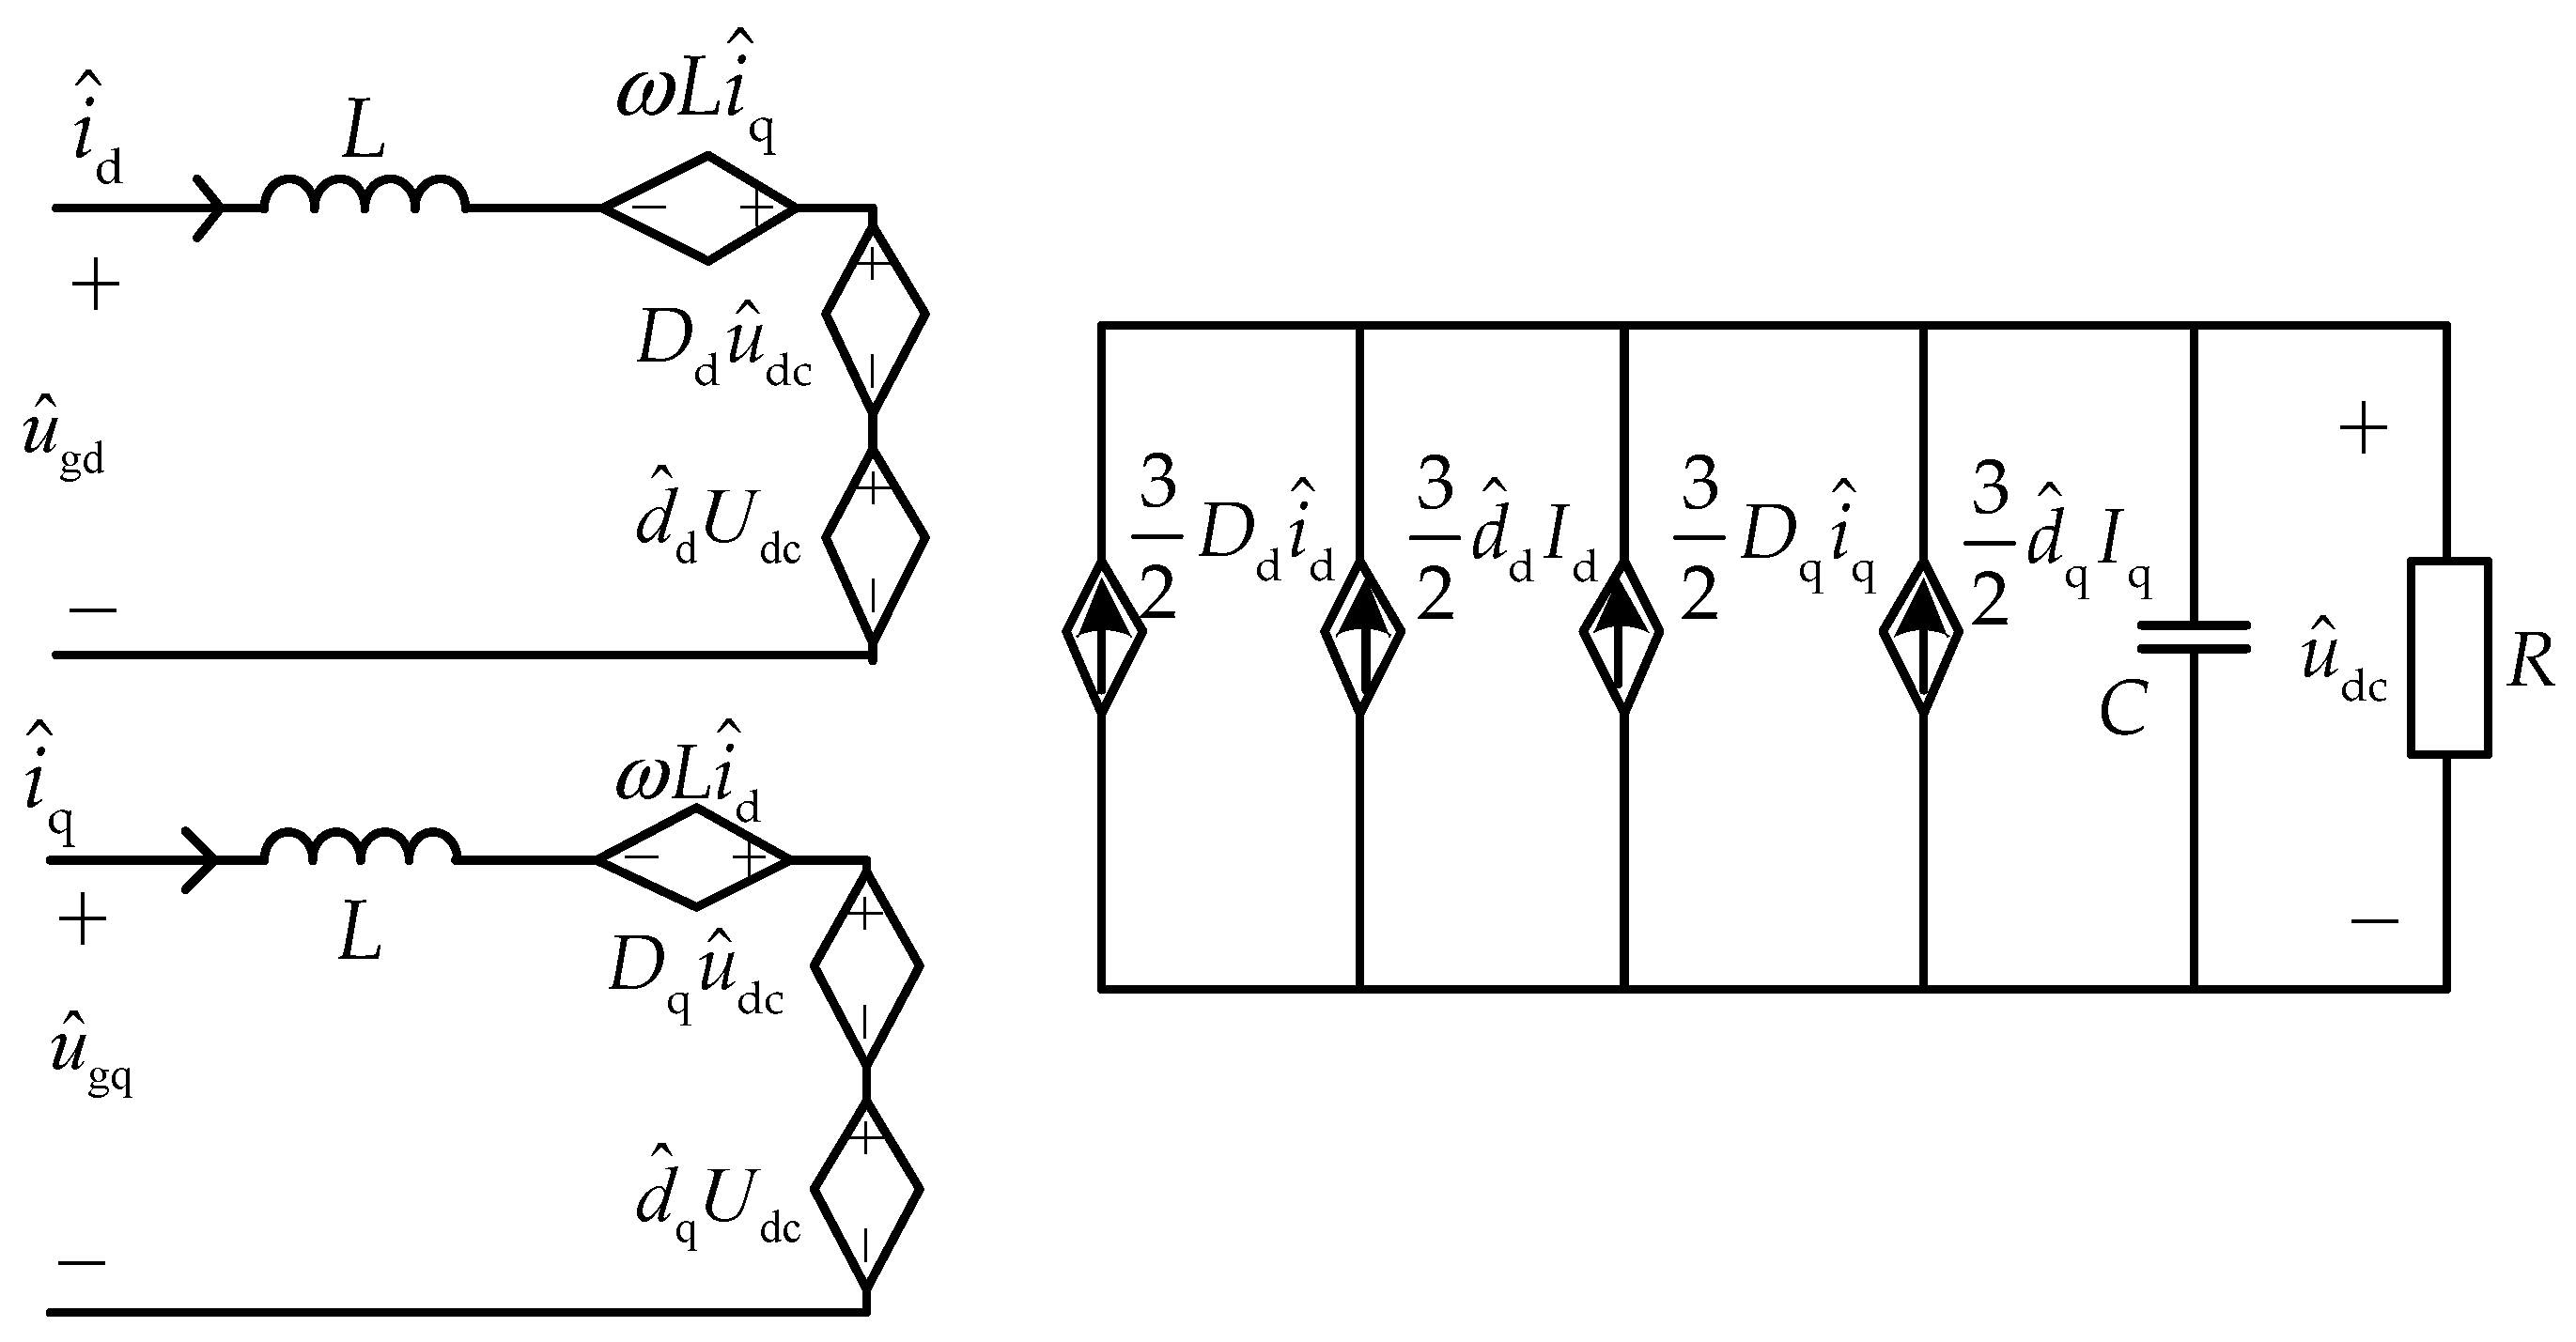
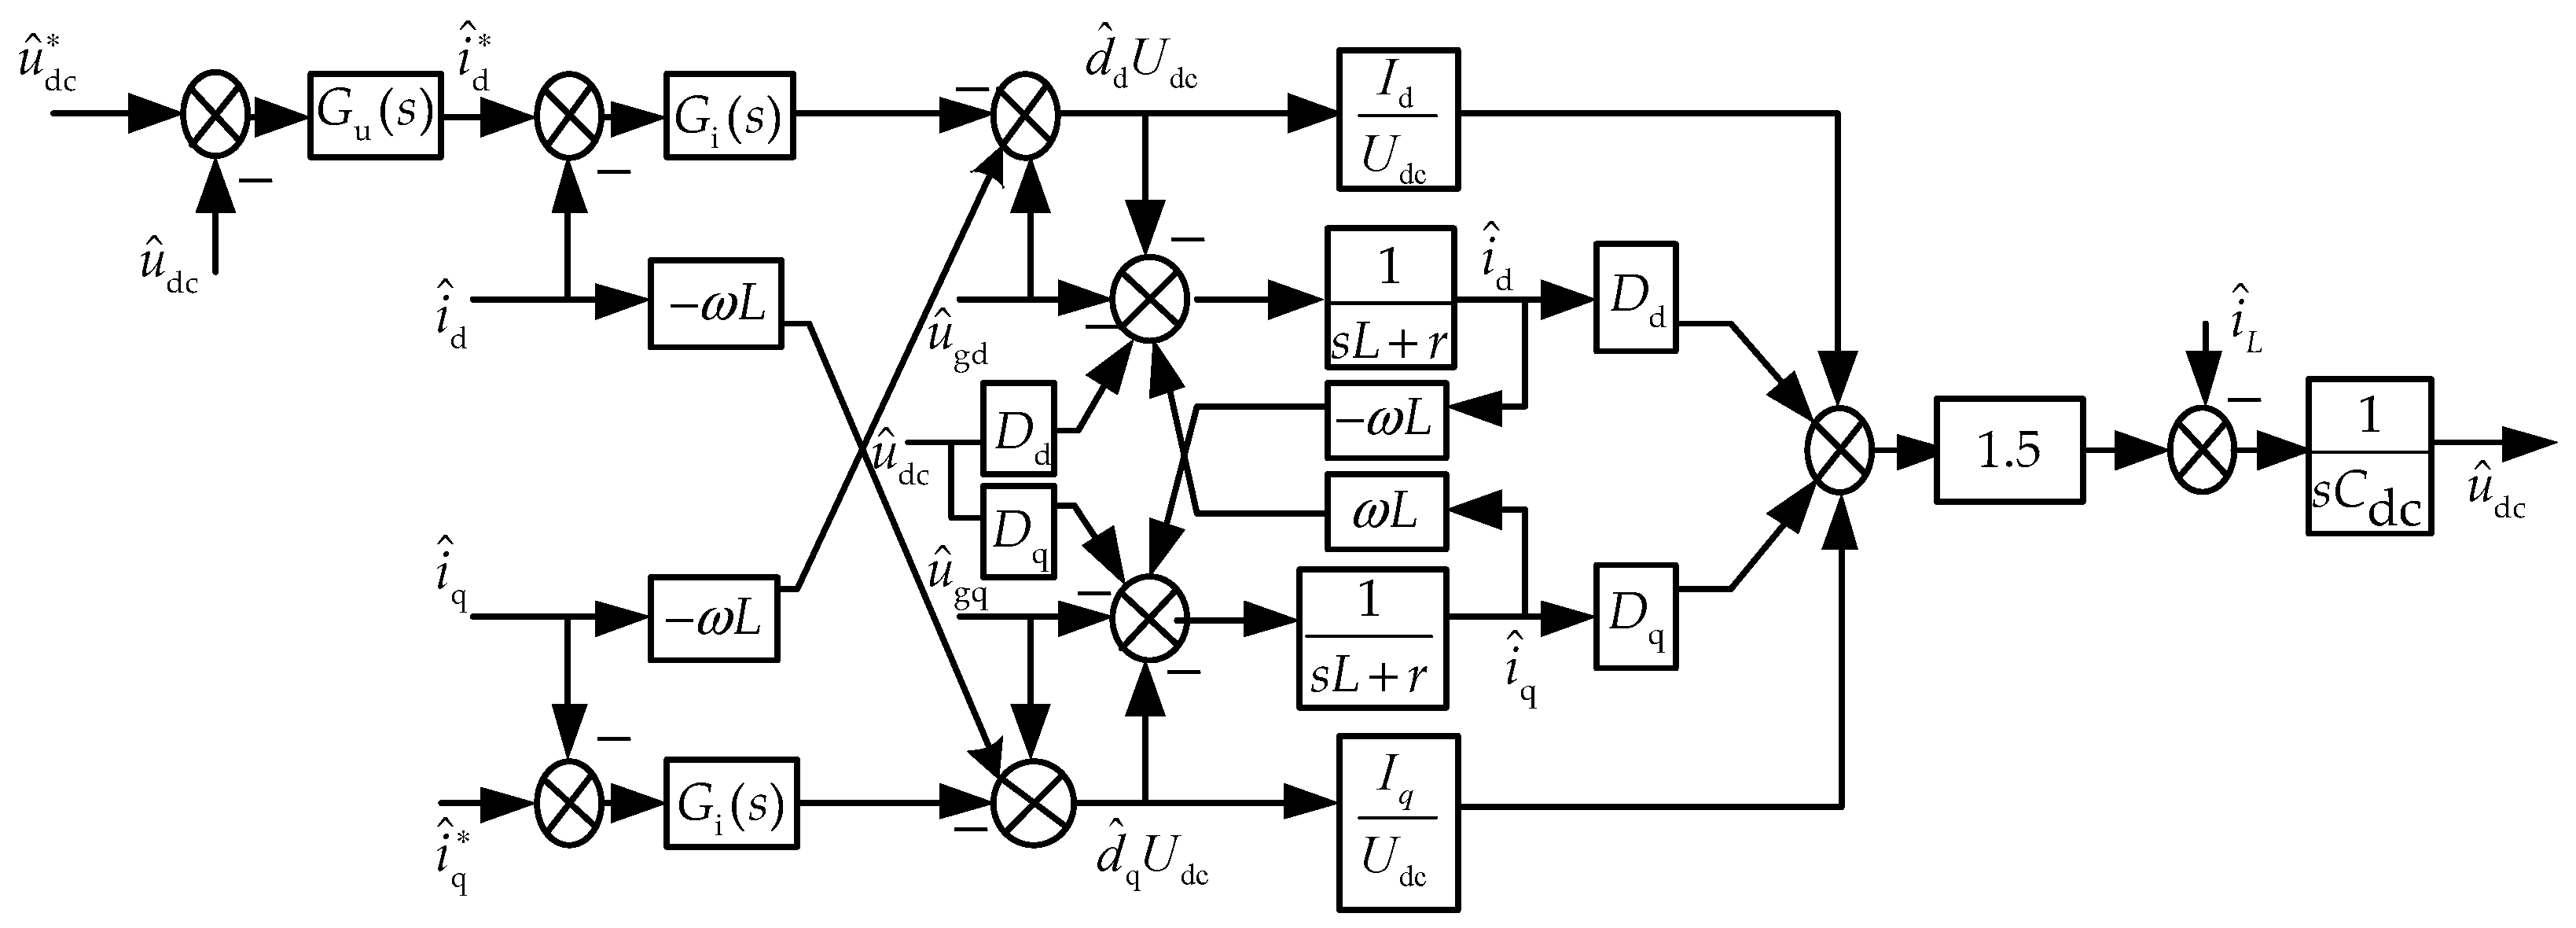
3. Output Impedance Modeling of Three-Phase Balanced PWM Rectifier

Figure 3 shows the circuit topology of a three-phase balanced voltage PWM rectifier with pure resistance. In the Figure 3, PWM circuit of three-phase full bridge consists of 6 switches: Sah, Sbh, Sch, Sal, Sbl, Scl, respectively; L is the filter inductance of the converter; The current of the ideal grid flows into the converter through the inductance. The currents are ia, ib, ic respectively; The ideal grid voltages of three-phase balance are uga, ugb, ugc respectively; ua, ub, uc are the three-phase voltage that are modulated by the converter; udc, idc are dc side voltage and dc side current respectively; Cdc is dc side capacitance; R is the pure resistance load at dc side.
From Kirchhoff’s laws of current and voltage:
i dc = C d u dc d t + u dc R
[ u ga u gb u gc ] = [ L d i a d t L d i b d t L d i c d t ] + [ u a + u no u b + u no u c + u no ]
uno is the voltage of the point ‘n’ to the point ‘o’.
For PWM rectifier, the switching function is established by using average method, with the system structure diagram, the three-phase ac mathematical model is transformed into two-phase dc mathematical model by d-q transformation.
d d t [ i d i q ] = 1 L [ u gd u gq ] 1 L [ d d d q ] u dc [ 0 ω ω 0 ] [ i d i q ]
Similarly, the formula can be given:
d u dc d t = 3 2 C [ d d d q ] T [ i d i q ] u dc R C
But the system is a non-linear time-invariant system. On the basis of the average model, a small signal model is established. After repeated terms and higher-order terms is simplified, the formulas can be obtained:
d d t [ i ^ d i ^ q ] = 1 L [ u ^ gd u ^ gq ] 1 L [ D d D q ] u ^ dc 1 L [ d ^ d d ^ q ] u dc [ 0 ω ω 0 ] [ i ^ d i ^ q ]
d u ^ dc d t = 3 2 C [ D d D q ] T [ i ^ d i ^ q ] + 3 2 C [ d ^ d d ^ q ] T [ I d I q ] u ^ dc R C
The corresponding structure diagram is shown in Figure 4:
Although the linear time-invariant system is obtained, there is still coupling between d axis and q axis. The coupling between d axis and q axis is eliminated by using the feedforward decoupling control method. The small signal control model is obtained by using the control strategy of current inner loop and voltage outer loop. The control block diagram is shown in Figure 5.
After feed-forward decoupling control cancels out the coupling terms of the controlled object, the d axis and q axis do not affect each other. Therefore, dc voltage can be expressed by d axis. Then, PWM rectifier d axis small signal model is obtained, as is shown in Figure 6.
The Equation (7) can be obtained from Figure 6.
i ^ l = ( G i ( s ) G u ( s ) 1.5 D d ( s L + r ) + G i ( s ) + 1.5 I d G i ( s ) G u ( s ) [ ( s L + r ) + G i ( s ) ] u dc 1.5 I d D d u dc ) u ^ dc s C dc u ^ dc
Because the three-phase power supply is the voltage in the ideal grid, u ^ gd = 0 , u ^ dc = 0 .
As a result, the formula can be obtained:
Z o ( s ) = L s + r + G i ( s ) ( s C + 1.5 I d D d / u dc ) [ L s + r + G i ( s ) ] + [ 1.5 D d 1.5 I d ( s L + r ) / u dc ] G i ( s ) G u ( s )
When the system works in the unit power factor, u gq = 0 , i q = 0 , u gd , u dc , R , C , L are determined by the system parameters. Other steady state operating points can be obtained by the formula:
I d = 2 u dc 2 3 u gd R
D d = u dc u gd
The following formula can be obtained by replacing the intermediate variable Id and Dd obtained in Equations (10) and (11), with the known quantity such as ugd.
Z o ( s ) = L s + r + G i ( s ) ( s C + 1 / R ) [ L s + r + G i ( s ) ] + [ 1.5 u gd 1.5 I d ( s L + r ) ] G i ( s ) G u ( s ) / u dc

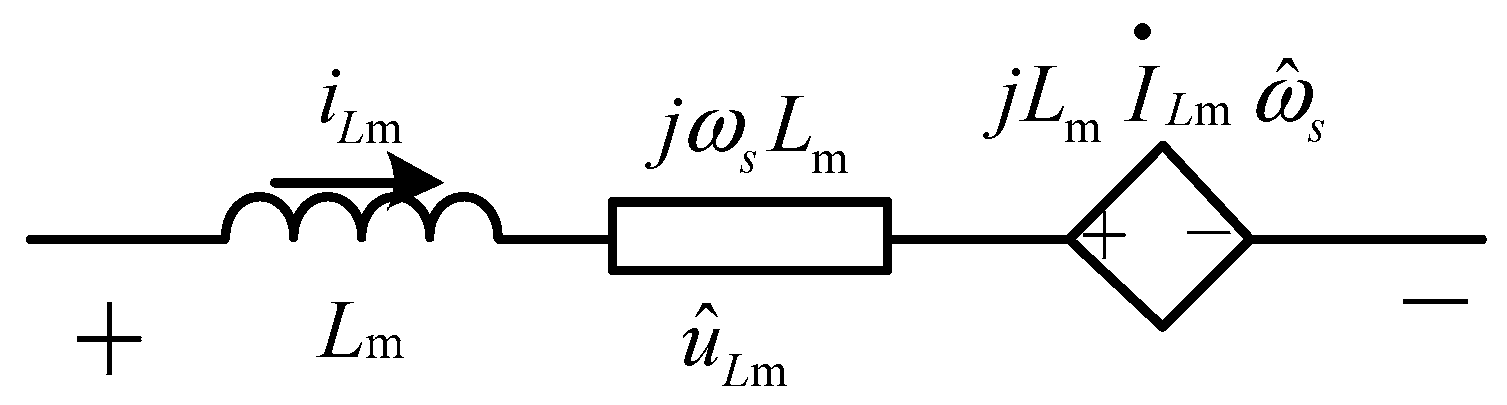
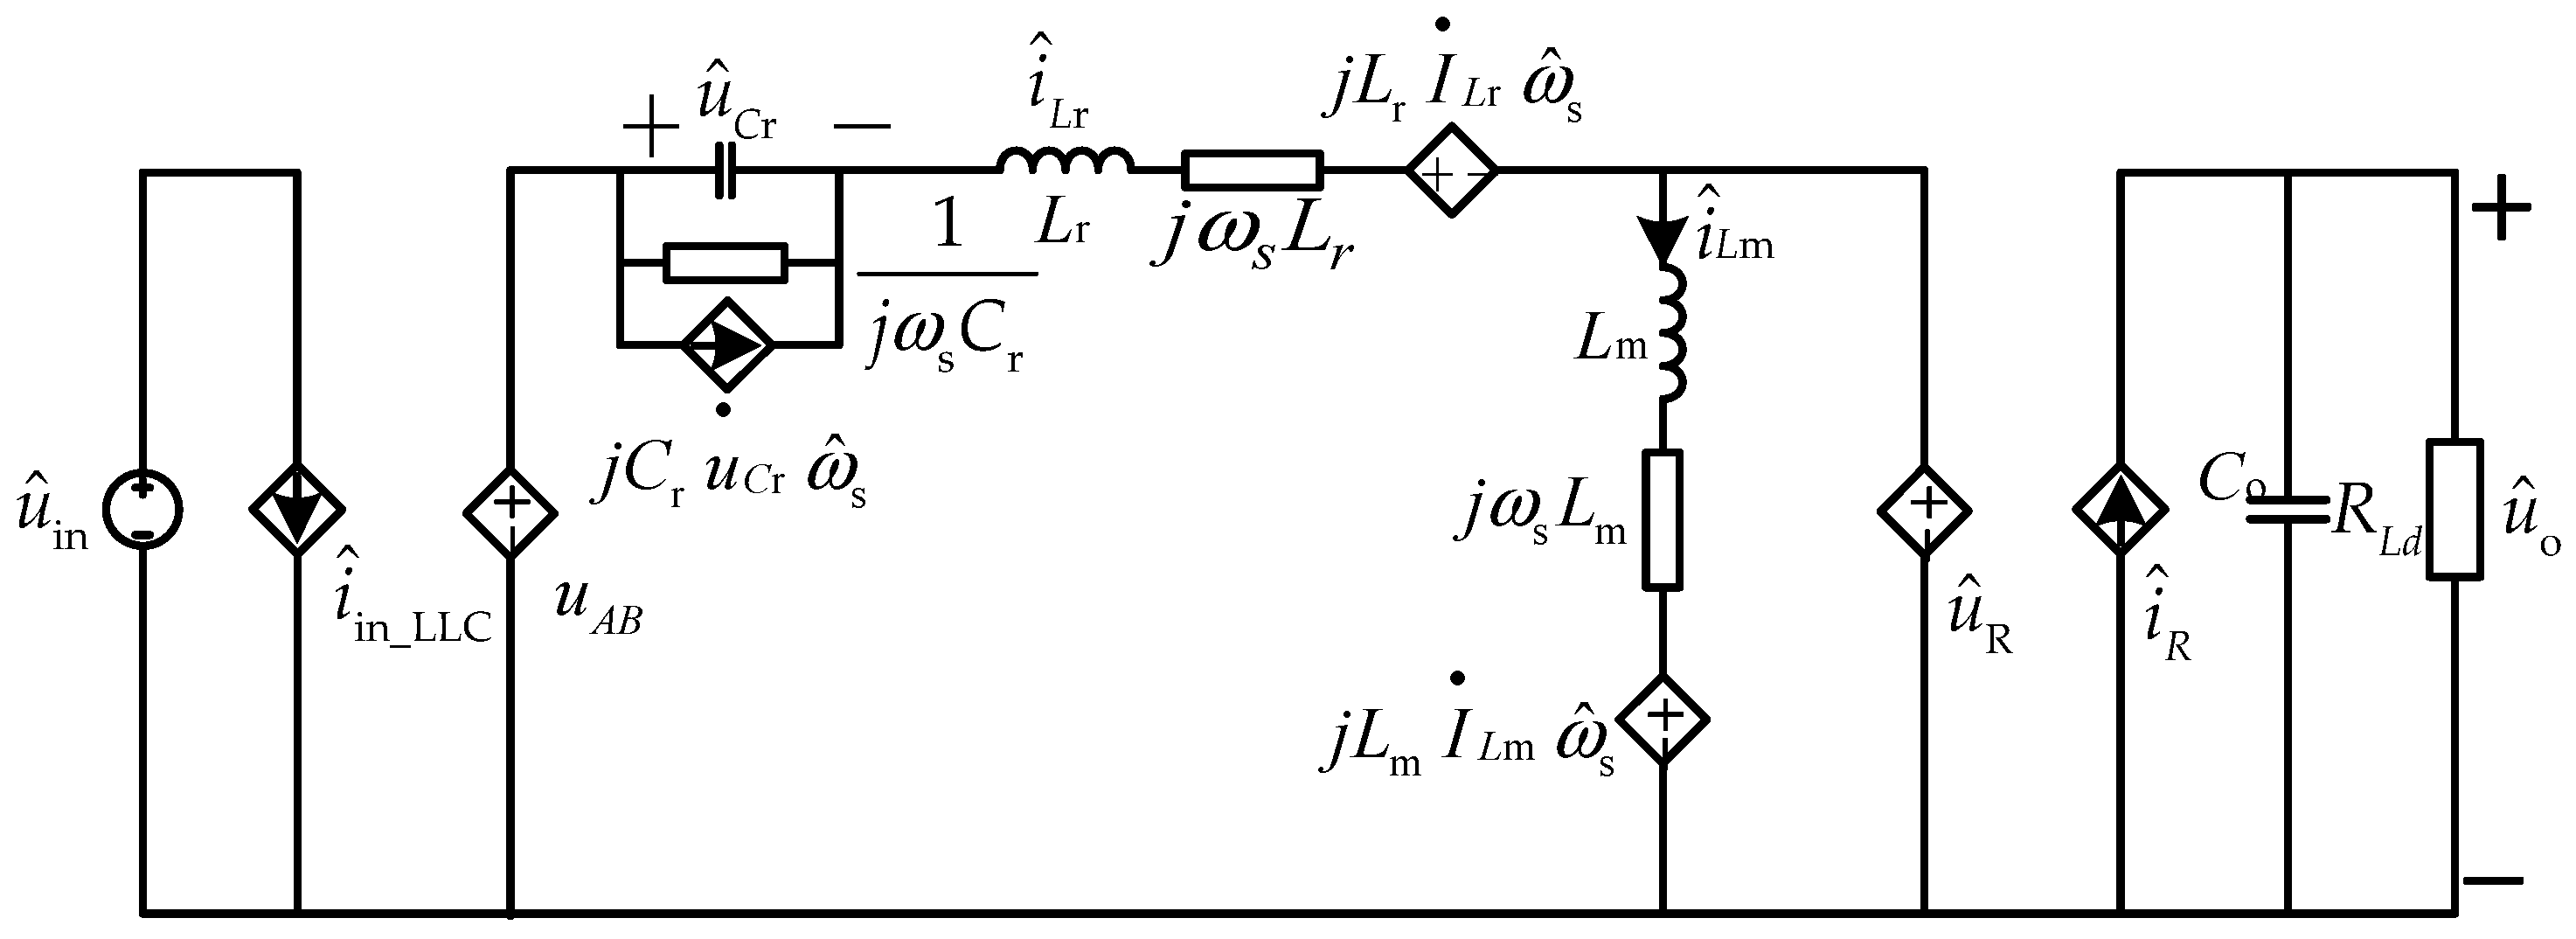
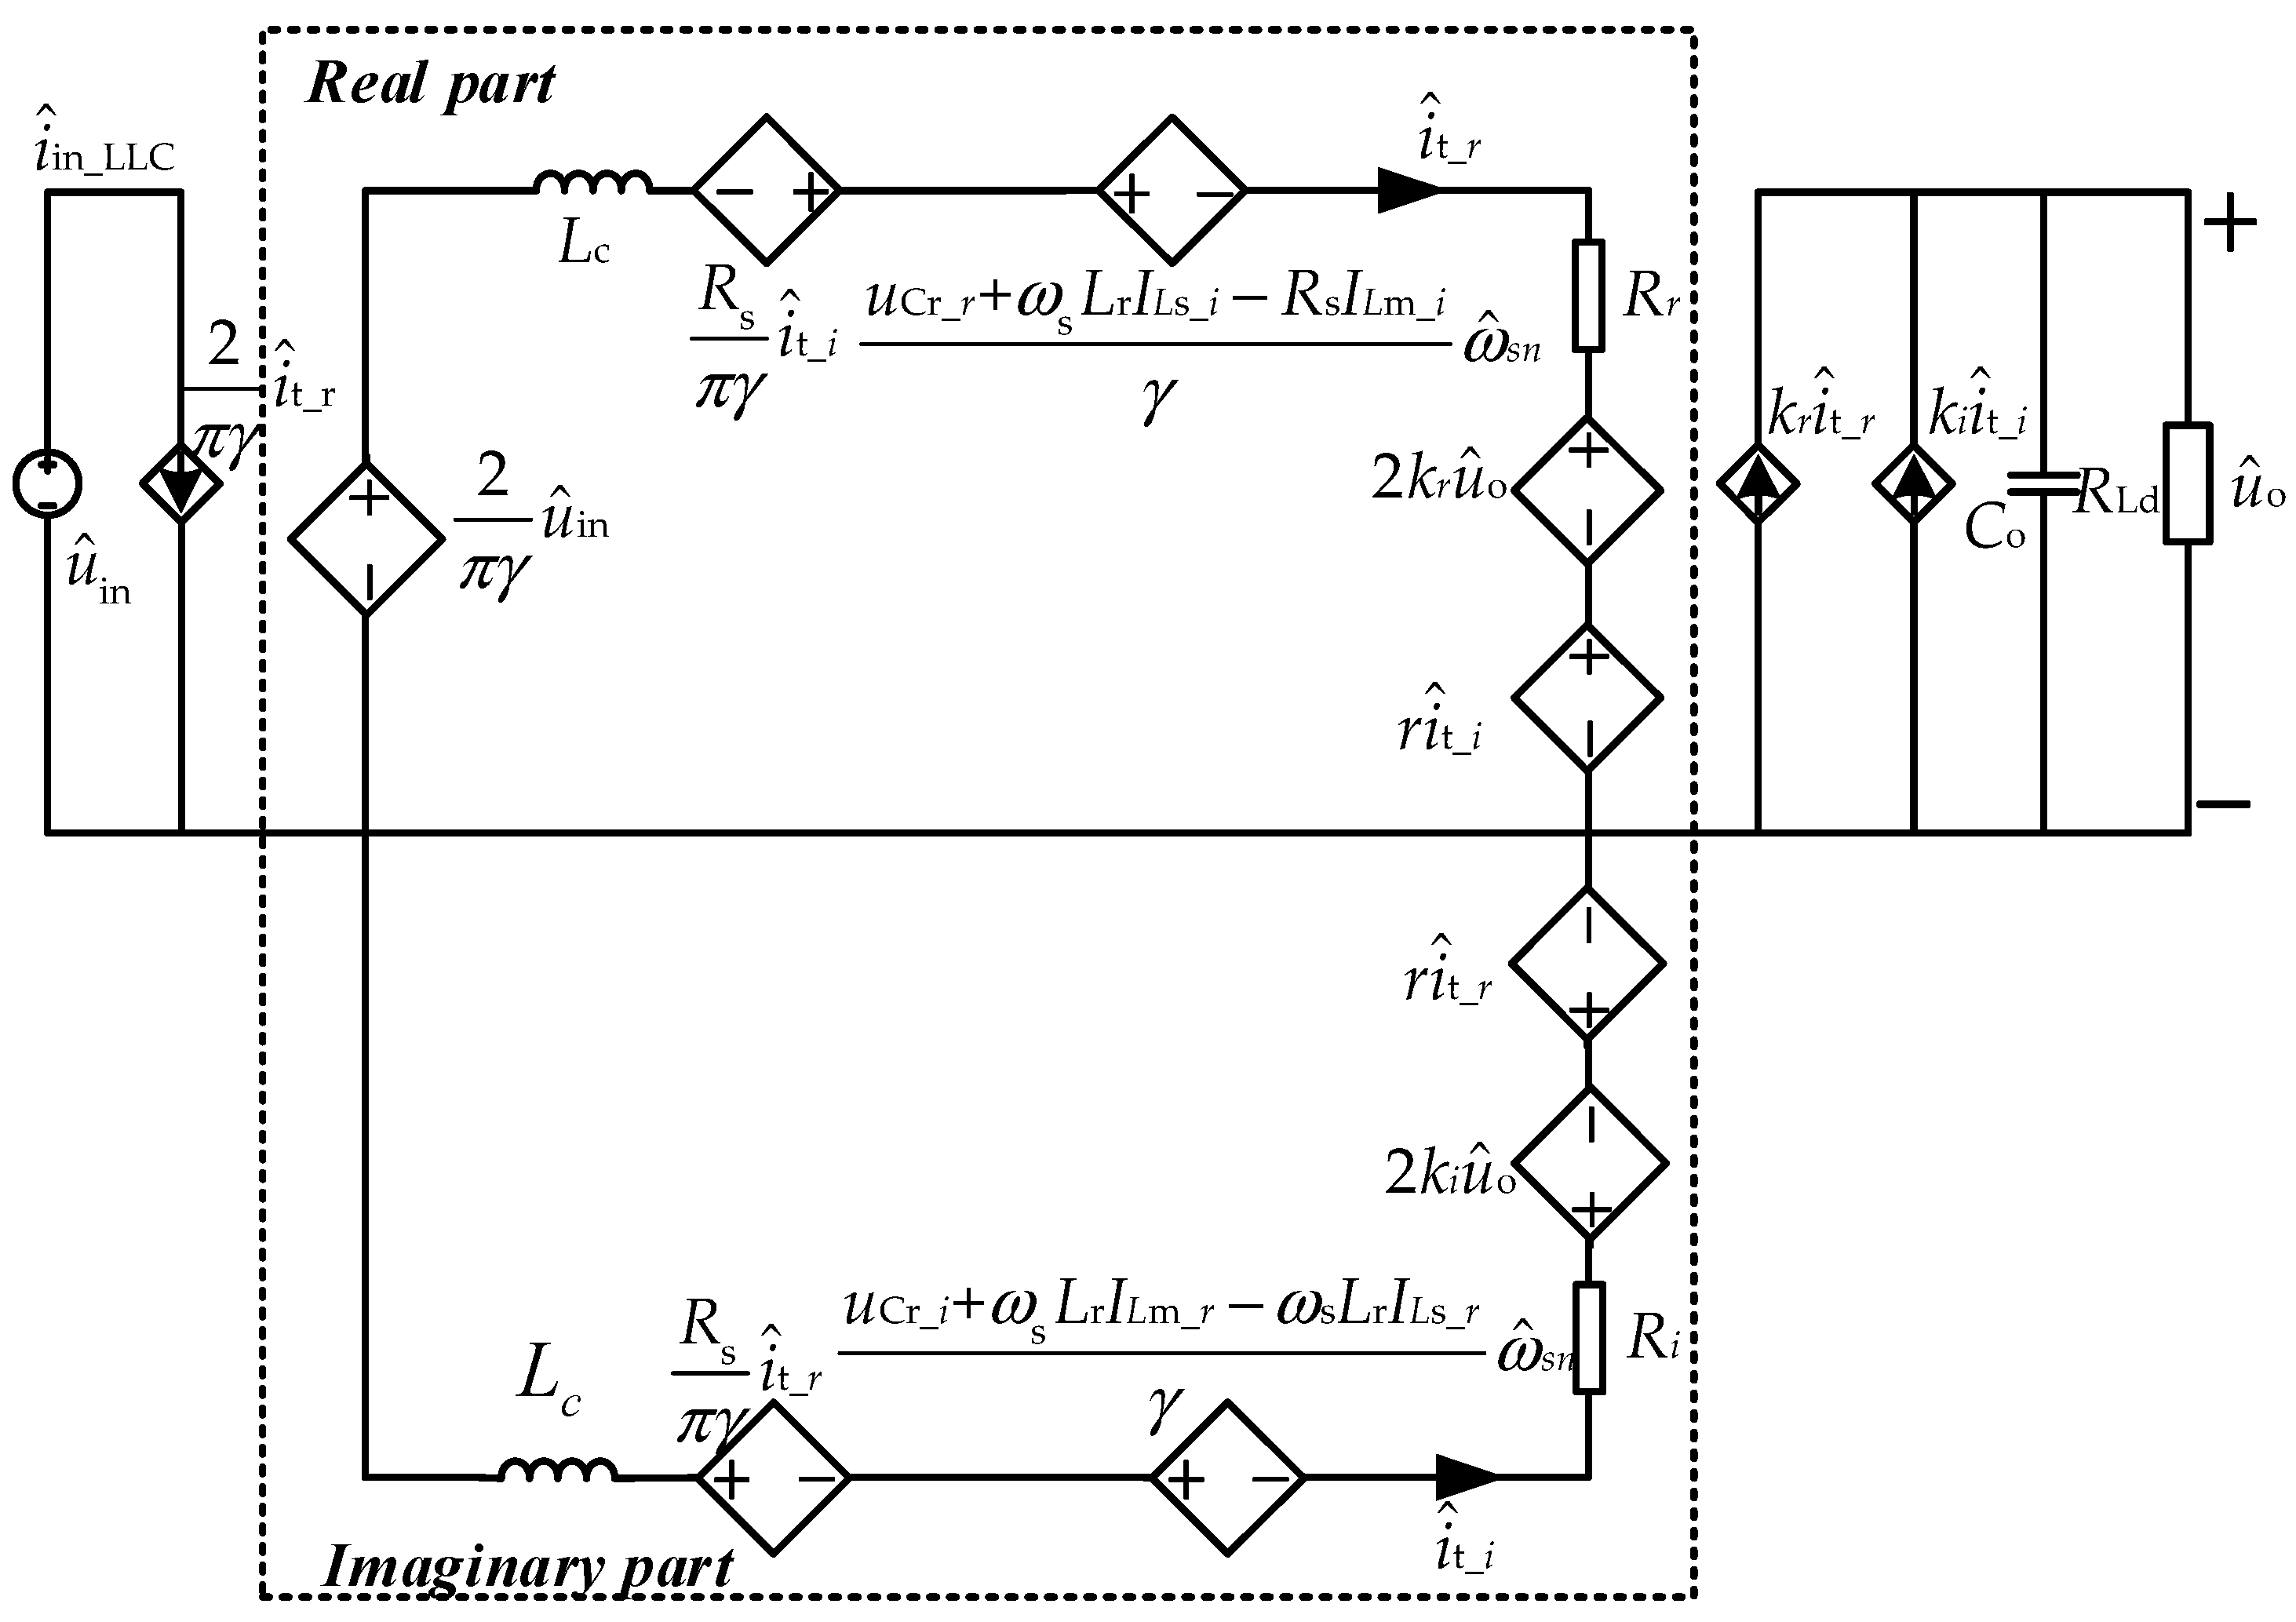
4. Modeling of Input Impedance of LLC Resonant Converter

Figure 7 gives the topology diagram of the full-bridge LLC series resonant converter, in which uin is the output voltage of the former three-phase balanced voltage-type PWM converter and the input voltage of the full-bridge LLC resonant converter. Q1Q4 are switches, D1D4 are inverse parallel diodes of Q1Q4, C1C4 are parasitic capacitors of Q1Q4, Lr is series resonant inductance, including leakage inductance of transformer, Cr is series resonant capacitor, which has the function of isolating DC current; Lm is parallel resonant inductance, which can be realized by transformer excitation inductance, Tr is transformer, the turn ratio of primary and secondary edges is n:1; DR1DR4 makes up the rectifier circuit for the secondary side, Co is the Output filter capacity and RLd is the pure load resistor. Two pairs of diagonal switches Q1 and Q4, Q2 and Q3 are turned on and off at the same time, and the upper and lower switch tubes of the same bridge arm are 180° conducting to each other. Because the specification of four switches are same, therefore C1 = C2 = C3 = C4 = Co.
LLC resonant converter adopted open-loop control mode, and the operating frequency of the controlled switch is slightly lower than the resonant frequency, that is fs < fr. The fundamental vector method is used to establish the system average model, that is to say, the energy of the system is transferred by the fundamental wave of the voltage when the switches turn on, and the average method is used to model the switches. For convenience, as shown in Figure 8.
The fundamental wave vector of uAB and iLr are u ˙ AB and I ˙ L r the expressions of them are as follows:
u AB = 4 π u in 0 °
I L r = I L rm ϕ L r
I in _ L L C = 2 π I L rm cos ϕ L r = 2 π Re ( I L r )
I t = I tm ϕ t
u R = 4 π n u 0 I t | I t |
On the basis of the average model, the small signal model is established. The steady state component is eliminated and the second order AC term is ignored.
u ^ AB = 4 π u ^ in 0 °
i ^ in _ L L C = 2 π i ^ L r _ r
u ^ R = R r i ^ t _ r + r i ^ t _ i + 2 k r u ^ o + j ( R i i ^ t _ i + r i ^ t _ r + 2 k i u ^ o )
i ^ R = k r i ^ t _ r + k i i ^ t _ i
where:
i ^ L r _ r = Re ( i ^ L r )
i ^ t _ r = Re ( i ^ t )
i ^ t _ i = Im ( i ^ t )
R q = R e ω s 2 L m 2 R e 2 + ω s 2 L m 2
X = R e 2 ω s L m R e 2 + ω s 2 L m 2 + ω s L r 1 ω s C r
R r = R e ( R q R e ω s L m X ) 2 ( R e 2 + ω s 2 L m 2 ) ( R q 2 + X 2 )
R i = R e ( ω s L m R e R e X ) 2 ( R e 2 + ω s 2 L m 2 ) ( R q 2 + X 2 )
r = R e ( ω s L m R q + R e X ) ( ω s L m X R q R e ) ( R e 2 + ω s 2 L m 2 ) ( R q 2 + X 2 )
k r = 2 n ( ω s L m R q + R e X ) π R e 2 + ω s 2 L m 2 R q 2 + X 2
k i = 2 n ( R e R q ω s L m X ) π R e 2 + ω s 2 L m 2 R q 2 + X 2
The small signal model of resonant inductance is as follows:
L r d i ^ L r d t + j ω s L r i ^ L r + j L r I L r ω ^ s = u ^ L r
where: i ^ L r = i ^ L r - r + j i ^ L r - i , u ^ L r = u ^ L r - r + j u ^ L r - i .
Similarly, the small signal model of excitation inductance Lm can be obtained as follows:
L m d i ^ L m d t + j ω s L m i ^ L m + j L m I L m ω ^ s = u ^ L m
In Figure 9, it can be seen that in the small signal number model of LLC resonant transformation, the inductance of the resonant slot is composed of three parts: The inductance, the switching frequency impedance and the controlled voltage source. Among them, the impedance of the inductance forms low frequency disturbance, the impedance of the switch frequency is the impedance of the inductance generated by the switching frequency, and the controlled voltage source is generated by the perturbation of the switching frequency.
This is similar to the small signal model of the resonant inductance. The small signal model of resonant capacitor is as follows:
C r d u ^ c r d t + j ω s C r u ^ c r + j C r U C r ω ^ s = i ^ c r
At this point, the LLC resonant converter circuit can be expanded into the model shown in Figure 10.
For the resonant capacitor Cr, through the theoretical derivation, the resonant capacitor Cr can be equivalent to an inductance when it is resonant, so that the seventh order system can be reduced to the third order system. The equivalent simplified LLC resonant converter model is shown in Figure 11. The output impedance model of LLC resonant converter can be deduced.
And we will get the specific factors impacted in the input impedance model. The results are as follows.
Z in _ L L C ( s ) = π 2 L c 2 R Ld C o s 3 + π 2 L c ( L c + R e R Ld C o ) s 2 + π 2 ( 2 L c R e + R s 2 R Ld C o ) s + π 2 ( R e 2 + R s 2 ) 8 L c R Ld C o s 2 + 8 ( L c + R i R Ld C o ) s + 8 R e
where:
R e = 8 π 2 R L d .    R s = ω s L r 1 ω s C r .    L c = L r + 1 ω s 2 C r

5. Simulation Verification and Stability Analysis of Cascade System

5.1. Simulation Verification and Stability Analysis of PWM Rectifier

The output impedance characteristics of three-phase balanced voltage-source PWM rectifier can be obtained by taking the Table 1 parameters into (12), as shown in Figure 12.
The output impedance frequency characteristic amplitude of PWM rectifier is greater than 0° in the middle frequency band, the phase angle is about 0° in low frequency band, at this point, the output impedance model takes the form of pure resistance.in high frequency band, the phase angle is about −90° in high frequency band, at this point, the output impedance model takes the form of pure capacitance. In the whole frequency domain, the output impedance phase angle margin is greater than −180°. It can be seen that the DC side impedance model of the three-phase balanced voltage PWM integrator is stable.
A closed-loop control simulation model of three-phase balanced voltage source PWM rectifier is built in Matlab/Simulink. The simulation parameters are shown in Table 1.
The simulation conditions are as follows: The simulation time is 0.3 s, the initial DC voltage is 160 V, and Q axis current instruction is 0. There is no load in the DC side at start, the DC side is connected with 36 Ω resistors at 0.15 s and 0.25 s, and the simulation results are shown in Figure 13.
Figure 13 shows that: (a) is three-phase voltage waveform when DC load resistance is added, and (b) is the three-phase current waveform when DC load resistance is added and the phases are the same, which satisfies the control of AC side unit power factor. At 0.15 s, the three-phase balance current increased by 10 A due to a sudden increase in load, and soon stabilized near 20 A. At the time of 0.25 s, the current increased by 10 amperes due to the sudden increase of load, and the current was stabilized around 30 A quickly, indicating that the system could have the ability of self-regulation and stability, and that the control structure and parameters of the system are correct. (c) is dynamic DC voltage waveform during the whole simulation period. From the graph, it can be seen that DC voltage has a sudden drop of about 10 V when load is added, and the system will soon be restored to its original state, which indicates that the control structure and parameters are reasonable, and the system is stable.

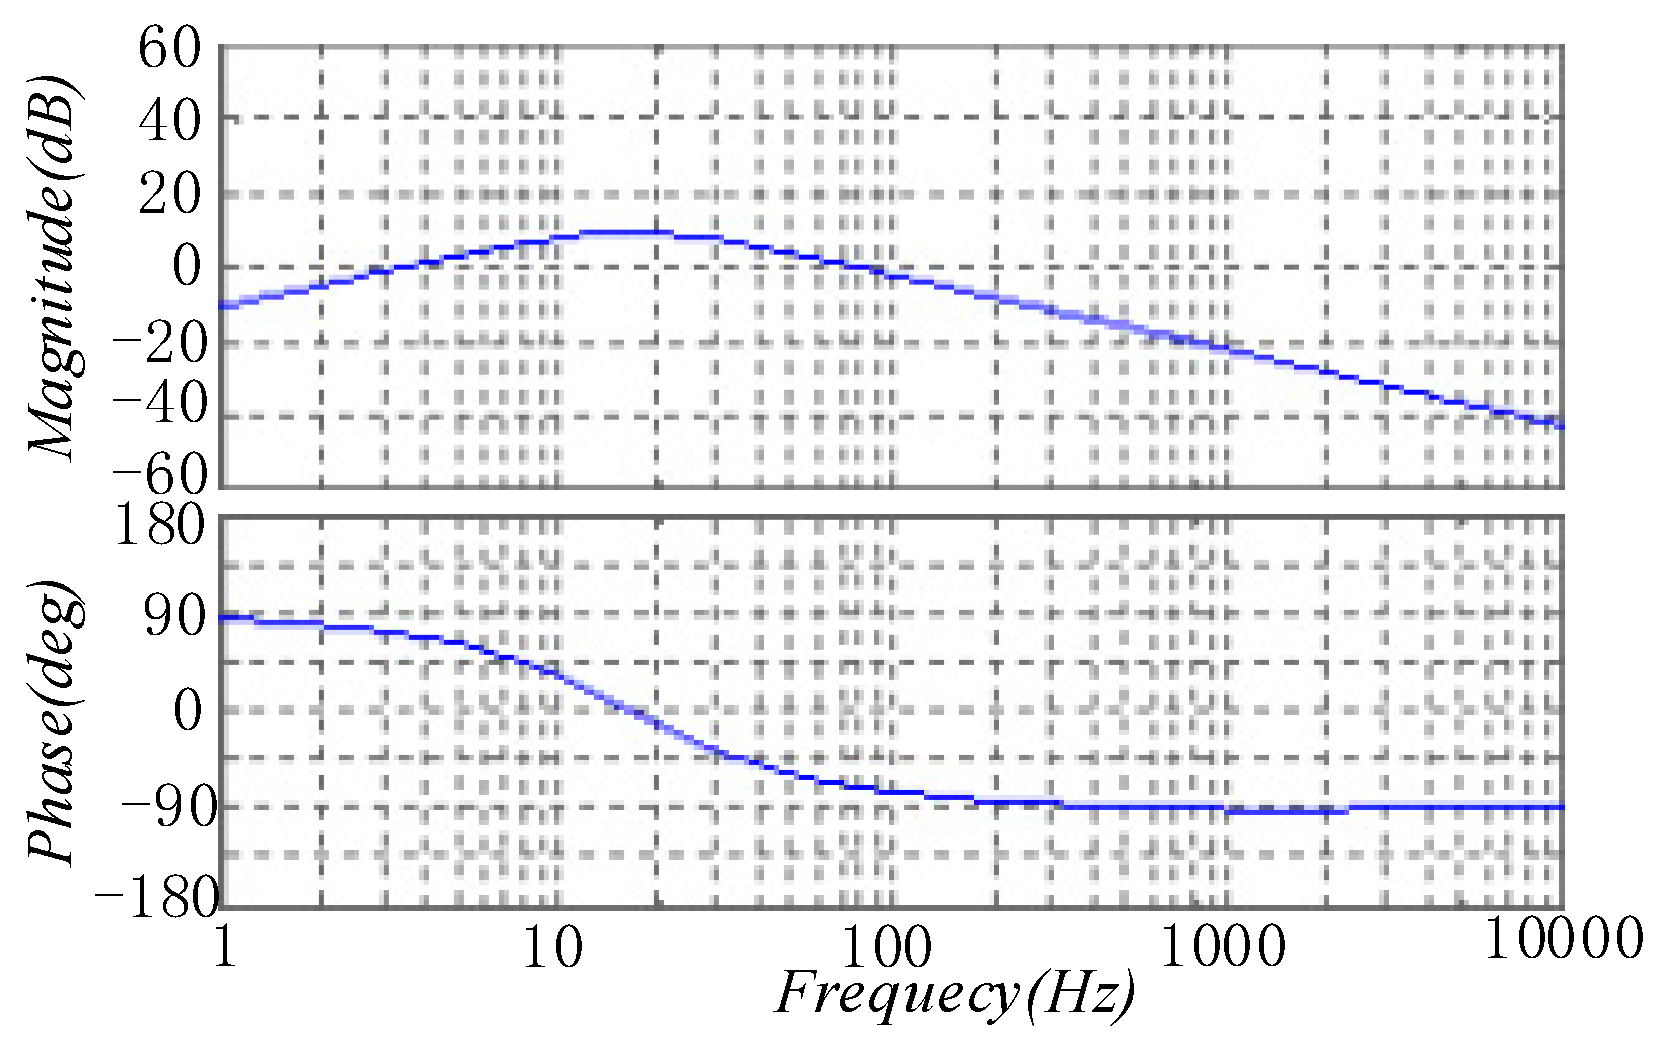
5.2. Simulation Verification and Stability Analysis of LLC Resonant Converter

Figure 14 is the input impedance of LLC resonant converter derived from the parameters given in Table 2.
Figure 14 shows that most of the bode chart values of the LLC resonant converter are above 0 and the phase angle is above −90° in the middle frequency band, and the amplitude curve of frequency 1 k–10 k is obtained. Overall, the input impedance is in a stable state, which will be ready for the subsequent analysis of the stability of the system.
The circuit parameters are listed in Table 2, which is used to build the simulation model in simulation software.
Figure 15 shows the output voltage waveform of LLC resonant converter at DC side, and the control strategy is open-loop control. It can be seen from the diagram: The output voltage of the system has fluctuation before 0.02 s, the output curve of dc side is a straight line and the system tends to stable at 0.03 s. This shows that the whole system is stable and the system parameters are correct, so it is ready to analyze the stability of the cascade system.

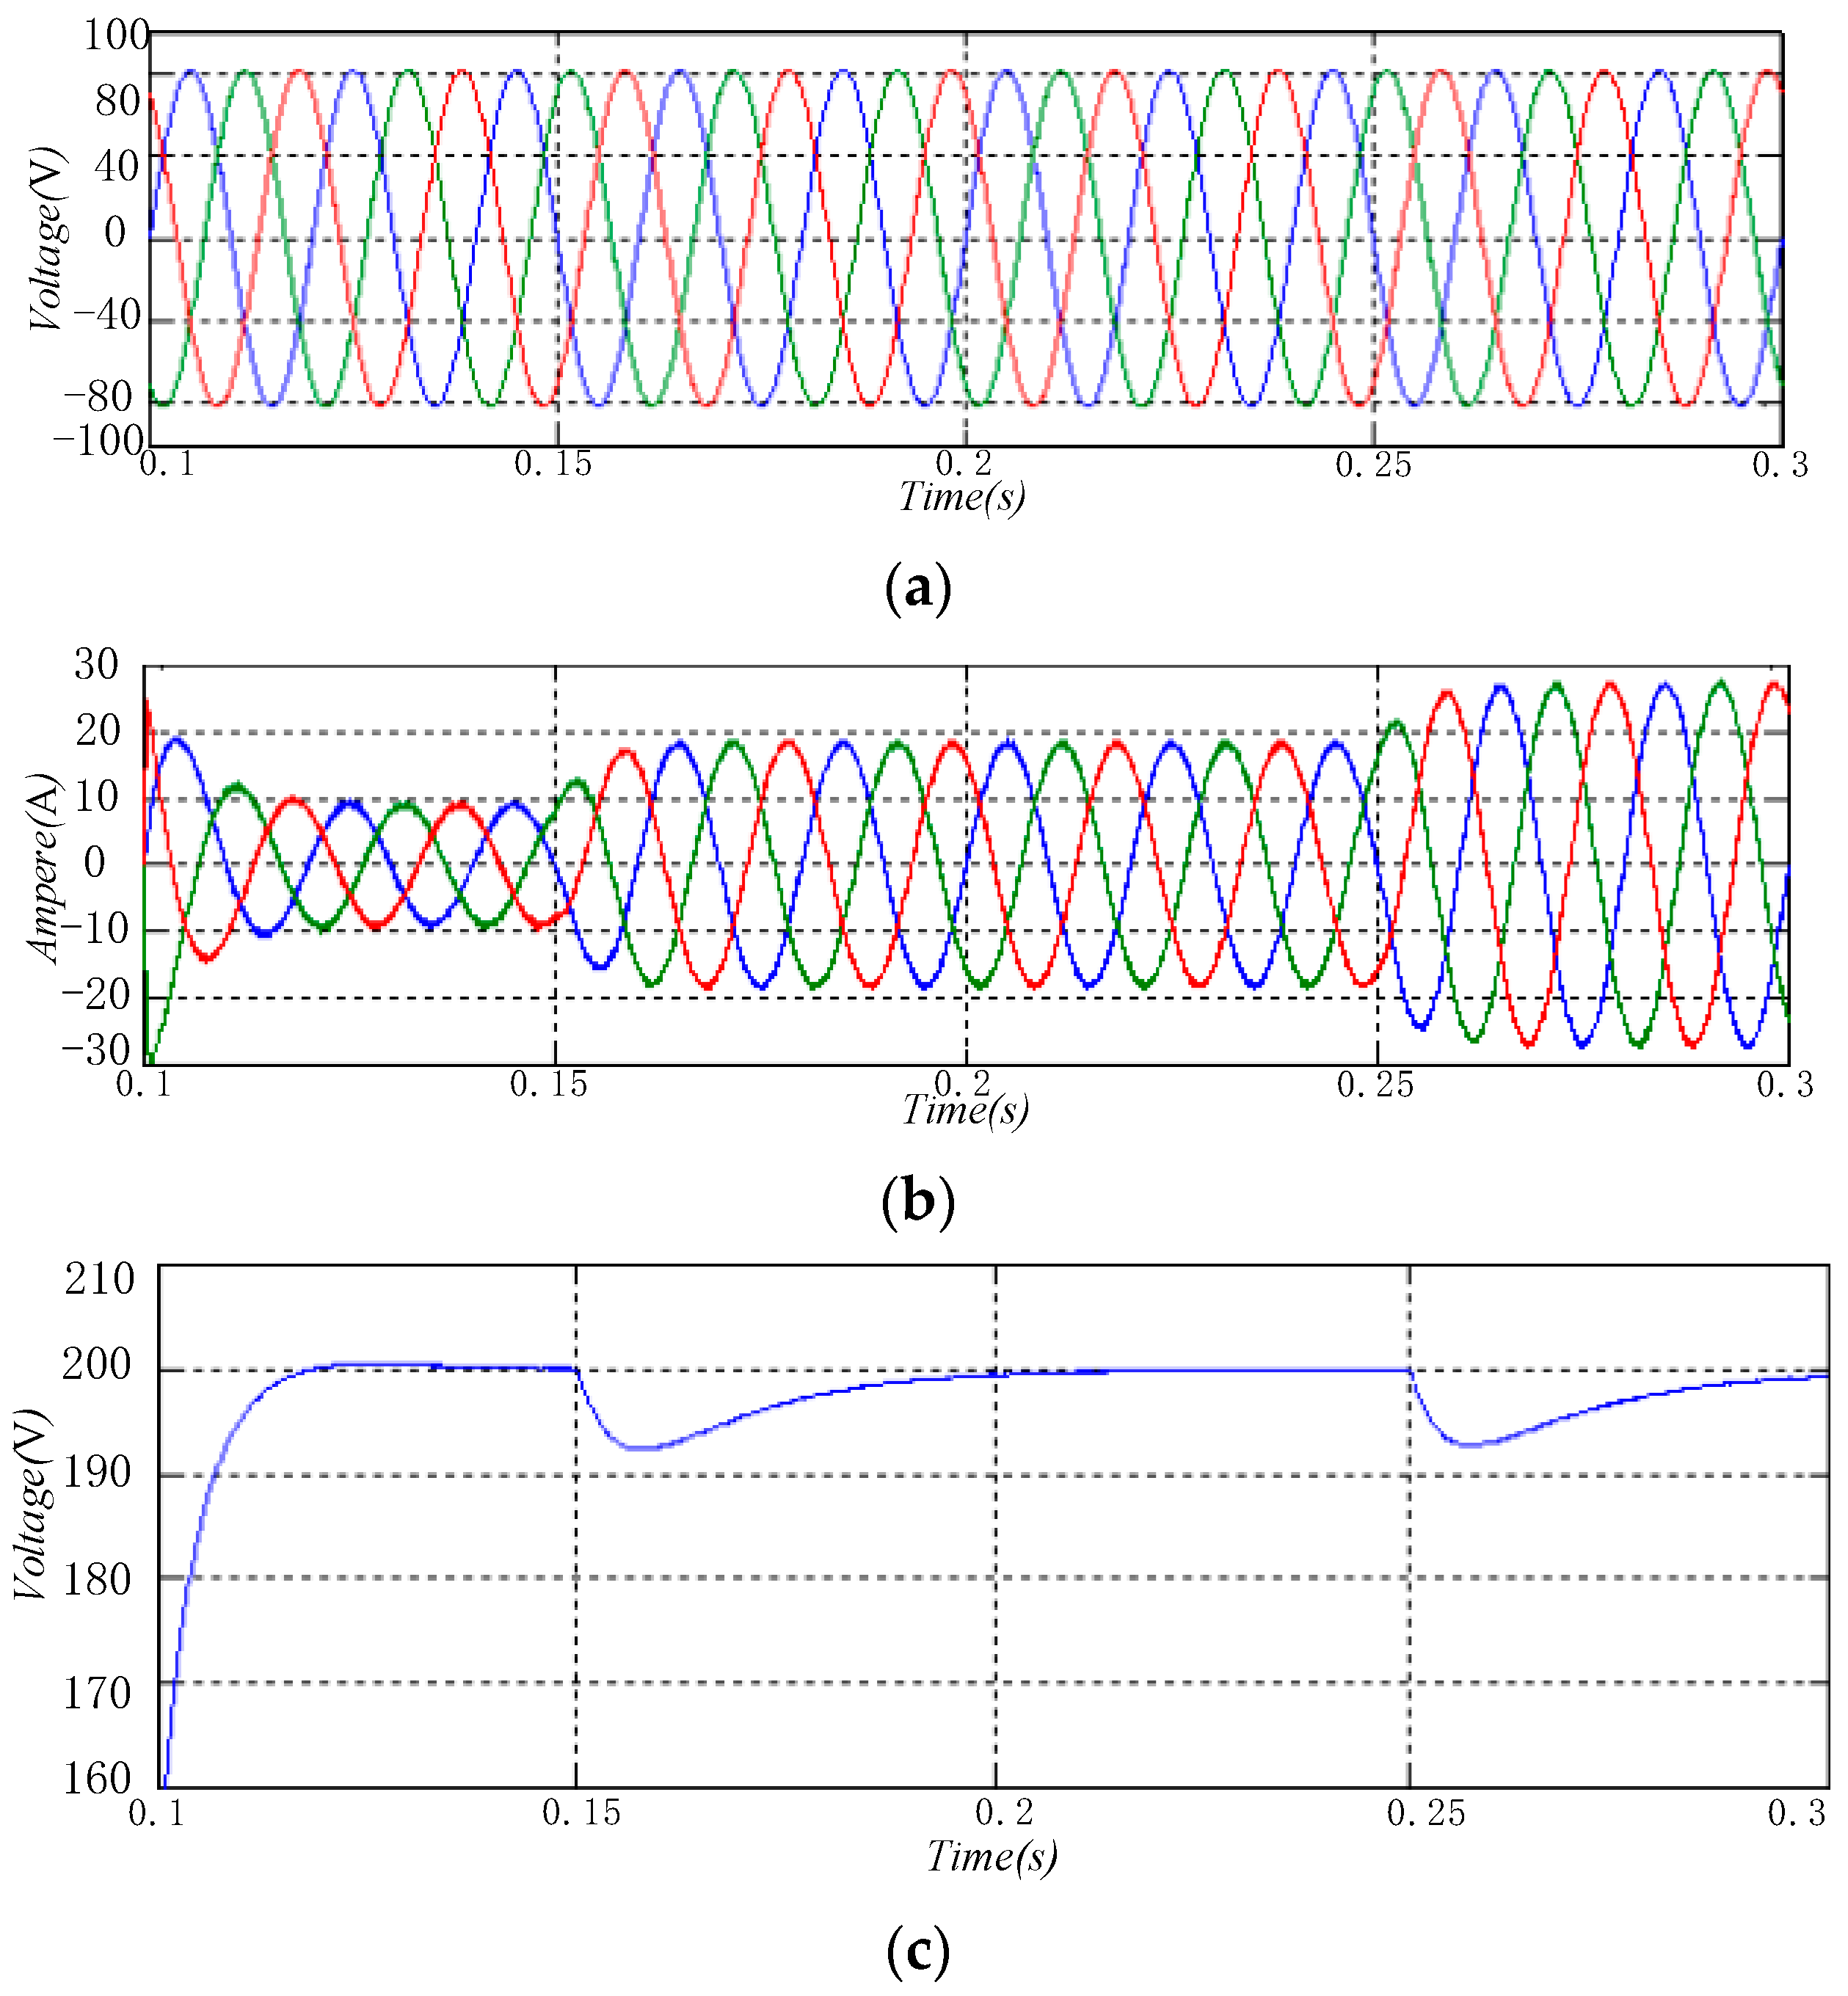
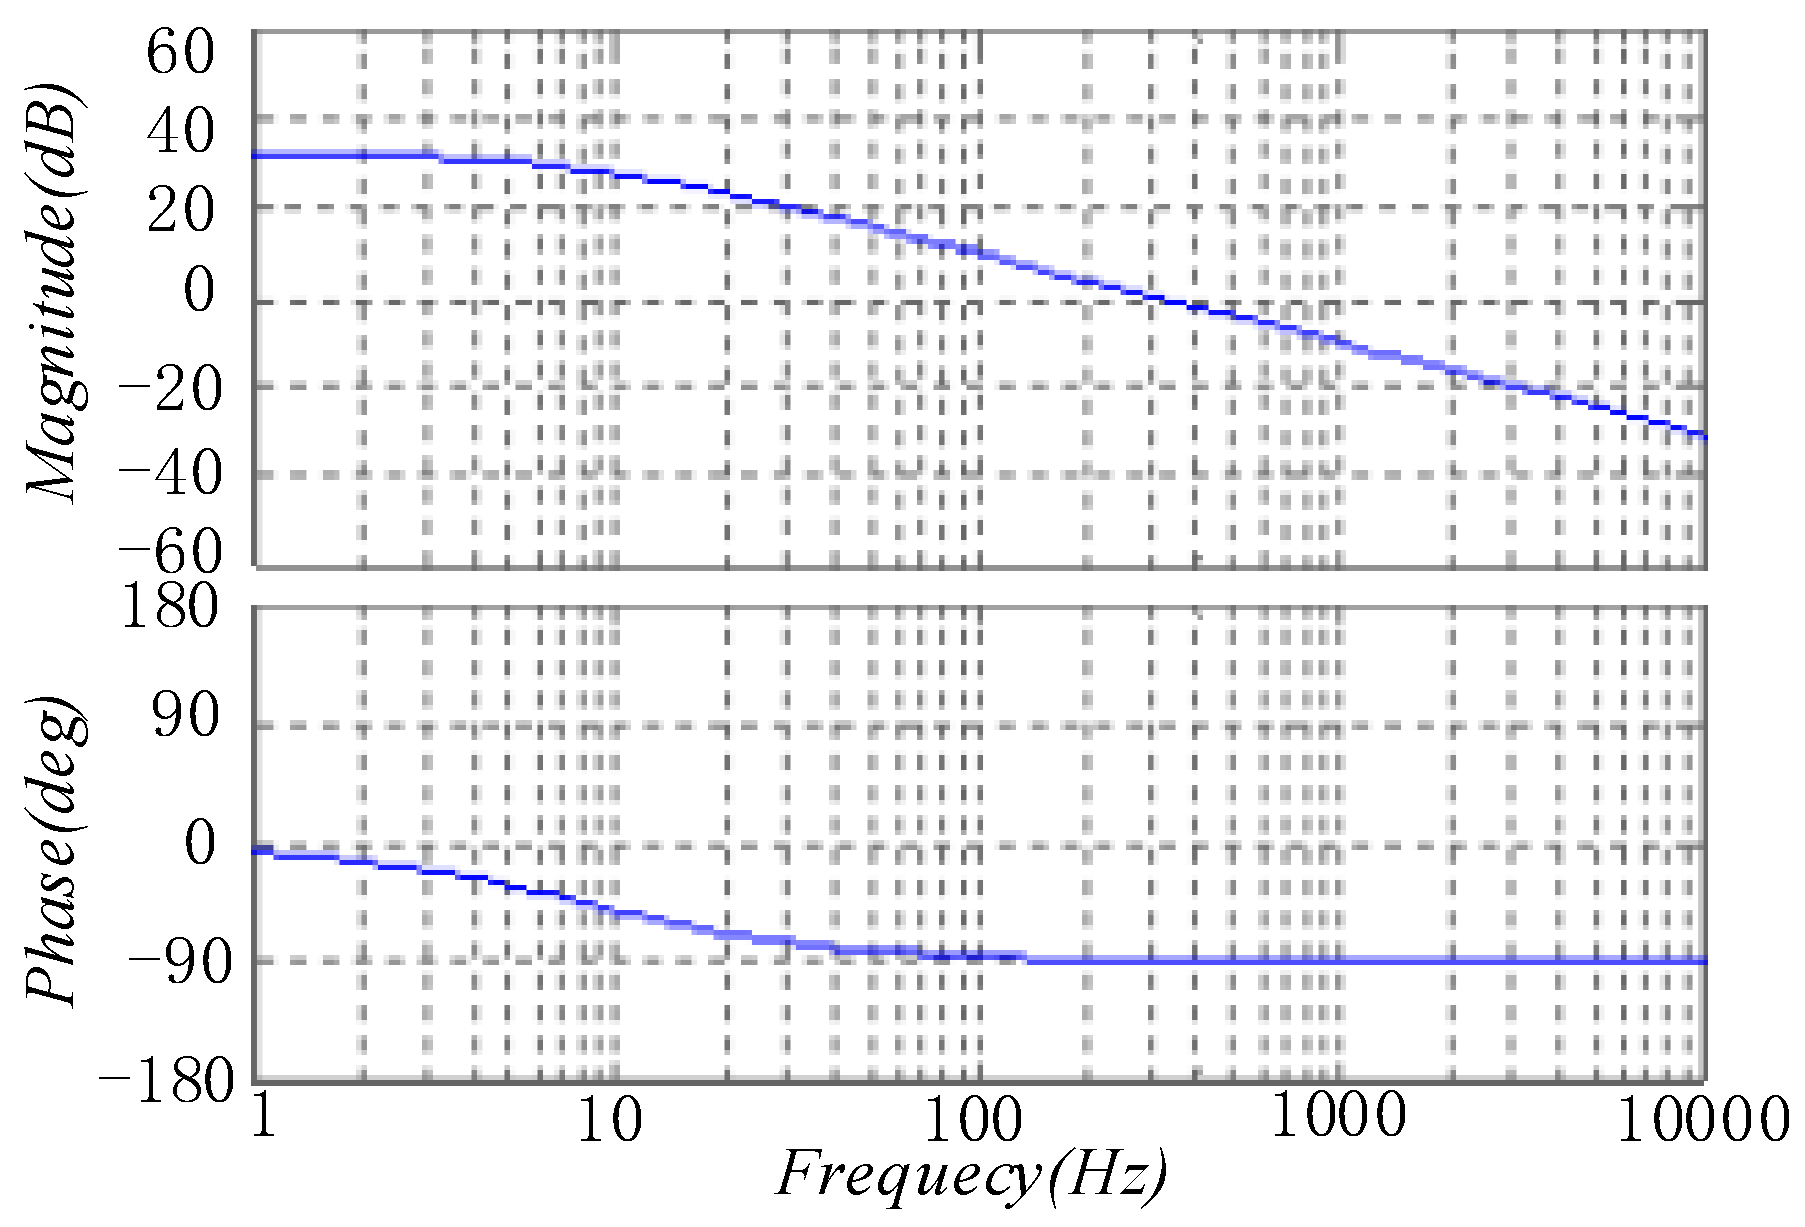
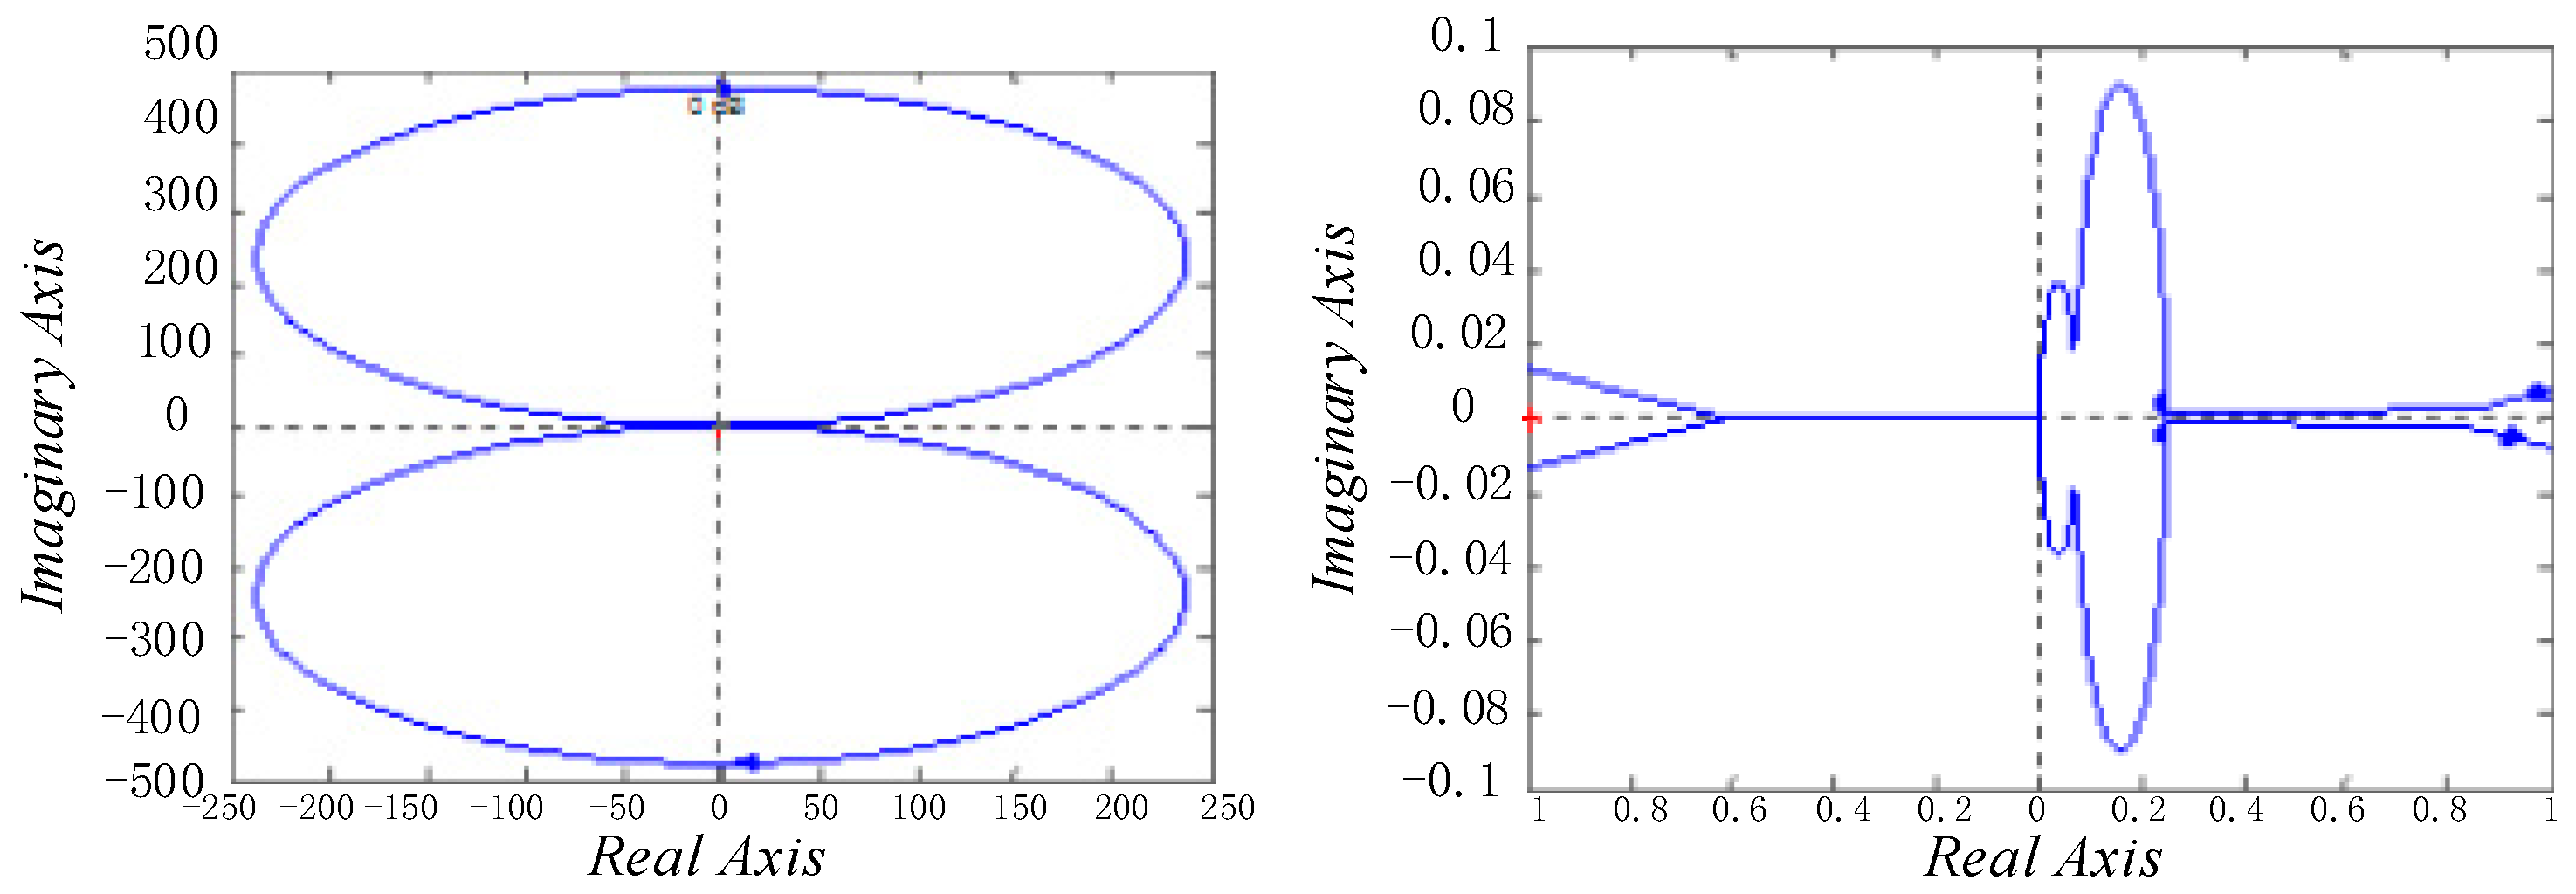
5.3. Simulation Verification and Stability Analysis of Cascaded System

The output impedance model of three-phase balanced PWM rectifier under independent operation and the input impedance model of LLC resonant converter in independent and stable operation are derived from the analysis of the previous two chapters. The two models were taken into the Formula (1) and simulated by Matlab/Simulink. As shown in Figure 16, (a) the picture is the three-phase ac side a-phase voltage and current waveform, it shows that the voltage and current have the same phase, indicating that the system operates in unit power factor. It can be seen that the PWM rectifier is stable. (b) is the current curve of the AC side, which shows that there is some instability of AC current when the system starts up, but the AC current becomes stable quickly. (c) is the output voltage waveform of the DC side of the PWM rectifier. (d) is the output voltage waveform of LLC resonant converter, it can be seen that there is fluctuation in the system at the beginning, but it tends to be stable soon. Thus, it can be proved that the whole cascade system is stable.
A comparison curve of output impedance of three-phase balanced voltage source PWM rectifier and LLC resonant converter is established in Matlab/Simulink environment, as shown in Figure 17. The green curve is the input impedance curve of LLC resonant converter, and the blue curve is the output impedance curve of three-phase balanced PWM rectifier. The amplitude of the input impedance Zo(s) is always larger than the amplitude of the output impedance Zi(s), that is |Zo(s)|<|Zi(s)|. From the above, the stability of the whole cascade system can be determined.
Figure 18 shows the ratio of output impedance to input impedance to Nyquist curve established in Matlab/Simulink environment, and the right diagram shows the simulated curve amplified at (−1,0). It can be seen from the diagram that the impedance Nyquist curve does not surround (−1,0), so it can be determined that the cascade system is stable.
Based on the above analysis, combined with the simulation waveform diagram, Bode diagram and the Nyquist curve, the impedance model of the three-phase balanced voltage type PWM rectifier and the LLC resonant converter can be established accurately, and the stability of the cascade system can be determined at the same time.

6. Conclusions

In this paper, the output impedance model of three-phase balanced voltage type PWM rectifier is built. Afterwards, the stability of the output impedance model is verified by using the bird chart. The input impedance model of LLC resonant converter is established, and the stability of it is verified by bird chart either. The simulation model of cascade system is established and corresponding simulation curves are obtained. The simulation output curve verifies the stability of the cascade system and shows that the configuration parameters and control parameters of the converter are reasonable. Also, the impedance diagram and impedance Nyquist curves are obtained. The bird curve meets the requirement of impedance stability criterion. The Nyquist curve does not revolve around the point (−1,0), which also verifies the stability of the cascade system. It is confirmed that the stability of the cascade system can be guaranteed by using impedance stability criterion under reasonable parameters. The correctness of the simulation results can provide guidance for building corresponding experiments in the laboratory. In order to realize the application of high-power electric power electronic transformer in the power grid and guarantee the stability of power grid operation, a good theoretical guidance is provided. It provides a powerful method to judge and analyze the stability of cascade systems in the future.

Author Contributions

R.W. conceived the theory; Y.W. performed the experiments; Y.L. analyzed the data; G.H. contributed materials; J.D. analysis tools; Y.L. and Y.W. wrote the paper.

Funding

This research is funded by National Key R&D Program of China under grant number 2017YFB0903300.

Conflicts of Interest

The authors declare no conflict of interest.

References

  1. Yang, D.; Ruan, X.; Wu, H. Impedance Shaping of the Grid-Connected Inverter with LCL Filter to Improve Its Adaptability to the Weak Grid Condition. IEEE Trans. Power Electron. 2014, 29, 5795–5805. [Google Scholar] [CrossRef]
  2. Miceli, R.; Schettino, G.; Viola, F. A Novel Computational Approach for Harmonic Mitigation in PV Systems with Single-Phase Five-Level CHBMI. Energies 2018, 11, 2100. [Google Scholar] [CrossRef]
  3. Cespedes, M.; Sun, J. Impedance Modeling and Analysis of Grid-Connected Voltage-Source Converters. IEEE Trans. Power Electron. 2013, 29, 1254–1261. [Google Scholar] [CrossRef]
  4. Céspedes, M.; Sun, J. Impedance shaping of three-phase grid-parallel voltage-source converters. In Proceedings of the 2012 Twenty-Seventh Annual IEEE Applied Power Electronics Conference and Exposition, Orlando, FL, USA, 5–9 February 2012; pp. 754–760. [Google Scholar]
  5. Sun, J. Impedance-Based Stability Criterion for Grid-Connected Inverters. IEEE Trans. Power Electron. 2011, 26, 3075–3078. [Google Scholar] [CrossRef]
  6. Sun, J.; Karimi, K.J. Small-signal input impedance modeling of line-frequency rectifiers. IEEE Trans. Aerosp. Electron. Syst. 2008, 44, 1489–1497. [Google Scholar] [CrossRef]
  7. Wang, X.; Blaabjerg, F.; Wu, W. Modeling and Analysis of Harmonic Stability in an AC Power-Electronics-Based Power System. IEEE Trans. Power Electron. 2014, 29, 6421–6432. [Google Scholar] [CrossRef] [Green Version]
  8. Huang, X.; Chang, D.; Ling, C.; Zheng, T.Q. Research on Single-Phase PWM Converter with Reverse Conducting IGBT Based on Loss Threshold Desaturation Control. Energies 2017, 10, 1845. [Google Scholar] [CrossRef]
  9. Liu, C.; Liu, H.; Cai, G.; Cui, S.; Liu, H.; Yao, H. Novel Hybrid LLC Resonant and DAB Linear DC–DC Converter: Average Model and Experimental Verification. IEEE Trans. Ind. Electron. 2017, 64, 6970–6978. [Google Scholar] [CrossRef]
  10. Mobarrez, M.; Ghanbari, N.; Bhattacharya, S. Control Hardware-in-the-Loop Demonstration of a Building-Scale DC Microgrid Utilizing Distributed Control Algorithm. In Proceedings of the IEEE PES General Meeting, Portland, OR, USA, 5–9 August 2018. [Google Scholar]
  11. Zhang, X.; Ruan, X.; Chi, K.T. Impedance-Based Local Stability Criterion for DC Distributed Power Systems. IEEE Trans. Circuits Syst. I 2015, 62, 916–925. [Google Scholar] [CrossRef]
  12. Middlebrook, R.D. Input Filter Considerations in design and application of switching regulators. In Proceedings of the IEEE Industry Applications Society Annual Meeting, Chicago, IL, USA, 11–14 October 1974. [Google Scholar]
  13. Jang, J.; Pidaparthy, S.K.; Choi, B. Current Mode Control for LLC Series Resonant DC-to-DC Converters. Energies 2015, 8, 6098–6113. [Google Scholar] [CrossRef] [Green Version]
  14. Blaabjerg, F.; Teodorescu, R.; Liserre, M.; Timbus, A.V. Overview of Control and Grid Synchronization for Distributed Power Generation Systems. IEEE Trans. Ind. Electron. 2006, 53, 1398–1409. [Google Scholar] [CrossRef] [Green Version]
  15. Yoon, C.; Bai, H.; Beres, R.N.; Wang, X.; Bak, C.L.; Blaabjerg, F. Harmonic Stability Assessment for Multiparalleled, Grid-Connected Inverters. IEEE Trans. Sustain. Energy 2016, 7, 1388–1397. [Google Scholar] [CrossRef]
  16. Rygg, A.; Molinas, M.; Zhang, C.; Cai, X. A Modified Sequence-Domain Impedance Definition and Its Equivalence to the dq-Domain Impedance Definition for the Stability Analysis of AC Power Electronic Systems. IEEE J. Emerg. Sel. Top. Power Electron. 2016, 4, 1383–1396. [Google Scholar] [CrossRef] [Green Version]
  17. Lin, R.L.; Lin, C.W. Design criteria for resonant tank of LLC DC-DC resonant converter. In Proceedings of the 36th Annual Conference on IEEE Industrial Electronics Society (IECON 2010), Glendale, AZ, USA, 7–10 November 2010; pp. 427–432. [Google Scholar]
  18. Tian, S.; Lee, F.C.; Li, Q.; Li, B. Small-signal equivalent circuit model of series resonant converter. In Proceedings of the 2015 IEEE Energy Conversion Congress and Exposition (ECCE), Montreal, QC, Canada, 20–24 September 2015; pp. 172–179. [Google Scholar]
  19. Sun, J.; Liu, H. Impedance modeling and analysis of modular multilevel converters. In Proceedings of the 2016 IEEE 17th Workshop on Control and Modeling for Power Electronics (COMPEL), Trondheim, Norway, 27–30 June 2016; pp. 1–9. [Google Scholar]
  20. Wildrick, C.M.; Lee, F.C.; Cho, B.H.; Choi, B. A method of defining the load impedance specification for a stable distributed power system. IEEE Trans. Power Electron. 1995, 10, 280–285. [Google Scholar] [CrossRef]
Figure 1. PWM rectifier and LLC resonant converter cascade system structure diagram.
Energies 11 03050 g001
Figure 2. Structure schematic diagram of impedance stability criterion.
Energies 11 03050 g002
Figure 3. Structure of three-phase balanced PWM rectifier.
Energies 11 03050 g003
Figure 4. PWM rectifier small signal model equivalent circuit diagram.
Energies 11 03050 g004
Figure 5. Three-phase PWM rectifier small signal control block diagram.
Energies 11 03050 g005
Figure 6. PWM rectifier d-axis small signal model.
Energies 11 03050 g006
Figure 7. Circuit topology diagram of full-bridge LLC resonant converter.
Energies 11 03050 g007
Figure 8. Circuit topology of LLC resonant converter.
Energies 11 03050 g008
Figure 9. Small signal model of excitation inductance.
Energies 11 03050 g009
Figure 10. LLC resonant converter small signal model in real field.
Energies 11 03050 g010
Figure 11. LLC resonant converter third order small signal model.
Energies 11 03050 g011
Figure 12. The bode diagram of PWM rectifier DC side’s output impedance model.
Energies 11 03050 g012
Figure 13. Simulation diagram of three-phase balanced PWM rectifier. (a) Steady waveform of Three-phase voltage; (b) Steady waveform of Three-phase current; (c) DC dynamic capacitance voltage waveform.
Energies 11 03050 g013
Figure 14. The bode diagram of LLC resonant converter’s input impedance model.
Energies 11 03050 g014
Figure 15. LLC resonant converter output simulation curve.
Energies 11 03050 g015
Figure 16. Output voltage simulation curve of cascade system. (a) The three-phase ac side a-phase voltage and current waveform; (b) The current curve of the AC side; (c) The output voltage waveform of the DC side of the PWM rectifier; (d) Output voltage waveform of LLC resonant converter.
Energies 11 03050 g016
Figure 17. Bode diagram of front stage output impedance and back stage input impedance.
Energies 11 03050 g017
Figure 18. Impedance ratio Nyquist curve of cascade system.
Energies 11 03050 g018
Table 1. Simulation parameters.
ParametersValue
AC line voltage100 V
DC voltage200 V
AC inductance1.8 mH
DC capacitance2200 uF
Resistance of load36 Ω
Voltage outer loop parameters (proportion)0.75
Voltage outer loop control parameters (integral)50
Current inner loop control parameters (proportion)10
Current inner loop control parameters (integral)400
Table 2. Parameters of LLC resonant Converter.
ParametersSymbolValue
LLC switching frequencyfs40 k
Transformer turn ration1
Transformer excitation inductanceLm1 m
Transformer leakage inductanceLr30.7 u
Resonant capacitanceCr0.33 u
Output filter capacitanceCo500 u

