A Feasibility Study on Power Generation from Solar Thermal Wind Tower: Inclusive Impact Assessment Concerning Environmental and Economic Costs


Abstract
1. Introduction
2. Methodology
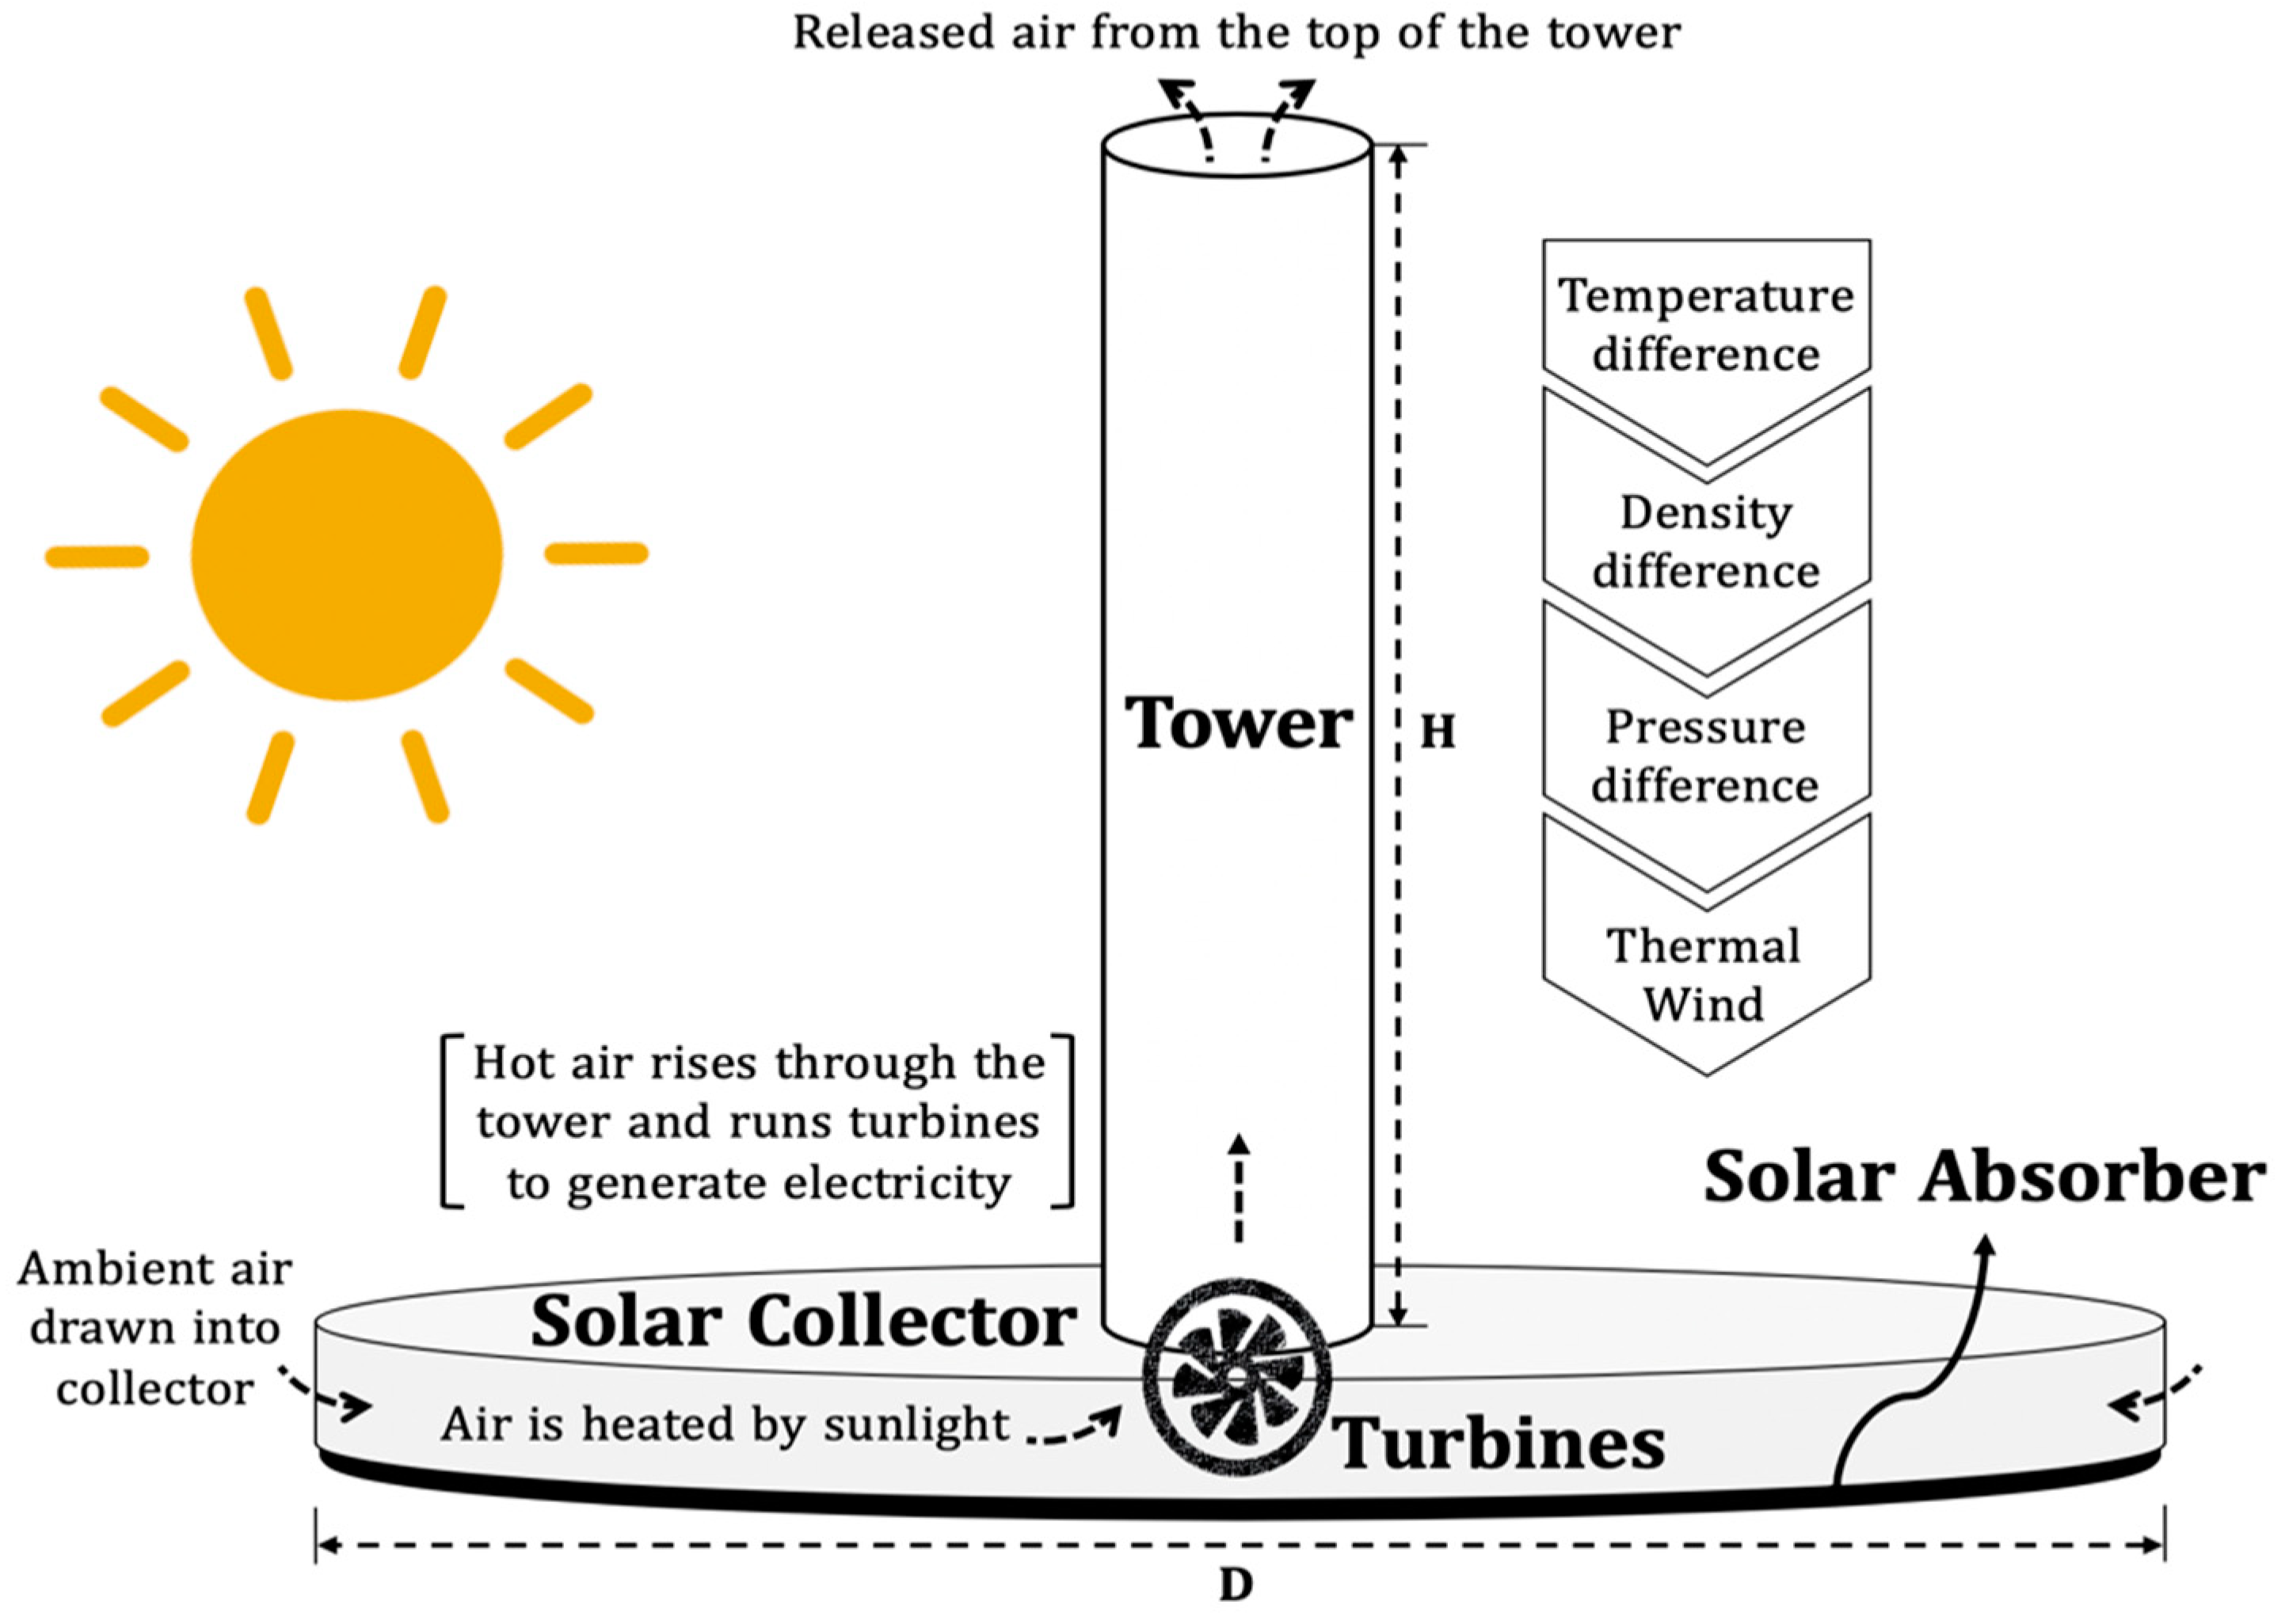
2.1. STWT Design Principles and Output Power
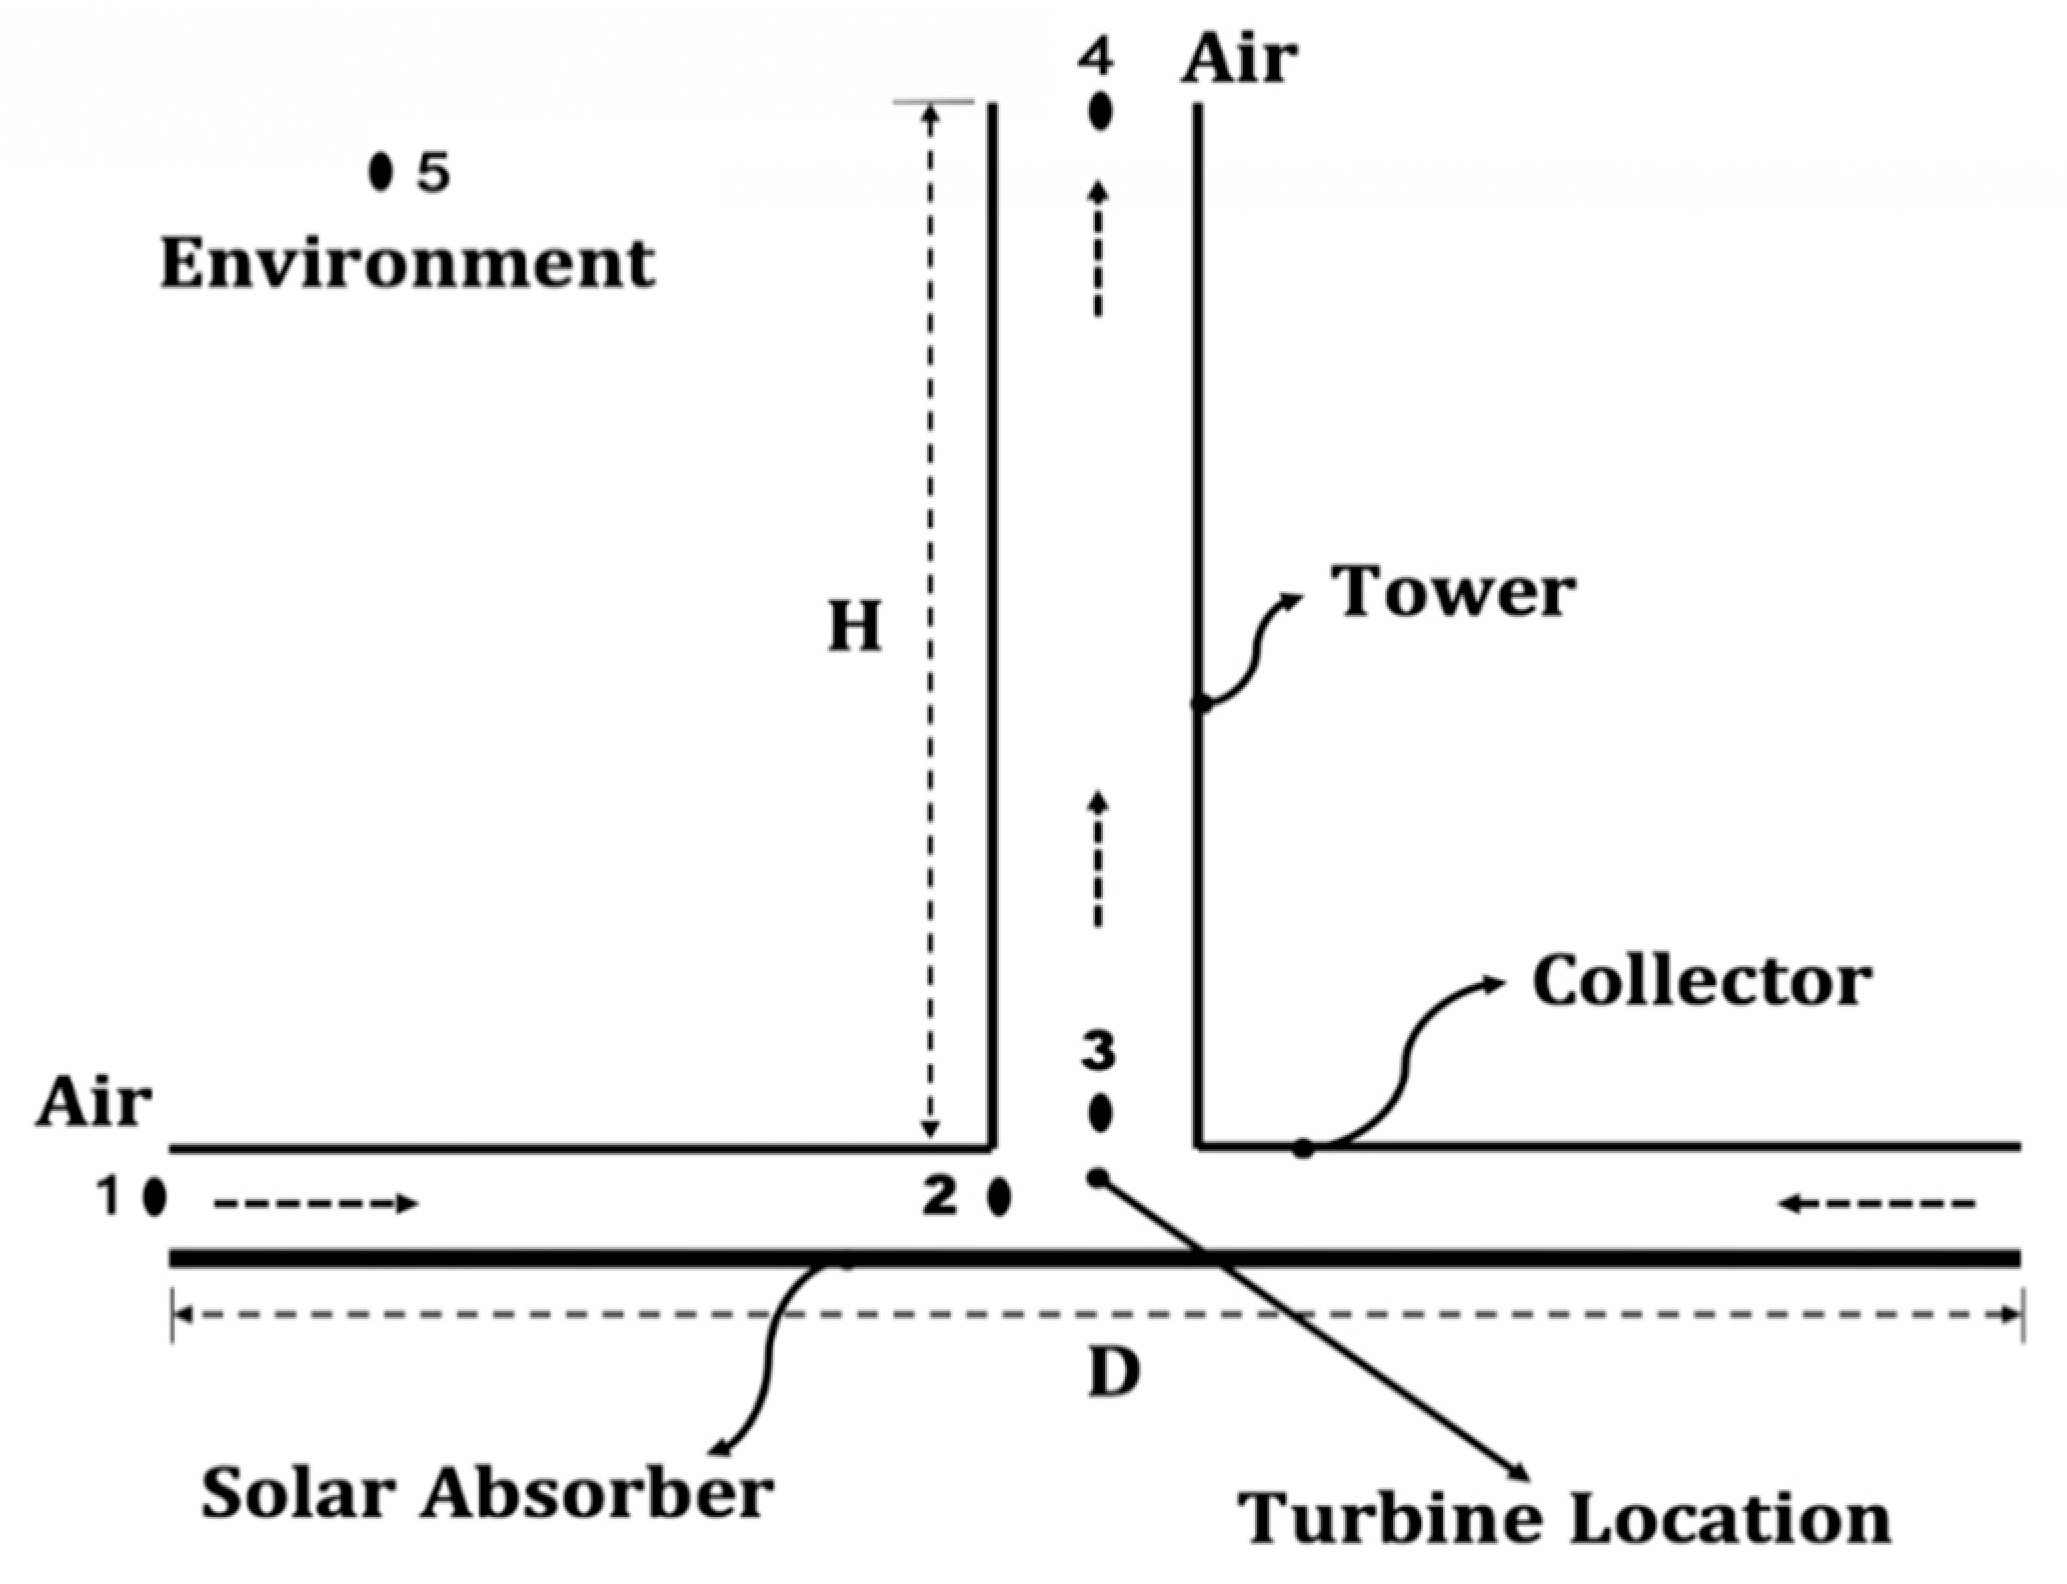
2.1.1. Physical Model of STWT
2.1.2. Parameters
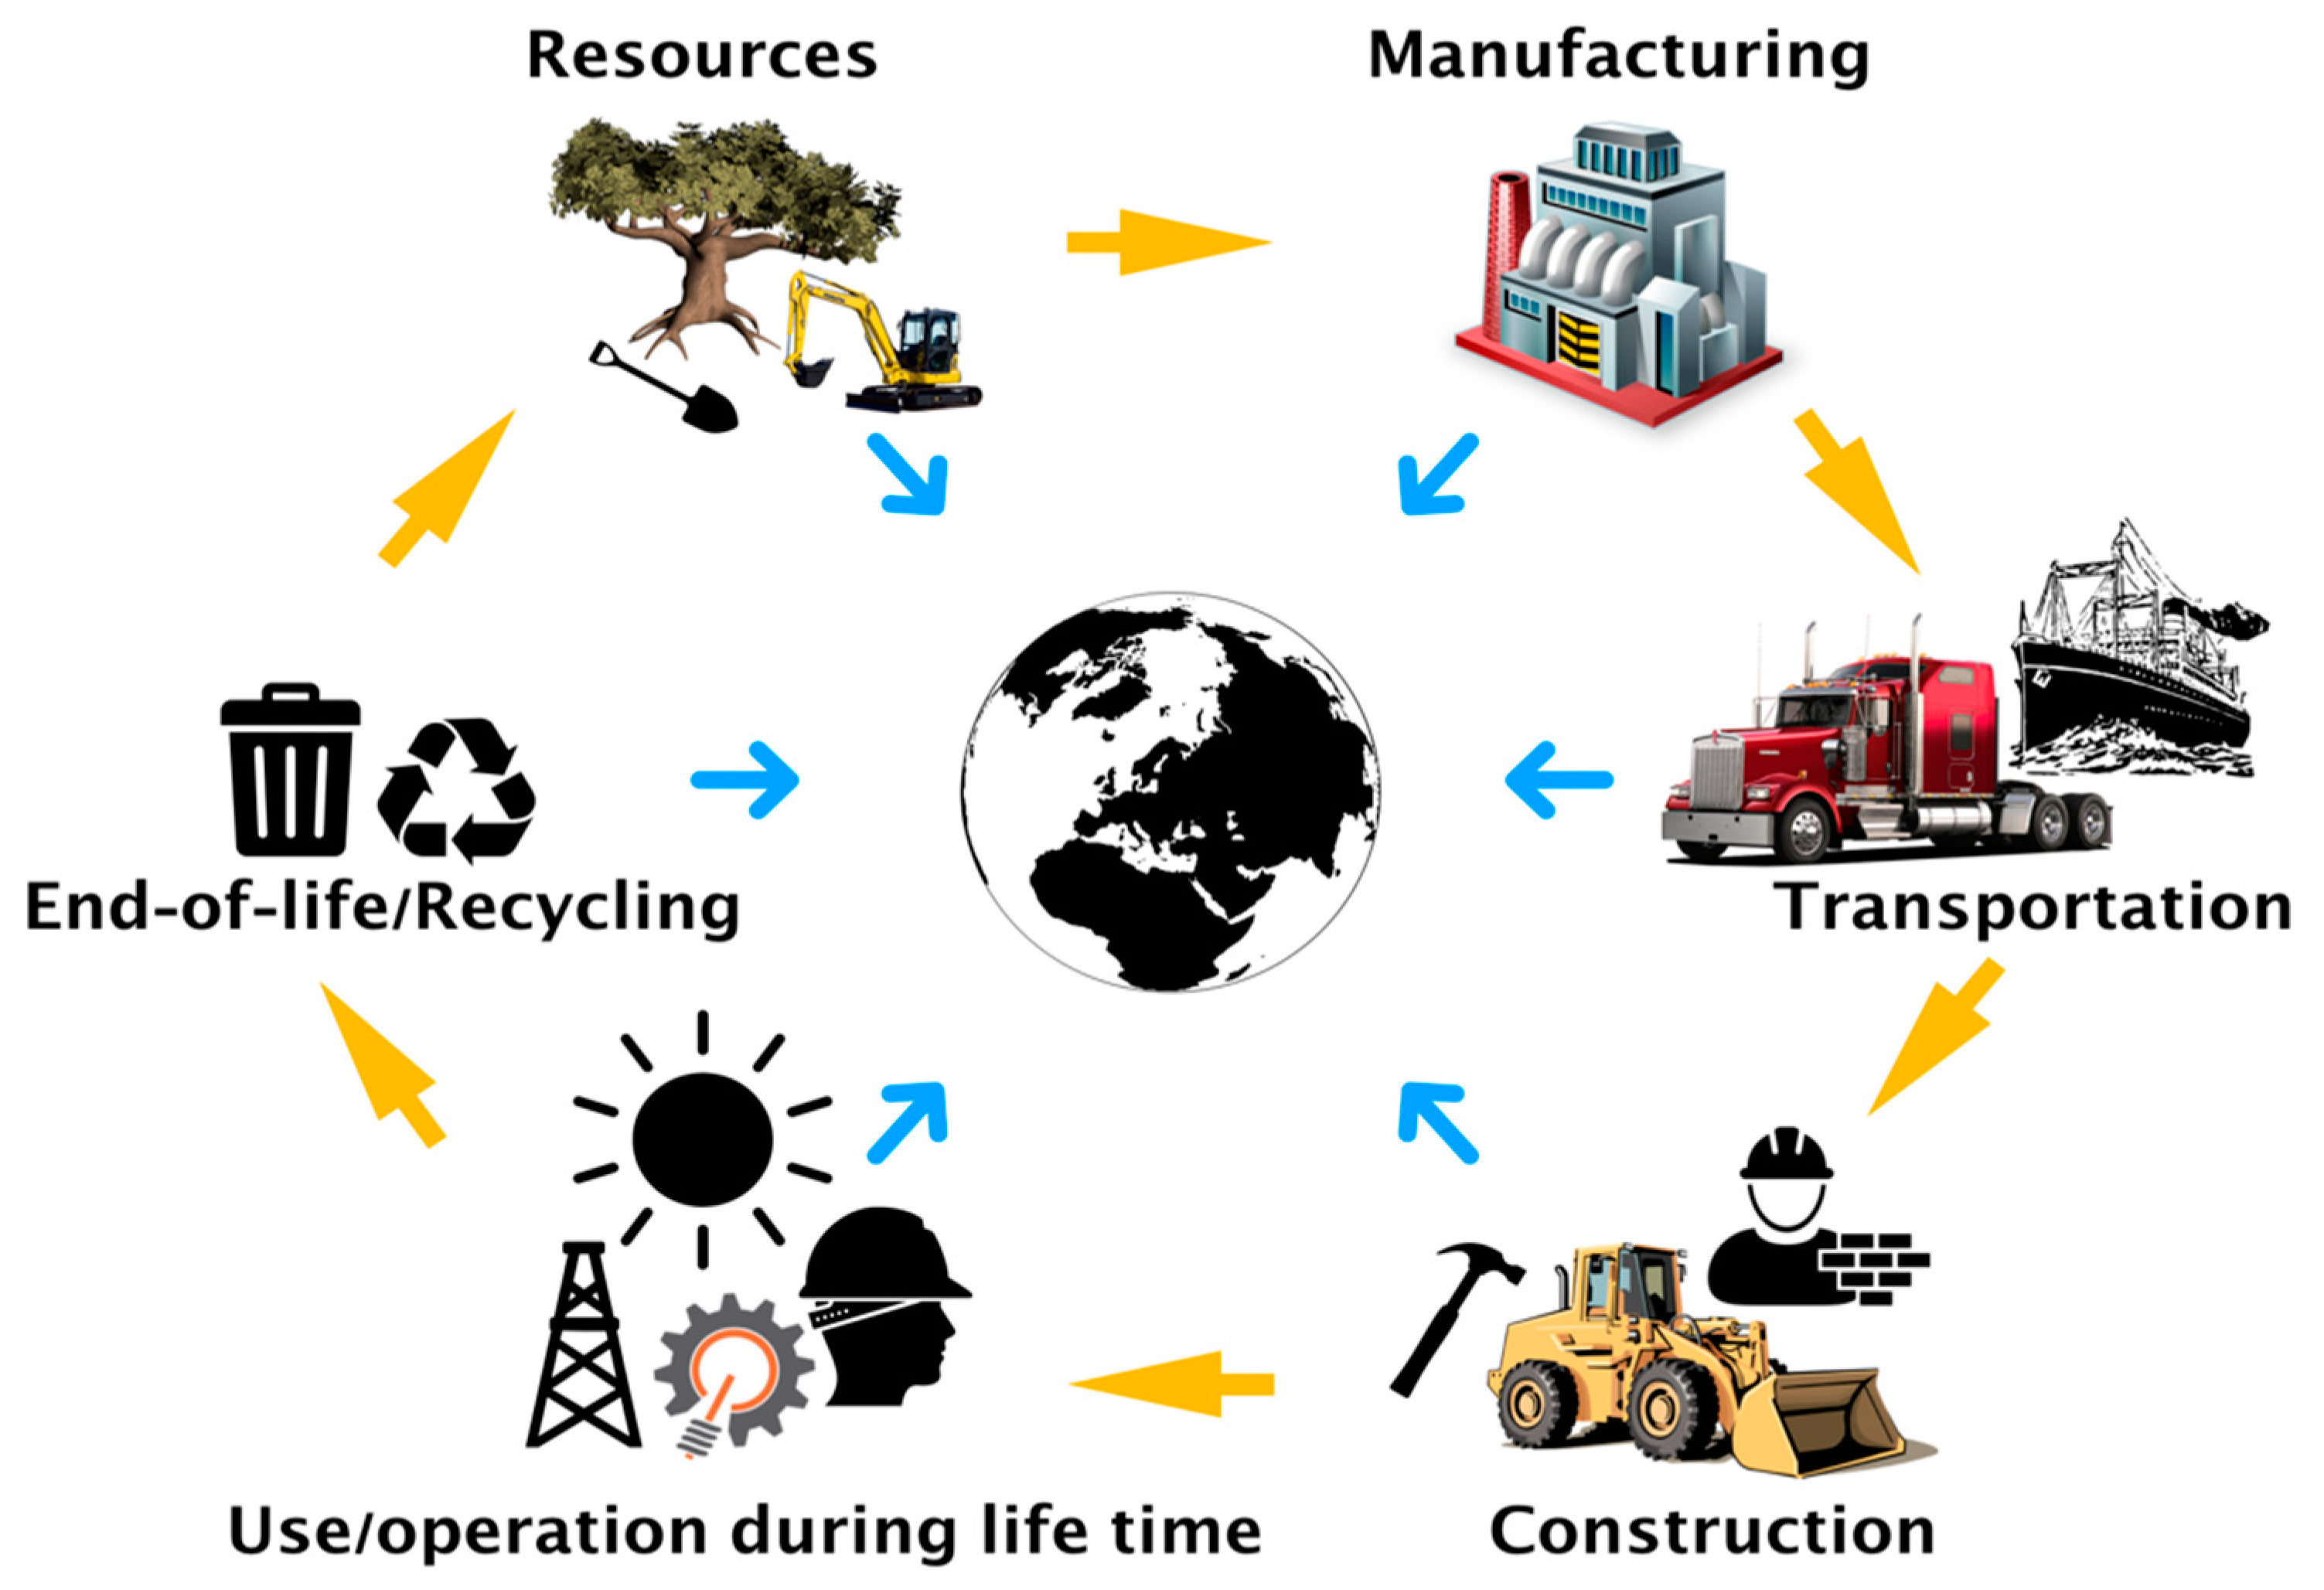
2.2. Environmental Impact: Life-Cycle Assessment
2.2.1. Materials and Weight Distribution
2.2.2. Carbon Footprint
2.3. Economic Aspect: Levelized Electricity Cost
2.3.1. Investment Cost
2.3.2. Levelized Electricity Cost
2.3.3. Parameters
2.4. Inclusive Impact: Triple I and Ecological Footprint
2.4.1. Ecological Footprint
2.4.2. Inclusive Impact Assessment Index (Triple I-light)
3. Results and Discussion
3.1. Calculations of Output Power and System Efficiency
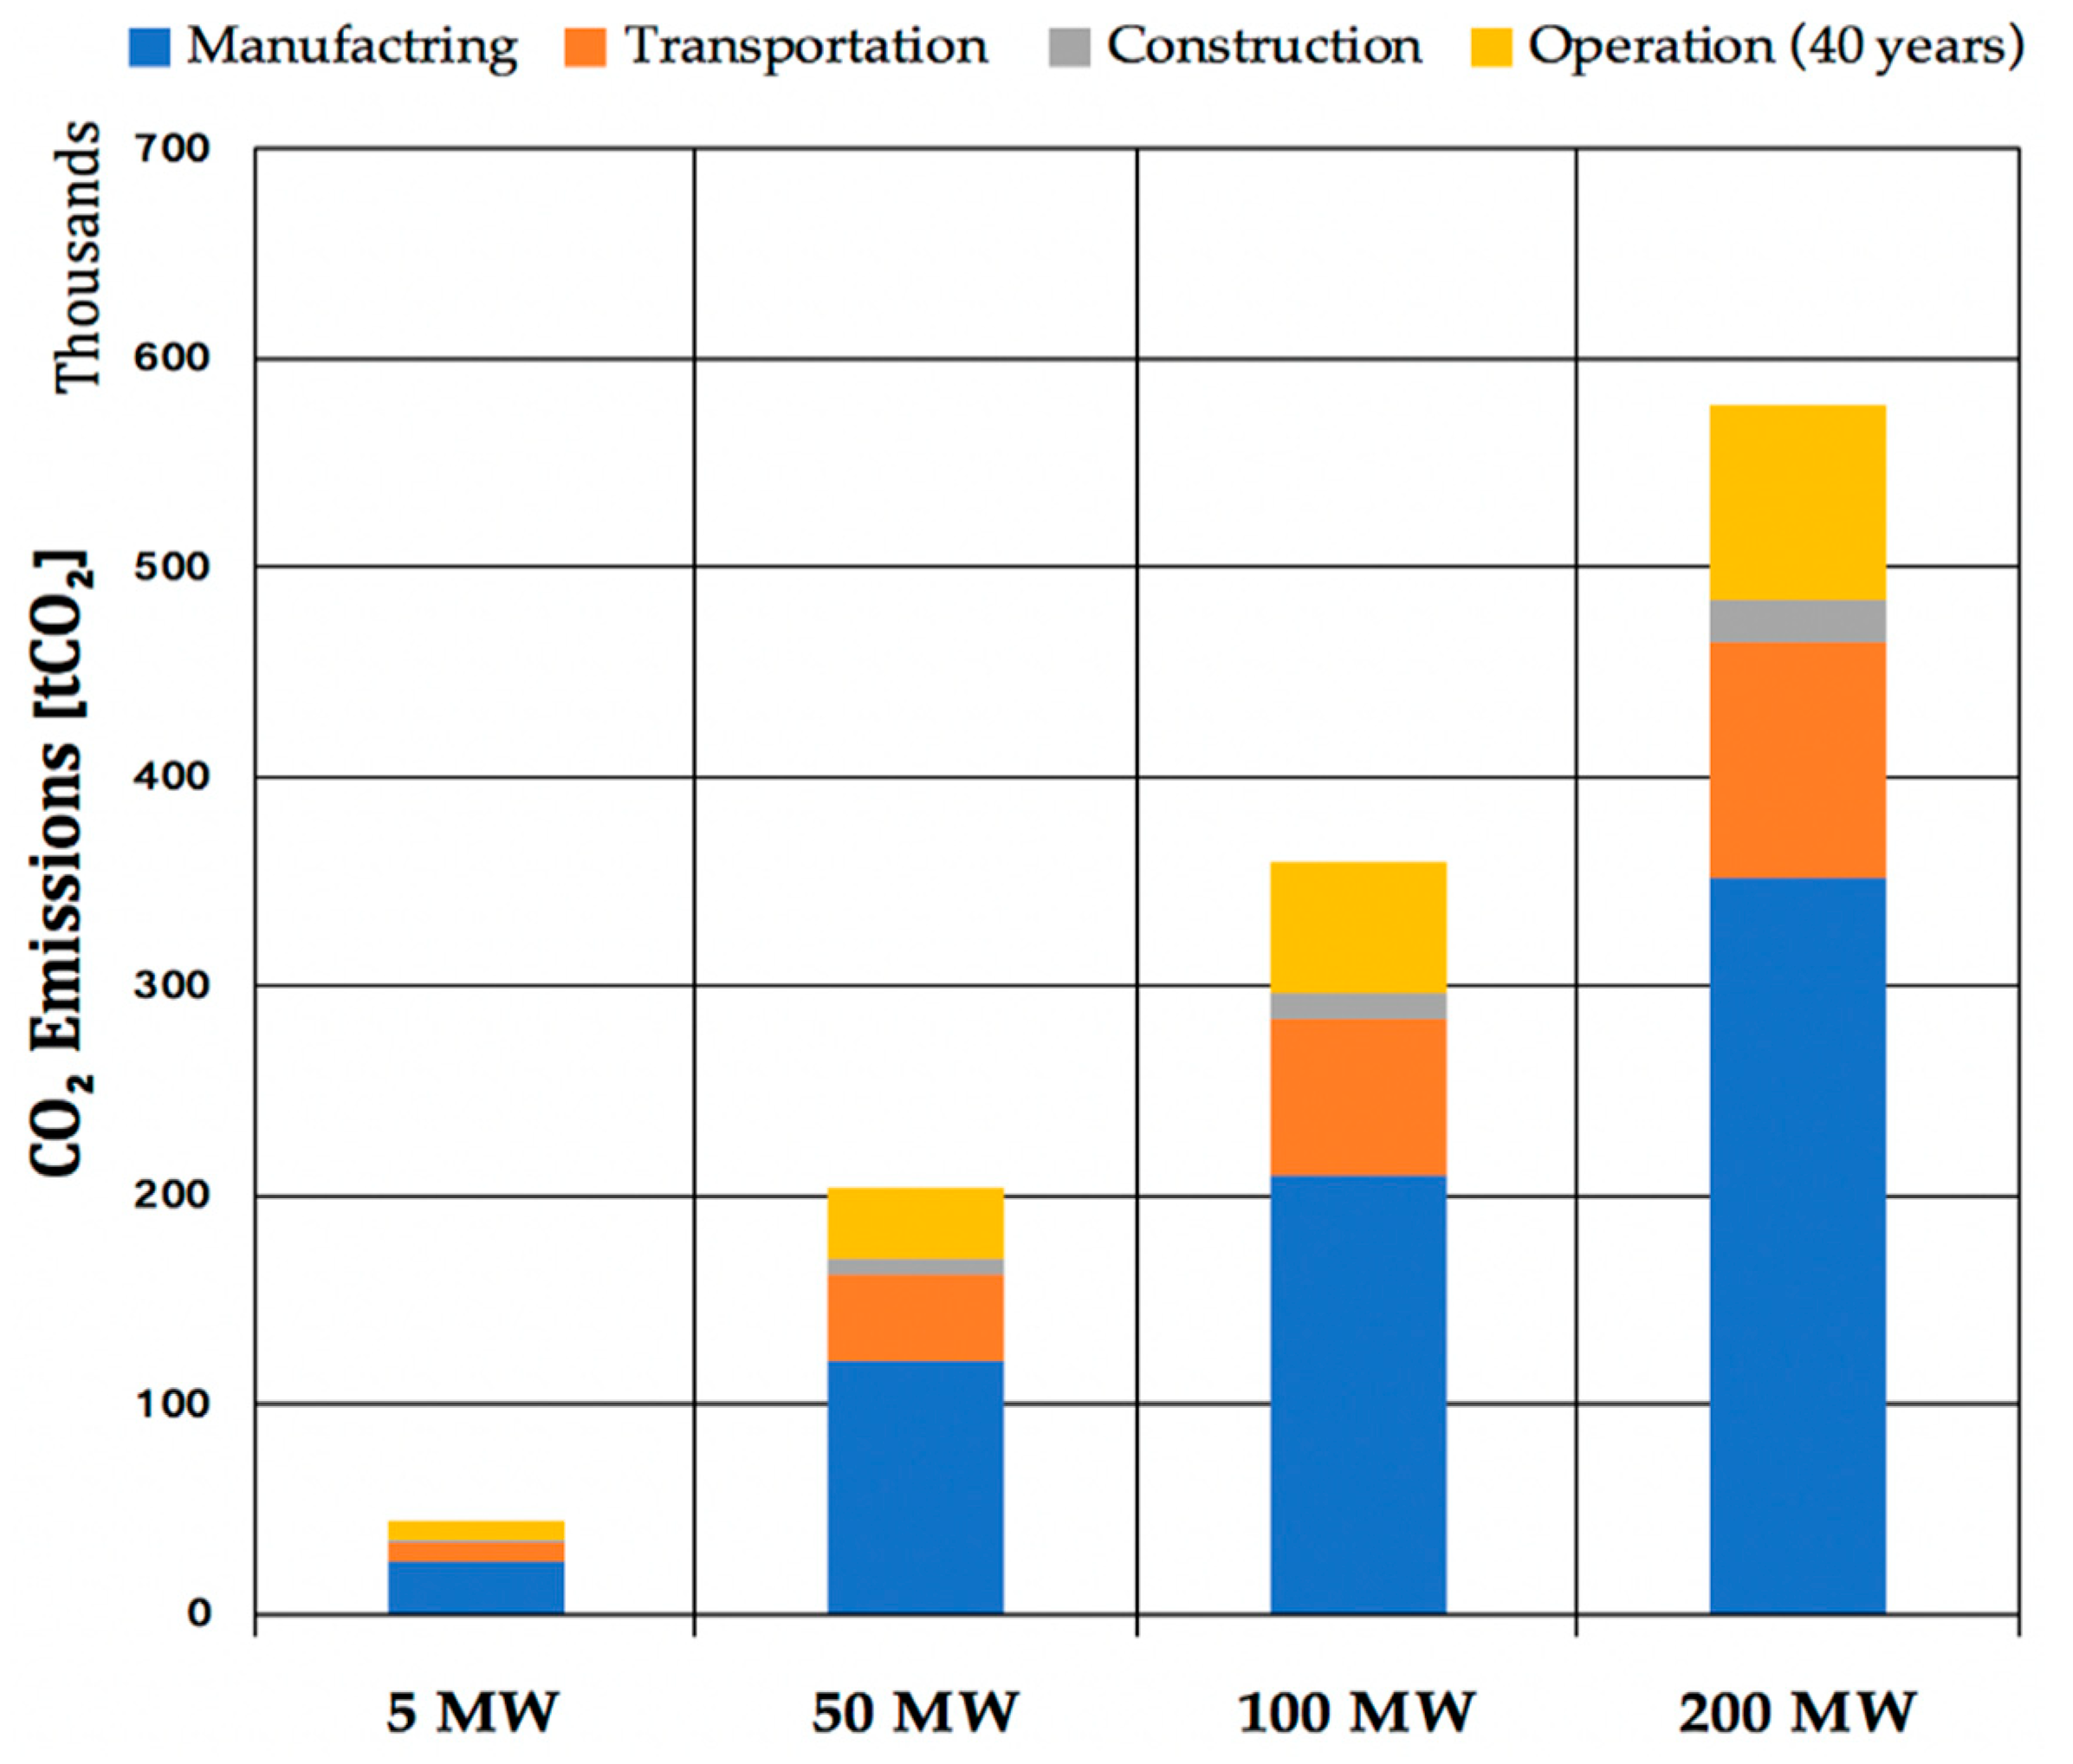
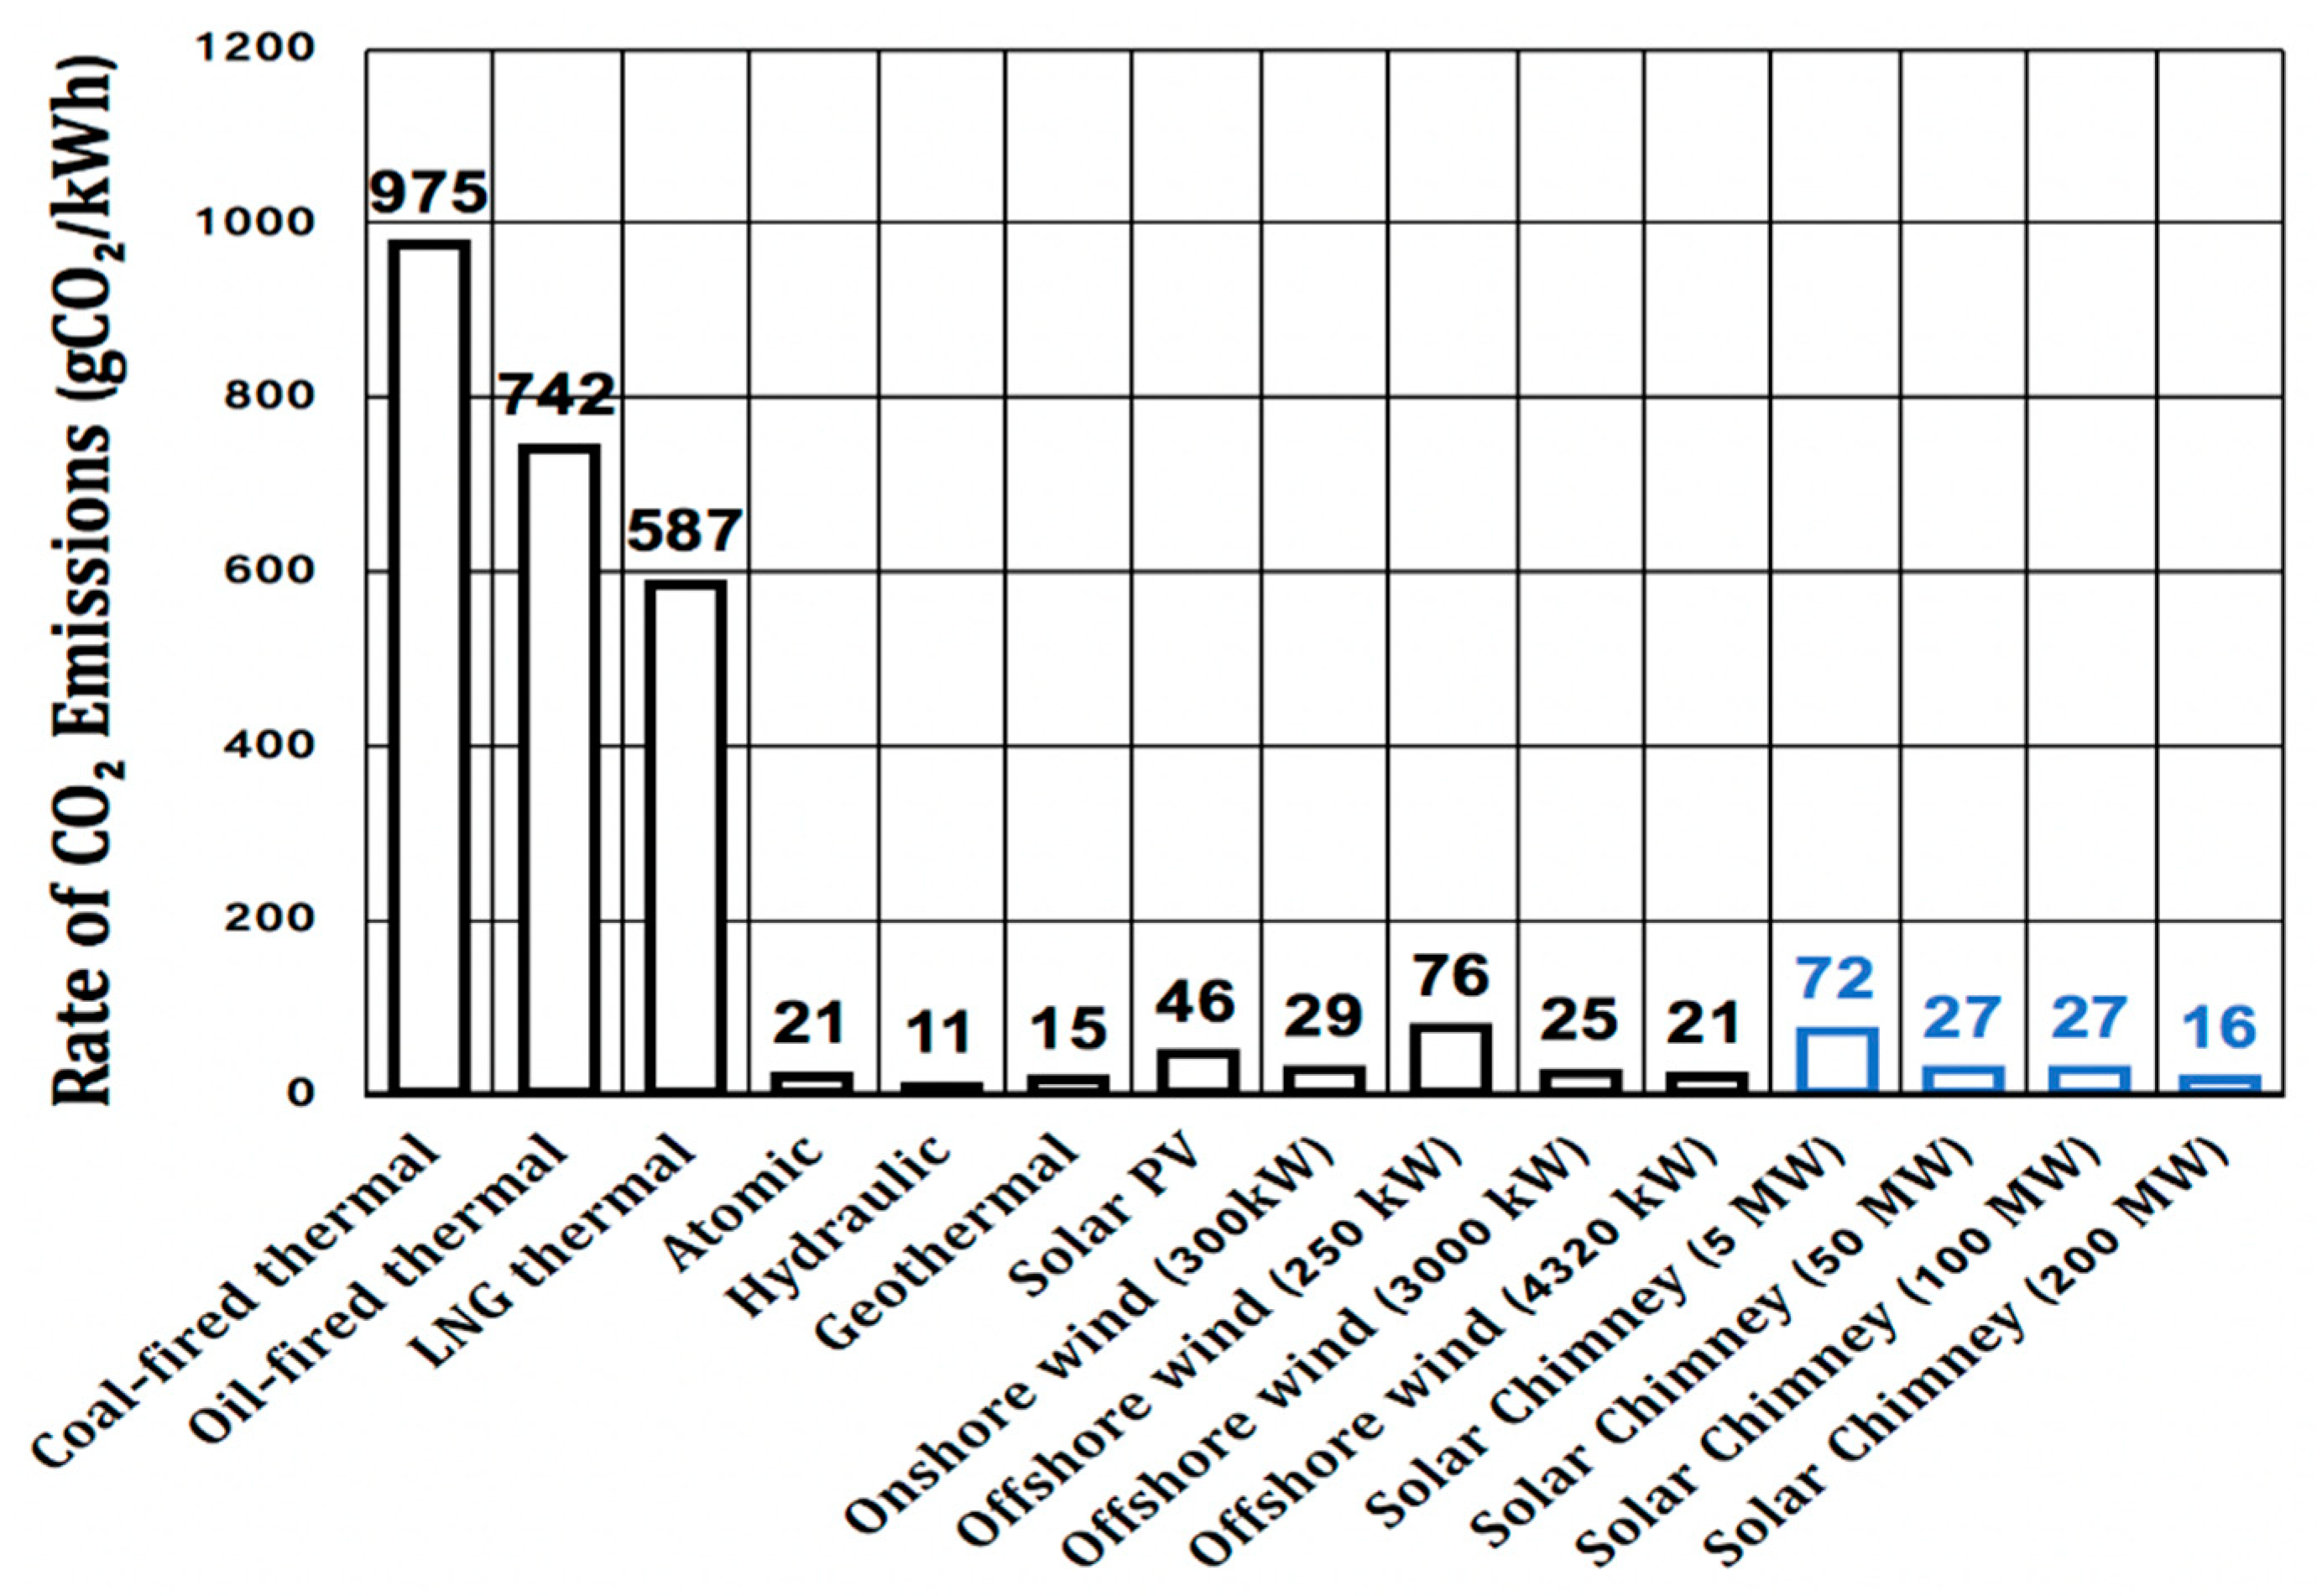
3.2. Carbon Footprint
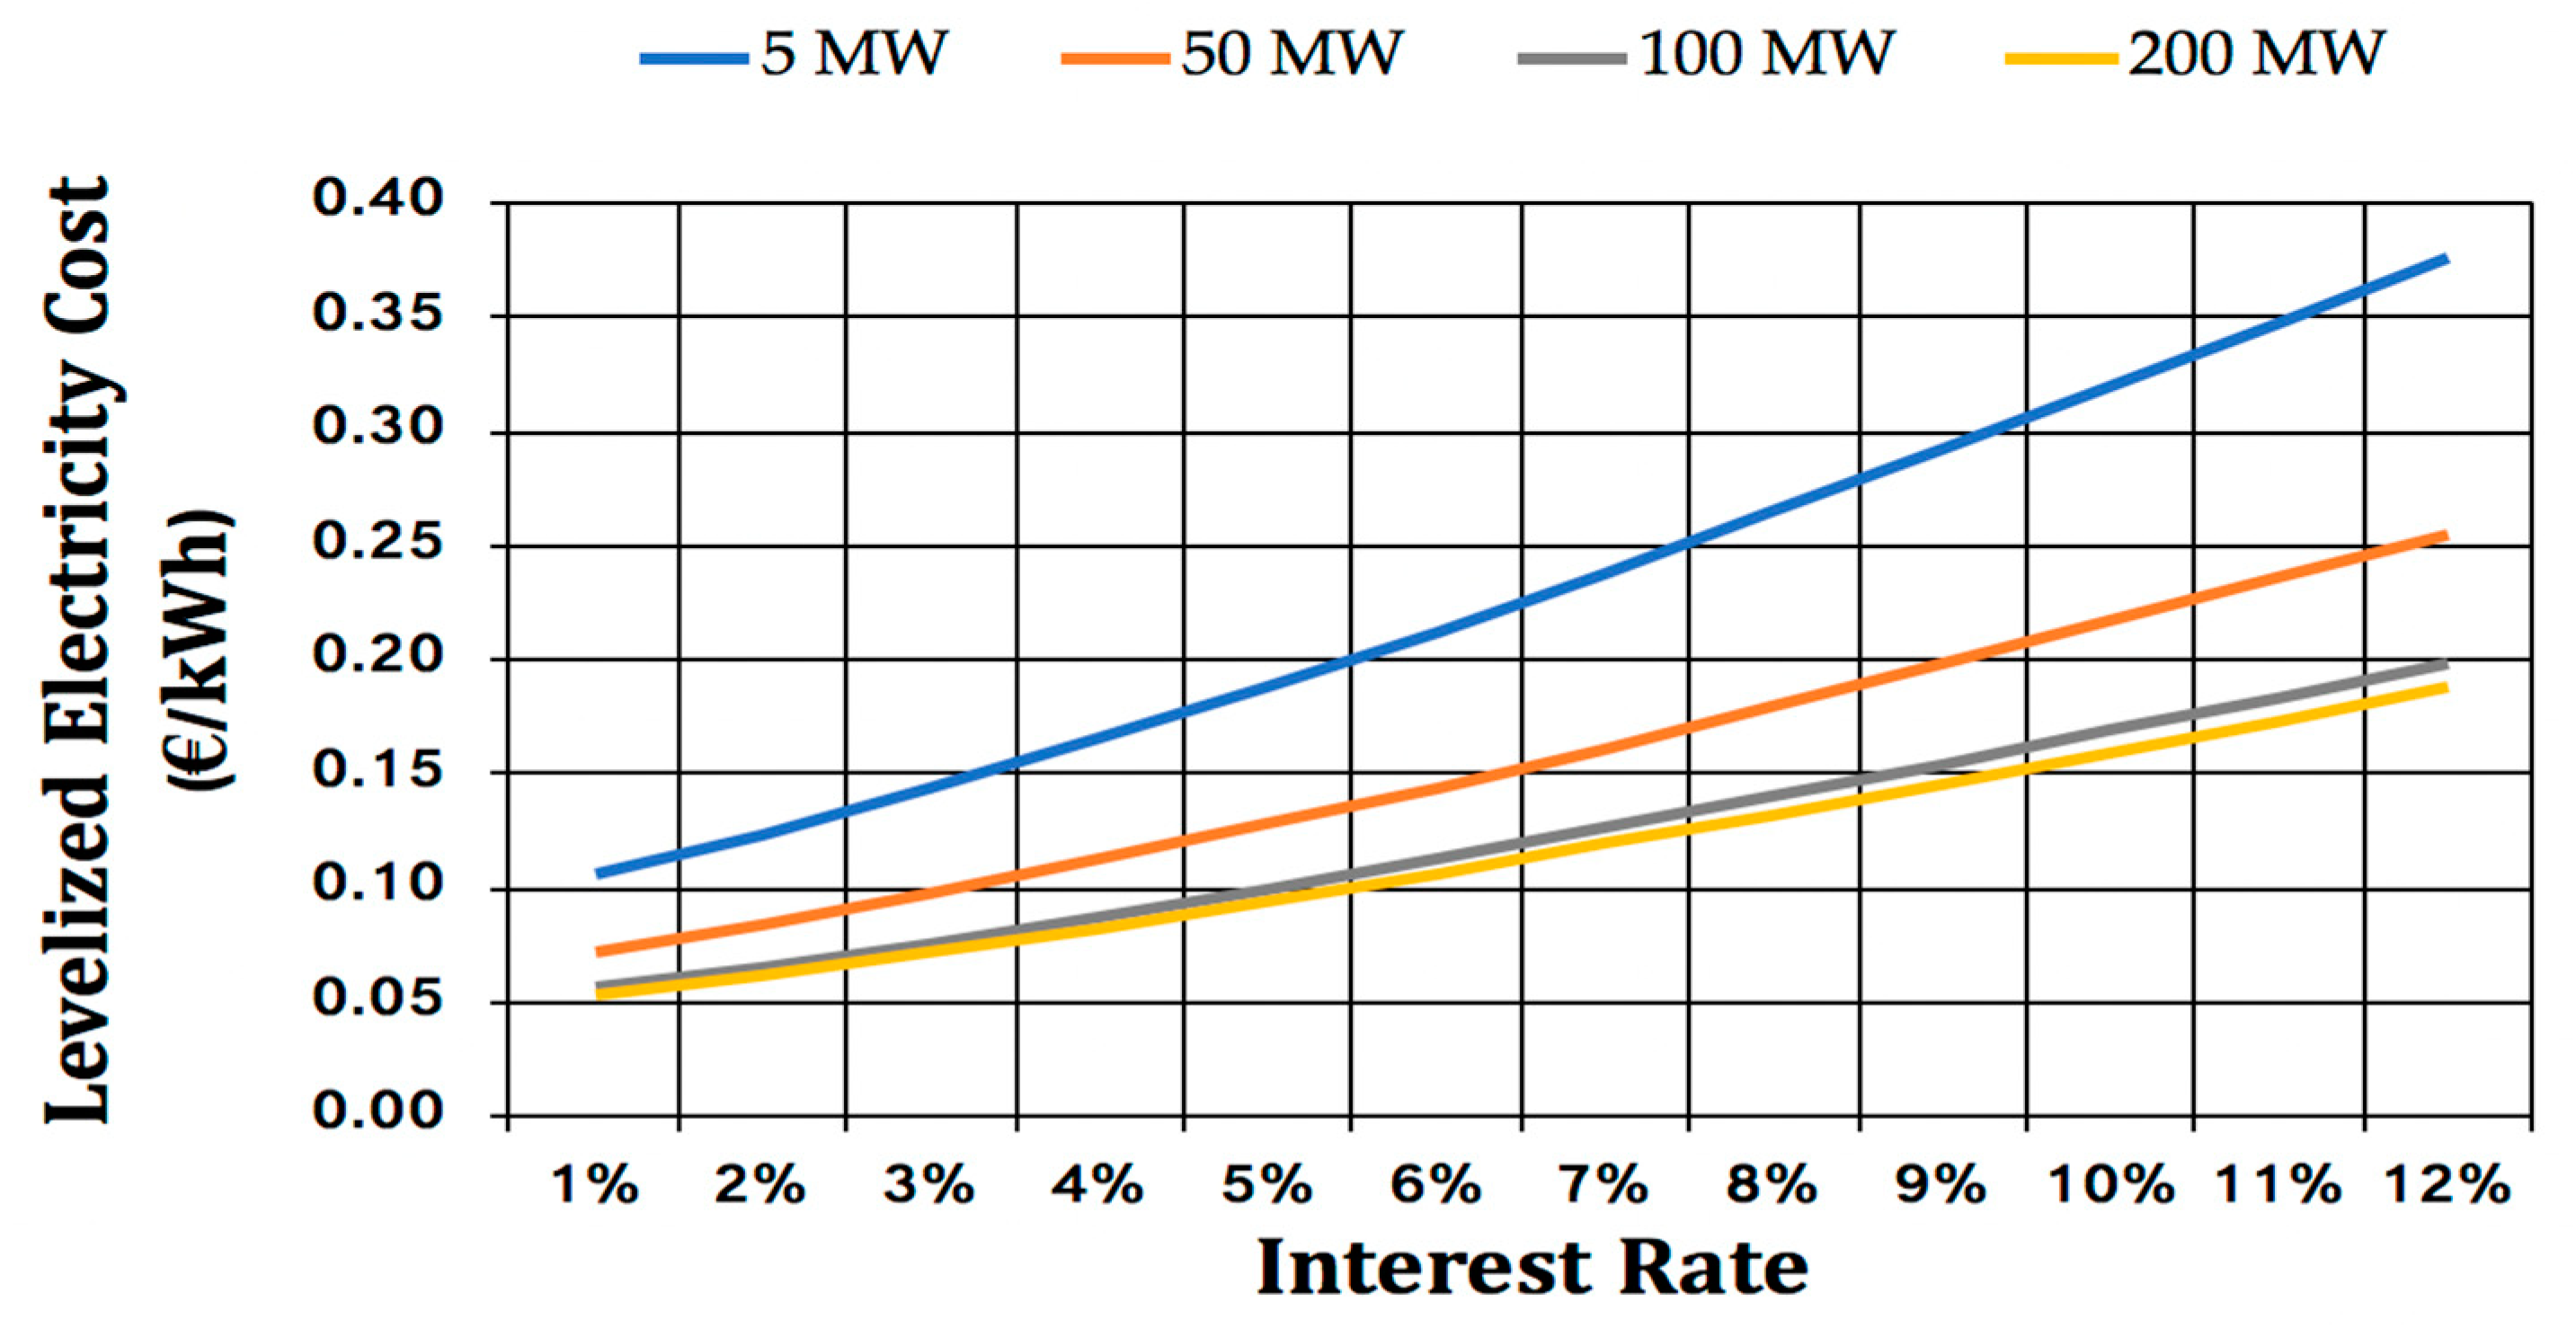
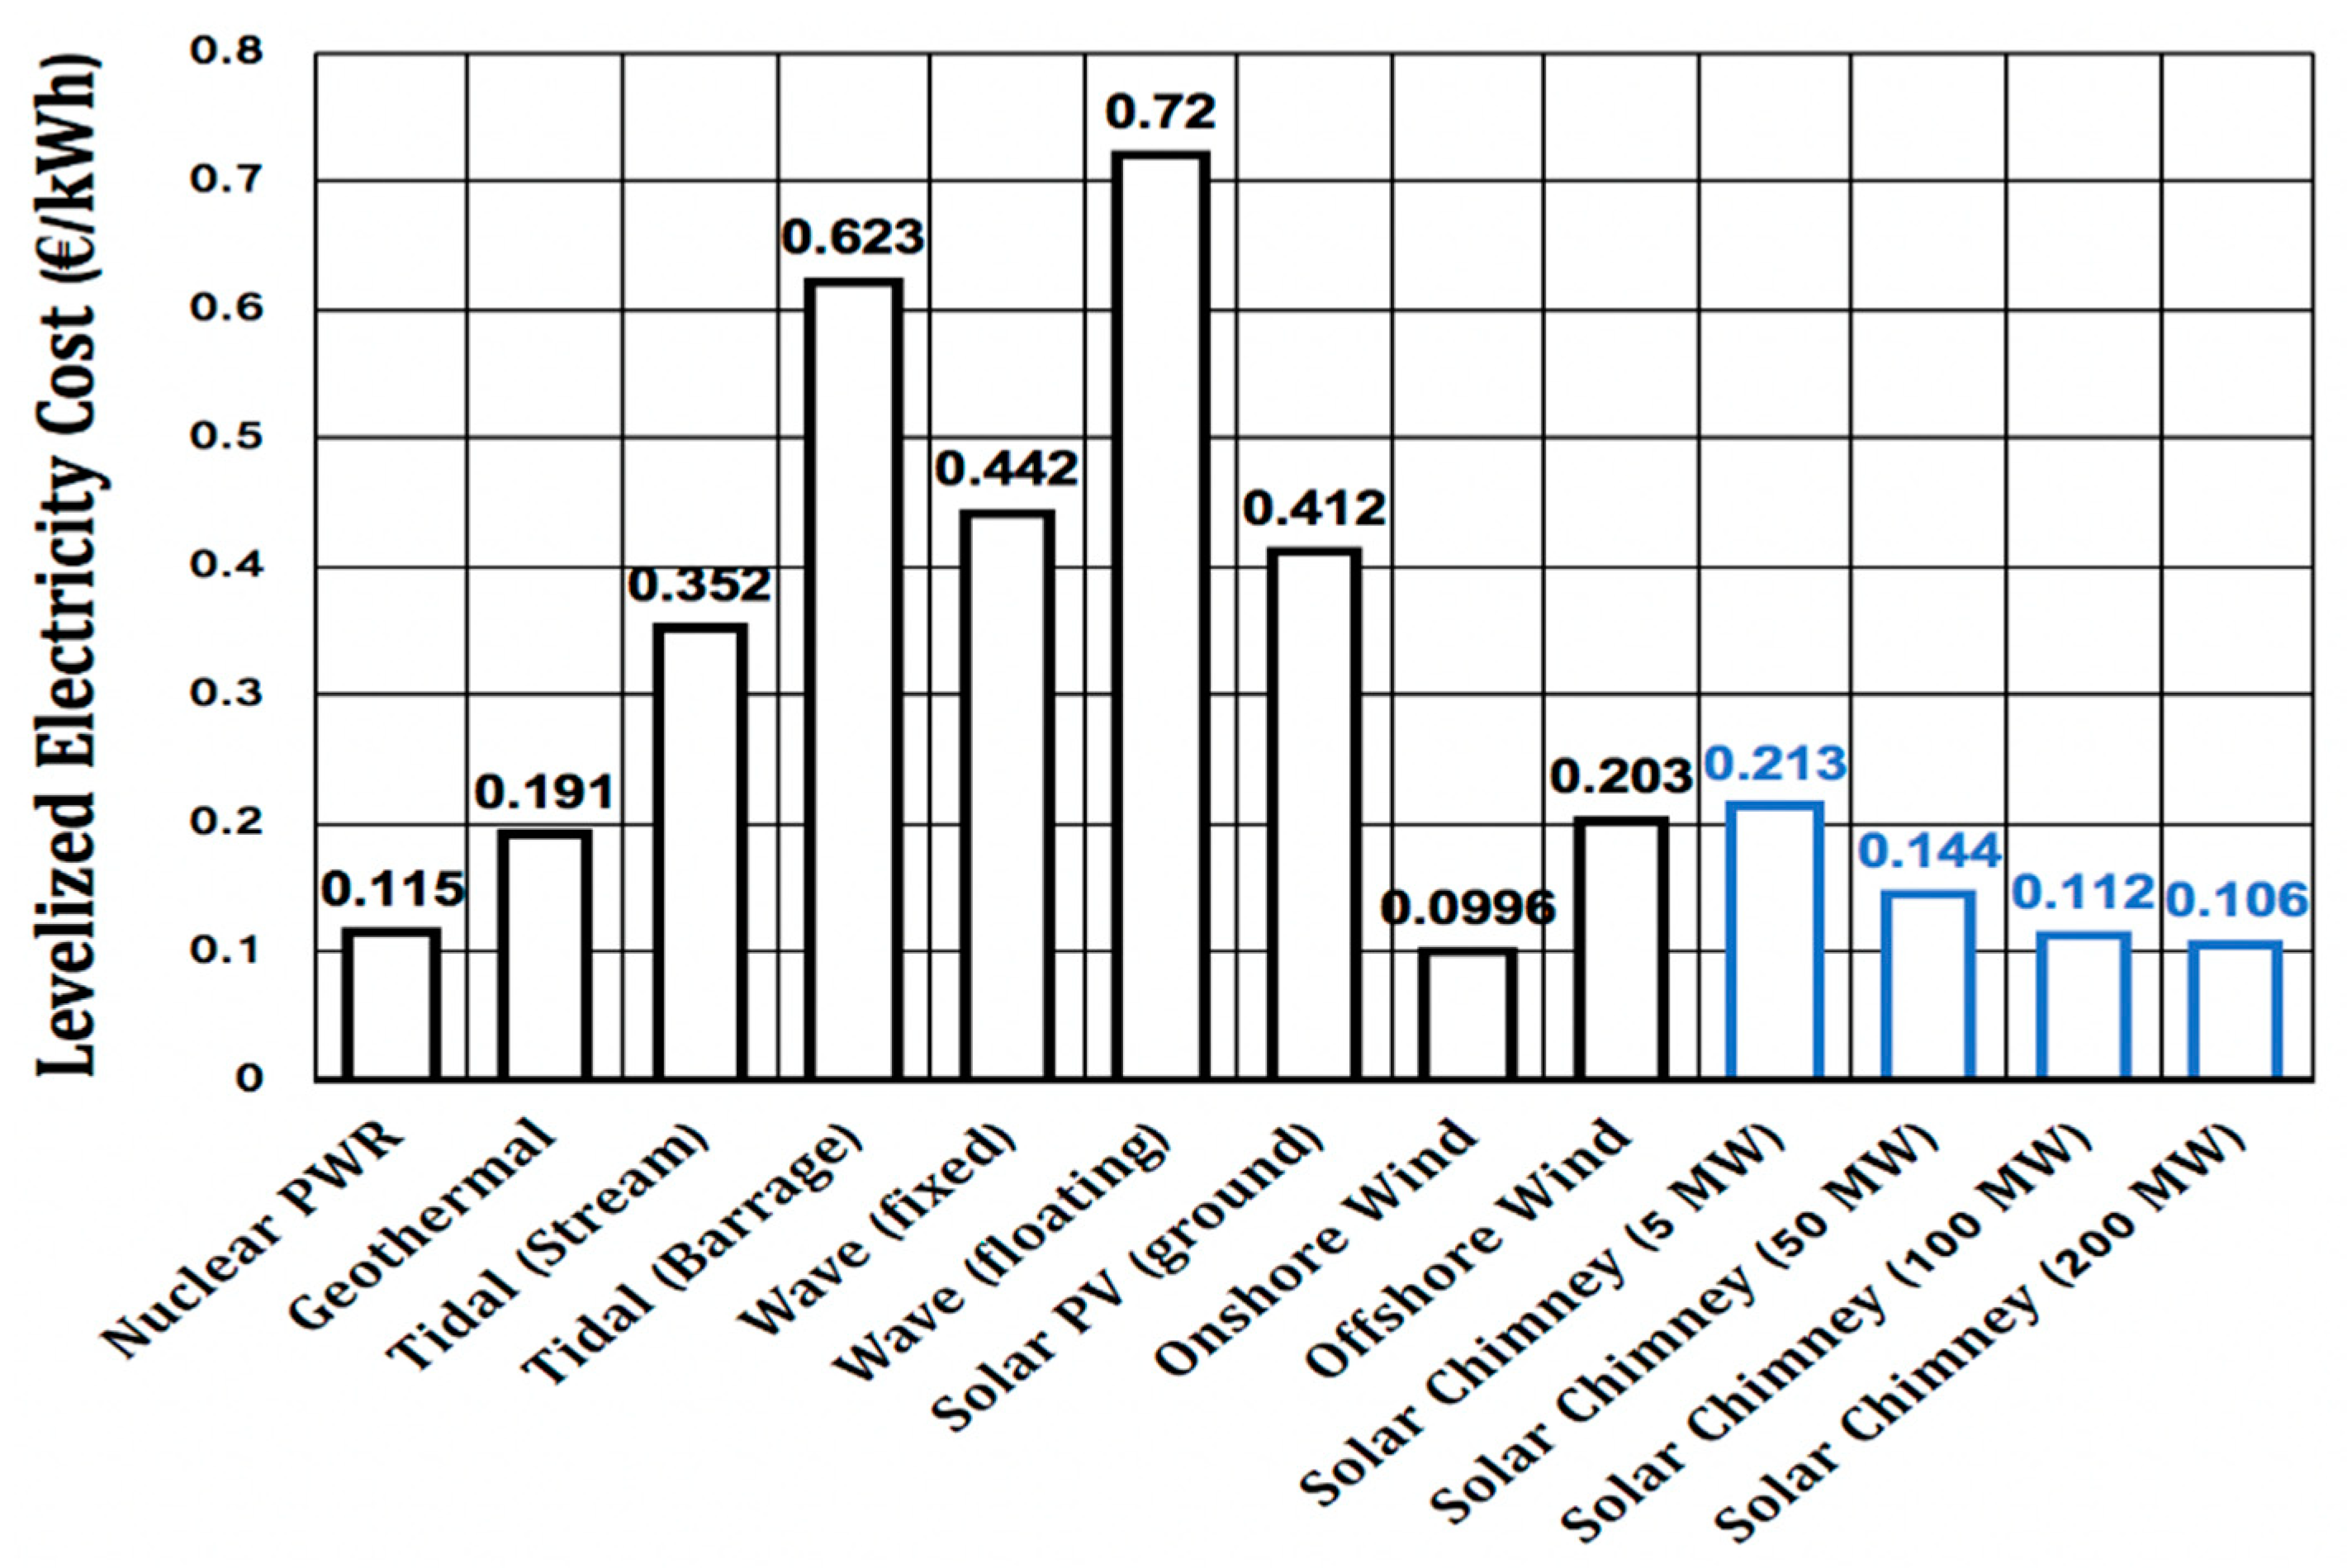
3.3. Levelized Electricity Cost
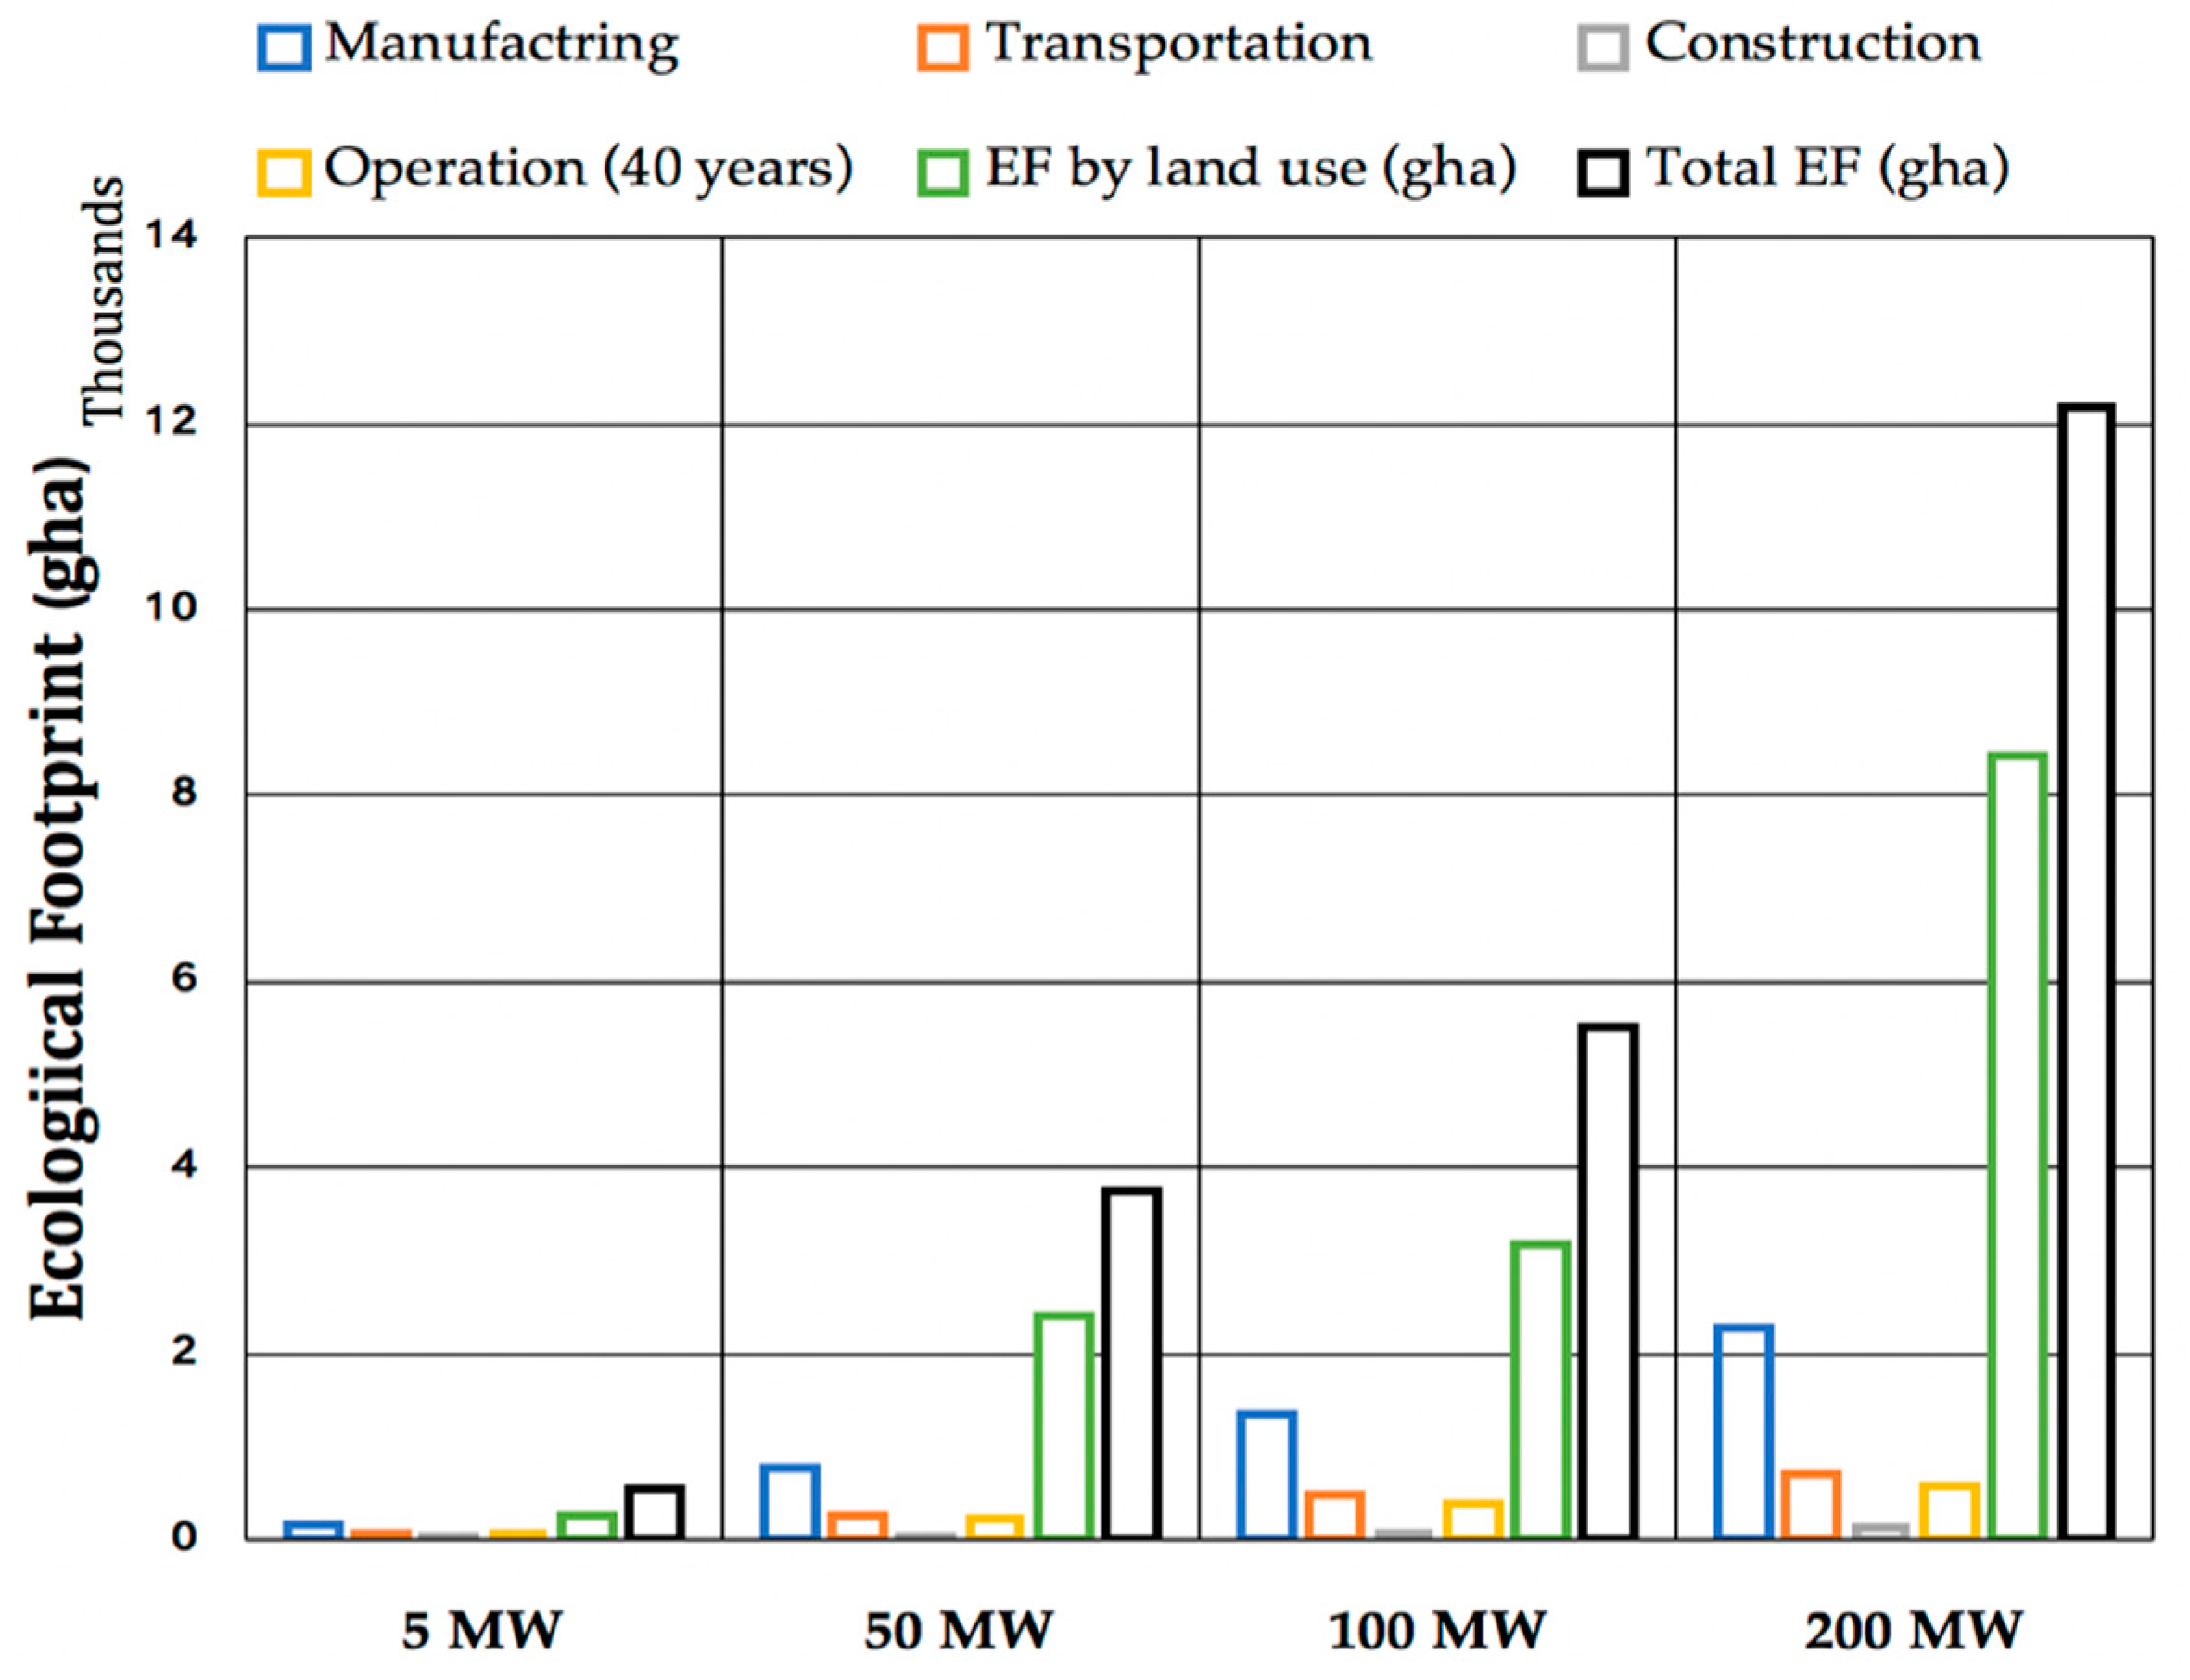
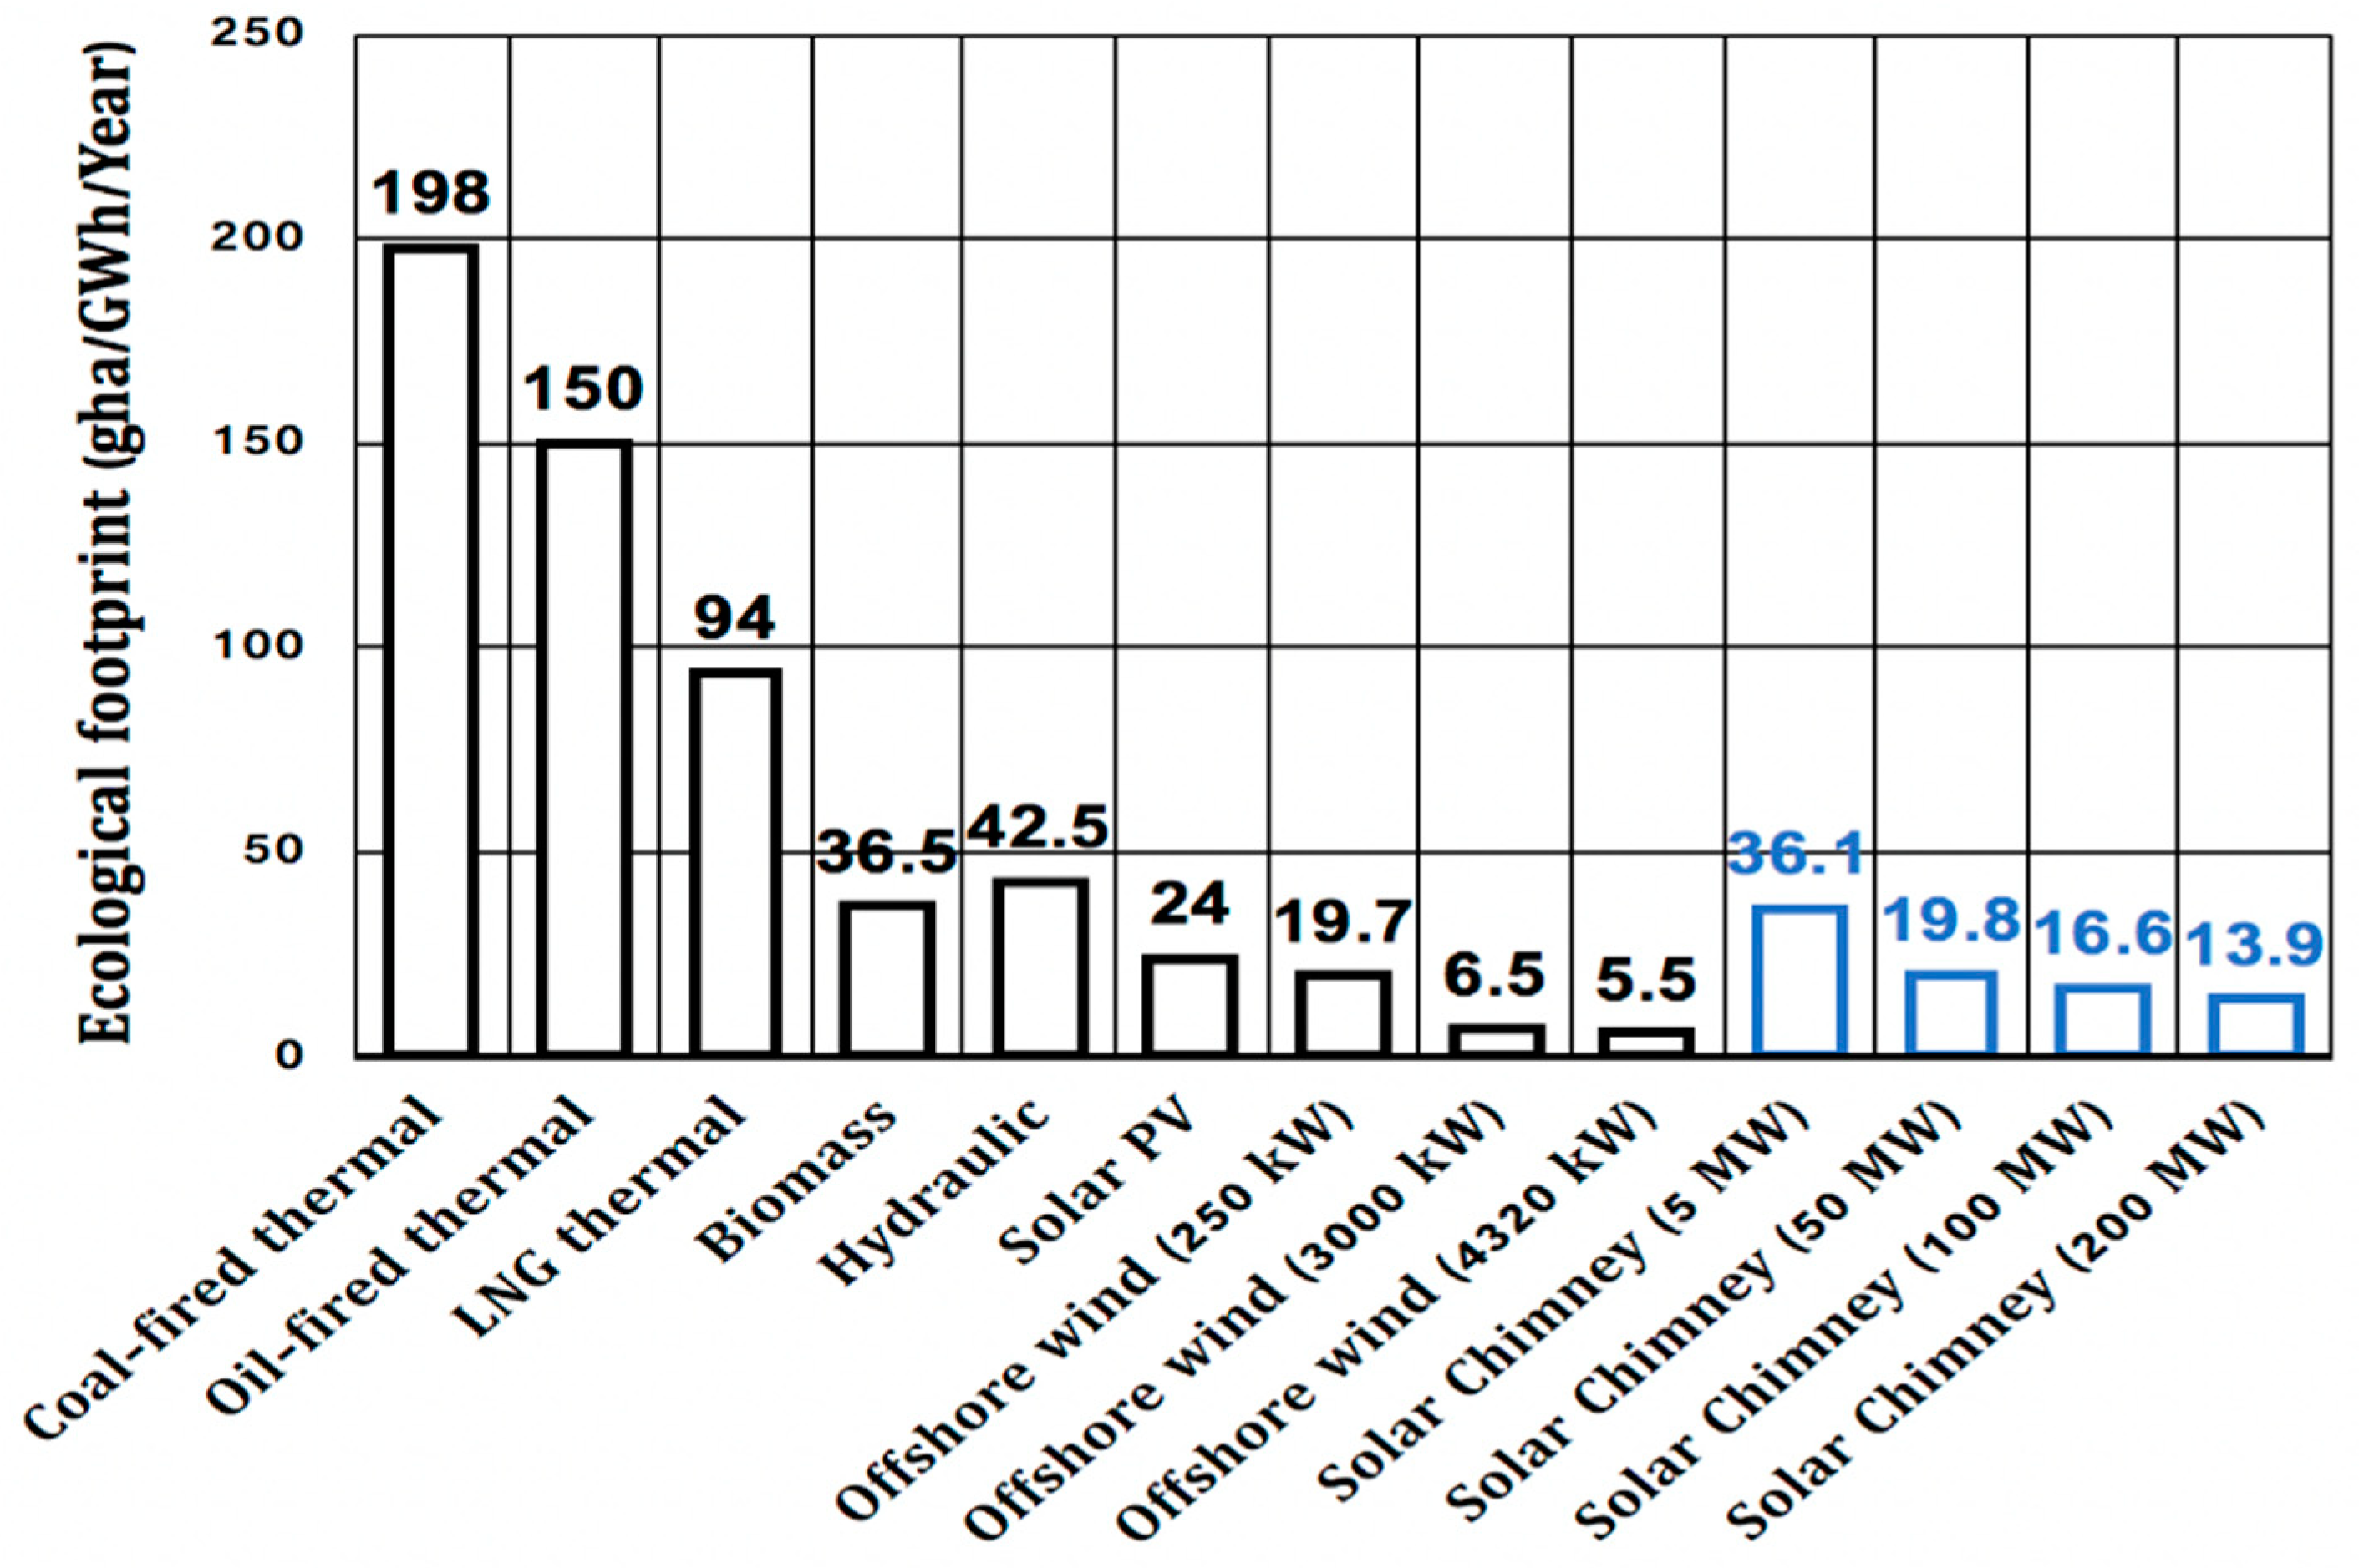
3.4. Ecological Footprint and Triple I Indexes
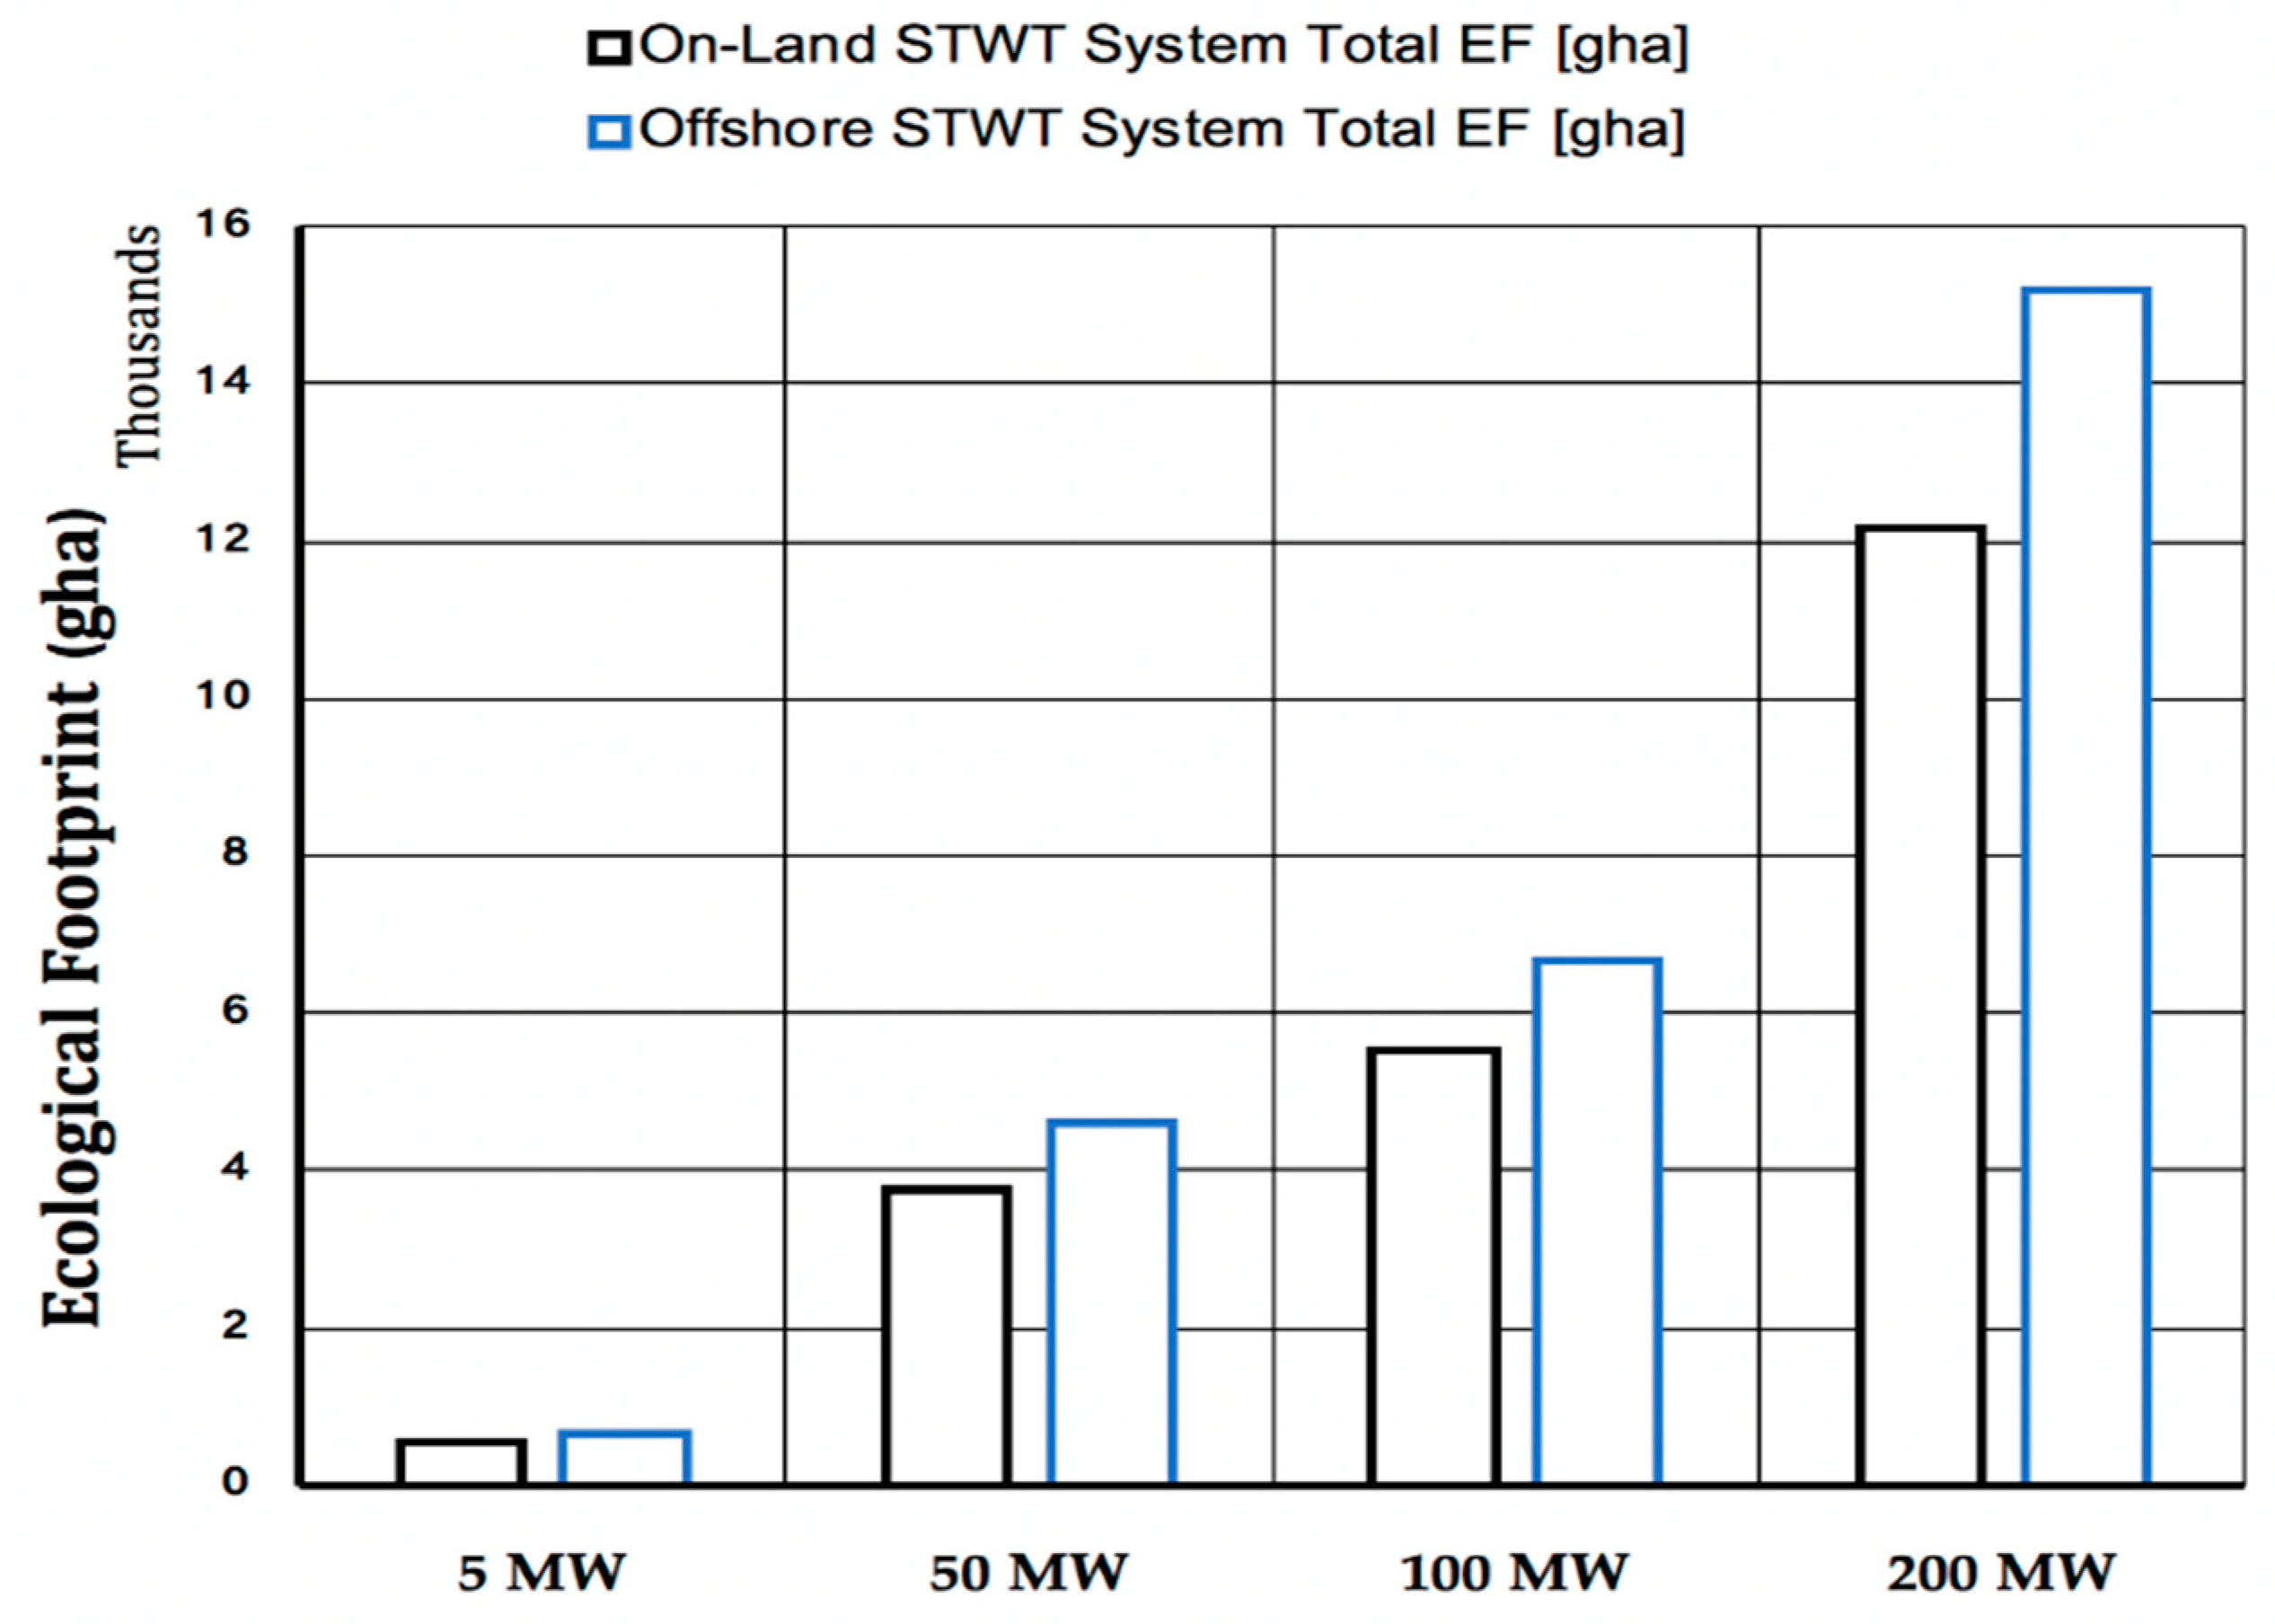
3.4.1. Total EF in the Life Cycle of the STWT System
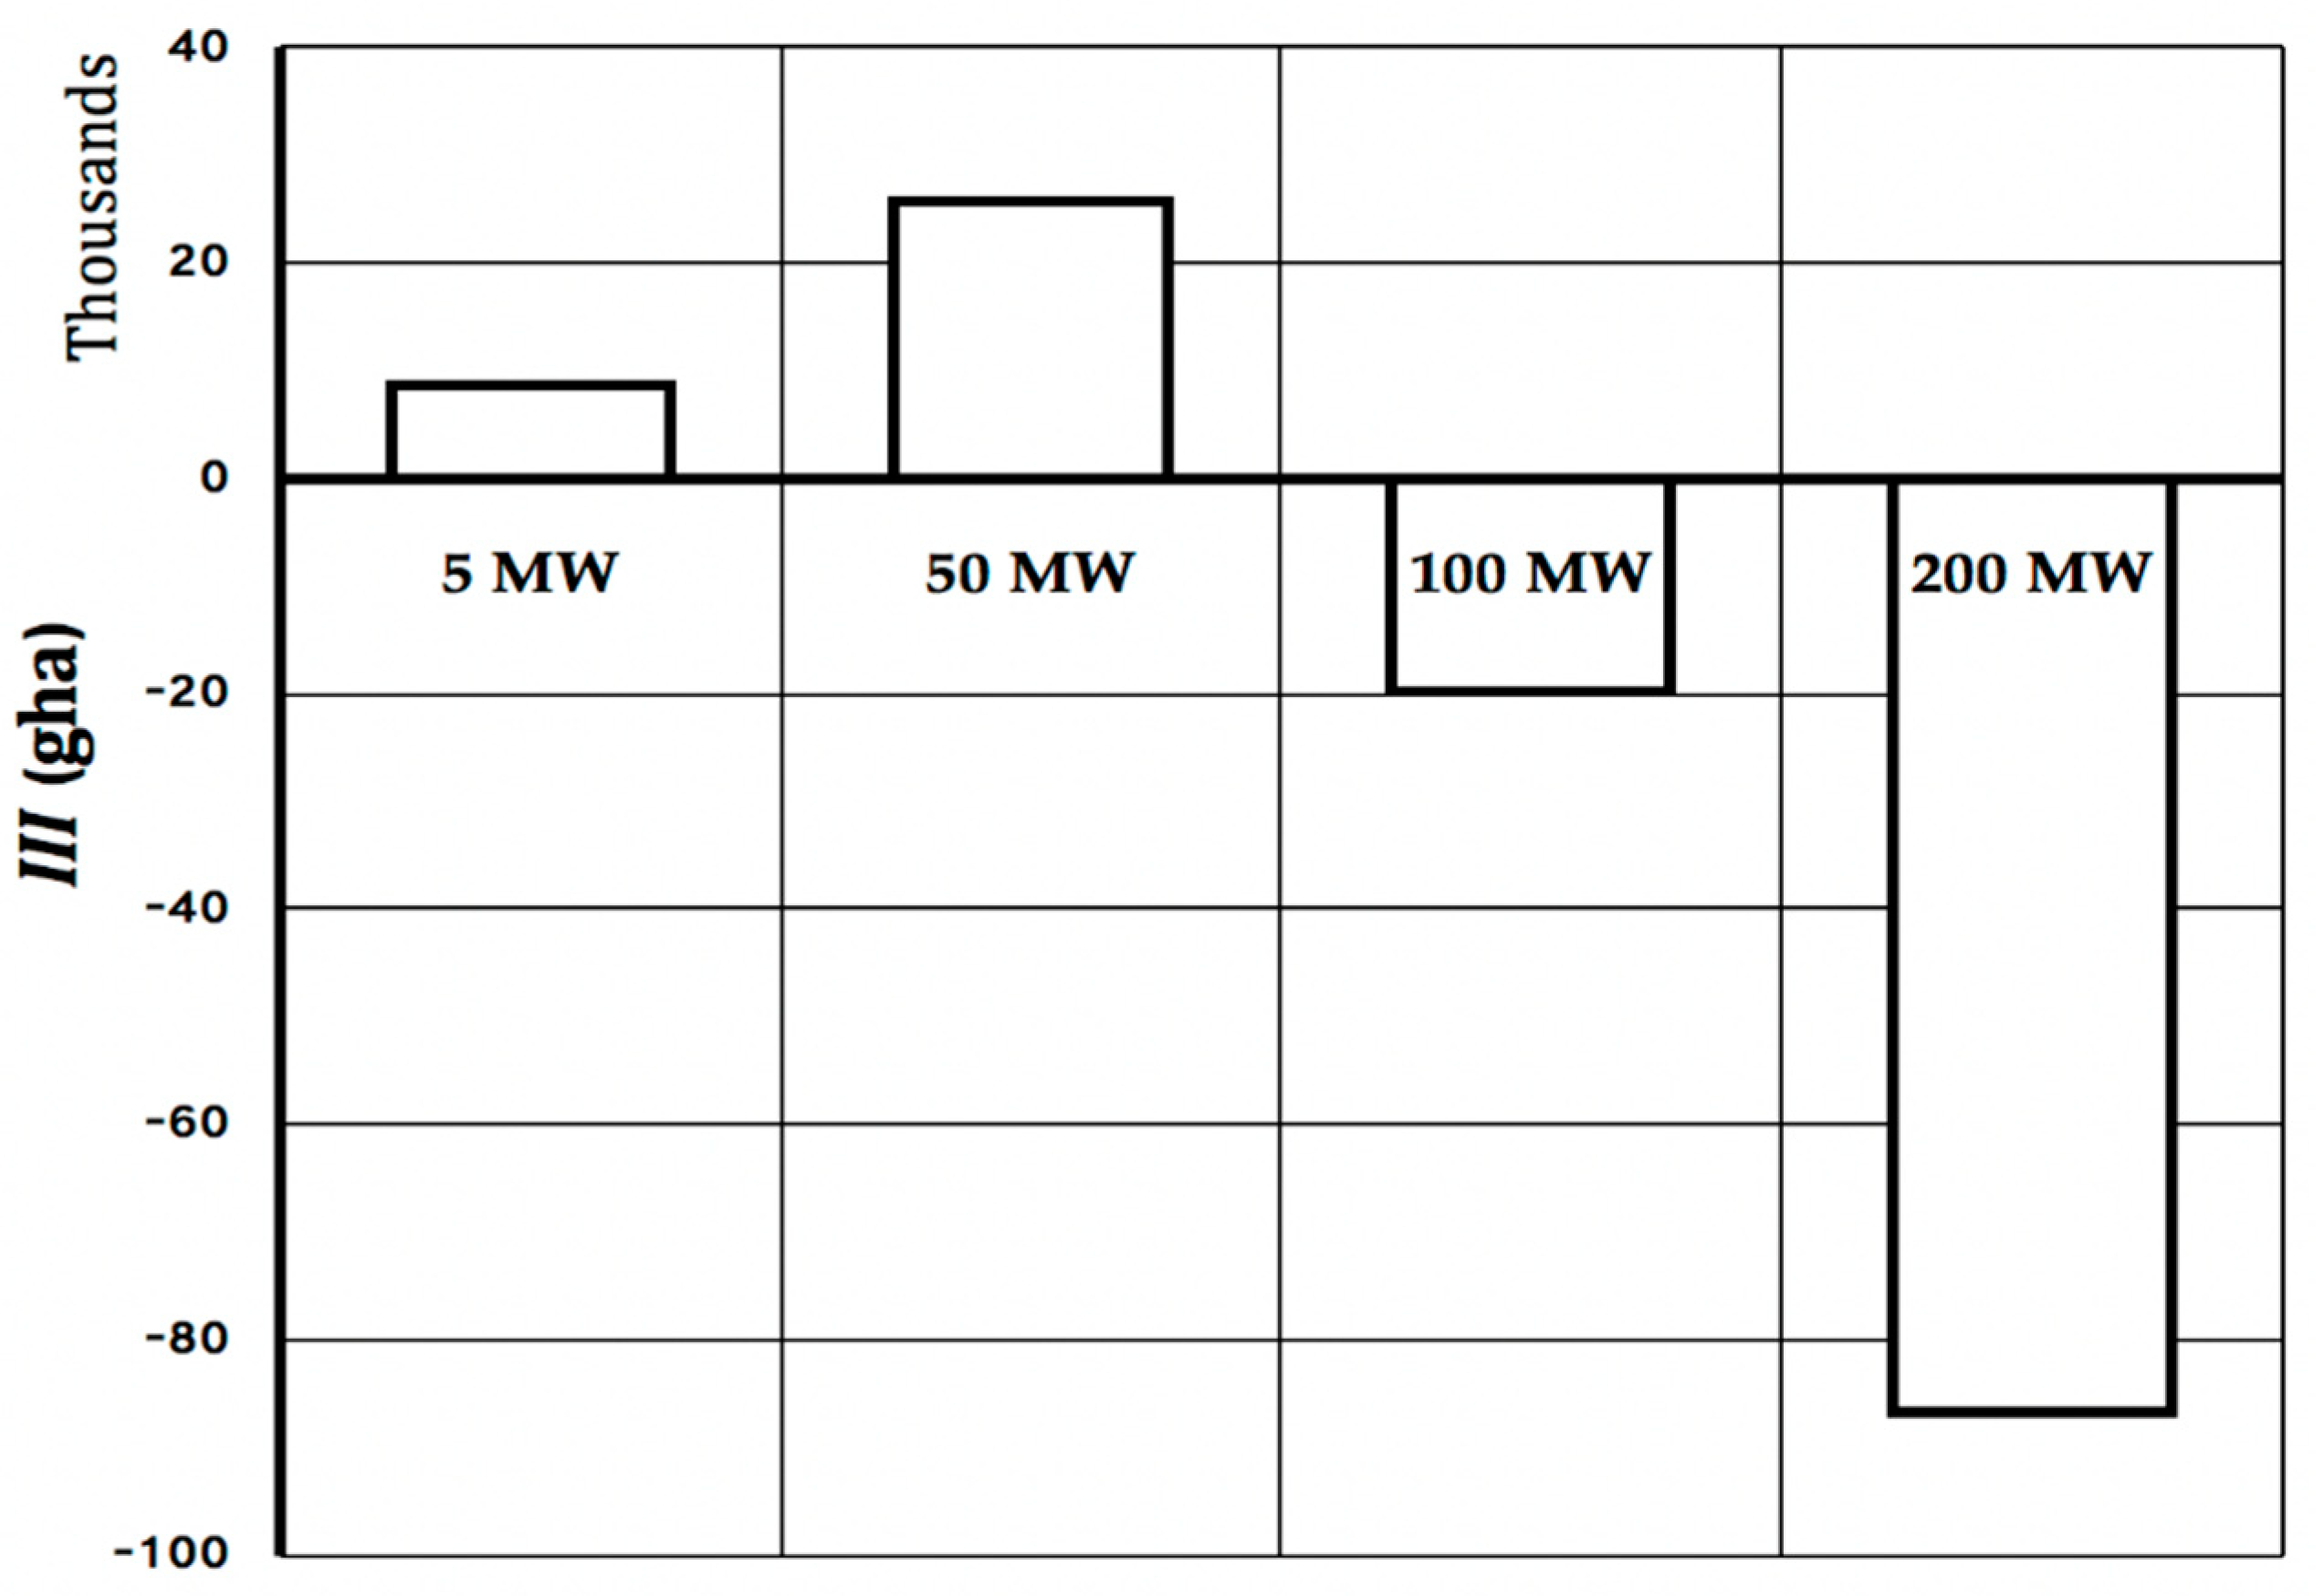
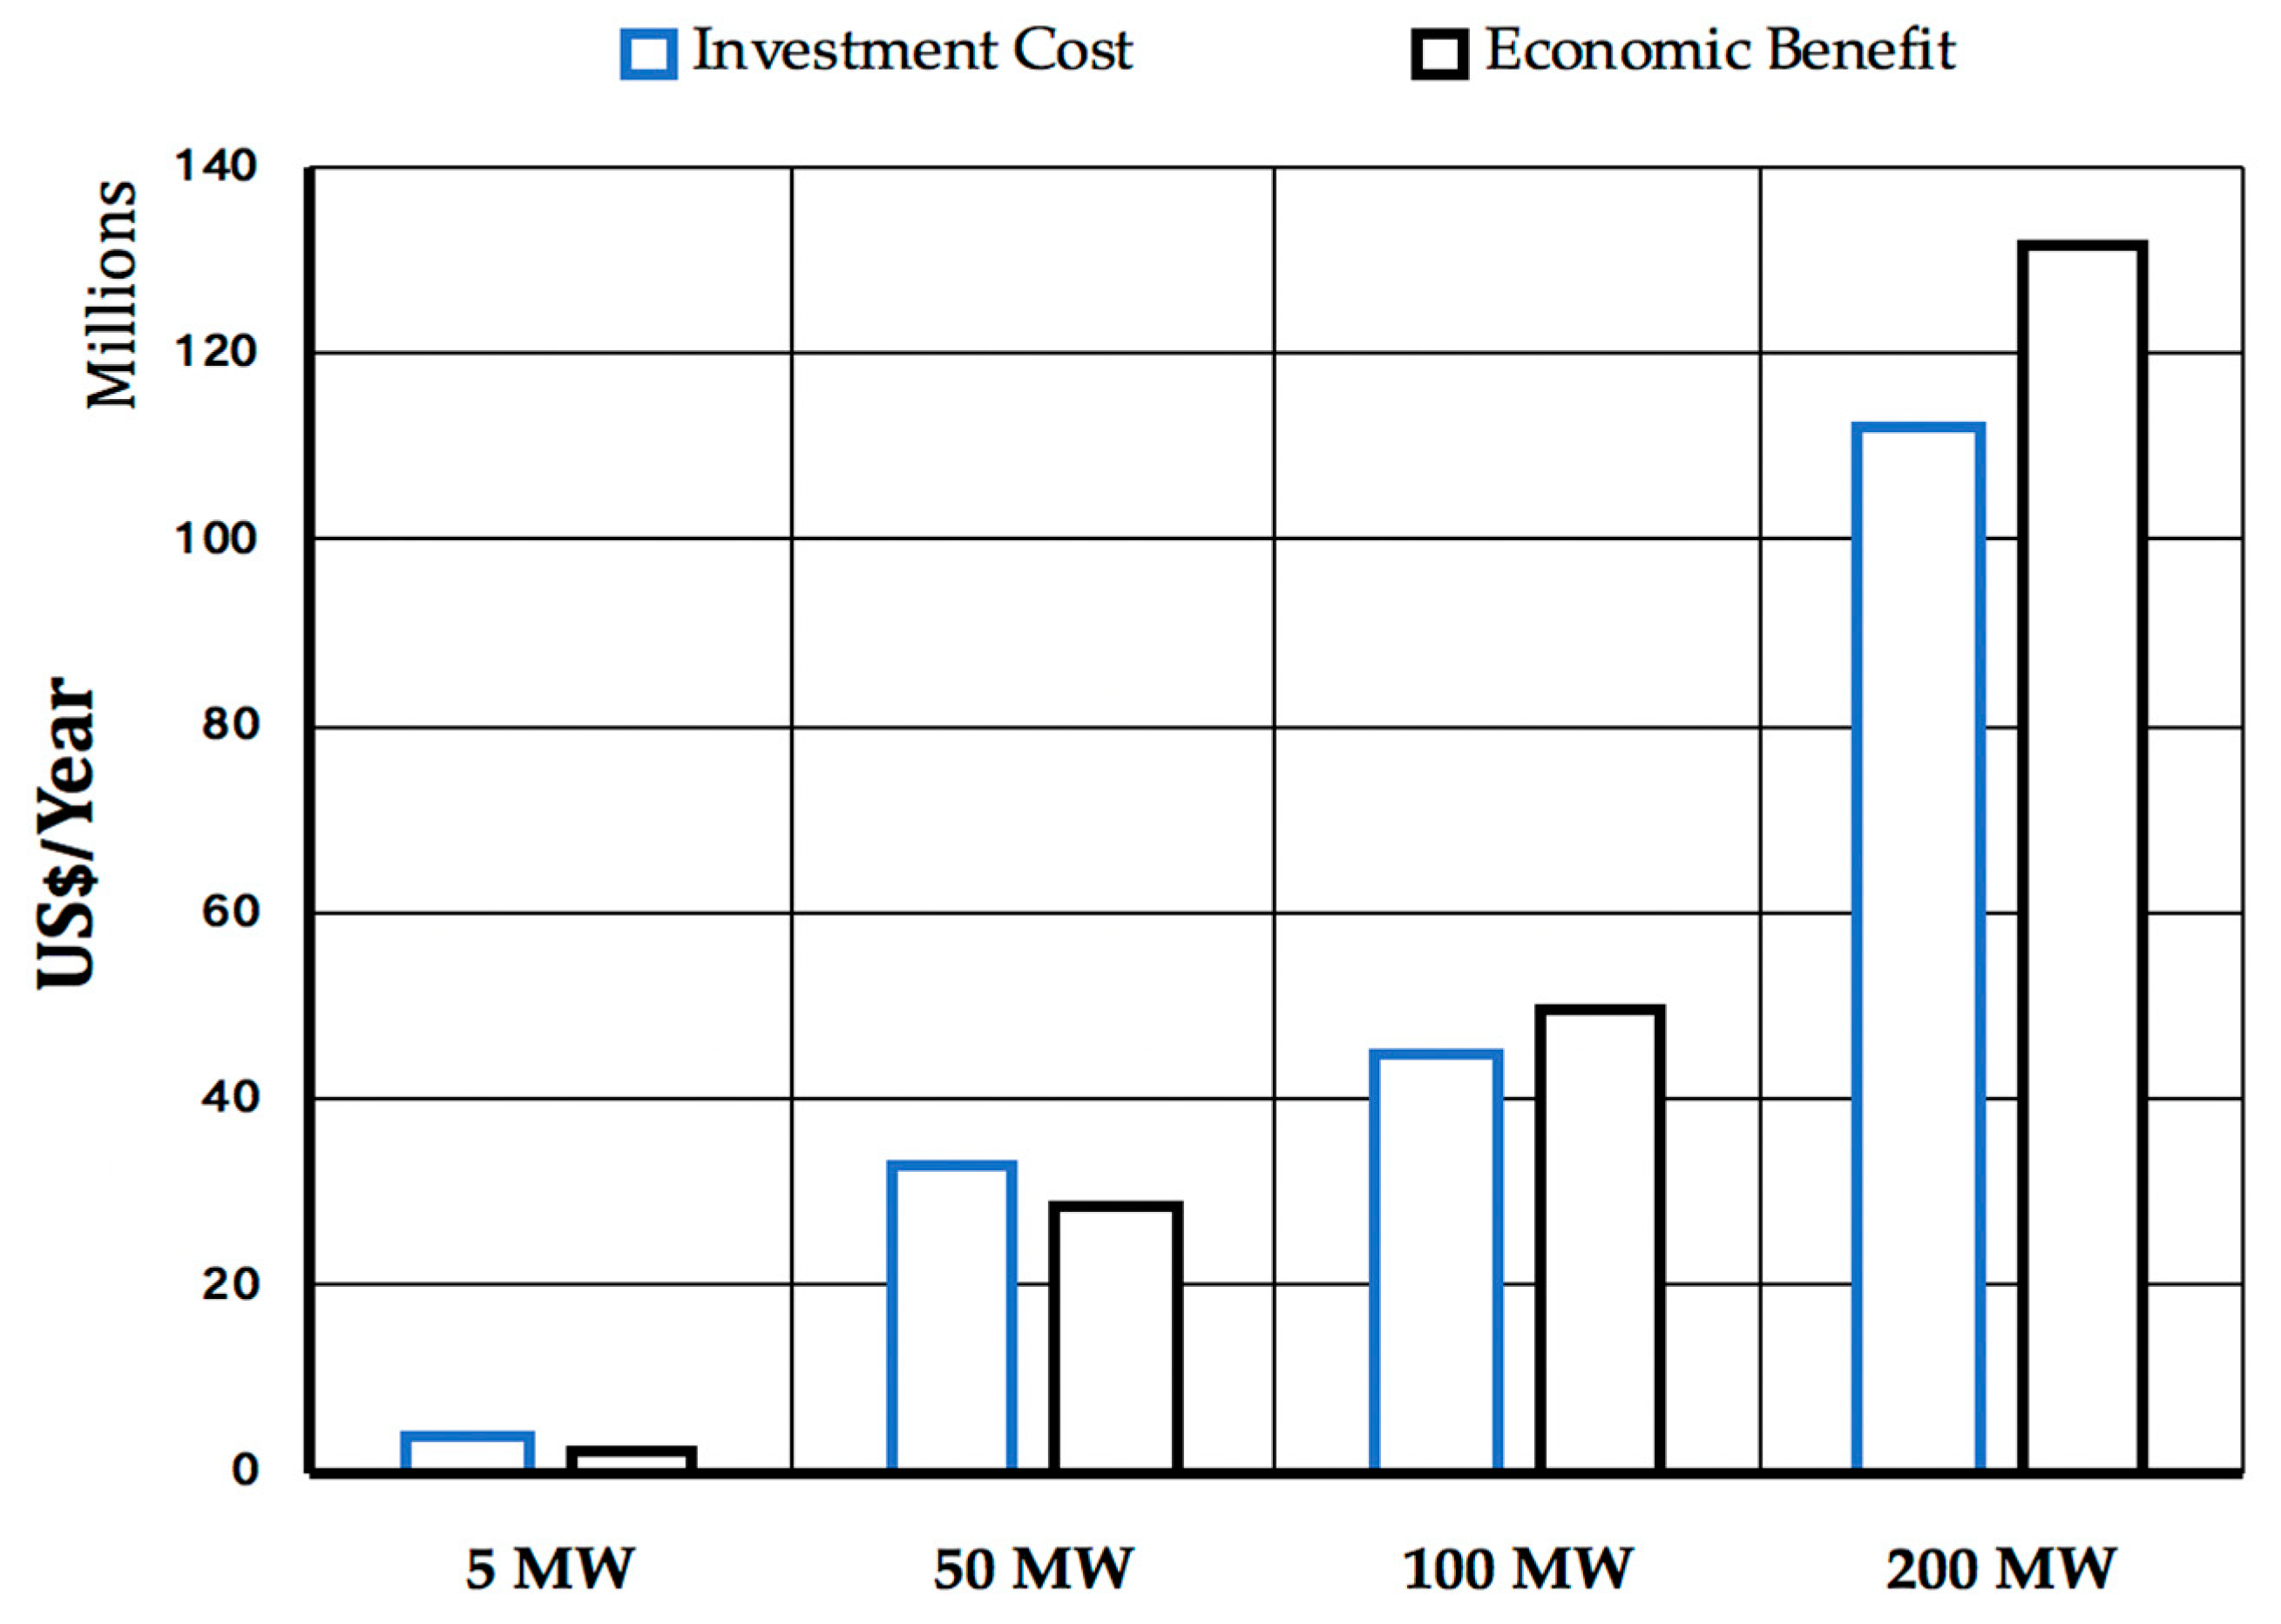
3.4.2. Triple I Index
3.5. Comparison with Other Kinds of Power Generation Plants
4. Potential of Offshore STWT Technology
5. Conclusions
Author Contributions
Funding
Acknowledgments
Conflicts of Interest
Abbreviations
| Area of collector | |
| Annual energy production | |
| Benefit | |
| Cost | |
| Total capital cost | |
| Collector cost | |
| Tower cost | |
| Turbine cost | |
| Specific capital cost for material and construction | |
| Annual operation and maintenance cost | |
| Specific heat capacity of air at constant pressure | |
| Diameter of collector | |
| Diameter of tower | |
| Embodied carbon | |
| Ecological footprint | |
| Gross domestic product | |
| Gravity | |
| Height of tower | |
| Height of collector inlet | |
| Solar radiation | |
| Inclusive impact index – light | |
| Levelized electricity cost | |
| Mass flow rate of air | |
| Number of years (lifetime) | |
| Total power | |
| Electrical power output | |
| Cost percentage for the collector per unit area. | |
| Cost percentage for every one-meter height of collector inlet. | |
| Cost percentage for the turbines. | |
| Cost percentage for operation and maintenance | |
| Useful heat gain to the air flow | |
| Inputted solar energy | |
| Capital recovery factor | |
| Reinforced concrete | |
| Annual interest rate | |
| Solar thermal wind tower | |
| Ambient air temperature | |
| Maximum airflow speed | |
| Total pressure difference of air | |
| Temperature rise | |
| Efficiency of the collector | |
| Efficiency of the tower | |
| Efficiency of the turbines | |
| Density of the ambient air | |
| Density of air inside the tower |
Appendix A

| Component | Material | Percentage | |
|---|---|---|---|
| Turbines | Blade | Steel | 14% |
| Epoxy | 29% | ||
| Fibrous glass | 57% | ||
| Nacelle | Steel | 93% | |
| Stainless steel | 1% | ||
| Cast steel | 7% | ||
| Grease | 0% | ||
| Generator | Steel | 66% | |
| Silicon Steel plate | 8% | ||
| Aluminum | 3% | ||
| Copper | 6% | ||
| Heat-hardening resin | 12% | ||
| Grease | 6% | ||
| Material | (kgCO2/kg) | Material | (kgCO2/kg) |
|---|---|---|---|
| Steel | 1.366 | Fibrous Glass | 2.138 |
| Stainless steel | 2.744 | Insulator | 2.911 |
| Cast steel | 3.718 | Grease | 0.255 |
| Silicon steel plate | 1.366 | Heat-hardening resin | 5.035 |
| Aluminum | 5.442 | Concrete | 0.114 |
| Copper | 2.508 | Cement | 0.808 |
| Epoxy | 6.886 | Stone material | 0.008 |
References
- Richter, C.; Lincot, D.; Gueymard, C.A. Solar Updraft Towers. In Solar Energy; Meyers, R.A., Ed.; Springer: New York, NY, USA, 2012; pp. 658–687. [Google Scholar]
- Schlaich, J.; Bergermann, R.; Schiel, W.; Weinrebe, G. Design of Commercial Solar Updraft Tower Systems: Utilization of Solar Induced Convective Flows for Power Generation. J. Sol. Energy Eng. 2005, 127, 117–124. [Google Scholar] [CrossRef]
- Ming, T. Solar Chimney Power Plant Generating Technology; Elsevier: Amsterdam, The Netherlands, 2016; pp. 1–69. [Google Scholar]
- Al-Kayiem, H.H.; Aja, O.C. Historic and recent progress in solar chimney power plant enhancing technologies. Renew. Sustain. Energy Rev. 2016, 58, 1269–1292. [Google Scholar] [CrossRef]
- Mullett, L.B. The solar chimney—Overall efficiency, design and performance. Int. J. Ambient Energy 2011, 8, 35–40. [Google Scholar] [CrossRef]
- EnviroMission Company, Australia. Available online: www.enviromission.com.au (accessed on 30 September 2018).
- Krätzi Wilfried, B.; Harte, R.; Montag, U. From large natural draft cooling tower shells to chimneys of solar upwind power plants, Giga-Shells for Energy Generation: Natural Draft Cooling Towers and Solar Updraft Chimneys. In Proceedings of the 6th International Symposium on Cooling Towers, Cologne, Germany, 20–23 June 2012. [Google Scholar]
- Purnell, P. The carbon footprint of reinforced concrete. Adv. Cem. Res. 2013, 25, 362–368. [Google Scholar] [CrossRef]
- Vestergaard Nielsen, C. Carbon Footprint of Concrete Buildings seen in the Life Cycle Perspective. In Proceedings of the NRMCA 2008 Concrete Technology Forum, Denver, CO, USA, 20–22 May 2008. [Google Scholar]
- Documentation for Greenhouse Gas Emission and Energy Factors Used in the Waste Reduction Model, U.S. Environmental Protection Agency. Available online: www.epa.gov/warm (accessed on 30 September 2018).
- Murai, M.; Aono, T. Inclusive Environmental Assessment for Offshore Wind Power Stations. In Proceedings of the Nineteenth International Offshore and Polar Engineering Conference, Osaka, Japan, 21–26 June 2009; ISBN 978-1-880653-53-1, ISSN ISSN 1098-618. [Google Scholar]
- Takahashi, T.; Sato, T. Inclusive environmental impact assessment indices with consideration of public acceptance: Application to power generation technologies in Japan. Appl. Energy 2015, 144, 64–72. [Google Scholar] [CrossRef]
- Okoye, C.O.; Solyalı, O.; Taylan, O. A new economic feasibility approach for solar chimney power plant design. Energy Convers. Manag. 2016, 126, 1013–1027. [Google Scholar] [CrossRef]
- Harte, R.; Graffmann, R. Optimization of Solar Updraft Chimneys by Nonlinear Response Analysis. Appl. Mech. Mater. 2013, 283, 25–34. [Google Scholar] [CrossRef]
- BuildRight Toolbox, Australia. Available online: https://emedia.rmit.edu.au/dlsweb/Toolbox/buildright/ (accessed on 30 September 2018).
- Ir. Stephen Leung, Arup Materials Technology, Technical seminar on Carbon Dioxide (CO2) Emissions of Concrete, SCCT 2009, Hong Kong. 2009. Available online: http://www.hkengineer.org.hk/program/home/idamain.php?cat=ida&volid=112&dept=mat (accessed on 30 September 2018).
- Boyle, G. Renewable Energy: Power for a Sustainable Future, 3rd ed.; Oxford University Press: Oxford, UK, 2012. [Google Scholar]
- Wackerbagel, M.; Rees, W. Our Ecological Footprint, Godo-Shuppan; New Society: Gabriola Island, BC, Cananda, 2004. [Google Scholar]
- Living Planet Report 2016. Available online: http://wwf.panda.org (accessed on 30 September 2018).
- MacDonald, M. Costs of Low-Carbon Generation Technologies, Committee on Climate Change. 2011. Available online: https://www.mottmac.com (accessed on 30 September 2018).
- Crossland, C.; Baird, D.; Ducrotoy, J.-P.; Lindeboom, H.; W.Buddemeier, R.; Dennison, W.; Maxwell, B.; Smith, S.; Swaney, D. The Coastal Zone—A Domain of Global Interactions. In Coastal Fluxes in the Anthropocene: The Land-Ocean Interactions in the Coastal Zone Project of the International Geosphere-Biosphere Programme; Springer: Berlin, Germany, 2005; pp. 1–37. [Google Scholar] [CrossRef]
- Zuo, L.; Zheng, Y.; Li, Z.; Sha, Y. Solar chimneys integrated with sea water desalination. Desalination 2011, 276, 207–213. [Google Scholar] [CrossRef]
- Niroomand, N.; Amidpour, M. New combination of solar chimney for power generation and seawater desalination. Desalin. Water Treat. 2013, 51, 7401–7411. [Google Scholar] [CrossRef]
- Diendorfer, C.; Haider, M.; Lauermann, M. Performance Analysis of Offshore Solar Power Plants. Energy Procedia 2014, 49, 2462–2471. [Google Scholar] [CrossRef]
- The World Economic Forum. Available online: https://www.weforum.org (accessed on 30 September 2018).


| Component | Weight (ton) | ||||
|---|---|---|---|---|---|
| 5 MW | 50 MW | 100 MW | 200 MW | ||
| Tower | 52,685.23 | 195,558.13 | 425,076.72 | 463,545.20 | |
| Collector | 12,664.55 | 113,980.91 | 149,867.16 | 397,160.14 | |
| Turbines | Blade | 201.60 | 201.60 | 201.60 | 201.6 |
| Nacelle | 331.20 | 331.20 | 331.20 | 331.2 | |
| Generator | 737.60 | 737.60 | 737.60 | 737.6 | |
| Total | 66,620.18 | 310,809.44 | 576,214.28 | 861,975.75 | |
| Component | CO2 Emissions (tCO2) | ||||
|---|---|---|---|---|---|
| 5 MW | 50 MW | 100 MW | 200 MW | ||
| Tower | 15,805.57 | 58,667.44 | 127,523.02 | 139,063.56 | |
| Collector | 6712.21 | 60,409.88 | 79,429.60 | 210,494.88 | |
| Turbines | Total | 2601.58 | 2601.58 | 2601.58 | 2601.580 |
| Blade | 684.94 | 684.94 | 684.94 | 684.940 | |
| Nacelle | 506.89 | 506.89 | 506.89 | 506.893 | |
| Generator | 1409.75 | 1409.75 | 1409.75 | 1409.746 | |
| Total | 25,119.36 | 121,678.90 | 209,554.19 | 352,160.02 | |
| Transportation System | Railway | Ship | Truck/Lorry |
|---|---|---|---|
| CO2 emissions (kg/(kg·km)) | ≈30 | 10–100 | 75–220 |
| Process | CO2 Emissions (tCO2) | |||
|---|---|---|---|---|
| 5 MW | 50 MW | 100 MW | 200 MW | |
| Transportation Stage | 8660.62 | 40,405.23 | 74,907.86 | 112,056.85 |
| Construction Stage | 1507.16 | 7300.73 | 12,573.25 | 21,129.60 |
| Operation and Maintenance | 9009.76 | 34,405.45 | 62,007.55 | 91,726.74 |
| Capacity | 5 MW | 50 MW | 100 MW | 200 MW |
|---|---|---|---|---|
| Tower Height (m) | 550 | 750 | 1000 | 1000 |
| Tower Diameter (m) | 45 | 90 | 110 | 120 |
| Collector Diameter (m) | 1250 | 3750 | 4300 | 7000 |
| Collector Area (km2) | 1.22 | 11.04 | 14.52 | 38.48 |
| Electricity Output (GWh/Year) | 15 | 189 | 331 | 878 |
| No. of typical households | 2813 | 34,524 | 60,526 | 160,398 |
| Overall system efficiency (%) | 0.815 | 1.111 | 1.482 | 1.482 |
| Capacity | 5 MW | 50 MW | 100 MW | 200 MW |
|---|---|---|---|---|
| Chimney cost [M€] | 5.4 | 20.0 | 43.4 | 47.3 |
| Collector cost [M€] | 36.3 | 326.9 | 429.9 | 1139.1 |
| Turbines cost [M€] | 4.2 | 34.7 | 47.3 | 118.6 |
| Total capital cost [M€] | 45.9 | 381.6 | 520.6 | 1305.1 |
| O&M cost [M€/year] | 0.2 | 1.9 | 2.6 | 6.5 |
| AEP [kWh] | 1.54 × 10⁷ | 1.89 × 10⁸ | 3.31 × 10⁸ | 8.78 × 10⁸ |
| LEC [€/kWh] | 0.2128 | 0.1443 | 0.1123 | 0.1062 |
© 2018 by the authors. Licensee MDPI, Basel, Switzerland. This article is an open access article distributed under the terms and conditions of the Creative Commons Attribution (CC BY) license (http://creativecommons.org/licenses/by/4.0/).
Share and Cite
Elsayed, I.; Nishi, Y. A Feasibility Study on Power Generation from Solar Thermal Wind Tower: Inclusive Impact Assessment Concerning Environmental and Economic Costs. Energies 2018, 11, 3181. https://doi.org/10.3390/en11113181
Elsayed I, Nishi Y. A Feasibility Study on Power Generation from Solar Thermal Wind Tower: Inclusive Impact Assessment Concerning Environmental and Economic Costs. Energies. 2018; 11(11):3181. https://doi.org/10.3390/en11113181
Chicago/Turabian StyleElsayed, Islam, and Yoshiki Nishi. 2018. "A Feasibility Study on Power Generation from Solar Thermal Wind Tower: Inclusive Impact Assessment Concerning Environmental and Economic Costs" Energies 11, no. 11: 3181. https://doi.org/10.3390/en11113181
APA StyleElsayed, I., & Nishi, Y. (2018). A Feasibility Study on Power Generation from Solar Thermal Wind Tower: Inclusive Impact Assessment Concerning Environmental and Economic Costs. Energies, 11(11), 3181. https://doi.org/10.3390/en11113181