Article

Molecular Modeling of CO2 and n-Octane in Solubility Process and α-Quartz Nanoslit

1
State Key Laboratory of Shale Oil and Gas Enrichment Mechanisms and Effective Development, Beijing 100083, China
2
State Energy Center for Shale Oil Research and Development, Beijing 100083, China
3
Institute of Porous Flow and Fluid Mechanics, Chinese Academy of Science, Langfang 065007, China
4
University of Chinese Academy of Science, Beijing 100190, China
5
School of Energy and Power Engineering, Huazhong University of Science and Technology (HUST), Wuhan 430074, China
*
Authors to whom correspondence should be addressed.
Energies 2018, 11(11), 3045; https://doi.org/10.3390/en11113045
Submission received: 8 September 2018 / Revised: 15 October 2018 / Accepted: 30 October 2018 / Published: 6 November 2018
(This article belongs to the Section L: Energy Sources)

Abstract

:
After primary and secondary oil recovery, CO2-enhanced oil recovery (EOR) has become one of the most mentioned technologies in tertiary oil recovery. Since the oil is confined in an unconventional reservoir, the interfacial properties of CO2 and oil are different from in conventional reservoirs, and play a key role in CO2 EOR. In this study, molecular dynamics simulations are performed to investigate the interfacial properties, such as interfacial tension, minimum miscibility pressure (MMP), and CO2 solubility. The vanishing interfacial tension method is used to get the MMP (~10.8 MPa at 343.15 K) which is in agreement with the reported experimental data, quantitatively. Meanwhile, the diffusion coefficients of CO2 and n-octane under different pressures are calculated to show that the diffusion is mainly improved at the interface. Furthermore, the displacement efficiency and molecular orientation in α-quartz nanoslit under different CO2 injection ratios have been evaluated. After CO2 injection, the adsorbed n-octane molecules are found to be displaced from surface by the injected CO2 and, then, the orientation of n-octane becomes more random, which indicates that and CO2 can enhance the oil recovery and weaken the interaction between n-octane and α-quartz surface. The injection ratio of CO2 to n-octane is around 3:1, which could achieve the optimal displacement efficiency.

1. Introduction

Most of the giant oil fields around the world are categorized as mature fields [1]. After primary and secondary recovery, more than 50% of the original oil-in-place still stays in a trapped state in the reservoir [1,2,3]. To extract the remaining oil, numerous technologies for enhanced oil recovery (EOR) have been developed, such as CO2 injection [4,5], surfactant [6], polymer [7], and microbial EOR [8]. Among these technologies, CO2 EOR has received widespread attention, due to its easy accessibility, low price, and excellent properties [4,5]. For example, the low viscosity and high dissolving capability make supercritical CO2 a promising candidate for EOR [9].
In CO2 EOR, the changes of interfacial properties in solubility process are the key to understanding the underlying mechanisms. Gallegos et al. [10] measured the solubility of CO2 in n-octane and n-decane, and correlated these data using the Peng-Robinson equation of state [11], which could be used to predict the solubility at other temperatures. Nagarajan et al. [12] and Shaver et al. [13] obtained the interfacial tensions and phase compositions of CO2 and n-decane. Rommerskirchen et al. [14] used a sapphire cell to measure the minimum miscibility pressure (MMP), which is quicker and lower-cost than the slim tube experiment. These fundamental data in bulk state are the basis for better understanding of CO2 EOR. However, the characteristic features of unconventional reservoir are widely distributed in nanopores and exhibit ultra-low permeability [3]. Under such conditions, Darcy’s law is not applicable, and fluid properties change greatly compared with the conventional reservoir. Pathak et al. [15] found the bubble point pressure of hydrocarbon fluids in nanopores is lower than in the bulk. Alfarge et al. observed the most dominant flow in shale nanopores is diffusion flow [16]. Majumder et al. [17] and Whitby et al. [18] measured the flow of hexane and decane through multiwalled carbon nanotube. They observed that flow velocity is 4~5 orders of magnitude faster than the prediction by conventional theory. For further examining the effects of nano-confinement, molecular dynamics (MD) simulation has been used in recent years. Wang et al. [19] also observed the fast transport of CO2 and n-octane in organic nanopore separately, which are 1~3 orders of magnitude faster than the prediction of the no-slip Poiseuille equation. Santos et al. [20] and previous work [21] observed that alkanes are displaced by CO2 from calcite and quartz surface, due to the stronger adsorption of CO2. Numerous studies [21,22,23] found that CO2 can enhance the diffusion coefficient of alkanes in nanoslit, which helps oil flow through nanoslit and nanopore throat easier.
Although previous works considerably deepened the understanding of the adsorption of oil and the mechanism of CO2 EOR, there are still some problems to be solved. (1) How to predict interfacial properties of CO2 and oil accurately by MD simulation? Compared with experiments, it is more efficient and economical to get the properties from MD simulation. In previous works, Mejia et al. [24] predicted the vapor–liquid interfacial properties by experiment and complemented these predictions using MD simulation and the statistical associating fluid theory (SAFT) equation of state. They pointed out that the accuracy of the MD results relies on the used force fields. Previous work [21] showed using suitable combination rules could couple the different force fields better, which will be further validated in this work. The accurate simulation prediction could also enable us to better understand the solubility process of CO2 and oil. (2) How about the efficiency of CO2 EOR? Most existing research focuses on whether CO2 can displace oil in nanoslits. The displacement efficiency and optimal injection ratio are not considered, but they are essential for cost and production forecasts. To investigate the displacement efficiency, the microstructure in nanoslit still needs to be studied, such as molecular orientation and distribution.
In this work, the interfacial properties of CO2 and n-octane in solubility process and α-quartz nanoslit are investigated by MD simulations. Firstly, the interfacial properties of CO2 and n-octane, such as interfacial tension, minimum miscibility pressure and CO2 solubility, are predicted accurately. Secondly, in order to further understand the solubility process and the change of flow characteristics, detailed diffusion coefficient distribution and radial number density are calculated. Then, the density profiles of CO2 and n-octane are divided into adsorbed layers and bulk, to investigate the CO2 displacement efficiency. Finally, the interaction energy and orientation change of both CO2 and n-octane, under different injection ratios, are evaluated to clarify the adsorption behavior.

2. Method

The schematic configuration of the simulation unit cell is shown in Figure 1. Figure 1a shows the simulation cell for the CO2 and n-octane binary system. The cell is set as a rectangular box with dimensions Lx = Ly = 6 nm, and Lz = 35 nm, which is large enough to eliminate the system size effects for phase equilibrium and interfacial properties calculation [24,25]. The initial configuration is composed of 1000 n-octane molecules in the middle, and various numbers of CO2 molecules on both sides. The various numbers of CO2 in the cell ranges from 1000 to 4000 at intervals of 500, to represent different pressures. The force fields are taken from the work of Zhu et al. [26] for CO2 and the NERD force field [27] for n-octane. Simulations are performed in the NVT ensemble using the GROMACS 4.6.7 package [28], with periodic boundary conditions imposed in all directions. The leapfrog algorithm [29] with time step of 2 fs is implemented. A cut-off radius of 2 nm is used in the calculation of van der Waals interactions and electrostatic interactions in the real space. The electrostatic interactions are obtained using the particle mesh Ewald (PME) method [30]. According to the experimental data that will be compared later [31], the ensemble temperature is maintained at 343.15 K using the Nosé-Hoover thermostat [32]. To reach equilibrium, each simulation is first run for 20 ns and, then, a 20 ns production run is performed.
Figure 1b shows the simulation cell for CO2 and n-octane binary mixture confined in an α-quartz nanoslit. The CO2 and n-octane are confined between two α-quartz surfaces with a size of 5.89 × 5.95 nm2. The thickness of α-quartz is 2.16 nm, which is larger than the cut-off distance. All the non-bridging oxygen atoms on the surface are fully protonated, and the surface has no net charge. Considering abundant nanopores in the size range of 3–8 nm in unconventional reservoir [33], the width of nanoslit is 5 nm. The CLAYFF force field [34] is implemented for α-quartz surfaces, which has been widely used to investigate the fluid confinement properties in rock nanopores [20,22]. The α-quartz substrate is fixed, and the hydrogen atoms can move during the simulation, which is constrained by the H–O bond and H–O–Si angle. Due to the fact that about 50% of original oil in place is still trapped in the nanopores [1,3], the number of n-octane in the nanoslit is fixed at 250, which is about 50% of the n-octane fully filling the nanoslit. To investigate the effect of different CO2 loading on the structure changes and displacement efficiency, the ratios of CO2 to n-octane change from 0 to 5 at intervals of 1. The various numbers of CO2 in the nanoslit are 0, 250, 500, 750, and 1000. The long-range Coulomb interactions are calculated by the PME method with a correction for slab-geometry [35]. An 18.68 nm vacuum is introduced in the Z-direction, which is larger than two times length of the nanoslit.
The Lennard-Jones potential [36] is used to describe the van der Waals interactions:
V L J ( r i j ) = 4 ε i j [ ( σ i j r i j ) 12 ( σ i j r i j ) 6 ] ,
where V L J (kJ/mol) is the Lennard-Jones potential, r i j (nm) is the distance, ε i j (kJ/mol) is the potential well describing the interaction intensity between atom i and atom j, and σ i j (nm) is the distance between the atoms when the interaction potential is zero. The interaction parameters between CO2 and n-octane are calculated by a modified Lorentz-Berthelot rule (a = 0.9 in Equation (2)), as follows, which is similar to previous work [19]. The parameters of CO2, n-octane, and α-quartz are listed in Supplementary Information Table S1.
σ i j = σ i i + σ j j 2 , ε i j = a ε i i ε j j

3. Results and Discussions

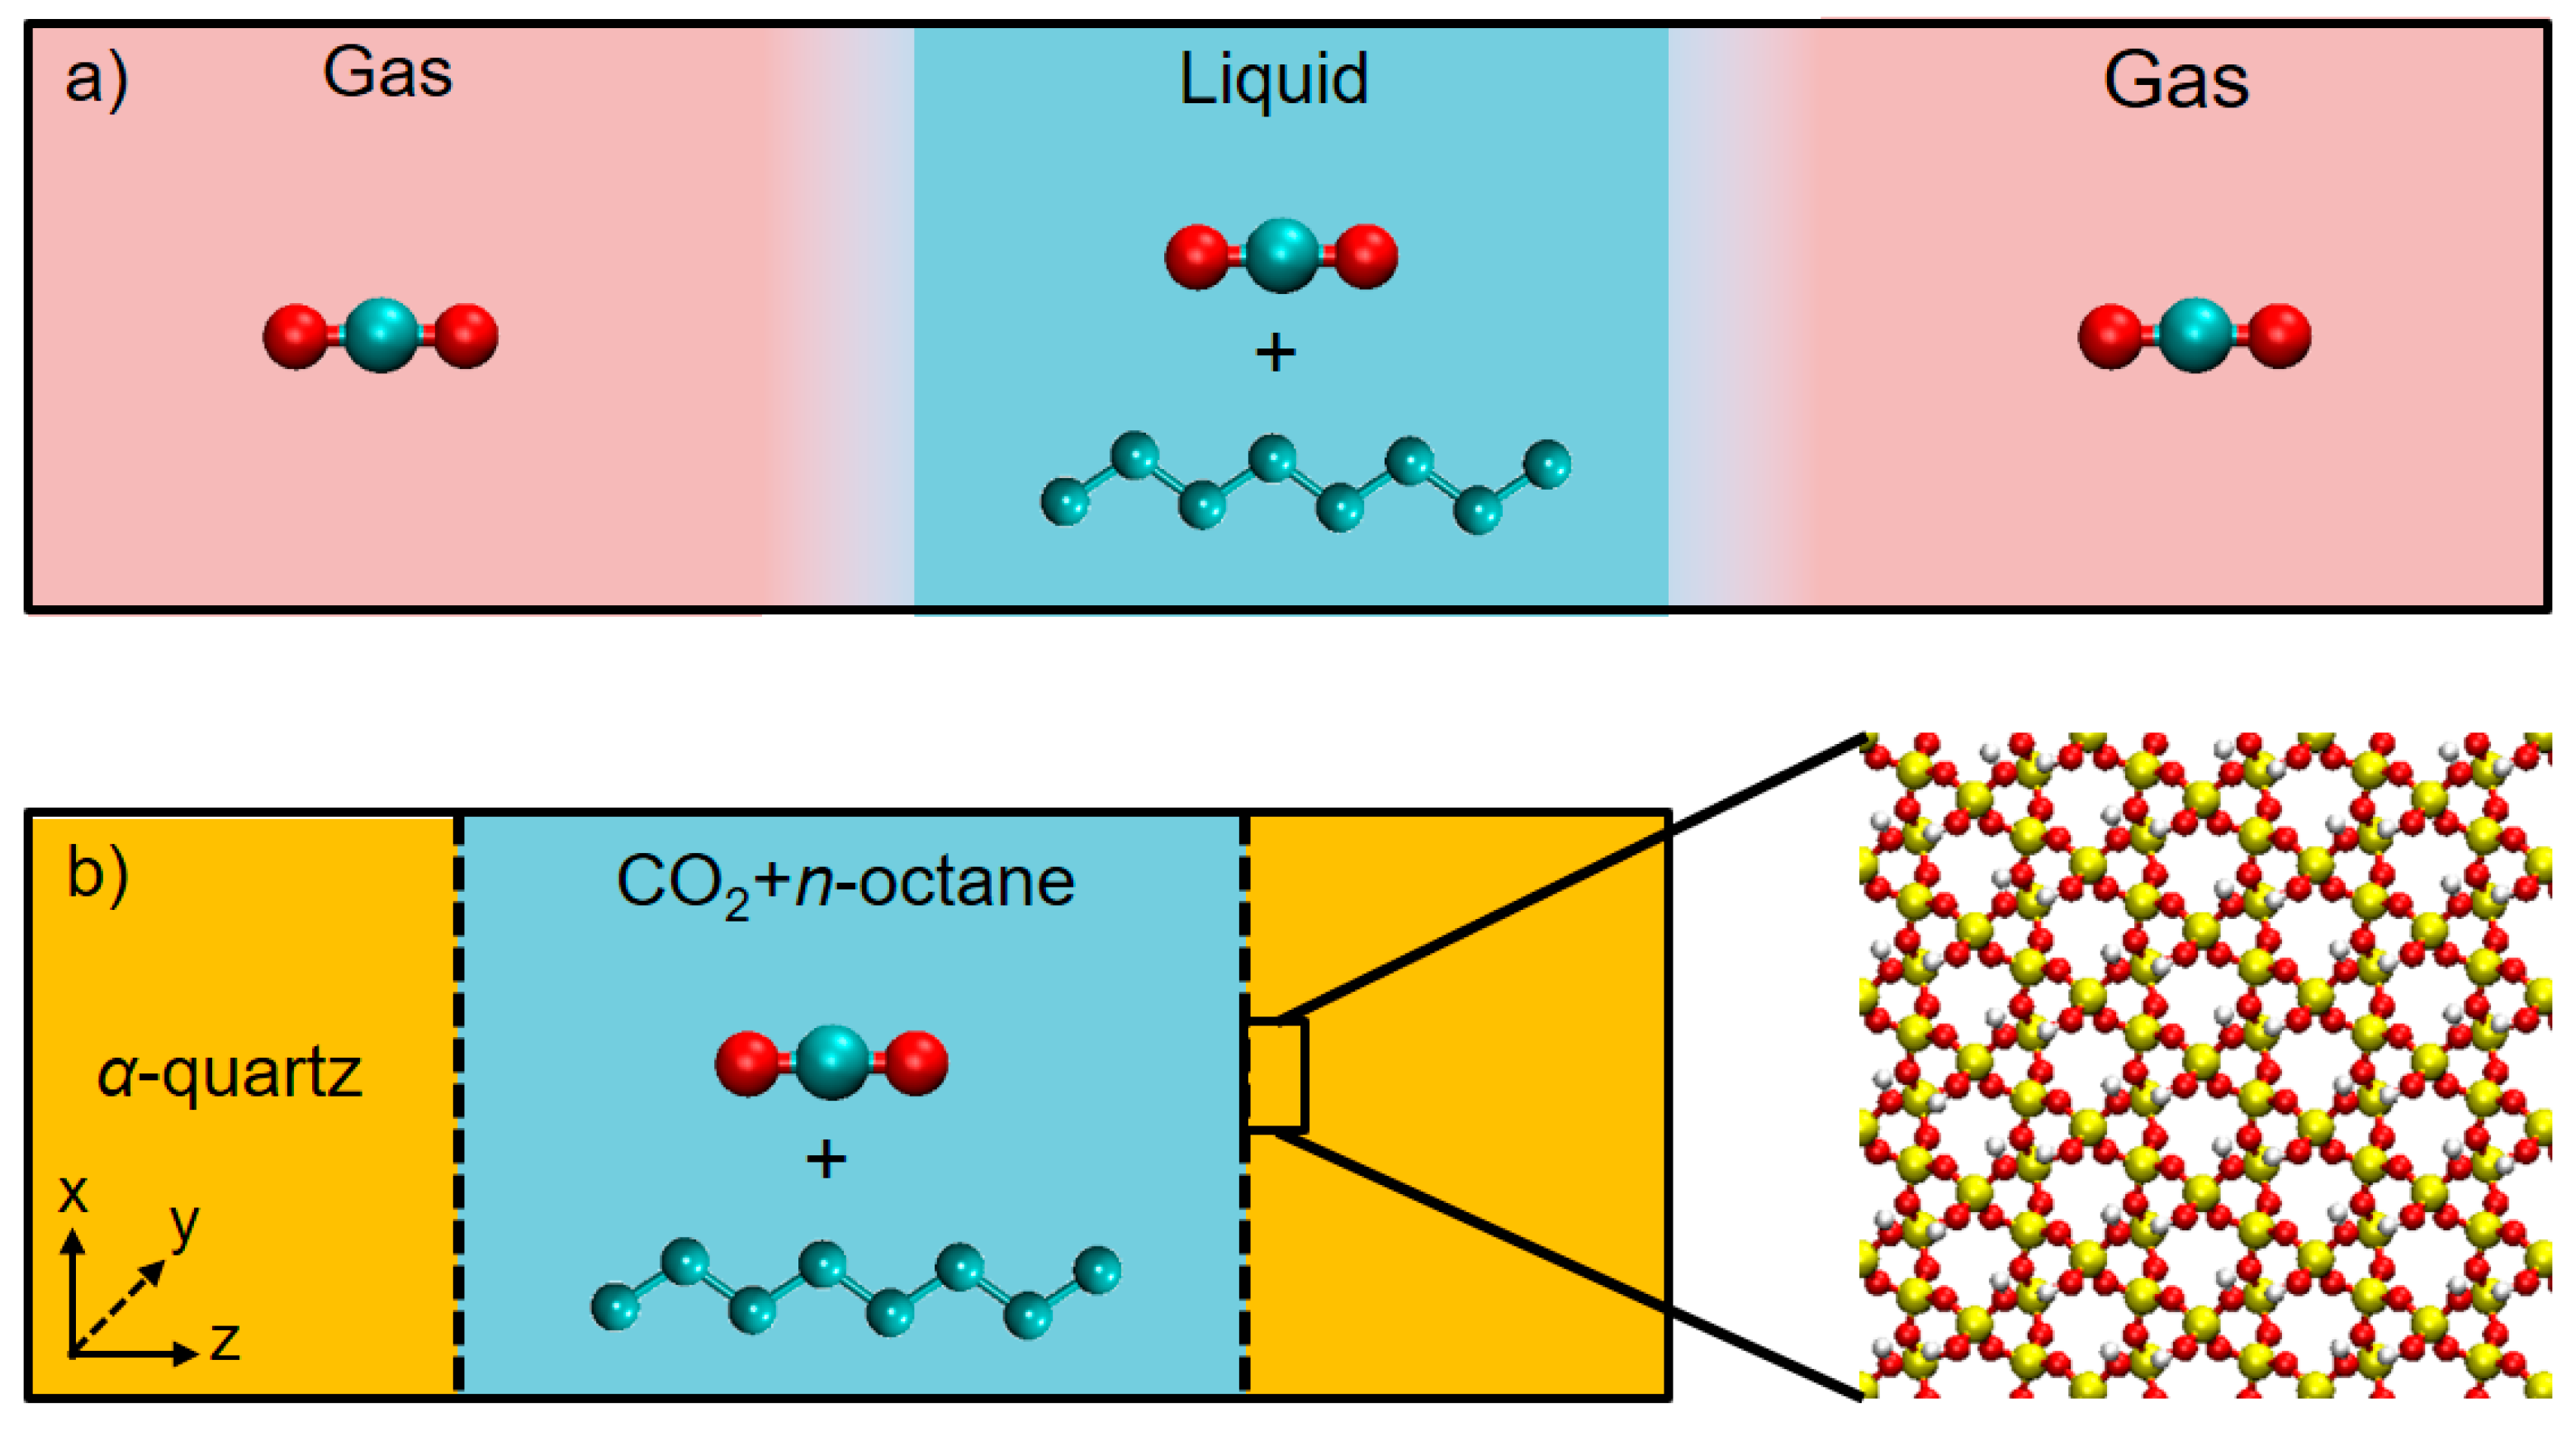
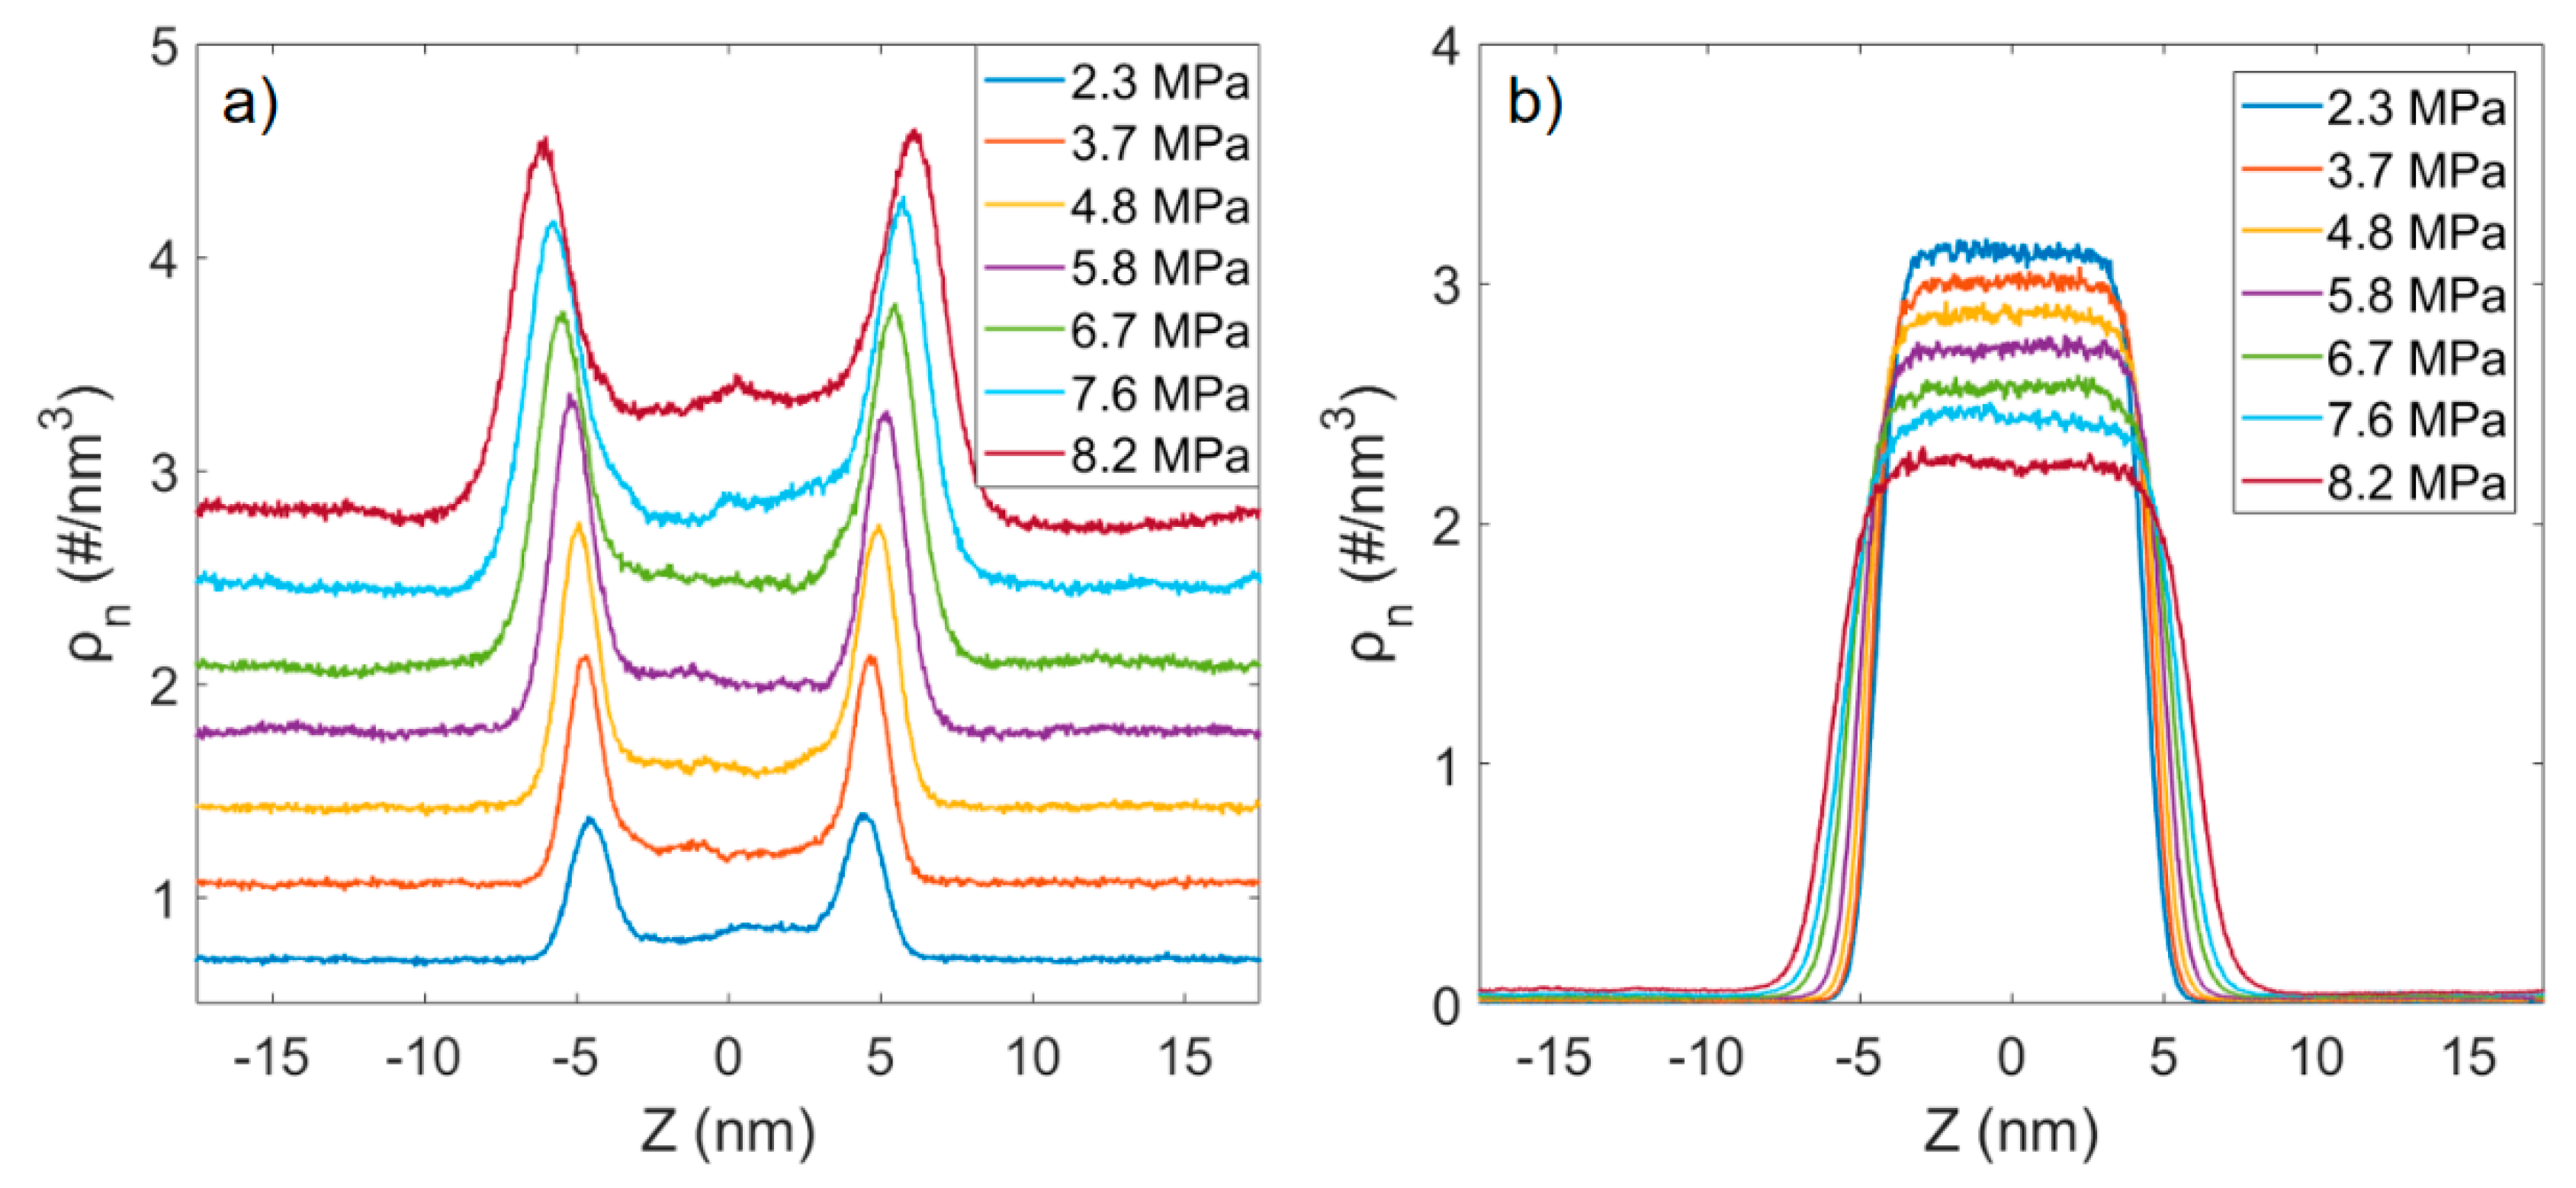
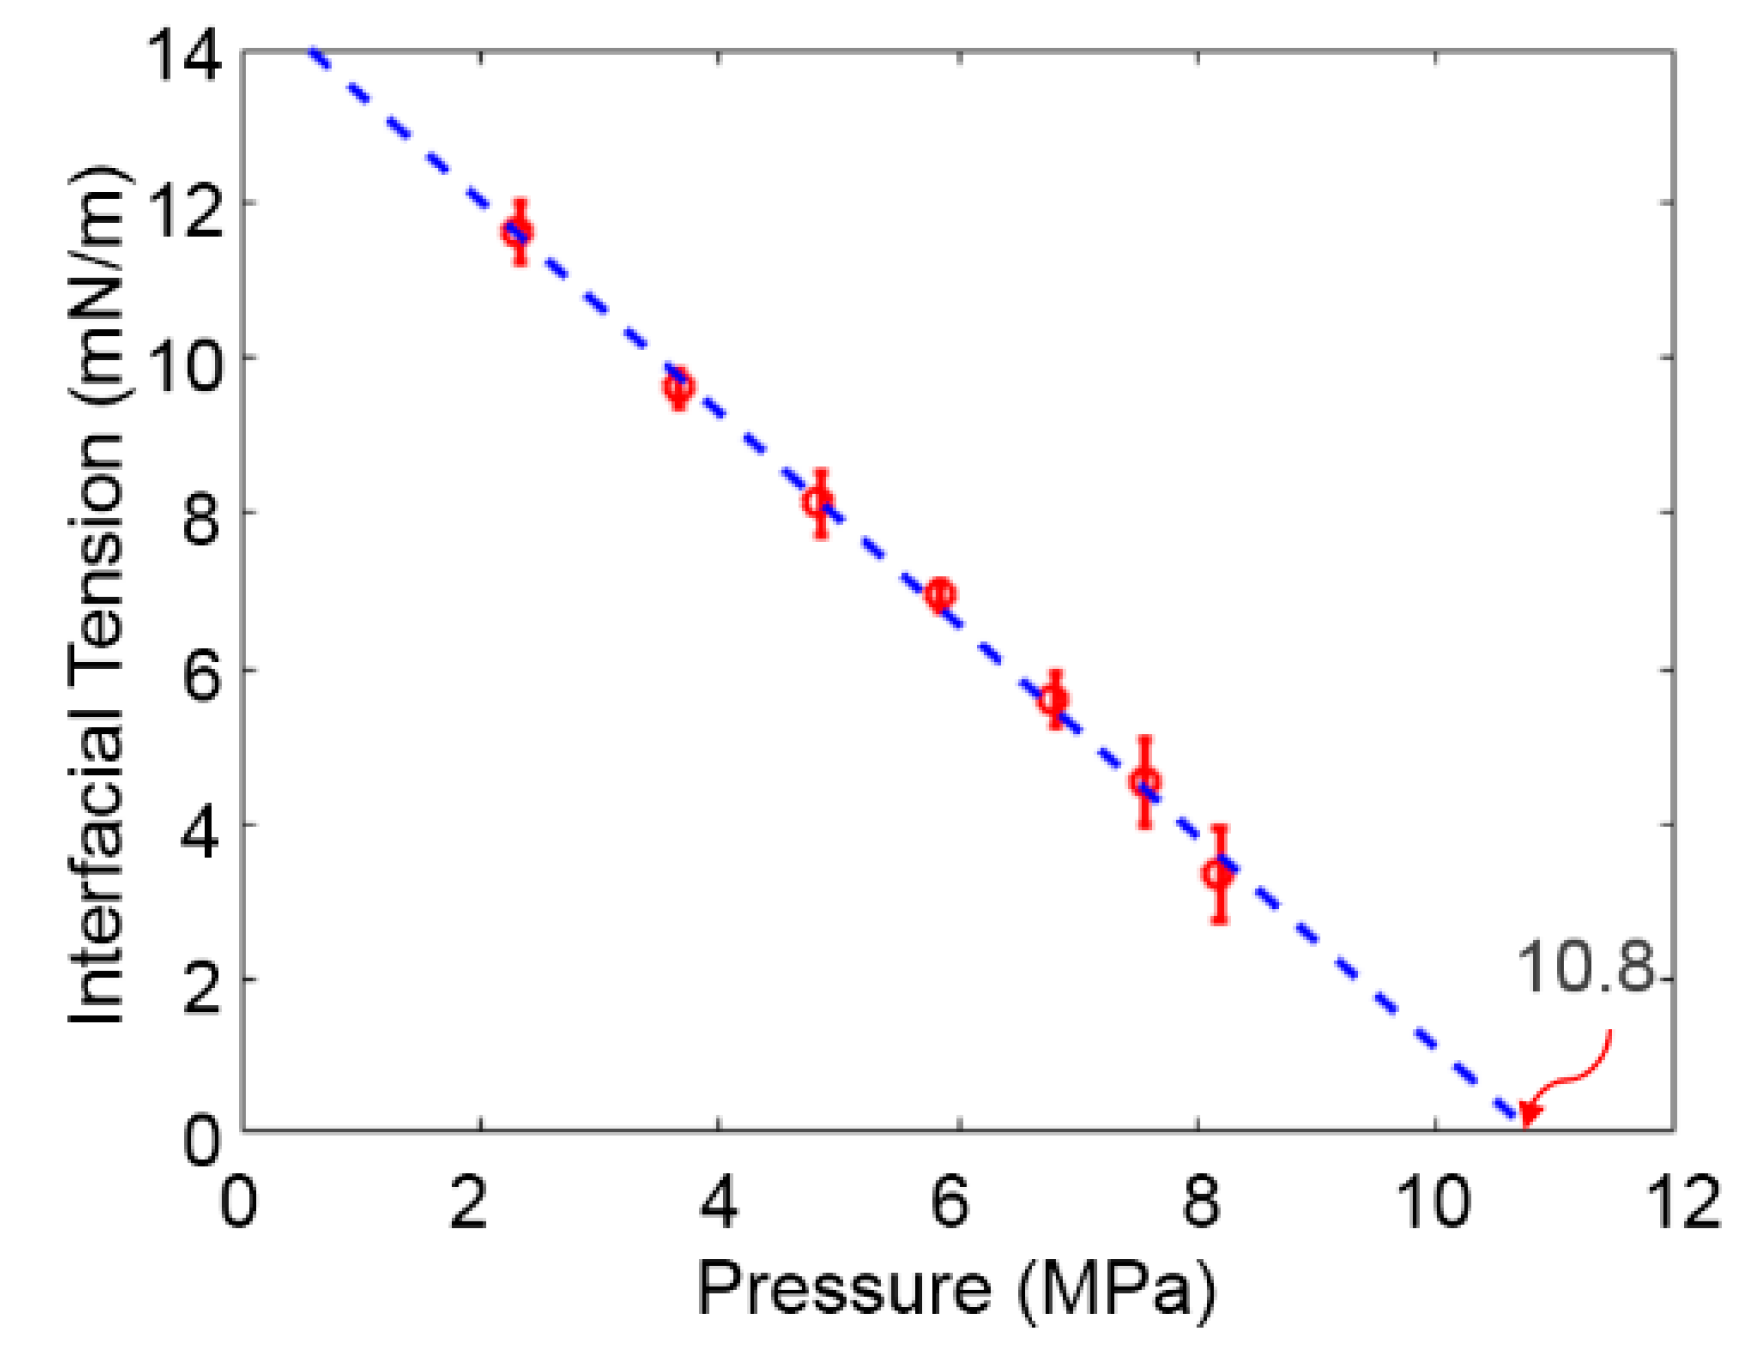
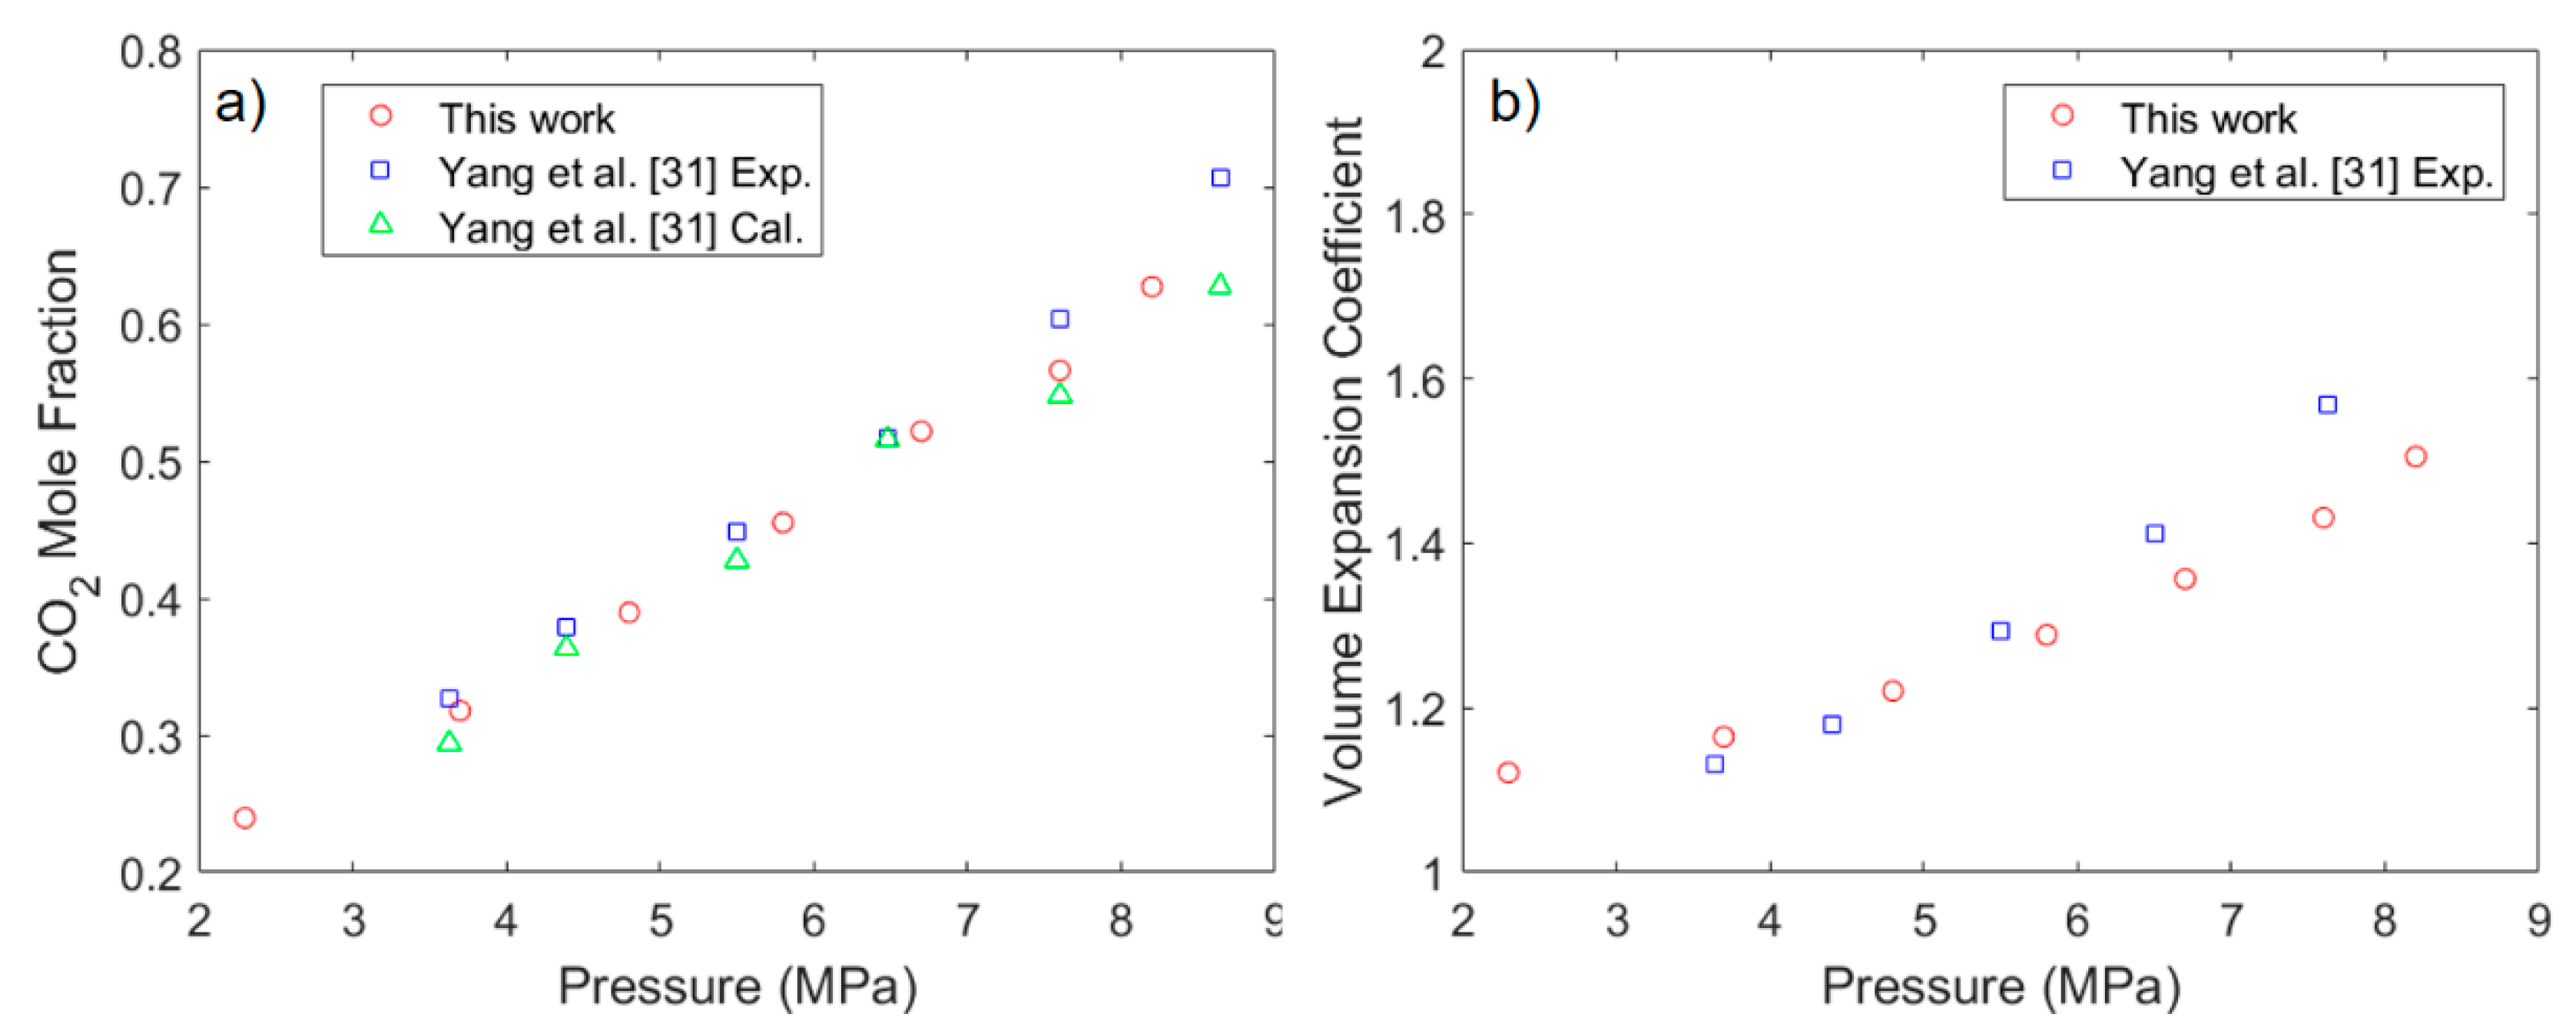
3.1. Solubility Process of CO2 and n-Octane System

The number density profiles of the CO2 and n-octane system under different pressure are shown in Figure 2, respectively. Since the pressures are lower than the MMP, two obvious CO2/n-octane interfaces are formed on both sides of oil phase. The width of interfaces became wider from 3 nm (2.3 MPa) to 6 nm (8.2 MPa) and the ratio of peak density to bulk density (no matter the gas phase or the liquid phase) decreases with pressure, which indicates the interfaces tend to disappear. For clearly showing the intensity of the interfaces, the interfacial tensions (IFT) are calculated by the formulation of Gibbs, as follows [37]:
γ = 1 2 [ P z z P x x + P y y 2 ] L z ,
where γ (N/m) is the IFT, P α α   ( α = x , y , z ) (Pa) are the diagonal elements of the pressure tensor, and L z (m) is the length of the simulation box in the Z-direction.
As shown in Figure 3, the IFT decreases with the pressure, and presents a good linear relationship. On the one hand, this trend shows that the intensity of the interface becomes weak. On the other hand, the good linear relationship can be used to predict the MMP. Vanishing interfacial tension method is widely used for predicting the MMP, and the MMP are obtained by linearly extrapolating the IFT decreasing to zero, as shown in Figure 3 [38]. A linear function is used to fit these points. The results show that IFT = −1.369P + 14.786, where P is the pressure. According to the zero value of IFT, the predicted MMP is 10.8 MPa, which is close to the experimental data 11.2 MPa of Liu et al. [39]. Similarly, the predicted MMP (8.63 MPa and 11.0 MPa) at 323.15 K and 348.25 K are also consistent with the experimental value 8.57 MPa (323.15 K) of Yang et al. [40] and 11.5 MPa (348.25 K) of Gallegos et al. [10], as shown in Supplementary Information Figure S1. Therefore, calculating IFT by MD simulations is an efficient and low-cost method to predict the MMP. The MMP prediction for multicomponent oil and the real crude oil still needs further verification.
The solubility of CO2 in n-octane is also an important property for the mixing process. Figure 4a shows the data of the mole fraction of CO2 in the n-octane, which is calculated by the number of molecules in the liquid phase (not including the interfaces). It can be seen that the solubility of CO2 in the n-octane increases as the pressure of the system increases, which agrees well with the experimental data and predicted solubility by equations of state [29]. As shown in Figure 2, n-octane molecules are always concentrated in the liquid phase, and almost no n-octane is dissolved in CO2. It shows that a large amount of CO2 dissolved in oil is the main process of mixing, which causes the volume of oil to expand. The volume expansion coefficients (V/V0) of liquid phase are shown in Figure 4b, which is close to the experimental data [31].
The increase of CO2 solubility also improves the flow characteristics of oil. Therefore, the diffusion coefficient distribution of CO2 and n-octane are calculated to observe the change of flow characteristics, using Einstein relation [41] to fit the mean square displacement as follows:
D = lim t | R i ( t ) R i ( 0 ) | 2 6 t ,
where D is the diffusion coefficient (m2/s), R i ( t ) R i ( 0 ) (m) is the center of mass displacement of the molecules, and t (s) is the simulation time.
As shown in Figure 5a, the diffusion coefficients of CO2 in the gas phase are an order of magnitude larger than CO2 in the liquid phase, and have a significant drop at the interfaces. The diffusion coefficients of gas phase decrease with the increase of pressure. In liquid phase, CO2 is affected by the strong interaction of n-octane, and the diffusion coefficients are slightly larger than n-octane at around 1.6 × 10⁻⁸ m2/s and have no obvious change. For n-octane (Figure 5b), due to the increasing solubility of CO2, the diffusion coefficients of n-octane increase. Especially in the interface zone, the effect is more obvious. Although there is a little change in the middle of the liquid phase, as the proportion of interface zone increases gradually, the total diffusion coefficient of n-octane increases more obviously.
To further understand the influence of structure changes to diffusion after CO2 dissolved, the radial number density is calculated, as shown in Figure 6. For CO2 (Figure 6a,b), the number density only has one peak in the gas phase under low pressure. Beyond the supercritical pressure, the second peak appears in number density, and shows the supercritical properties. In liquid phase, the second peak is more obvious, and the value is larger due to the interaction of n-octane, even at low pressure. Therefore, CO2 is denser in the liquid phase, and the diffusion coefficient is lower. For n-octane (Figure 6c,d), as the system pressure increases, the surrounding n-octane decreases, and the surrounding CO2 increases, which is of benefit to weaken the interaction between n-octane molecules. At the same time, the increased diffusion of CO2 facilitates improved diffusion of n-octane.

3.2. Microstructure of CO2 and n-Octane in α-Quartz Nanoslit

After exploring the solubility process, the adsorption structure changes of n-octane and CO2 are investigated, when different mole ratios of CO2 molecules are injected into the α-quartz nanoslit. Figure 7a shows that the pure n-octane exhibits a strong adsorption on the surface, and almost no n-octane in the middle of the slit. This means most n-octane molecules are in a state of adsorption and low diffusion, which is not conducive to the exploitation. By injecting CO2, this situation could be changed. After adding CO2 into the nanoslit, CO2 adsorbs on the α-quartz surface, which is closer than n-octane. The adsorbed n-octane molecules are displaced to the middle of the slit by the CO2 (the detailed interaction energy of n-octane and CO2 on α-quartz surface are shown in Supplementary Information Figure S2). For the ratio of 1:1, the adsorbed n-octane molecules decrease slightly. Meanwhile, the multilayer adsorbed layers still exist, and 54% of n-octane molecules are in the bulk (not adsorbed) state in the zone from −1.65 nm to 1.65 nm. When increasing the ratio to 3:1, the second adsorbed layer almost disappears. Seventy-three percent of n-octane molecules are in bulk state within the same zone. However, when the ratio goes up to 4:1, the adsorption state has no obvious change, except the CO2 increase. The molecules in bulk state are 77% in the same zone. Although a lot of CO2 molecules are added, the n-octane molecules in bulk state only increase 4%. According to the density profile, if only the displacement efficiency is considered, the optimal injection ratio is around 3:1 under this condition. Therefore, although high CO2 injection is of benefit to oil recovery, the economic efficiency still needs to be considered.
Under nano-confinement, molecules always have a preferential orientation at the adsorption interfaces (i.e., two obvious adsorbed layers) due to asymmetric forces. To analyze the effect of α-quartz nanoslit on the orientation of CO2 and n-octane, the orientation distribution of them in first and second adsorbed layers (Figure 7) are examined respectively, as shown in Figure 8, by calculating the angle θ between molecular vector (O–O vector for CO2 and CH3–CH3 vector for n-octane) and a reference vector perpendicular to the α-quartz surface. When the molecule is parallel to the α-quartz surface, θ will be close to 90°, and when the molecule is perpendicular to the surface, θ will tend to 0° or 180°. An orange dash line is shown in every picture to present the orientation distribution in bulk state. In the first adsorbed layer, both CO2 and n-octane prefer to be parallel to the α-quartz surface, due to the attraction of α-quartz surface. This behavior is little affected by CO2 injection, which is similar to the behavior on the calcite surface [18]. Although most n-octane molecules maintain their original adsorption orientation, most of the area of the α-quartz surface is occupied by CO2, according to the density profile (Figure 7). The n-octane in the first layer is displaced to the second layer or the middle of nanoslit. In the second adsorbed layer, the orientation distribution of CO2 is almost the same as the bulk state, which implies that CO2 is weakly affected by the surface. For n-octane, when CO2 is not injected, the orientation is mainly around 45° and 135°. After injection of CO2, the orientation of n-octane tends to be random, which suggests that CO2 weakens the interaction between n-octane and the α-quartz surface, and more n-octane molecules become bulk state. This phenomenon is also consistent with the gradual disappearance of the second adsorption layer in the density profile (Figure 7). Therefore, CO2 injection can help to displace the oil in adsorbed state and enhance the oil recovery.

4. Conclusions

CO2 EOR plays an important role in tertiary oil recovery and has attracted growing research interest due to its excellent properties, such as low viscosity and easy accessibility. Owing to the wide distribution of nanopores in unconventional reservoirs, confinement effects must be considered, and have significant impact on the interfacial properties. In this work, a series of MD simulations have been performed to investigate the interfacial properties of CO2 and n-octane in solubility process and α-quartz nanoslit. In the solubility process, CO2 dissolves into n-octane and causes the volumetric expansion of n-octane and the fading of interfaces, which leads to the interfacial tension decreasing linearly with pressure. A linear function is used to fit the interfacial tension and obtain the MMP by vanishing interfacial tension method. The MD-predicted MMP and CO2 solubility are in agreement with the experimental data, quantitatively. To further understand the improvement of flow characteristics, the diffusion coefficient distribution of n-octane shows that the diffusion is mainly improved at the interface. Although there is a little improvement in the middle of the liquid phase, the total diffusion coefficient increases more obviously as the proportion of interface zone increases gradually. The number density of n-octane indicates that the improvement of its diffusion is due to the increase in surrounding CO2, which weakens the interaction between n-octane molecules. After understanding the solubility process, the adsorption structure changes of n-octane and CO2 in α-quartz nanoslit, and the optimal injected ratio, have been investigated. The adsorbed n-octane molecules are displaced from the surface by injected CO2, which is beneficial to enhancing oil recovery. Considering the displacement efficiency, the optimal injection ratio is around 3:1 under this condition. Then, the orientation distributions of CO2 and n-octane have been observed to determine the adsorption state. The orientation of both CO2 and n-octane is concentrated on 90° in the adsorbed layer closest to the surface. In the second layer, the orientation of n-octane tends to be random after injection of CO2. All observed phenomena, such as increased diffusion, displacement of oil, and more random orientation of oil, are propitious to CO2 EOR. Therefore, this work has systematically studied the whole process, from solubility process to oil displacement, in nanoslit, and is helpful to understanding the mechanism of CO2 EOR at microscales. In future work, other types of oil, such as naphthenic hydrocarbon, aromatic hydrocarbon, and real crude oil, need to be further studied. (1) The applicability of predicted interface properties through MD simulation still needs to be verified for different kinds of oil. Especially, use of the vanishing interfacial tension method to predict MMP in MD simulations. (2) The different interactions between crude oil and rock surface lead to significantly different adsorption situations. For various adsorption states, the optimal CO2 injection ratio still needs to be explored.

Supplementary Materials

The following are available online at https://www.mdpi.com/1996-1073/11/11/3045/s1. Table S1. Lennard-Jones parameters and charges for the CO2 and n-octane. Table S2. Lennard-Jones parameters and charges for α-quartz. Figure S1. Interfacial tensions of CO2 and n-octane binary system as a function of the pressure. Figure S2. The interaction energy of n-octane and CO2 on α-quartz surface.

Author Contributions

Methodology and analytical tools J.P.; investigation X.Q., F.G. and W.F.; validation F.P.; writing-original draft R.W; writing-review Z.G.

Funding

This research was funded by the National Science and Technology Major Project (No. 2017ZX05049-006) and the National Key Research and Development Plan (No. 2016YFB0600805).

Acknowledgments

J.P., X.Q., F.G., and W.F. thank the support from the National Science and Technology Major Project (No. 2017ZX05049-006). F.P., R.W. and Z.G. thank the support from the National Key Research and Development Plan (No. 2016YFB0600805). This work was carried out at the National Supercomputing Center in Guangzhou (Tianhe II).

Conflicts of Interest

The authors declare no conflict of interest.

References

  1. Babadagli, T. Development of mature oil fields—A review. J. Pet. Sci. Eng. 2007, 57, 221–246. [Google Scholar] [CrossRef]
  2. Alvarado, V.; Manrique, E. Enhanced oil recovery: An update review. Energies 2010, 3, 1529–1575. [Google Scholar] [CrossRef]
  3. Zou, C.; Yang, Z.; Tao, S.; Yuan, X.; Zhu, R.; Hou, L.; Wu, S.; Sun, L.; Zhang, G.; Bai, B. Continuous hydrocarbon accumulation over a large area as a distinguishing characteristic of unconventional petroleum: The Ordos Basin, North-Central China. Earth-Sci. Rev. 2013, 126, 358–369. [Google Scholar] [CrossRef]
  4. Orr, F.M., Jr.; Taber, J.J. Use of carbon dioxide in enhanced oil recovery. Science 1984, 224, 563–569. [Google Scholar] [CrossRef] [PubMed]
  5. Markewitz, P.; Kuckshinrichs, W.; Leitner, W.; Linssen, J.; Zapp, P.; Bongartz, R.; Schreiber, A.; Müller, T.E. Worldwide innovations in the development of carbon capture technologies and the utilization of CO2. Energy Environ. Sci. 2012, 5, 7281–7305. [Google Scholar] [CrossRef] [Green Version]
  6. Hirasaki, G.J.; Miller, C.A.; Puerto, M. Recent advances in surfactant EOR. SPE J. 2011, 16, 889–907. [Google Scholar] [CrossRef]
  7. Kang, X.; Zhang, J.; Sun, F.; Zhang, F.; Feng, G.; Yang, J.; Zhang, X.; Xiang, W. A review of polymer EOR on offshore heavy oil field in Bohai Bay, China. In Proceedings of the SPE Enhanced Oil Recovery Conference, Kuala Lumpur, Malaysia, 19–21 July 2011. [Google Scholar] [CrossRef]
  8. Sen, R. Biotechnology in petroleum recovery: The microbial EOR. Prog. Energy Combust. Sci. 2008, 34, 714–724. [Google Scholar] [CrossRef]
  9. Van Bergen, F.; Gale, J.; Damen, K.; Wildenborg, A. Worldwide selection of early opportunities for CO2-enhanced oil recovery and CO2-enhanced coal bed methane production. Energy 2004, 29, 1611–1621. [Google Scholar] [CrossRef]
  10. Jimenez-Gallegos, R.; Galicia-Luna, L.A.; Elizalde-Solis, O. Experimental vapor—Liquid equilibria for the carbon dioxide+ octane and carbon dioxide+ decane systems. J. Chem. Eng. Data 2006, 51, 1624–1628. [Google Scholar] [CrossRef]
  11. Peng, D.-Y.; Robinson, D.B. A new two-constant equation of state. Ind. Eng. Chem. Fundam. 1976, 15, 59–64. [Google Scholar] [CrossRef]
  12. Nagarajan, N.; Robinson, R., Jr. Equilibrium phase compositions, phase densities, and interfacial tensions for carbon dioxide+ hydrocarbon systems. 2. Carbon dioxide+ n-decane. J. Chem. Eng. Data 1986, 31, 168–171. [Google Scholar] [CrossRef]
  13. Shaver, R.; Robinson, R., Jr.; Gasem, K. An automated apparatus for equilibrium phase compositions, densities, and interfacial tensions: Data for carbon dioxide+ decane. Fluid Phase Equilib. 2001, 179, 43–66. [Google Scholar] [CrossRef]
  14. Rommerskirchen, R.; Bilgili, H.; Fischer, J.; Sottmann, T. Impact of Miscibility Enhancing Additives on the Flooding Scheme in CO2 EOR Processes. In Proceedings of the SPE Improved Oil Recovery Conference, Tulsa, OH, USA, 14–18 April 2018. [Google Scholar] [CrossRef]
  15. Pathak, M.; Cho, H.; Deo, M. Experimental and Molecular Modeling Study of Bubble Points of Hydrocarbon Mixtures in Nanoporous Media. Energy Fuels 2017, 31, 3427–3435. [Google Scholar] [CrossRef]
  16. Alfarge, D.; Wei, M.; Bai, B. Data analysis for CO2-EOR in shale-oil reservoirs based on a laboratory database. J. Pet. Sci. Eng. 2018, 162, 697–711. [Google Scholar] [CrossRef]
  17. Majumder, M.; Chopra, N.; Andrews, R.; Hinds, B.J. Nanoscale hydrodynamics: Enhanced flow in carbon nanotubes. Nature 2005, 438, 44. [Google Scholar] [CrossRef] [PubMed]
  18. Whitby, M.; Cagnon, L.; Thanou, M.; Quirke, N. Enhanced fluid flow through nanoscale carbon pipes. Nano Lett. 2008, 8, 2632–2637. [Google Scholar] [CrossRef] [PubMed]
  19. Wang, S.; Javadpour, F.; Feng, Q. Fast mass transport of oil and supercritical carbon dioxide through organic nanopores in shale. Fuel 2016, 181, 741–758. [Google Scholar] [CrossRef]
  20. Santos, M.S.; Franco, L.F.; Castier, M.; Economou, I.G. Molecular dynamics simulation of n-alkanes and CO2 confined by calcite nanopores. Energy Fuels 2018, 32, 1934–1941. [Google Scholar] [CrossRef]
  21. Wang, R.; Peng, F.; Song, K.; Feng, G.; Guo, Z. Molecular dynamics study of interfacial properties in CO2 enhanced oil recovery. Fluid Phase Equilib. 2018, 467, 25–32. [Google Scholar] [CrossRef]
  22. Le, T.; Striolo, A.; Cole, D.R. CO2–C4H10 mixtures simulated in silica slit pores: Relation between structure and dynamics. J. Phys. Chem. C 2015, 119, 15274–15284. [Google Scholar] [CrossRef]
  23. Yan, Y.; Dong, Z.; Zhang, Y.; Wang, P.; Fang, T.; Zhang, J. CO2 activating hydrocarbon transport across nanopore throat: Insights from molecular dynamics simulation. PCCP 2017, 19, 30439–30444. [Google Scholar] [CrossRef] [PubMed]
  24. Mejía, A.S.; Cartes, M.; Segura, H.; Müller, E.A. Use of equations of state and coarse grained simulations to complement experiments: Describing the interfacial properties of carbon dioxide+ decane and carbon dioxide+ eicosane mixtures. J. Chem. Eng. Data 2014, 59, 2928–2941. [Google Scholar] [CrossRef]
  25. Bresme, F.; Chacón, E.; Tarazona, P. Force-field dependence on the interfacial structure of oil–water interfaces. Mol. Phys. 2010, 108, 1887–1898. [Google Scholar] [CrossRef]
  26. Zhu, A.; Zhang, X.; Liu, Q.; Zhang, Q. A fully flexible potential model for carbon dioxide. Chin. J. Chem. Eng. 2009, 17, 268–272. [Google Scholar] [CrossRef]
  27. Nath, S.K.; Escobedo, F.A.; de Pablo, J.J. On the simulation of vapor–liquid equilibria for alkanes. J. Chem. Phys. 1998, 108, 9905–9911. [Google Scholar] [CrossRef]
  28. Hess, B.; Kutzner, C.; Van Der Spoel, D.; Lindahl, E. GROMACS 4: Algorithms for highly efficient, load-balanced, and scalable molecular simulation. J. Chem. Theory Comput. 2008, 4, 435–447. [Google Scholar] [CrossRef] [PubMed]
  29. Hockney, R.; Goel, S.; Eastwood, J. Quiet high-resolution computer models of a plasma. J. Comput. Phys. 1974, 14, 148–158. [Google Scholar] [CrossRef]
  30. Essmann, U.; Perera, L.; Berkowitz, M.L.; Darden, T.; Lee, H.; Pedersen, L.G. A smooth particle mesh Ewald method. J. Chem. Phys. 1995, 103, 8577–8593. [Google Scholar] [CrossRef]
  31. Yang, Z.; Li, M.; Peng, B.; Lin, M.; Dong, Z. Dispersion property of CO2 in oil. 1. Volume expansion of CO2+ alkane at near critical and supercritical condition of CO2. J. Chem. Eng. Data 2012, 57, 882–889. [Google Scholar] [CrossRef]
  32. Evans, D.J.; Holian, B.L. The nose–hoover thermostat. J. Chem. Phys. 1985, 83, 4069–4074. [Google Scholar] [CrossRef]
  33. Dong, T.; Harris, N.B. 8 pore size distribution and morphology in the Horn River Shale, Middle and Upper Devonian, Northeastern British Columbia, Canada. In Electron Microscopy of Shale Hydrocarbon Reservoirs; AAPG: Houston, TX, USA, 2013. [Google Scholar]
  34. Cygan, R.T.; Liang, J.; Kalinichev, A.G. Molecular models of hydroxide, oxyhydroxide, and clay phases and the development of a general force field. J. Phys. Chem. B 2004, 108, 1255–1266. [Google Scholar] [CrossRef]
  35. Yeh, I.; Berkowitz, M.L. Ewald summation for systems with slab geometry. J. Chem. Phys. 1999, 111, 3155–3162. [Google Scholar] [CrossRef]
  36. Jones, J.E. On the determination of molecular fields.—II. From the equation of state of a gas. Proc. R. Soc. Lond. A 1924, 106, 463–477. [Google Scholar] [CrossRef]
  37. Zhang, Y.; Feller, S.E.; Brooks, B.R.; Pastor, R.W. Computer simulation of liquid/liquid interfaces. I. Theory and application to octane/water. J. Chem. Phys. 1995, 103, 10252–10266. [Google Scholar] [CrossRef]
  38. Rao, D.N. A new technique of vanishing interfacial tension for miscibility determination. Fluid Phase Equilib. 1997, 139, 311–324. [Google Scholar] [CrossRef]
  39. Jianyi, L.; Guangdong, Z.; Yanli, L.; Fan, Z. Study on the Methods of Reducing the Miscible Pressure of CO2 Flooding. In Proceedings of the The Second China Energy Scientist Forum, Xuzhou, China, 18–19 October 2010. [Google Scholar]
  40. Yang, Z.; Li, M.; Peng, B.; Lin, M.; Dong, Z.; Ling, Y. Interfacial tension of CO2 and organic liquid under high pressure and temperature. Chin. J. Chem. Eng. 2014, 22, 1302–1306. [Google Scholar] [CrossRef]
  41. Allen, M.P.; Tildesley, D.J. Computer Simulation of Liquids; Oxford University Press: Oxford, UK, 2017. [Google Scholar]
Figure 1. The schematic configuration of the simulation unit cell. (a) CO2 and n-octane binary system. (b) CO2 and n-octane in α-quartz nanoslit. Atom color codes: H, white; Si, yellow; O, red; C, CH2; and CH3, cyan.
Energies 11 03045 g001
Figure 2. Number density profiles of CO2 and n-octane system under different pressure. (a) CO2, (b) n-octane. # represents the number of molecules.
Energies 11 03045 g002
Figure 3. Interfacial tensions of CO2 and n-octane binary system as a function of the pressure at 343.15 K. Red circles are the simulation results. The blue dash line comes from the linear fitting: IFT = −1.369P + 14.786.
Energies 11 03045 g003
Figure 4. (a) CO2 mole fraction in n-octane as a function of the pressure at 343.15 K. (b) Volume expansion coefficient of liquid phase as a function of pressure. Blue square is the experimental data and green triangle is the prediction by equation of state from Yang et al. [31].
Energies 11 03045 g004
Figure 5. Diffusion coefficient distribution along the Z-direction under different pressures. (a) CO2, (b) n-octane.
Energies 11 03045 g005
Figure 6. Radial number density of (a) CO2–CO2 in the gas phase; (b) CO2–CO2 in the liquid phase; (c) octane–octane in the liquid phase; (d) octane–CO2 in the liquid phase. Note: octane–CO2 (octane is the reference molecule, CO2 is the surrounding molecule). # represents the number of molecules.
Energies 11 03045 g006
Figure 7. Number density profile of CO2 and n-octane after the addition of different ratio of CO2. The mole ratios of CO2 to n-octane are (a) pure n-octane, (b) 1:1, (c) 2:1, (d) 3:1, (e) 4:1. The inserted picture is the snapshot of n-octane adsorption after equilibrium. # represents the number of molecules.
Energies 11 03045 g007
Figure 8. The orientation distribution of (a) CO2 in first adsorbed layer, (b) CO2 in second adsorbed layer, (c) n-octane in first adsorbed layer, (d) n-octane in second adsorbed layer. The orange dash line is the orientation distribution in bulk state. The angle definition of CO2 (O–O vector) and n-octane (CH3–CH3 vector) are shown at the bottom.
Energies 11 03045 g008

