Multi-Objective Analysis for the Optimization of a High Performance Slab-on- Ground Floor in a Warm Climate


Abstract
:1. Introduction
1.1. Literature Overview
1.2. Multi-Objective Analysis
1.3. Thermal Behavior of Slab-on-Ground Floor
1.4. Assessment of the Environmental Score According to the ITACA Protocol
2. Methodological Approach
2.1. The Multi-Objective Optimization
2.1.1. The Input Values
2.1.2. The Output Values
- the thermal transmittance (U) has been fixed minor than 0.38 W/K, the legal limit (DM. 26/06/2015), considering the national climatic zone C;
- the maximum thickness of the floor has been set at 70 cm;
- the maximum achievable phase shift is 20 h, while the periodic thermal transmittance (Y12) is minor than 0.18 W/m2 K.
3. Results and Discussion
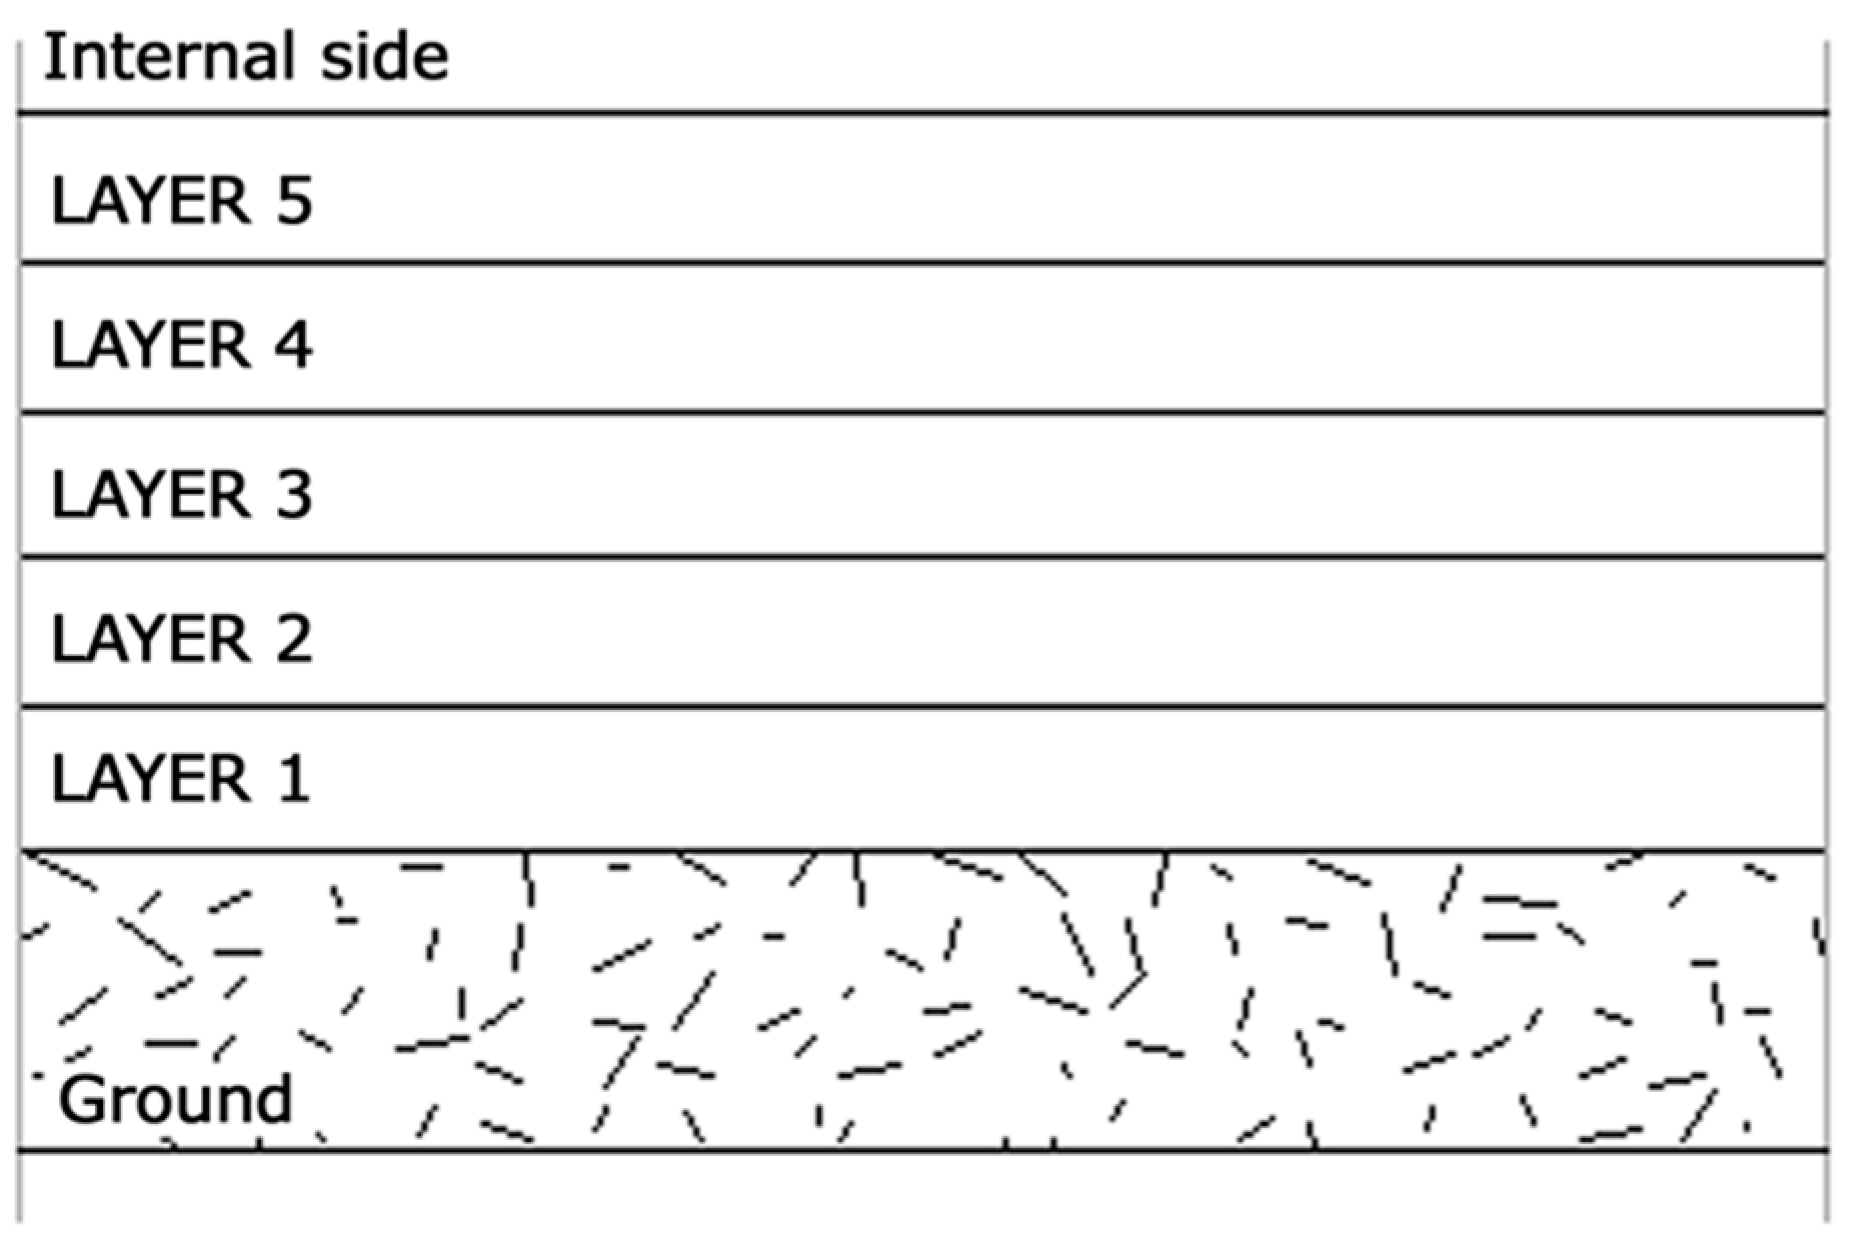
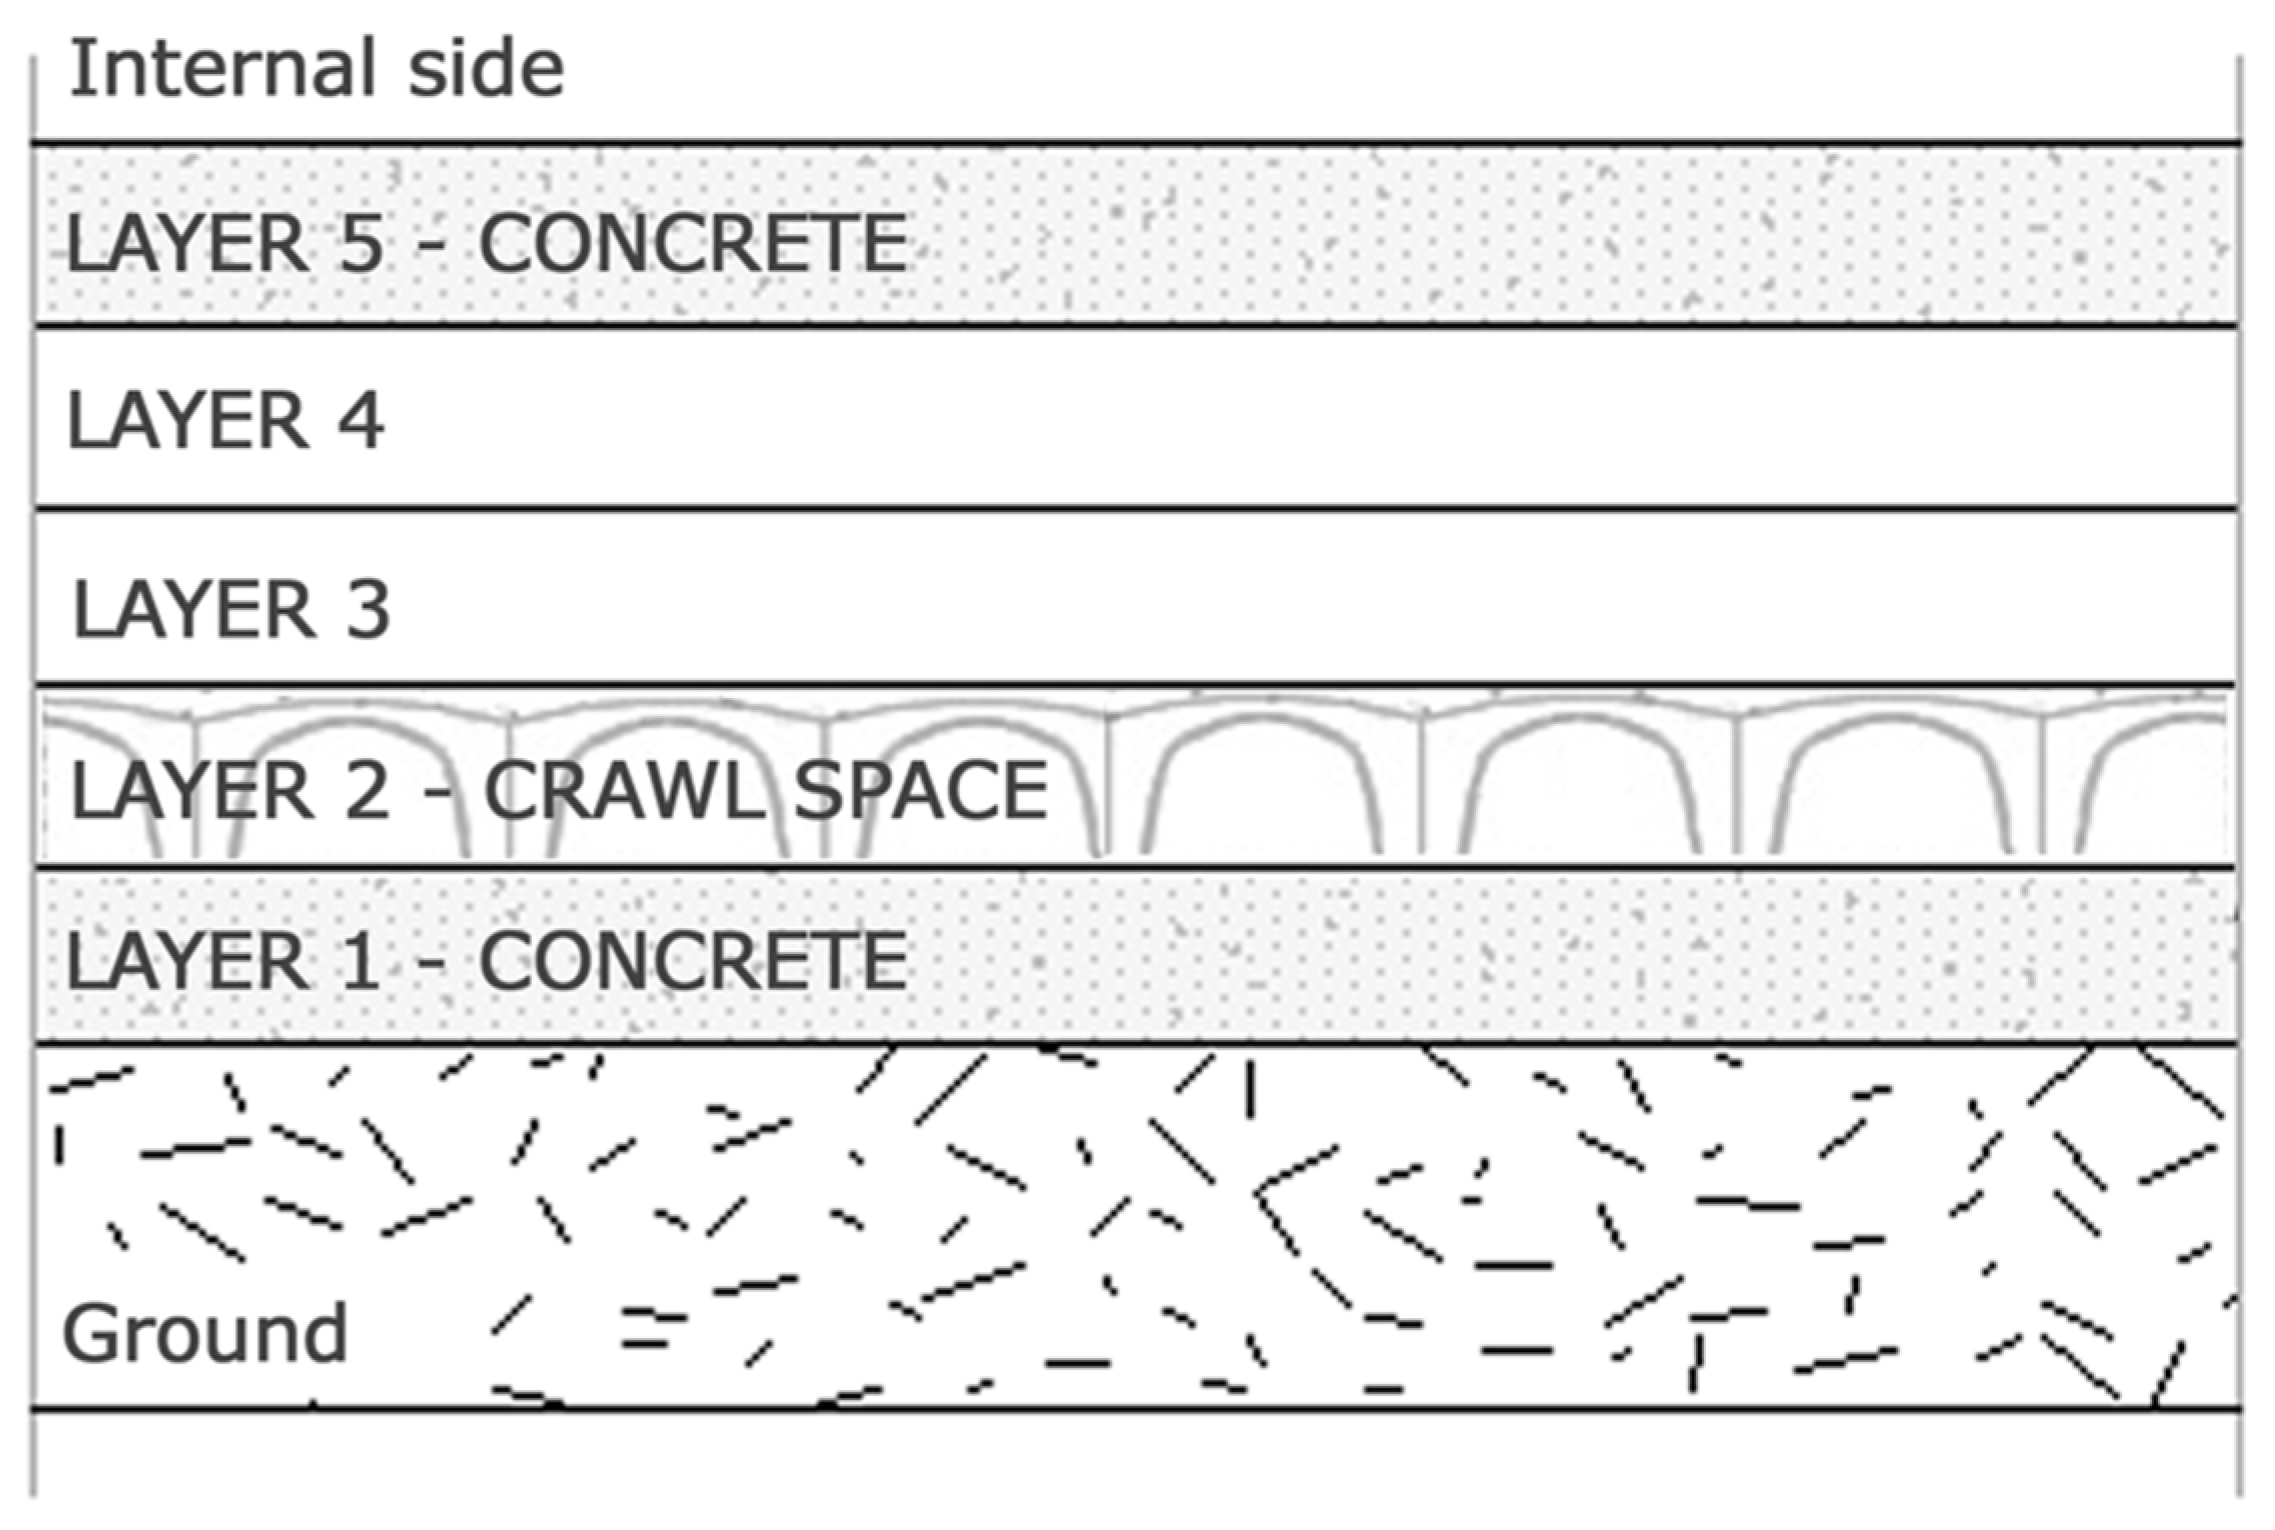
3.1. General Configurations
- a layer of concrete in contact with the ground. This ensures a leveling and a support for a possible crawl space or insulating material placement;
- a layer of concrete in the fifth layer which allows the control of internal gains because of its high thermal capacity with high internal areal heat capacity and low decrement factor.
- five variables relate to the input data of the five layers of the stratigraphy;
- 11 variables concern the thermal characteristics;
- one variable is linked to the sustainability based on the ITACA Protocol.
3.2. Optimization of Typical Configurations
3.2.1. Slab-on-Ground Floor with Concrete
3.2.2. Slab-on-Ground Floor with Gravel
3.2.3. Slab-on-Ground Floor with Crawl Space
4. Conclusions
Author Contributions
Funding
Acknowledgments
Conflicts of Interest
Nomenclature
| A | area (m2) |
| C | heat capacity (J/K) |
| Lmn | periodic thermal conductance (W/K) |
| R | thermal resistance (m2 K/W) |
| T | period of the variations (s) |
| U | thermal transmittance (W/m2 K) |
| Ymm | thermal admittance (W/m2 K) |
| Ymn | periodic thermal transmittance (W/m2 K) |
| Z | heat transfer matrix environment to environment |
| Zmn | element of the heat transfer matrix |
| a | thermal diffusivity (m2/s) |
| c | specific heat capacity (J/kgK) |
| d | thickness of a layer (m) |
| fd | decrement factor |
| j | unit on the imaginary axis for a complex number |
| q | density of heat flow rate (W/m2) |
| t | time (s or h) |
| x | distance through the component (m) |
| Δt | time shift: time lead (if positive) or time lag (if negative) (s or h) |
| Ms | total surface mass (excluding coats) (kg/m2) |
| Greek letters | |
| δ | periodic penetration depth of a heat wave in a material (m) |
| Φ | heat flow rate (W) |
| ξ | ratio of the thickness of the layer to the penetration depth |
| κ | areal heat capacity (kJ/m2 K) |
| λ | design thermal conductivity (W/mK) |
| ρ | density (kg/ m3) |
| θ | temperature (°C) |
| ω | angular frequency (rad/s) |
| ψ | phase differences (rad) |
| Subscripts | |
| m.n | for the thermal zones |
| a | air layer |
| 1 | Internal side |
| 2 | External side (ground) |
| s | related to surface |
| 22 | from environment to environment |
| Symbols | |
| ^ | complex amplitude |
| || | modulus of a complex number |
References
- European Commission. Taking Stock of the Europe 2020 Strategy for Smart Sustainable and Inclusive Growth, Brussels. Green Paper, A 2030 Framework for Climate and Energy Policies, COM (2013) 169. 2014. Available online: https://ec.europa.eu/info/publications/taking-stock-europe-2020-strategy-smart-sustainable-and-inclusive-growth_en (accessed on 19 March 2014).
- EPBD recast. Directive 2010/31/EU of the European Parliament and of Council of 19 May 2010 on the Energy Performance of Buildings (Recast). Available online: https://eur-lex.europa.eu/LexUriServ/LexUriServ.do?uri=OJ:L:2010:153:0013:0035:EN:PDF (accessed on 1 November 2018).
- D’Agostino, D. Assessment of the progress towards the establishment of definitions of Nearly Zero Energy Buildings (nZEBs) in European Member States. J. Build. Eng. 2015, 1, 20–32. [Google Scholar] [CrossRef]
- D’Agostino, D.; Parker, D. A framework for the cost-optimal design of nearly zero energy buildings (NZEBs) in representative climates across Europe. Energy 2018, 149, 814–829. [Google Scholar] [CrossRef]
- D’Agostino, D.; Parker, D. Data on cost-optimal Nearly Zero Energy Buildings (NZEBs) across Europe. Data Brief 2018. [Google Scholar] [CrossRef] [PubMed]
- Sartori, I.; Hestnes, A.G. Energy use in the life cycle of conventional and low-energy buildings: A review article. Energy Build. 2007, 39, 249–257. [Google Scholar] [CrossRef]
- Calvino, F.; Gennusa, M.L.; Morale, M.; Rizzo, G.; Scaccianoce, G. Comparing different control strategies for indoor thermal comfort aimed at the evaluation of the energy cost of quality of building. Appl. Therm. Eng. 2010, 30, 2386–2395. [Google Scholar] [CrossRef] [Green Version]
- Ramesh, T.; Prakash, R.; Shukla, K.K. Life cycle energy analysis of buildings: An overview. Energy Build. 2010, 42, 1592–1600. [Google Scholar]
- Elisa Franzoni, Materials Selection for Green Buildings: Which Tools for Engineers and Architects? Procedia Eng. 2011, 21, 883–890. [CrossRef]
- Fuentes-Cortés, L.F.; Flores-Tlacuahuac, A. Integration of distributed generation technologies on sustainable buildings. Appl. Energy 2018, 224, 582–601. [Google Scholar] [CrossRef]
- D’Agostino, D.; Cuniberti, B.; Bertoldi, P. Data on European non-residential buildings. Data Brief 2017, 14, 759–762. [Google Scholar] [CrossRef] [PubMed]
- D’Agostino, D.; Cuniberti, B.; Bertoldi, P. Energy consumption and efficiency technology measures in European non-residential buildings European. Energy Build. 2017, 153, 72–86. [Google Scholar] [CrossRef]
- Azari, R.; Abbasabadi, N. Embodied energy of buildings: A review of data, methods, challenges, and research trends. Energy Build. 2018, 168, 225–235. [Google Scholar] [CrossRef]
- Papadopoulos, A.M. State of the art in thermal insulation materials and aims for future developments. Energy Build. 2005, 37, 77–86. [Google Scholar] [CrossRef]
- Harvey, L.D.D. Net climatic impact of solid foam insulation produced with halocarbon and non-halocarbon blowing agents. Build. Environ. 2007, 42, 2860–2879. [Google Scholar] [CrossRef]
- Schmidt, M.; Crawford, R.H. A framework for the integrated optimisation of the life cycle greenhouse gas emissions and cost of buildings. Energy Build. 2018, 171, 155–167. [Google Scholar] [CrossRef]
- González-Mahecha, R.E.; Lucena, A.F.P.; Szklo, A.; Ferreira, P.; Vaz, A.I.F. Optimization model for evaluating on-site renewable technologies with storage in zero/nearly zero energy buildings. Energy Build. 2018, 172, 505–516. [Google Scholar] [CrossRef]
- Zacà, I.; D’Agostino, D.; Congedo, P.M.; Baglivo, C. Assessment of Cost-Optimality and Technical Solutions in High Performance Multi-Residential Buildings in the Mediterranean Area. Energy Build. 2015, 102, 250–265. [Google Scholar] [CrossRef]
- Congedo, P.M.; Balivo, C.; D’Agostino, D.; Zacà, I. Cost-optimal design for nearly zero energy office buildings located in warm climates. Energy 2015, 91, 967–982. [Google Scholar] [CrossRef]
- Wright, J.A.; Loosemore, H.A.; Farmani, R. Loosemore, Raziyeh Farmani, Optimization of building thermal design and control by multi-criterion genetic algorithm. Energy Build. 2002, 34, 959–972. [Google Scholar] [CrossRef]
- Castro-Lacouture, D.; Sefair, J.A.; Flórez, L.; Medaglia, A.L. Optimization model for the selection of materials using a LEED-based green building rating system in Colombia. Build. Environ. 2009, 44, 1162–1170. [Google Scholar] [CrossRef]
- Baglivo, C.; Congedo, P.M.; Fazio, A.; Laforgia, D. Multi-objective optimization analysis for high efficiency external walls of zero energy buildings (ZEB) in the Mediterranean climate. Energy Build. 2014, 84, 483–492. [Google Scholar] [CrossRef]
- Baglivo, C.; Congedo, P.M.; Fazio, A. Multi-criteria optimization analysis of external walls according to ITACA Protocol for zero energy buildings in the Mediterranean climate. Build. Environ. 2014, 82, 467–480. [Google Scholar] [CrossRef]
- Rantala, J.; Leivo, V. Thermal and moisture parameters of a dry coarse-grained fill or drainage layer. Construct. Build. Mater. 2007, 21, 1726–1731. [Google Scholar] [CrossRef]
- Choi, S.; Krarti, M. Heat transfer for slab-on-grade floor with stepped ground. Energy Convers. Manag. 1998, 39, 691–701. [Google Scholar] [CrossRef]
- Wang, X.; Chen, D.; Ren, Z. Assessment of climate change impact on residential building heating and cooling energy requirement in Australia. Build. Environ. 2010, 45, 1663–1682. [Google Scholar] [CrossRef]
- Evola, G.; Margani, G.; Marletta, L. Cost-effective design solutions for low-rise residential Net ZEBs in Mediterranean climate. Energy Build. 2014, 68, 7–18. [Google Scholar] [CrossRef]
- Suárez, R.; Escandón, R.; López-Pérez, R.; León-Rodríguez, Á.L.; Klein, T.; Silvester, S. Impact of Climate Change: Environmental Assessment of Passive Solutions in a Single-Family Home in Southern Spain. Sustainability 2018, 10, 2914. [Google Scholar] [CrossRef]
- Rehman, H.U. Experimental performance evaluation of solid concrete and dry insulation materials for passive buildings in hot and humid climatic conditions. Appl. Energy 2017, 185, 1585–1594. [Google Scholar] [CrossRef]
- Principi, P.; Catalino, S.; Fioretti, R. The Contribution of the ITACA Protocol in the Control of the Environmental Quality in Residential Buildings and the Subsequent Contribution to the Adaptation to Climatic Change. Energy Procedia 2015, 78, 1823–1828. [Google Scholar] [CrossRef]
- Bribián, I.Z.; Capilla, A.V.; Usón, A.A. Life cycle assessment of building materials: Comparative analysis of energy and environmental impacts and evaluation of the eco-efficiency improvement potential. Build. Environ. 2011, 46, 1133–1140. [Google Scholar] [CrossRef]
- Alkaff, S.A.; Sim, S.C.; Efzan, M.E. A review of underground building towards thermal energy efficiency and sustainable development. Renew. Sustain. Energy Rev. 2016, 60, 692–713. [Google Scholar] [CrossRef]
- Hait, J.N. Passive Annual Heat Storage: Improving the Design of Earth Shelters; Rocky Mountain Research Centre: Fort Collins, CO, USA, 1983. [Google Scholar]
- Shad, R.; Khorrami, M.; Ghaemi, M. Developing an Iranian green building assessment tool using decision making methods and geographical information system: Case study in Mashhad city. Renew. Sustain. Energy Rev. 2017, 67, 324–340. [Google Scholar] [CrossRef]
- Koksalan, M.; Wallenius, J.; Zionts, S. An Early History of Multiple Criteria Decision Making. J. Multi-Crit. Decis. Anal. 2013, 20, 87–94. [Google Scholar] [CrossRef]
- D’Agostino, D.; Cuniberti, B.; Maschio, I. Criteria and structure of a harmonised data collection for NZEBs retrofit buildings in Europe. Energy Procedia 2017, 140, 170–181. [Google Scholar] [CrossRef]
- Pa, W.; Dainty, A.R.; Gibb, A.G. Establishing and weighting decision criteria for building system selection in housing construction. J. Construct. Eng. Manag. 2012, 138, 1239–1250. [Google Scholar]
- Nelms, C.; Russell, A.D.; Lence, B.J. Assessing the performance of sustainable technologies: A framework and its application. Build. Res. Inf. 2007, 35, 237–251. [Google Scholar] [CrossRef]
- D’Agostino, D.; Zangheri, P.; Catellazzi, L. Towards Nearly Zero Energy buildings (NZEBs) in Europe: A focus on retrofit in non-residential buildings. Energies 2017, 10, 117. [Google Scholar] [CrossRef]
- Dagana, Z.; Pan, W.; Goohew, S. A decision making system for selecting sustainable technologies for retail buildings. In Proceedings of the 2013 CIB World Building Congress, Energy and the Built Environment Proceedings, Brisbane, Australia, 5–9 May 2013; pp. 108–119. [Google Scholar]
- Konidari, P.; Mavrakis, D. A multi-criteria evaluation method for climate change mitigation policy instruments. Energy Policy 2007, 35, 6235–6257. [Google Scholar] [CrossRef]
- Seddiki, M.; Anouche, K.; Bennadji, A.; Boateng, P. A multi-criteria group decision-making method for the thermalrenovation of masonry buildings: The case of Algeria. Energy Build. 2016, 129, 471–483. [Google Scholar] [CrossRef]
- Medineckiene, M.; Zavadskas, E.K.; Björk, F.; Turskis, Z. Multi-criteria decision-making system for sustainable building assessment/certification. Arch. Civ. Mech. Eng. 2015, 15, 11–18. [Google Scholar] [CrossRef]
- Harkouss, F.; Fardoun, F.; Biwole, P.H. Multi-objective optimization methodology for net zero energy buildings. J. Build. Eng. 2018, 16, 57–71. [Google Scholar] [CrossRef]
- Attia, S.; Herde, A.D. Strategic Decision Making for Zero Energy Buildings in Hot Climates. Available online: https://orbi.uliege.be/bitstream/2268/167567/1/eurosun2010-0085-Attia.pdf (accessed on 1 November 2018).
- Wang, J.; Jing, Y.; Zhang, C.; Zhao, J. Review on multi-criteria decision analysis aid in sustainable energy decision-making. Renew. Sustain. Energy Rev. 2009, 13, 2263–2278. [Google Scholar] [CrossRef]
- Silva, A.S.; Silva Almeida, L.S.; Ghisi, E. Decision-making process for improving thermal and energy performance of residential buildings: A case study of constructive systems in Brazil. Energy Build. 2016, 128, 270–286. [Google Scholar] [CrossRef]
- Mastouri, H.; Benhamou, B.; Hamdi, H.; Mouyal, E. Thermal performance assessment of passive techniques integrated into a residential building in semi-arid climate. Energy Build. 2017, 143, 1–16. [Google Scholar] [CrossRef]
- Glavič, P.; Lukman, R. Review of sustainability terms and their definitions. J. Clean. Prod. 2007, 15, 1875–1885. [Google Scholar] [CrossRef]
- Zhou, C.C.; Yin, G.F.; Hu, X.B. Multi-objective optimization of material selection for sustainable products: Artificial neural networks and genetic algorithm approach. Mater. Des. 2009, 30, 1209–1215. [Google Scholar] [CrossRef]
- Mora, E.P. Life cycle, sustainability and the transcendent quality of building materials. Build. Environ. 2007, 42, 1329–1334. [Google Scholar] [CrossRef]
- Dammann, S.; Elle, M. Environmental indicators: Establishing a common language for green building. Build. Res. Inf. 2006, 34, 387–404. [Google Scholar] [CrossRef]
- Ljungberg, L.Y. Materials selection and design for development of sustainable products. Mater. Des. 2007, 28, 466–479. [Google Scholar] [CrossRef]
- Linee Guida per la Progettazione con i Protocolli di Sostenibilità LEED e ITACA-Versione 1.3-Gennaio. 2013. Available online: www.anit.it (accessed on 29 October 2018).
- D’Agostino, D.; Congedo, P.M. CFD modeling and moisture dynamics implications of ventilation scenarios in historical buildings. Build. Environ. 2014, 79, 181–193. [Google Scholar] [CrossRef]
- Congedo, P.M.; Baglivo, C.; Zacà, I.; D’Agostino, D.; Quarta, F.; Cannoletta, A.; Marti, A.; Ostuni, V. Energy retrofit and environmental sustainability improvement of a historical farmhouse in Southern Italy. Energy Procedia 2017, 133, 367–381. [Google Scholar] [CrossRef]
- European Standard UNI ISO 13786. Thermal Performance of Building Components—Dynamic Thermal Characteristics—Calculation Methods; Italian Unification Body: Milan, Italy, 2018.
- Baglivo, C.; Congedo, P.M.; Sassi, V. Numerical dataset of slab-on-ground floor for buildings in warm climate from a multi-criteria analysis. Data Brief 2018, 20, 269–276. [Google Scholar] [CrossRef] [PubMed]
- Baglivo, C.; Congedo, P.M.; Di Cataldo, M.; Coluccia, L.D.; D’Agostino, D. Envelope Design Optimization by Thermal Modeling of a Building in a Warm Climate. Energies 2017, 10, 1808. [Google Scholar] [CrossRef]


| Description | Equation | |
|---|---|---|
| Periodic penetration depth of a heat wave in a material (m). | (1) | |
| Ratio of the thickness of the layer to the penetration depth. | (2) | |
| Z11: temperature amplitude factor, i.e., the amplitude of the temperature variations on side 2 resulting from an amplitude of 1 K on side 1. | (3) | |
| Z12: amplitude of the temperature on side 2 when side 1 is subjected to a periodically varying density of heat flow rate with an amplitude of 1 W/m2. | (4) | |
| Z21: amplitude of the density of heat flow rate through side 2 resulting from a periodic variation of temperature on side 1 with an amplitude of 1 K. | (5) | |
| Thermal admittance: complex quantity defined as the complex amplitude of the density of heat flow rate through the surface of the component adjacent to zone m divided by the complex amplitude of the temperature in the same zone when the temperature on the other side is held constant. | (6) | |
| (7) | ||
| Decrement factor: ratio of the modulus of the periodic thermal transmittance to the steady-state thermal transmittance U. | (8) | |
| Periodic thermal transmittance: complex quantity defined as the complex amplitude of the density of heat flow rate through the surface of the component adjacent to zone m divided by the complex amplitude of the temperature in zone n when the temperature in zone m is held constant. | (9) | |
| Areal heat capacity: heat capacity divided by area of element (1 internal 2 external). | (10) | |
| (11) | ||
| Time shift: time lead (if positive). or time lag (if negative). where the argument evaluated in the range 0 to 2π. The time shift is a period of time between the maximum amplitude of a cause and the maximum amplitude of its effect. | (12) | |
| Heat transfer matrix: matrix relating the complex amplitudes of temperature and heat flow rate on one side of a component to the complex amplitudes of temperature and heat flow rate on the other side. | (13) |
| Construction Materials | Commercial Thicknesses mm | λ W/mK | C J/kgK | ρ kg/m3 |
|---|---|---|---|---|
| Bio-brick | 100; 140; 290 | 0.187 | 1112 | 1171 |
| Calcium silicate panels | 80; 100; 120; 160; 180; 200; 240; 260; 300 | 0.045 | 1000 | 107.5 |
| Cellular glass | 40; 60; 80; 100; 120; 140 | 0..55 | 850 | 120 |
| Cement mortar | 30 | 1.4 | 836 | 2000 |
| Coconut fiber | 20; 30; 40 | 0.043 | 1450 | 85 |
| Concrete | 30; 40; 50; 60; 70; 80; 90; 100 | 1.67 | 880 | 2200 |
| Concrete closed structure. expanded clay | 50 | 0.325 | 920 | 1000 |
| Cork panels expanded | 10; 20; 30; 40; 50; 60; 80; 100; 120; 140; 160 | 0.039 | 1900 | 120 |
| EPS 1 (Expanded polystyrene) | 20; 40; 50; 60; 80; 100; 120; 140; 160; 180; 200 | 0.032 | 1350 | 28 |
| EPS 2 | 20; 40; 50; 60; 80; 100; 120; 140; 160; 180; 200 | 0.033 | 1350 | 24 |
| EPS 3 | 30; 40; 50; 60; 80; 100; 120; 140; 160 | 0.034 | 1350 | 20 |
| EPS+graphite (Synthesized polystyrene foam with graphite) | 20; 30; 40; 50; 60; 80; 100; 120; 140; 160; 180; 200 | 0.003 | 1350 | 28 |
| Expanded clay | 50 | 0.09 | 1000 | 300 |
| Exfoliated vermiculite | 2 | 0.057 | 787 | 85 |
| Fiberglass | 40; 50; 60; 85; 100 | 0.032 | 1030 | 32 |
| Flax fiber | 40; 60; 80; 100 | 0.038 | 1410 | 30 |
| Granulated cellular glass | 15; 20; 25; 30; 40; 50 | 0.078 | 850 | 160 |
| Granules of expanded perlite | 5; 7; 10; 15; 20 | 0.045 | 837 | 92.5 |
| Gravel | 50; 75; 100; 150 | 1.2 | 1000 | 1700 |
| Hemp fibers | 30; 40; 50; 60; 80; 100; 120; 140; 160; 180; 200; 220; 240 | 0.03 | 2200 | 38 |
| Hydraulic lime plaster | 15 | 0.054 | 836 | 1150 |
| Hollow bricks 120/150*250*380 | 120; 150 | 0.08 | 850 | 1280 |
| Hollow bricks 160/200/250/300*250*380 | 160;200;250;300 | 0.08 | 1500 | 1280 |
| Kenaf fiber | 20; 30; 40; 50; 60 | 0.039 | 2050 | 80 |
| Lime and gypsum plaster | 15 | 0.007 | 837 | 1400 |
| Lightweight concrete | 400 | 0.444 | 920 | 1300 |
| Plaster mixed ready | 30 | 0.14 | 836 | 1000 |
| Pure gypsum plaster | 12.5 | 0.035 | 837 | 1200 |
| Rigid polyurethane foam panels 1 | 20; 30; 40; 50; 60; 70; 80; 90; 100; 120 | 0.023 | 1500 | 40 |
| Rigid polyurethane foam panels 2 | 30; 40; 50; 60 | 0.028 | 1500 | 40 |
| Rigid polyurethane foam panels 3 | 80; 100 | 0.026 | 1500 | 40 |
| Rigid polyurethane foam panels 4 | 30; 40; 50; 60; 70 | 0.028 | 1500 | 40 |
| Rigid polyurethane foam panels 5 | 20; 30; 40; 50; 60; 80; 100; 120; 140; 160 | 0.023 | 1500 | 40 |
| Rigid polyurethane foam panels 6 | 20; 30; 40; 50; 60; 70 | 0.028 | 1500 | 40 |
| Rigid polyurethane foam panels 7 | 80; 90; 100 | 0.026 | 1500 | 40 |
| Rigid polyurethane foam panels 8 | 120; 140; 160 | 0.025 | 1500 | 40 |
| Rigid polyurethane foam panels 9 | 20; 30; 40; 50; 60; 70; 80; 90; 100; 120; 140; 160 | 0.023 | 1500 | 40 |
| Rock wool 1 | 50; 60; 80; 100 | 0.035 | 1030 | 70 |
| Rock wool 2 | 60; 80; 100 | 0.035 | 1030 | 100 |
| Rock wool 3 | 30; 40; 50; 60; 80; 100 | 0.037 | 1030 | 140 |
| Rock wool 4 | 20 | 0.036 | 1030 | 100 |
| Sheep wool | 100; 150 | 0.037 | 1720 | 17.9 |
| Soft cellulose fibers panels | 30; 40; 50; 60; 80; 100; 120; 140; 160 | 0.039 | 2000 | 70 |
| Tuff | 110; 150; 180; 200; 250 | 0.336 | 1300 | 1215 |
| Wood fiber panels flexible | 40; 50; 60; 80; 100; 120; 140; 160; 180; 200; 220; 240 | 0.038 | 2100 | 50 |
| Wood fiber hardboard | 40; 60; 80; 100; 120; 140; 160; 180; 200 | 0.039 | 2100 | 160 |
| Wood wool | 25; 35; 50 | 0.08 | 1800 | 385 |
| XPS 1 (Extruded polystyrene foam) | 30; 40; 50; 60; 140; 160; 180; 200 | 0.034 | 1100 | 30 |
| XPS 2 | 80; 90; 100; 220; 240; 260; 280; 300 | 0.035 | 1100 | 30 |
| XPS 3 | 120; 220; 240; 260; 280; 300 | 0.036 | 1100 | 30 |
| XPS 4 | 200; 220 | 0.035 | 1100 | 30 |
| XPS 5 | 80; 100; 120; 240; 260; 280; 300 | 0.036 | 1100 | 30 |
| XPS 6 | 50; 60; 140; 150; 160; 180 | 0.034 | 1100 | 30 |
| XPS 7 | 200; 220 | 0.035 | 1100 | 30 |
| XPS 8 | 80; 100; 120; 240; 260; 280; 300 | 0.036 | 1100 | 30 |
| XPS 9 | 20; 30 | 0.032 | 1100 | 30 |
| XPS 10 | 25; 30 | 0.032 | 1100 | 30 |
| Material | Eco-Sustainable | Reused/Recycled | From Renewable Sources | Local Production (Heavy Materials) | Local Production (Materials for Finishing) |
|---|---|---|---|---|---|
| Calcium silicate panels | x | x | x | - | - |
| Bio-brick | x | x | x | - | - |
| Cellular glass | x | - | - | - | - |
| Cement mortar | - | - | - | - | x |
| Coconut fiber | x | x | x | x | - |
| Concrete | - | - | - | x | - |
| Cork panels expanded | x | x | x | x | - |
| EPS | - | - | - | x | - |
| Exfoliated vermiculite | x | x | x | - | - |
| Expanded clay | - | - | - | x | - |
| Fiberglass | x | x | - | - | - |
| Flax fiber | x | x | x | x | - |
| Granulated cellular glass | x | x | x | - | - |
| Granules of expanded perlite | x | x | x | - | - |
| Gravel | - | - | - | x | - |
| Hemp fibers | x | x | x | x | - |
| Hollow bricks | - | - | - | x | - |
| Hydraulic lime plaster | - | - | - | - | x |
| Kenaf fiber | x | x | x | x | - |
| Lime and gypsum plaster | - | - | - | - | x |
| Plaster mixed ready | - | - | - | - | x |
| Pure gypsum plaster | - | - | - | - | x |
| Rigid polyurethane foam panels | x | x | x | x | - |
| Rock wool | X | - | x | - | - |
| Sheep wool | x | x | x | x | - |
| Soft cellulose fibers panels | x | x | x | x | - |
| Tuff | - | - | - | x | - |
| Wood fiber panels | x | x | x | x | - |
| Wood wool | x | x | x | x | - |
| XPS | - | - | - | x | - |
| Insulating Building Materials | Structure of the Materials | Source of the Materials | |||||
|---|---|---|---|---|---|---|---|
| Fibrous | Cellular Mineral | Cellular Alveolar | Natural Vegetal | Natural Animal | Natural Mineral | Synthetic | |
| Bio-brick | x | - | - | x | - | - | - |
| Cellular glass | - | x | - | - | - | x | - |
| Coconut fiber | x | - | - | x | - | - | - |
| Cork panels expanded | x | - | - | x | - | - | - |
| EPS | - | - | x | - | - | - | x |
| Exfoliated vermiculite | - | - | x | - | - | x | - |
| Fiberglass | x | - | - | - | - | x | - |
| Flax fiber | x | - | - | x | - | - | - |
| Granulated cellular glass | - | x | - | - | - | x | - |
| Granules of expanded perlite | - | x | - | - | - | x | - |
| Hemp fibers | x | - | - | x | - | - | - |
| Kenaf fiber | x | - | - | x | - | - | - |
| Rigid polyurethane foam panels | - | - | x | - | - | - | x |
| Rock wool | x | - | - | - | - | x | - |
| Sheep wool | - | - | - | x | x | - | - |
| Soft cellulose fibers panels | x | - | - | x | - | - | - |
| Wood fiber hardboard | x | - | - | x | - | - | - |
| Wood fiber panels flexible | x | - | - | x | - | - | - |
| Wood wool | x | - | - | x | - | - | - |
| XPS | - | - | x | - | - | - | x |
| Construction Materials | Commercial Thicknesses (mm) | Cost (€/m2) | Cost (€/m3) |
|---|---|---|---|
| Bio-brick | 100; 140; 290 | 24.4; 32.94; 64.66 | - |
| Calcium silicate panels | 80; 100; 120; 160; 180; 200; 240; 260; 300 | 58.23; 62.14; 65.68; 73.55; 77.36; 81.16; 101.45; 111.59; 131.63 | - |
| Cellular glass | 40; 60; 80; 100; 120; 140 | 33.13 48.71 69.01 182.81 103.52 | - |
| Cement mortar | 30 | 75.38 | |
| Coconut fiber | 20; 30; 40 | 18.20; 21.00; 26.50 | - |
| Concrete | 30; 40; 50; 60; 70; 80; 90; 100 | - | 120 |
| Concrete closed structure. expanded clay | 50 | - | 189 |
| Cork panels expanded | 10; 20; 30; 40; 50; 60; 80; 100; 120; 140; 160 | 10.3; 13.3; 17.7; 23.60; 29.5; 35.4; 47.2; 59; 70.8; 82.6; 94.4 | - |
| EPS 1 | 20; 40; 50; 60; 80; 100; 120; 140; 160; 180; 200 | - | 155 |
| EPS 2 | 20; 40; 50; 60; 80; 100; 120; 140; 160; 180; 200 | - | 175 |
| EPS 3 | 30; 40; 50; 60; 80; 100; 120; 140; 160 | - | 120 |
| EPS+graphite | 20; 30; 40; 50; 60; 80; 100; 120; 140; 160; 180; 200 | - | 170 |
| Expanded clay | 50 | - | 148 |
| Exfoliated vermiculite | 2 | - | 165.29 |
| Fiberglass | 40; 50; 60; 85; 100 | 4.95; 6.24; 7.51; 10.59; 12.48 | - |
| Flax fiber | 40; 60; 80; 100 | - | 162.5 |
| Granulated cellular glass | 15; 20; 25; 30; 40; 50 | - | 202 |
| Granules of expanded perlite | 5; 7; 10; 15; 20 | - | 171 |
| Gravel | 50; 75; 100; 150 | - | 26.1 |
| Hemp fibers | 30; 40; 50; 60; 80; 100; 120; 140; 160; 180; 200; 220; 240 | 4.5; 5.75; 7.15; 8.55; 9.9; 11.75; 13.25; 15.35; 17.65; 19.8; 22; 24.2; 26.25 | - |
| Hydraulic lime plaster | 15 | - | 112.4 |
| Hollow bricks 120/150/160 × 250 × 380 | 120; 150; 160 | 5.27 | - |
| Hollow bricks 200 × 250 × 380 | 200 | 5.45 | |
| Hollow bricks 250 × 250 × 380 | 250 | 6.64 | - |
| Hollow bricks 300 × 250 × 380 | 300 | 11.52 | - |
| Kenaf fiber | 20; 30; 40; 50; 60 | 5.10; 7.65; 10.20; 12.70; 15.30 | - |
| Lime and gypsum plaster | 15 | 19.72 | - |
| Lightweight concrete | 400 | - | 182 |
| Plaster mixed ready | 30 | - | 182 |
| Pure gypsum plaster | 12.5 | 18.48 | |
| Rigid polyurethane foam panels 1 | 20; 30; 40; 50; 60; 70; 80; 90; 100; 120 | 7.2; 9.2; 11.3; 13.2; 15.15; 17.9; 19.7; 22; 24.1; 29.35 | - |
| Rigid polyurethane foam panels 2 | 30; 40; 50; 60 | 9.1; 11.3; 13.4; 15.55 | - |
| Rigid polyurethane foam panels 3 | 80; 100 | 20.15; 24.6 | - |
| Rigid polyurethane foam panels 4 | 30; 40; 50; 60; 70 | 10.1; 12.3; 14.3; 16.3; 19.4 | - |
| Rigid polyurethane foam panels 5 | 20; 30; 40; 50; 60; 80; 100; 120; 140; 160 | 9.5; 11.7; 14.1; 16.55; 18.6; 22.40; 26.9; 31.35; 36.2; 41.70 | - |
| Rigid polyurethane foam panels 6 | 20; 30; 40; 50; 60; 70 | 7.3; 9.15; 11.3; 13.25; 15.4; 18.3 | - |
| Rigid polyurethane foam panels 7 | 80; 90; 100 | 28.95; 31; 33.40 | - |
| Rigid polyurethane foam panels 8 | 120; 140; 160 | 38.15; 42.7; 47.65 | - |
| Rigid polyurethane foam panels 9 | 20; 30; 40; 50; 60; 70; 80; 90; 100; 120; 140; 160 | 7.4; 9.4; 11.5; 13.7; 15.5; 18.5; 20.2; 22.5; 2.8; 29.5; 34.5; 40 | - |
| Rock wool 1 | 50; 60; 80; 100 | 9.2; 10.59; 14.14; 17.65 | - |
| Rock wool 2 | 60; 80; 100 | 40.87; 48.43; 56.95 | - |
| Rock wool 3 | 30; 40; 50; 60; 80; 100 | 7.23; 9.63; 12.05; 14.46; 19.27; 24.10 | - |
| Rock wool 4 | 20 | 4.01 | - |
| Sheep wool | 100; 150 | 4.95; 6.24; 7.51; 10.59; 12.48 | - |
| Soft cellulose fibers panels | 30; 40; 50; 60; 80; 100; 120; 140; 160 | 7.5; 9.7; 12.15; 14.55; 18.45; 21.05; 25.2; 29.45; 33.7 | - |
| Tuff | 110; 150; 180; 200; 250 | 15.94; 16.9; 31.5; 18.58; 19.63 | - |
| Wood fiber panels flexible | 40; 50; 60; 80; 100; 120; 140; 160; 180; 200; 220; 240 | 4.17; 5.24; 6.26; 8.35; 10.43; 12.52; 14.69; 16.69; 18.95; 20.87; 23.12; 25.04 | - |
| Wood fiber hardboard | 40; 60; 80; 100; 120; 140; 160; 180; 200 | 5.20; 7.79; 10.39; 12.99; 15.59; 18.18; 20.78; 23.38; 25.98 | - |
| Wood wool | 25; 35; 50 | 18.6; 23.1; 31.9 | - |
| XPS 1 | 30; 40; 50; 60; 140; 160; 180; 200 | - | 90 |
| XPS 2 | 80; 90; 100; 220; 240; 260; 280; 300 | - | 90 |
| XPS 3 | 120; 220; 240; 260; 280; 300 | - | 90 |
| XPS 4 | 200; 220 | - | 150 |
| XPS 5 | 80; 100; 120; 240; 260; 280; 300 | - | 150 |
| XPS 6 | 50; 60; 140; 150; 160; 180 | - | 150 |
| XPS 7 | 200; 220 | - | 150 |
| XPS 8 | 80; 100; 120; 240; 260; 280; 300 | - | 150 |
| XPS 9 | 20; 30 | - | 93 |
| XPS 10 | 25; 30 | - | 98 |
| Output | Objectives | Constraints |
|---|---|---|
| fd | Minimized | - |
| Δt | Maximized | <20 h |
| Y12 | Minimized | <0.18 W/m2 K |
| κ1 | Maximized | - |
| U | - | <0.38 W/m2 K |
| d | - | <0.70 m |
| Y11 | Maximized | - |
| Y22 | Maximized | - |
| % ITACA | Maximized | - |
| Cost | Minimized | - |
| Variables | L1 | L2 | L3 | L4 | L5 | k2 | k1 | d | U | Y12 | Y22 | Y11 | fd | Ms | % ITACA | Cost €/m2 | ∆t |
|---|---|---|---|---|---|---|---|---|---|---|---|---|---|---|---|---|---|
| L1 | 1.000 | −0.07 | −0.041 | −0.013 | −0.113 | −0.204 | 0.734 | −0.023 | 0.080 | 0.128 | −0.204 | 0.734 | 0.119 | 0.152 | −0.222 | 0.167 | −0.0097 |
| L2 | 1.000 | −0.078 | −0.024 | 0.005 | 0.018 | −0.034 | 0.005 | 0.074 | −0.048 | 0.018 | −0.039 | −0.061 | 0.115 | −0.134 | 0.052 | 0.012 | |
| L3 | 1.000 | −0.081 | −0.020 | −0.021 | −0.050 | −0.008 | 0.081 | −0.193 | −0.021 | −0.051 | −0.200 | 0.189 | −0.120 | 0.038 | −0.054 | ||
| L4 | 1.000 | −0.070 | −0.058 | 0.011 | 0.000 | 0.088 | −0.096 | −0.058 | 0.011 | −0.097 | 0.166 | −0.128 | 0.027 | −0.007 | |||
| L5 | 1.000 | 0.668 | −0.183 | 0.092 | 0.048 | 0.023 | 0.668 | −0.183 | 0.042 | 0.274 | −0.311 | 0.123 | −0.128 | ||||
| k2 | 1.000 | −0.300 | 0.063 | 0.151 | 0.092 | 1.000 | −0.300 | 0.064 | 0.316 | −0.115 | 0.020 | −0.157 | |||||
| k1 | 1.000 | −0.067 | 0.124 | 0.162 | −0.300 | 1.000 | 0.116 | 0.184 | −0.158 | 0.123 | −0.096 | ||||||
| d | 1.000 | −0.519 | −0.377 | 0.063 | −0.066 | −0.118 | 0.215 | −0.072 | 0.0357 | −0.107 | |||||||
| U | 1.000 | 0.068 | 0.151 | 0.124 | −0.257 | 0.439 | 0.007 | −0.326 | −0.096 | ||||||||
| Y12 | 1.000 | 0.092 | 0.161 | 0.901 | −0.478 | −0.023 | 0.077 | 0.170 | |||||||||
| Y22 | 1.000 | −0.300 | 0.064 | 0.316 | −0.115 | 0.020 | −0.157 | ||||||||||
| Y11 | 1.000 | 0.116 | 0.184 | −0.158 | 0.123 | −0.095 | |||||||||||
| fd | 1.000 | −0.561 | −0.078 | 0.222 | 0.153 | ||||||||||||
| Ms | 1.000 | −0.203 | −0.116 | −0.367 | |||||||||||||
| % ITACA | 1.000 | −0.115 | 0.079 | ||||||||||||||
| Cost €/m2 | 1.000 | 0.116 | |||||||||||||||
| ∆t | 1.000 |
| Layer | Materials | U W/m2 K | Y12 W/m2 K | Y22 W/m2 K | Y11 W/m2 K | fd | Ms kg/m2 | ∆t h | κ1 kJ/m2 K | κ2 kJ/m2 K | d m | % ITACA | Cost €/m2 |
|---|---|---|---|---|---|---|---|---|---|---|---|---|---|
| 5 | Concrete (80 mm) | 0.081 | 0.01 | 13.44 | 4.81 | 0.148 | 408.88 | 15 h20’ | 66.17 | 184.70 | 0.51 | 77.7 | 84.3 |
| 4 | Hemp fibers (160 mm) | ||||||||||||
| 3 | Rigid polyurethane foam panels 8 (140 mm) | ||||||||||||
| 2 | Rigid polyurethane foam panels 6 (30 mm) | ||||||||||||
| M | Water protection membrane | ||||||||||||
| 1 | Concrete (100 mm) | ||||||||||||
| 5 | Concrete (90 mm) | 0.122 | 0.01 | 11.08 | 4.85 | 0.081 | 394.88 | 15 h19’ | 66.71 | 152.31 | 0.41 | 77.7 | 41.7 |
| 4 | EPS1 (60 mm) | ||||||||||||
| 3 | Wood fiber hardboard (100 mm) | ||||||||||||
| 2 | Rigid polyurethane foam panels 9 (80 mm) | ||||||||||||
| M | Water protection membrane | ||||||||||||
| 1 | Concrete (80 mm) | ||||||||||||
| 5 | Concrete (90 mm) | 0.229 | 0.03 | 9.82 | 4.86 | 0.139 | 502.4 | 11 h28’ | 67.28 | 135.25 | 0.44 | 55.5 | 87.4 |
| 4 | Rigid polyurethane foam panels 7 (100 mm) | ||||||||||||
| 3 | Concrete (70 mm) | ||||||||||||
| 2 | Cellular glass (120 mm) | ||||||||||||
| M | Water protection membrane | ||||||||||||
| 1 | Concrete (60 mm) | ||||||||||||
| 5 | Concrete (80 mm) | 0.082 | 0.001 | 4.42 | 4.77 | 0.048 | 276 | 18 h44’ | 65.54 | 60.66 | 0.55 | 77.7 | 46.4 |
| 4 | Wood fiber hardboard (160 mm) | ||||||||||||
| 3 | XPS 2 (80 mm) | ||||||||||||
| 2 | XPS 5 (200 mm) | ||||||||||||
| M | Water protection membrane | ||||||||||||
| 1 | Concrete (30 mm) |
| Layer | Materials | U W/m2 K | Y12 W/m2 K | Y22 W/m2 K | Y11 W/m2 K | fd | Ms kg/m2 | ∆t h | κ1 kJ/m2 K | κ2 kJ/m2 K | d m | % ITACA | Cost €/m2 |
|---|---|---|---|---|---|---|---|---|---|---|---|---|---|
| 5 | Concrete (70 mm) | 0.380 | 0.17 | 8.48 | 4.73 | 0.439 | 302.33 | 6 h37’ | 66.37 | 118.85 | 0.235 | 77.7 | 46.81 |
| 4 | Wood wool (25 mm) | ||||||||||||
| 3 | Granulated cellular glass (30 mm) | ||||||||||||
| 2 | Hemp fibers (50 mm) | ||||||||||||
| M | Water protection membrane | ||||||||||||
| 1 | Concrete (60 mm) | ||||||||||||
| 5 | Concrete (100 mm) | 0.380 | 0.11 | 16.45 | 4.87 | 0.276 | 538.4 | 10 h13’ | 68.37 | 227.46 | 0.33 | 77.7 | 38.8 |
| 4 | Kenaf fiber (50 mm) | ||||||||||||
| 3 | Wood fiber hardboard (40 mm) | ||||||||||||
| M | Water protection membrane | ||||||||||||
| 2 | Concrete (80 mm) | ||||||||||||
| 1 | Concrete (60 mm) | ||||||||||||
| 5 | Concrete (80 mm) | 0.380 | 0.16 | 12.41 | 4.78 | 0.424 | 382.9 | 7 h05’ | 67.19 | 172.94 | 0.27 | 77.7 | 34.4 |
| 4 | XPS 10 (30 mm) | ||||||||||||
| 3 | Kenaf fiber (40 mm) | ||||||||||||
| 2 | Granulated cellular glass (30 mm) | ||||||||||||
| M | Water protection membrane | ||||||||||||
| 1 | Concrete (90 mm) |
| Layer | Materials | U W/m2 K | Y12 W/m2 K | Y22 W/m2 K | Y11 W/m2 K | fd | Ms kg/m2 | ∆t h | κ1 kJ/m2 K | κ2 kJ/m2 K | d m | % ITACA | Cost €/m2 |
|---|---|---|---|---|---|---|---|---|---|---|---|---|---|
| 5 | Concrete (80 mm) | 0.380 | 0.15 | 13.53 | 4.78 | 0.384 | 419.30 | 7 h38’ | 67.29 | 188.03 | 0.27 | 55.5 | 37.3 |
| 4 | Rock wool 1 (50 mm) | ||||||||||||
| 3 | Rigid polyurethane foam panels 5 (20 mm) | ||||||||||||
| M | Water protection membrane | ||||||||||||
| 2 | Concrete (70 mm) | ||||||||||||
| 1 | Gravel (50 mm) | ||||||||||||
| 5 | Concrete (100 mm) | 0.380 | 0.08 | 13.55 | 4.86 | 0.205 | 532.60 | 11 h51’ | 67.92 | 187.08 | 0.37 | 68.82 | 39.36 |
| 4 | Wood fiber hardboard (40 mm) | ||||||||||||
| 3 | Rigid polyurethane foam panels 2 (30 mm) | ||||||||||||
| M | Water protection membrane | ||||||||||||
| 2 | Concrete closed structure, expanded clay (50 mm) | ||||||||||||
| 1 | Gravel (150 mm) | ||||||||||||
| 5 | Concrete (80 mm) | 0.380 | 0.16 | 10.19 | 4.78 | 0.425 | 333.00 | 6 h59’ | 67.16 | 142.43 | 0.23 | 77.7 | 31.5 |
| 4 | Rigid polyurethane foam panels 1 (30 mm) | ||||||||||||
| 3 | Cork panels expanded (40 mm) | ||||||||||||
| M | Water protection membrane | ||||||||||||
| 2 | Concrete (30 mm) | ||||||||||||
| 1 | Gravel (50 mm) |
| Layer | Materials | U W/m2 K | Y12 W/m2 K | Y22 W/m2 K | Y11 W/m2 K | fd | Ms kg/m2 | ∆t h | κ1 kJ/m2 K | κ2 kJ/m2 K | d m | % ITACA | Cost €/m2 |
|---|---|---|---|---|---|---|---|---|---|---|---|---|---|
| 5 | Concrete (50 mm) | 0.375 | 0.10 | 8.05 | 4.25 | 0.272 | 332.40 | 8 h36’ | 59.75 | 112.06 | 0.68 | 77.70 | 36.99 |
| 4 | Flax fiber (80 mm) | ||||||||||||
| M | Water protection membrane | ||||||||||||
| 3 | Concrete (50 mm) | ||||||||||||
| 2 | Air-crawl space (450 mm) | ||||||||||||
| 1 | Concrete (50 mm) | ||||||||||||
| 5 | Concrete (30 mm) | 0.369 | 0.16 | 6.67 | 3.47 | 0.424 | 216.80 | 8 h59’ | 49.88 | 95.02 | 0.46 | 77.70 | 28.85 |
| 4 | Wood fiber hardboard (80 mm) | ||||||||||||
| M | Water protection membrane | ||||||||||||
| 3 | Concrete closed structure. expanded clay (50 mm) | ||||||||||||
| 2 | Air—crawl space (260 mm) | ||||||||||||
| 1 | Concrete (40 mm) | ||||||||||||
| 5 | Concrete (40 mm) | 0.373 | 0.18 | 9.31 | 3.88 | 0.473 | 272.28 | 7 h31’ | 55.56 | 130.38 | 0.47 | 77.70 | 36.00 |
| 4 | Hemp fibers (60 mm) | ||||||||||||
| M | Water protection membrane | ||||||||||||
| 3 | Concrete closed structure. expanded clay (50 mm) | ||||||||||||
| 2 | Air—crawl space (260 mm) | ||||||||||||
| 1 | Concrete (60 mm) | ||||||||||||
| 5 | Concrete (90 mm) | 0.363 | 0.09 | 12.64 | 4.84 | 0.234 | 464.40 | 9 h55’ | 67.68 | 174.78 | 0.36 | 11.10 | 40.20 |
| 4 | Rigid polyurethane foam panels 2 (60 mm) | ||||||||||||
| M | Water protection membrane | ||||||||||||
| 3 | Concrete (30 mm) | ||||||||||||
| 2 | Air—crawl space (90 mm) | ||||||||||||
| 1 | Concrete (90 mm) |
© 2018 by the authors. Licensee MDPI, Basel, Switzerland. This article is an open access article distributed under the terms and conditions of the Creative Commons Attribution (CC BY) license (http://creativecommons.org/licenses/by/4.0/).
Share and Cite
Baglivo, C.; Congedo, P.M.; D’Agostino, D. Multi-Objective Analysis for the Optimization of a High Performance Slab-on- Ground Floor in a Warm Climate. Energies 2018, 11, 2988. https://doi.org/10.3390/en11112988
Baglivo C, Congedo PM, D’Agostino D. Multi-Objective Analysis for the Optimization of a High Performance Slab-on- Ground Floor in a Warm Climate. Energies. 2018; 11(11):2988. https://doi.org/10.3390/en11112988
Chicago/Turabian StyleBaglivo, Cristina, Paolo Maria Congedo, and Delia D’Agostino. 2018. "Multi-Objective Analysis for the Optimization of a High Performance Slab-on- Ground Floor in a Warm Climate" Energies 11, no. 11: 2988. https://doi.org/10.3390/en11112988
APA StyleBaglivo, C., Congedo, P. M., & D’Agostino, D. (2018). Multi-Objective Analysis for the Optimization of a High Performance Slab-on- Ground Floor in a Warm Climate. Energies, 11(11), 2988. https://doi.org/10.3390/en11112988