Article

Experimental and Theoretical Analysis of a Linear Focus CPV/T System for Cogeneration Purposes

Department of Industrial Engineering, University of Salerno, Via Giovanni Paolo II, 132, 84084 Fisciano (Salerno), Italy
Energies 2018, 11(11), 2960; https://doi.org/10.3390/en11112960
Submission received: 10 October 2018 / Revised: 23 October 2018 / Accepted: 25 October 2018 / Published: 31 October 2018

Abstract

:
The knowledge of the actual energy performances of a concentrating photovoltaic and thermal (CPV/T) system with a linear focus optics, allows to evaluate the possibility of adopting this type of system for cogeneration purposes. Hence, the main aim of this paper is the design, realization, setting and modeling of a linear focus CPV/T system in the high concentration field. An experimental linear focus CPV/T plant was created in order to determine its electrical and thermal performance under different working conditions in terms of environment temperature, sunny and cloudy conditions, focal length, etc. Moreover, a theoretical model of the linear focus CPV/T system was also studied. This model evaluates the temperatures of the working fluid that flows in the cooling circuit of the CPV/T system under several operating conditions. The temperatures of the triple junction (TJ) cells, experimentally evaluated referring to different solar radiation and atmospheric conditions, were considered as the input data for the model. The values of the fluid temperature, theoretically and experimentally determined, were thus compared with good agreement. The electrical production of the CPV/T system depends generally on the TJ cell characteristics and the concentration factor, while the thermal production is above all linked to the system configuration and the direct normal irradiance (DNI) values. Hence, in this paper the electric power obtained by the linear-focus CPV/T system was evaluated referring to the cogeneration applications, and it was verified if the TJ cell and the cooling fluid reach adequate temperature levels in this type of system, in order to match the electrical and the thermal loads of a user.

1. Introduction

Solar systems [1] have lately been used for different types of applications [2]. For example, concentrated solar power systems are being widely used [3]. In particular, concentrating photovoltaic (CPV) systems use optics to concentrate the solar radiation on triple-junction (TJ) cells, causing high electrical performance, but also higher temperatures of the TJ cell. In addition to electric energy, concentrating photovoltaic and thermal (CPV/T) systems allow also to obtain thermal energy [4]. Hence, the CPV/T systems present a great potential for use for cogeneration purposes in residential and industrial applications, also allowing a decrease of the environmental impact in terms of CO2 emissions [5]. For example, in [6] a concentrating photovoltaic and thermal system was used as a cogenerator which adopts nanofluids for cooling and heating. The authors in [7] have determined the optimum concentration factor value able to provide a fluid temperature that matches the thermal loads in several working conditions, reducing the system size of the CPV/T. In [8], a concentrating system that adopts evacuated tubes was analyzed to determine the thermal energy production in addition to the electrical production. A point-focus CPV/T system, able to obtain both electrical and thermal energy, was studied in [9]. As a consequence, the CPV/T systems allow the combined production of electrical and thermal energy, reducing the unit costs and increasing the total system efficiency [10].
Different concentrating systems are mentioned above, but the literature does not contain a standard configuration of a CPV/T system able to match the energy loads of each typology of user. Rather, their configuration depends on different aspects, such as concentration factor, type of optics, triple-junction (TJ) cell intrinsic characteristics, cell TJ temperature, cooling system, tracking system, user, etc. Moreover, the direct normal irradiance (DNI), for which the average values in the world are reported in Figure 1 [11], plays a key role in the use of CPV/T systems. In [12], an experimental study of a CPV system modifying the concentration, is presented. A dynamic model of a CPV/T system under different concentration conditions is presented in [13], using the finite element method. The model of a linear focus CPV/T system with active cooling is analyzed in [14]. Moreover, the evaluation of the thermal energy recovered by a CPV/T system depends on the TJ solar cell temperature values, which are not always easy to determine under each kind of working condition [15] and which are dependent on the concentration factor [16]. The cell temperature represents the input on which the cooling fluid temperature depends.
As a consequence, in the literature there are experimental works that describe parabolic trough concentrators above all in the low concentration field [17]. For the high concentration field there are above all theoretical studies, with few experimental works that also evaluate the potential from the cogeneration point of view of a linear focus CPV/T system. Hence, the main purpose of this paper is to design, realize, set and model a linear focus CPV/T system in the high concentration field. In particular, a set of parameters was tested referring to the experimental linear focus CPV/T system with a high concentration, in order to also analyze its potential from the thermal point of view. The experimental system has allowed to vary the focal length in order to improve the optics configuration and to analyze the performance of the solar cell. A TJ solar cell was adopted, the characteristics of which have been deeply analyzed in the high concentration field, although often silicon cells or double junction cells are used. Hence, the experimental analysis was focused on the setup of the main parameters of the linear focus CPV/T system, in order to improve its performance. In particular, the concentration level, the TJ cell electrical power, the TJ solar cell and the cooling fluid temperatures were monitored to analyze the CPV/T system’s response under different operating conditions. The linear focus CPV/T system was also theoretically studied in order to compare the cooling fluid temperatures experimentally obtained with the theoretical model results.
Finally, the electrical power values of the TJ solar cell were monitored under different working conditions in terms of DNI. Moreover, it was verified whether the adequate temperature levels of the cell and cooling fluid were reached in the linear focus CPV/T system under high concentration in order to match not only the electrical loads, but also the thermal needs of a user.

2. Materials and Methods

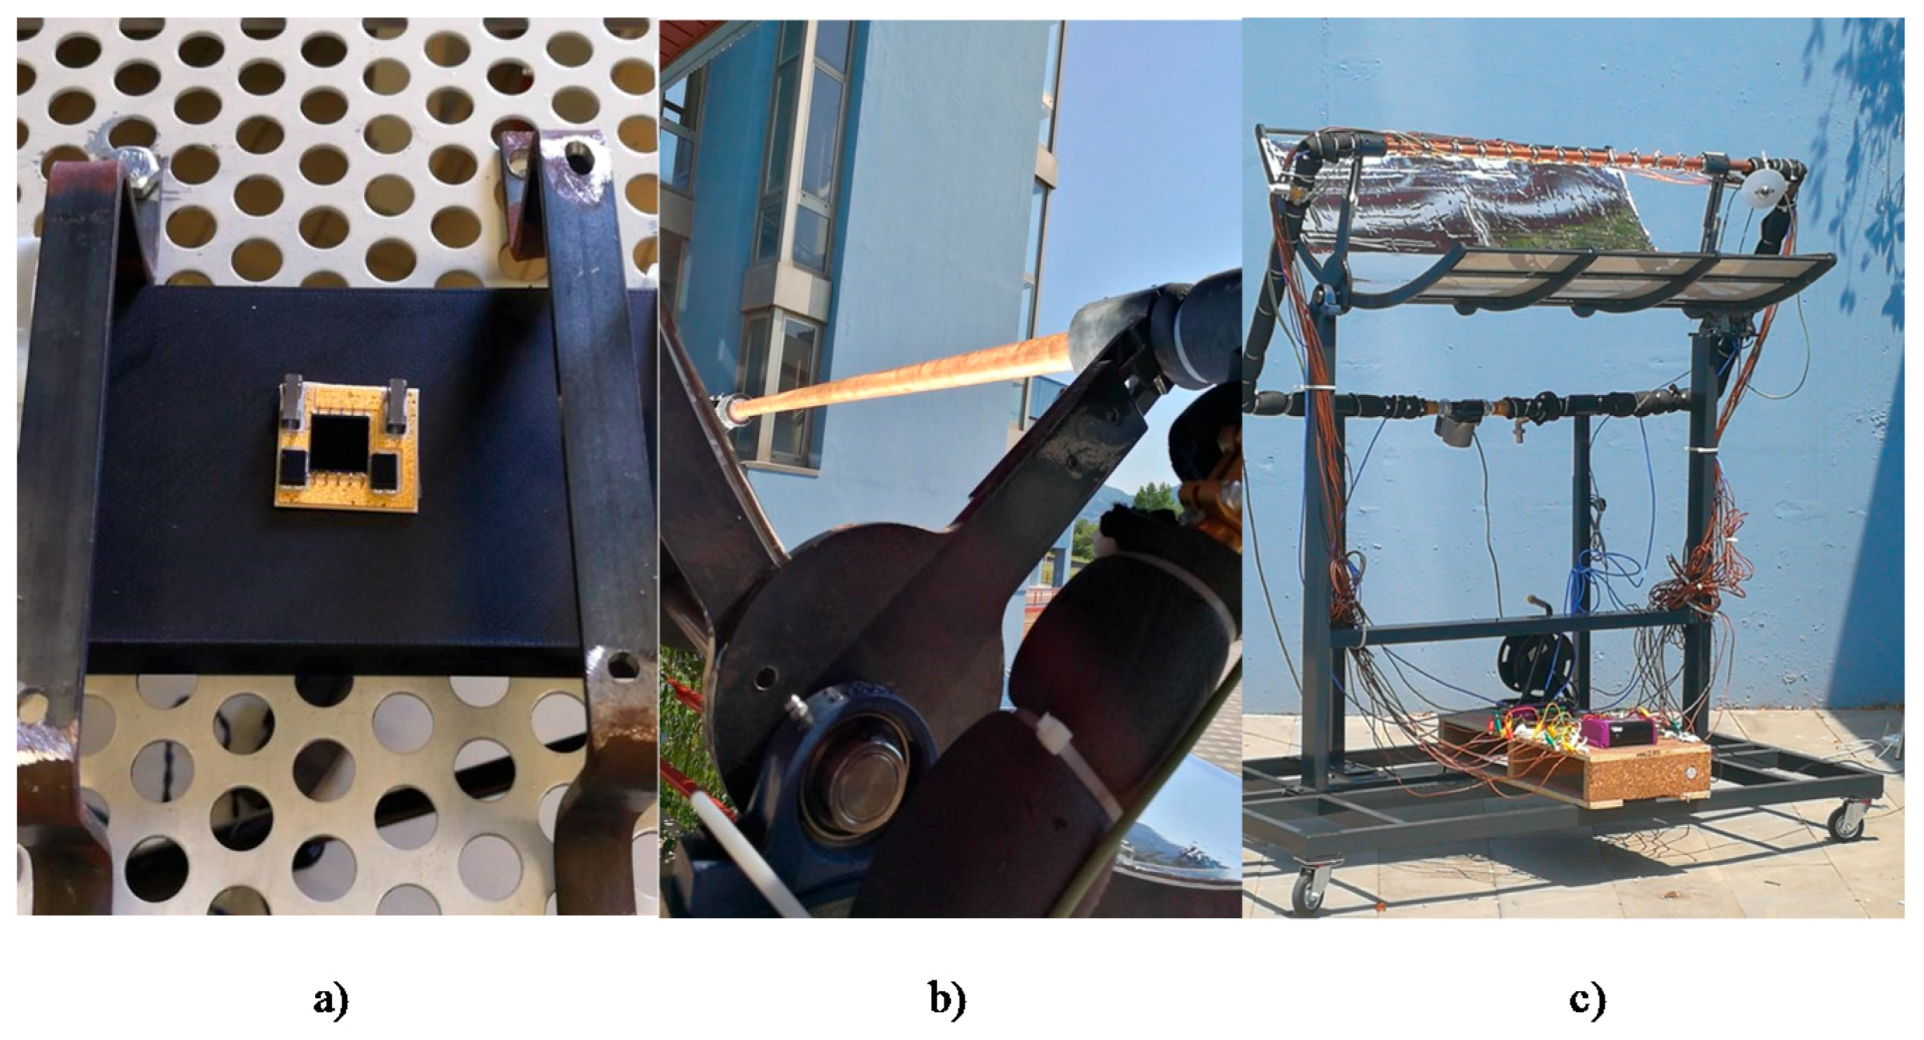
2.1. CPV/T System Description

A linear focus CPV/T system generally adopts refractive optics or reflective optics consisting of a parabolic trough concentrator. The experimental CPV/T system presented in this paper, shown in Figure 2 and realized in the Laboratory of Applied Thermodynamics of the University of Salerno (Italy), consists of a linear focus configuration, with parabolic optics and triple-junction (TJ) solar cells (InGaP/GaAs/Ge) with an area of 1.0 × 1.0 cm2. The TJ cell characteristics are reported in Table 1.
The concentration of the linear focus system took place along a tube with the TJ cells located on the surface and where the refrigerant fluid flows. In particular, thirty cells are present along a line of 1.2 m. The experimental system also presents a tracking system able to converge the maximum direct solar radiation on the cells. The TJ cells were placed at a variable distance from the optics and the focal length is a variable in the experimental analysis. The experimental system allows to move the parabolic optics on a vertical axis in order to modify its height with respect to the cells, and then the incident radiation on the solar cells can be modified varying the concentration factor value. The main parameters that characterize a parabolic optics are its focal length (f), on which depends the size of the focused image, and the truncation value (a), on which depends the amount of energy that affects the tube. Hence, the concentration factor will be proportional to the ratio of the two parameters (f/a). The input data considered in the sizing of the CPV/T system were: C equal to 107x, and the tube length and diameter respectively equal to 1.2 m and 2.8 cm. By referring to these data, it was possible to determine the parameters and the characteristic dimensions of the parabola necessary to achieve the optimal concentration factor. The maximum value of C obtained during the operation hours of the CPV/T system, which corresponds to the proper focal length, was about 90x.
A mobile structure was necessary in order to support the optics and to move the CPV/T system either through rotation with its base on a plane, or through rotation around the axis of the tree on a plane orthogonal to the first, to enable the tracking system and to always obtain the maximum concentration factor during the day. The degrees of freedom of the system allow its movement in the north–south and east–west directions, and the change of the focal length (Figure 3). In particular, if a plane parallel to the cell area and another tangent to the vertex of the parabola constituting the concentrator are considered, it is necessary that such planes remain parallel during the movement of the system. This is because the rotation of the shaft, which allows the concentrator to chase the sun, does not coincide with the rotation of the tube where the fluid flows, but the rotations tend to be opposite (Figure 3). Finally, the system thus designed has allowed to modify parameters such as the focal distance and the positioning of the CPV/T system.
Some PT100 thermo-resistances, with an accuracy of ±0.2 K, were adopted to measure the fluid, cell and environment temperatures. The electrical energy production of the CPV/T system was also evaluated through voltage and current measurement. A pyrheliometer, whose typology is reported in [19] and with an accuracy of 2%, was adopted in order to measure the solar radiation. Generally, all the measurements of current and voltage while the CPV/T system was working, were monitored by means of a data logger (data tracker series DT80, accuracy 2%). The sampling rate for the energy analysis was 15 s.

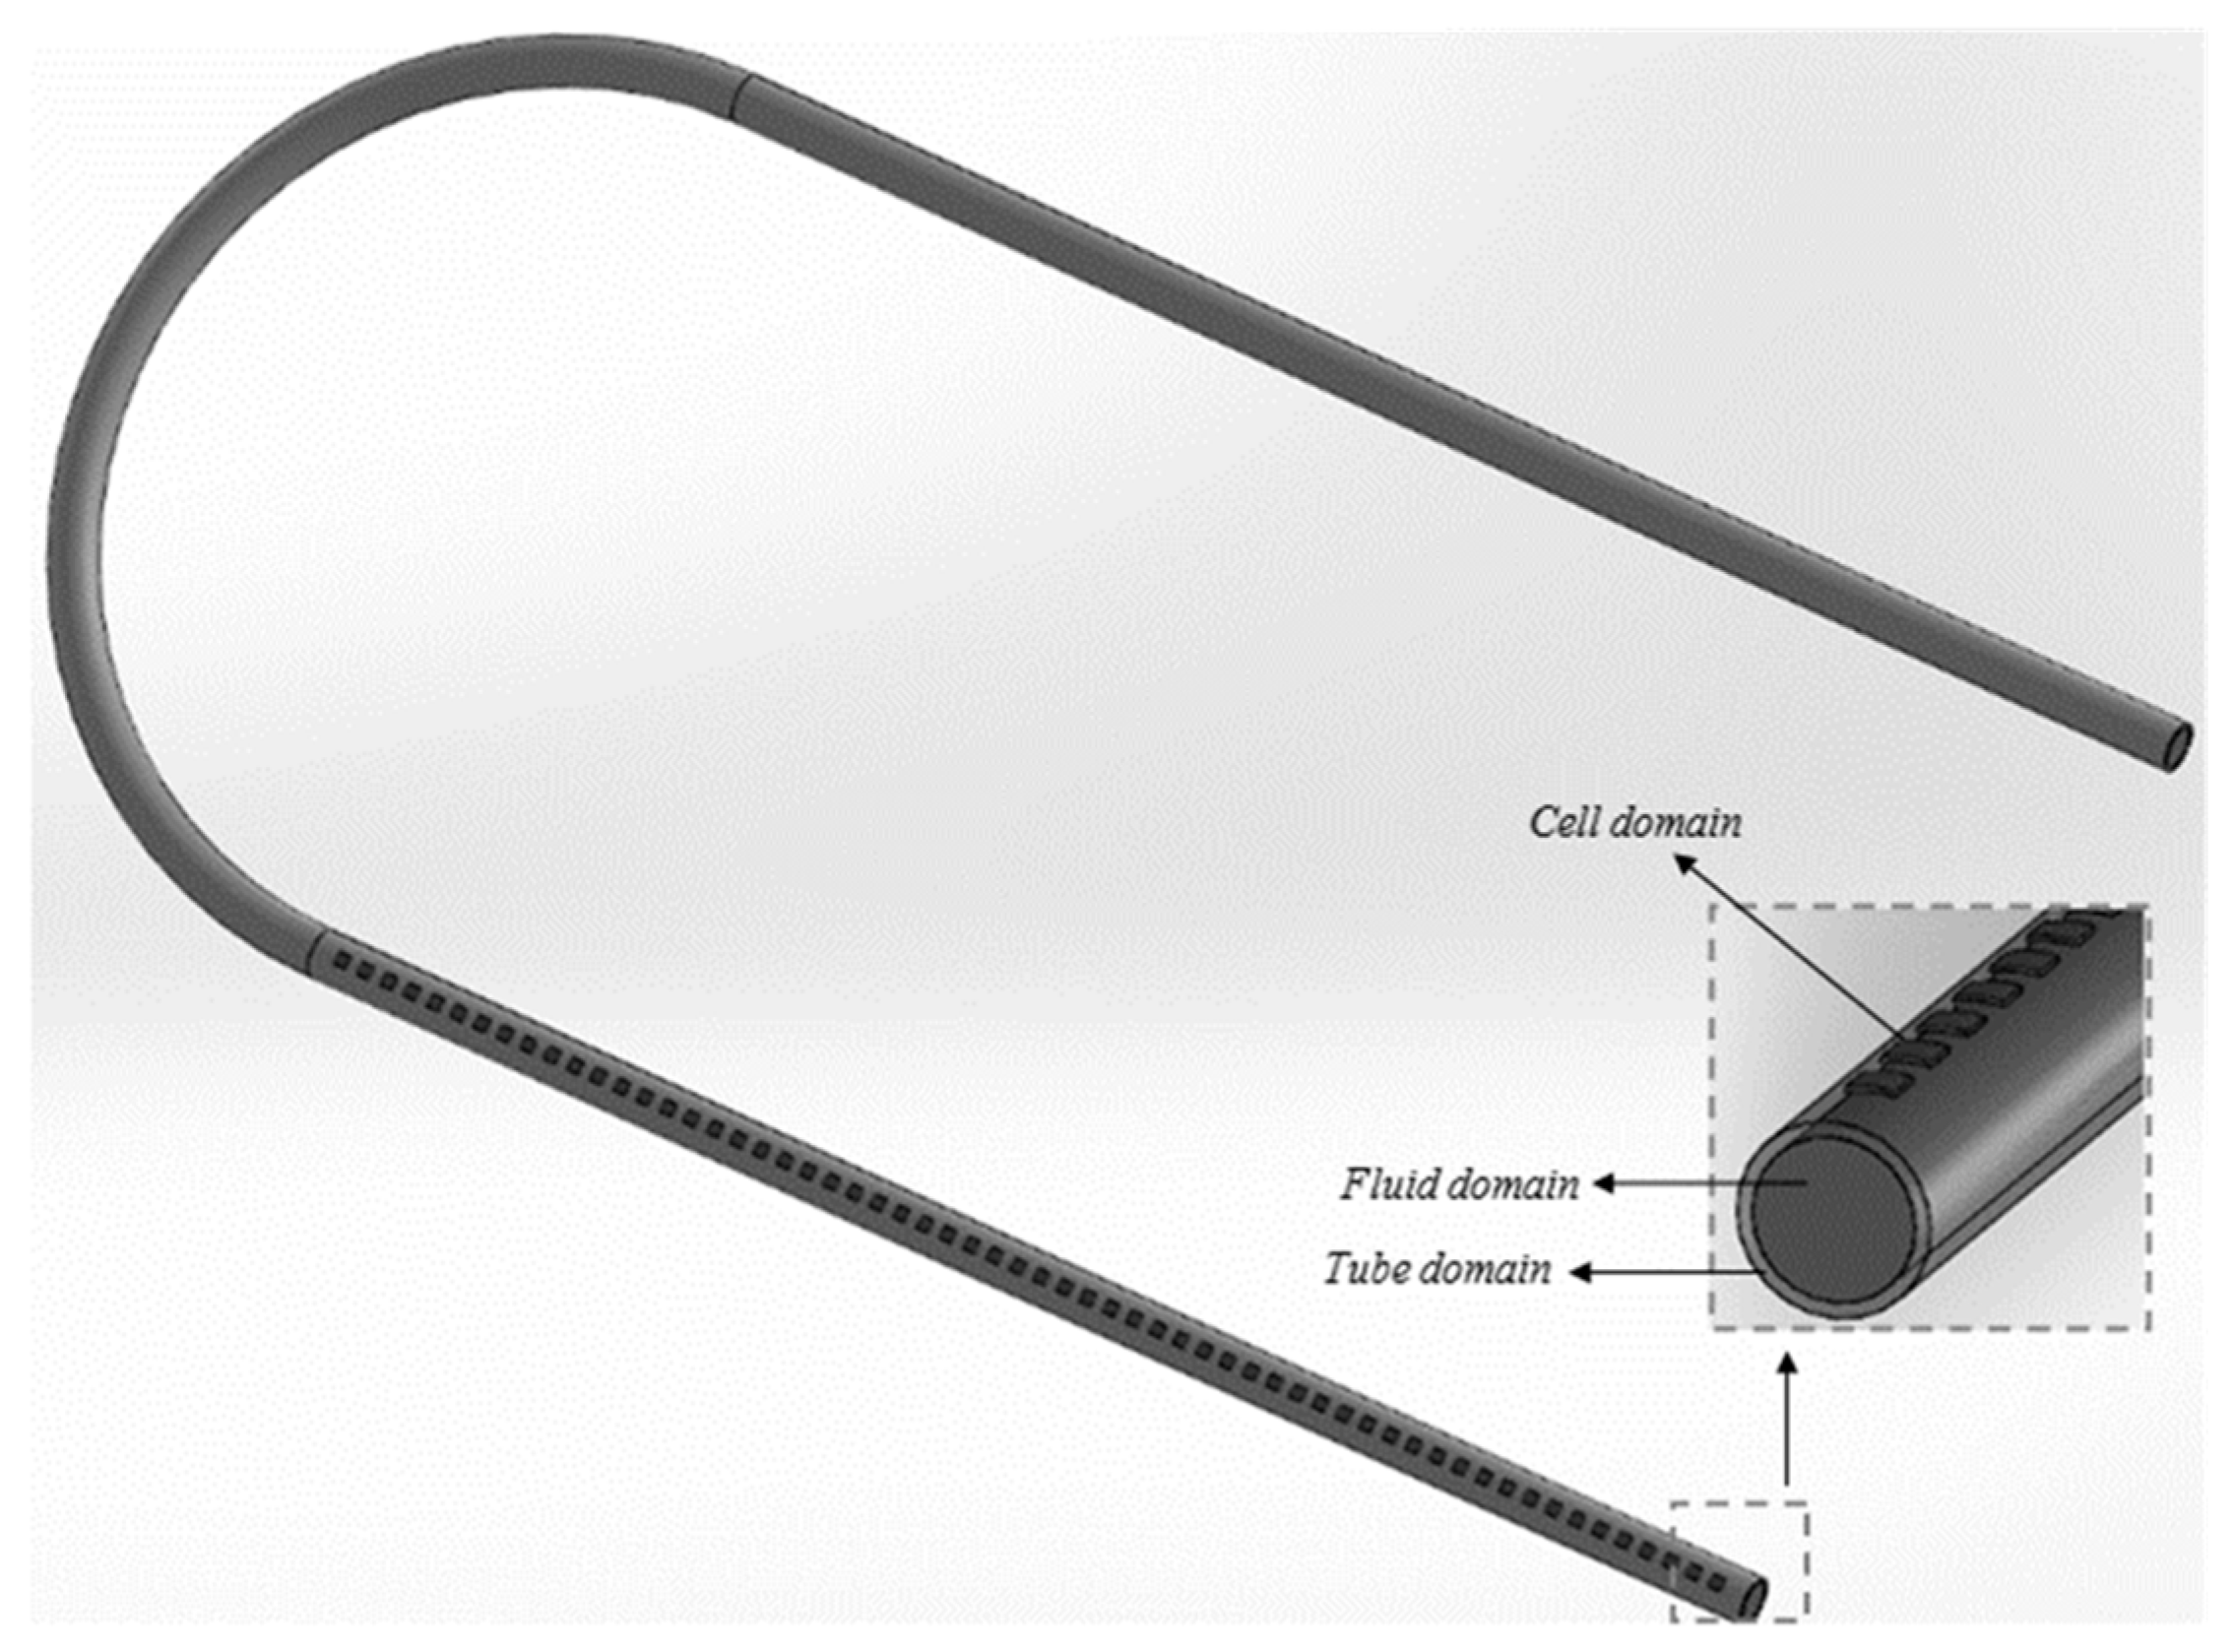
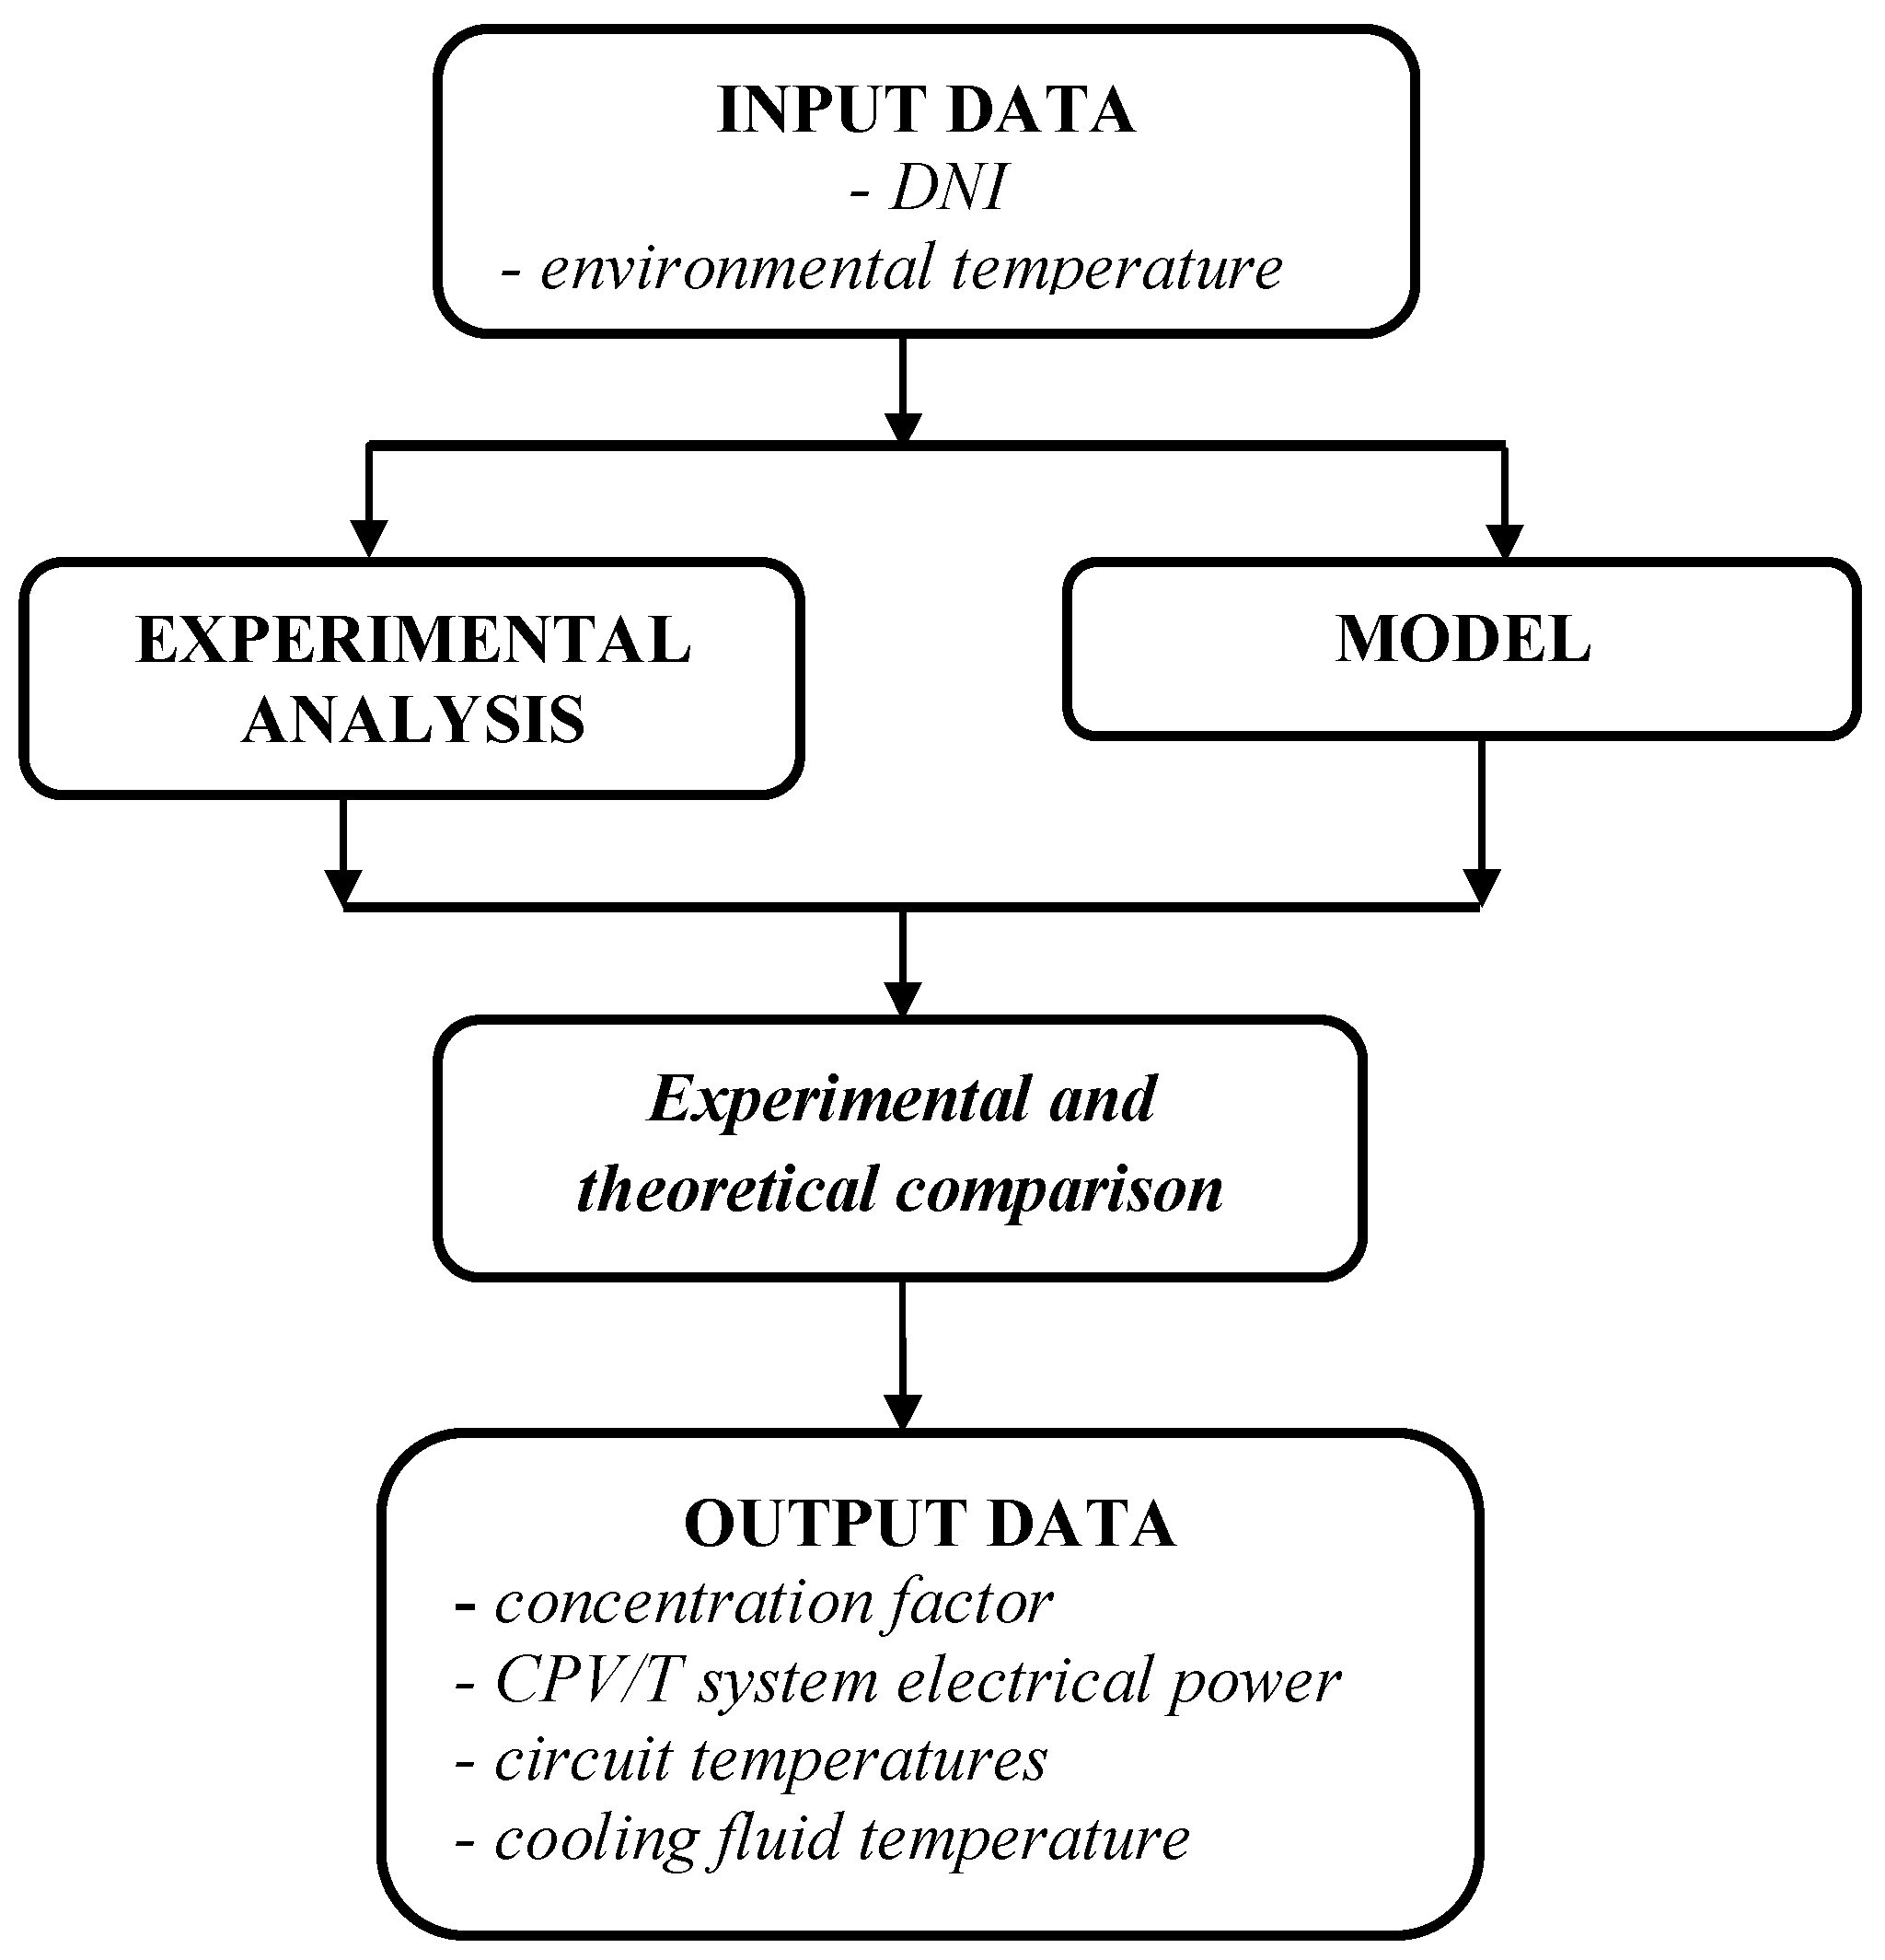
2.2. Modelling of the Linear Focus CPV/T System

The CPV/T system performances vary with the concentration factor (C), which is equal to:
C = A opt A c η opt ,
where Aopt and Ac, respectively, are the optics area and the TJ cell area, and ηopt is the optical efficiency. Corresponding to a same C value and the same TJ cell, the CPV/T system’s electric energy is equal to [7]:
E el , CPV / T = DNI C A c η c n c η mod ,
where ηc is the TJ cell efficiency, nc is the number of cells present in the module and ηmod represents the efficiency of the module that is equal to 0.95 up to 100 cells [20].
The CPV/T system provides electrical energy, but also thermal energy equal to [21]:
E th , CPVT = [ ( 1 η el , CPV / T ) DNI n c ] E th , loss ,
where the global electric efficiency of the CPV/T system considers the efficiency values of the cells and module [22]:
η el , CPV / T = η c η mod ( 1 p par ) ,
where ppar is a loss factor equal to 0.023 and linked to the radiation [20] and Eth,loss represents the thermal losses, both convective and radiative, of the CPV/T system [7]. Different CPV/T systems show similar electrical performance when they present the same number of cells. On the other hand, the thermal energy depends on the CPV/T system configuration even if the same C value and the same number and typology of cells are adopted.
In this paper, the thermal performance of a linear focus CPV/T system was analyzed. In particular, the cooling circuit of the linear CPV/T system was designed by means of the Solidworks 2016 software, and it was thermally studied adopting a model realized in ANSYS-CFX. The model has evaluated the temperatures of the cooling fluid, generally water and glycol, that flows in the circuit. A thermal study of the CPV/T system was conducted, referring to the linear focus experimental configuration described in the Section 2, where the concentration occurs along a line, including the cells and the tube, which had the same length as the concentrator. Energy balances were used corresponding to different control volumes (V) (Figure 4). The thermal exchange occurs between the TJ cell, tube and fluid near the cell (V1, V2) and it was expressed by means of the following equations:
ρ c V c c c T c θ = C DNI A c α c π d e h e ¯ ( T c T e ) A c K c ( T c T t ) ,
A t K t 2 T t x 2 = π d i h i ¯ ( T t T f ) A c K c ( T c T t ) + ρ t V t c t T t θ ,
where αc is the TJ cell absorptivity coefficient, and Te, Tc, Tt and Tf are respectively the environment, cell, tube and fluid temperatures. Kc and Kt are the cell and tube global thermal conductance and h e ¯ and h i ¯ are the convective transfer coefficients related to the thermal exchanges with the environment and fluid. In the insulated zone (V3, V4), the energy balances are represented by the following equations:
C DNI A ins α ins + A ins K ins 2 T ins x 2 = A ins K ins ( T ins T t ) + π d e h e ¯ ( T ins T e ) + ρ ins V ins c ins T ins θ ,
A ins K ins ( T ins T t ) + A t K t 2 T t x 2 = π d i h i ¯ ( T t T f ) + ρ t V t c t T t θ ,
where Tins and αins represent respectively the insulator temperature and absorptivity coefficient. Hence, the energy balance for the fluid (V5) is [23]:
m ˙ f c f T f x + π d i h i ¯ ( T t T f ) = m f ˙ c f T f θ ,
where cf and m f ˙ are respectively the cooling fluid specific heat and the fluid mass flow rate. The thermal model was expressed in terms of the thermal resistances [24]. The DNI was focused on the TJ cells that heat the tube and fluid. The insulation was adopted to avoid heat loss in the part of the tube opposite the TJ cells, while between one cell and another there was no thermal insulation in order to increase the tube heating. The global thermal conductance was evaluated by means of the conductivity and dimension values of the cell, insulator and tube. Hence, the cooling fluid temperature along the tube was able to be determined.
In order to numerically model the linear focus CPV/T system, the ANSYS-CFX software was used. The geometric configuration of the linear focus CPV/T system (Figure 5) was obtained by means of Solidworks. Thirty TJ photovoltaic cells, described above, were considered along the tube. The aim was to evaluate the temperature of the cooling fluid to reduce the calculation time. Once the boundary conditions were fixed, the numerical method provided the meshing and the solution of the model. In order to compare the theoretical and experimental fluid results, the experimentally obtained TJ cell temperature values were used in the model. Other boundary conditions were fixed: a fluid temperature of 285 K (12 °C) at the inlet section, an outdoor temperature equal to 298 K (25 °C), DNI values between 400 W/m2 and 900 W/m2 and a constant concentration factor.
Different computational domains (Figure 5) were considered: a solid domain for the TJ cells and the tube and a fluid domain for the cooling fluid. A meshing that uses tetrahedral elements was adopted in the numerical solution. In particular, the cells were connected to the copper tube by an epoxy resin, and the thermal insulation was obtained by means of an aerogel. The data related to insulator and copper were selected from the ANSYS library [25], while the characteristic values of the TJ cell were derived from the manufacturer [18]. The conservative heat flux condition was set in the ANSYS-CFX model. In the numerical model, several equivalent resistances values were obtained. Referring to the TJ cell zone, the model has considered the convective exchange coefficients between the air and the cell and between the tube and the fluid, and the thermal resistance that links the TJ cell, epoxy resin and copper tube. Referring to the insulation zone, the model took into account the resistance between the aerogel and the copper, and the convective exchange coefficient between the tube and the fluid. The thermal properties of the cell, resin, copper and insulator are reported in Table 2.
In the CFX software, the boundary conditions related to conductive and convective heat transfer on several system surfaces were taken into account. As for the thermal exchange between the TJ cell and the environment, a convective transfer coefficient equal to 6.0 W/m2K was evaluated. For the domain of the fluid, the boundary conditions were set for the inlet and outlet sections and for the surface in contact with the tube. The temperature and fluid velocity values at the inlet section were fixed and updated at every time-step. The contact surface between the fluid and tube was modelled as a no-slip wall. For the solid domain related to the tube, the boundary conditions were fixed at the interface with the fluid, the outdoor surface and the two surfaces related to the fluid inlet and outlet sections. The insulator characteristics were lumped on the tube outdoor surface. For the solid domain related to the TJ cells, the cell top surface temperature was set, adopting the experimentally measured values. The cell lateral surfaces were small and modeled as adiabatic surfaces because they were in contact with the insulator.
In the pre-design stage, a sensibility analysis referring to the time-step size was carried out every time that the velocity was modified. The purpose was to limit the root mean squared (RMS) of the residuals limited in the first iterations, and to ensure that the error does not grow with time. As for the time step considered, the RMS was of magnitude e−4 in the first step, decreasing to e−8 in the first five steps. A time step of 15 s was fixed. The numerical solution considered two convergence criteria: 10−5 for the continuity and momentum equations, and 10−6 for the energy equation [26]. The model has evaluated the cooling fluid temperature in the circuit of the linear focus CPV/T system until the steady-state condition was obtained

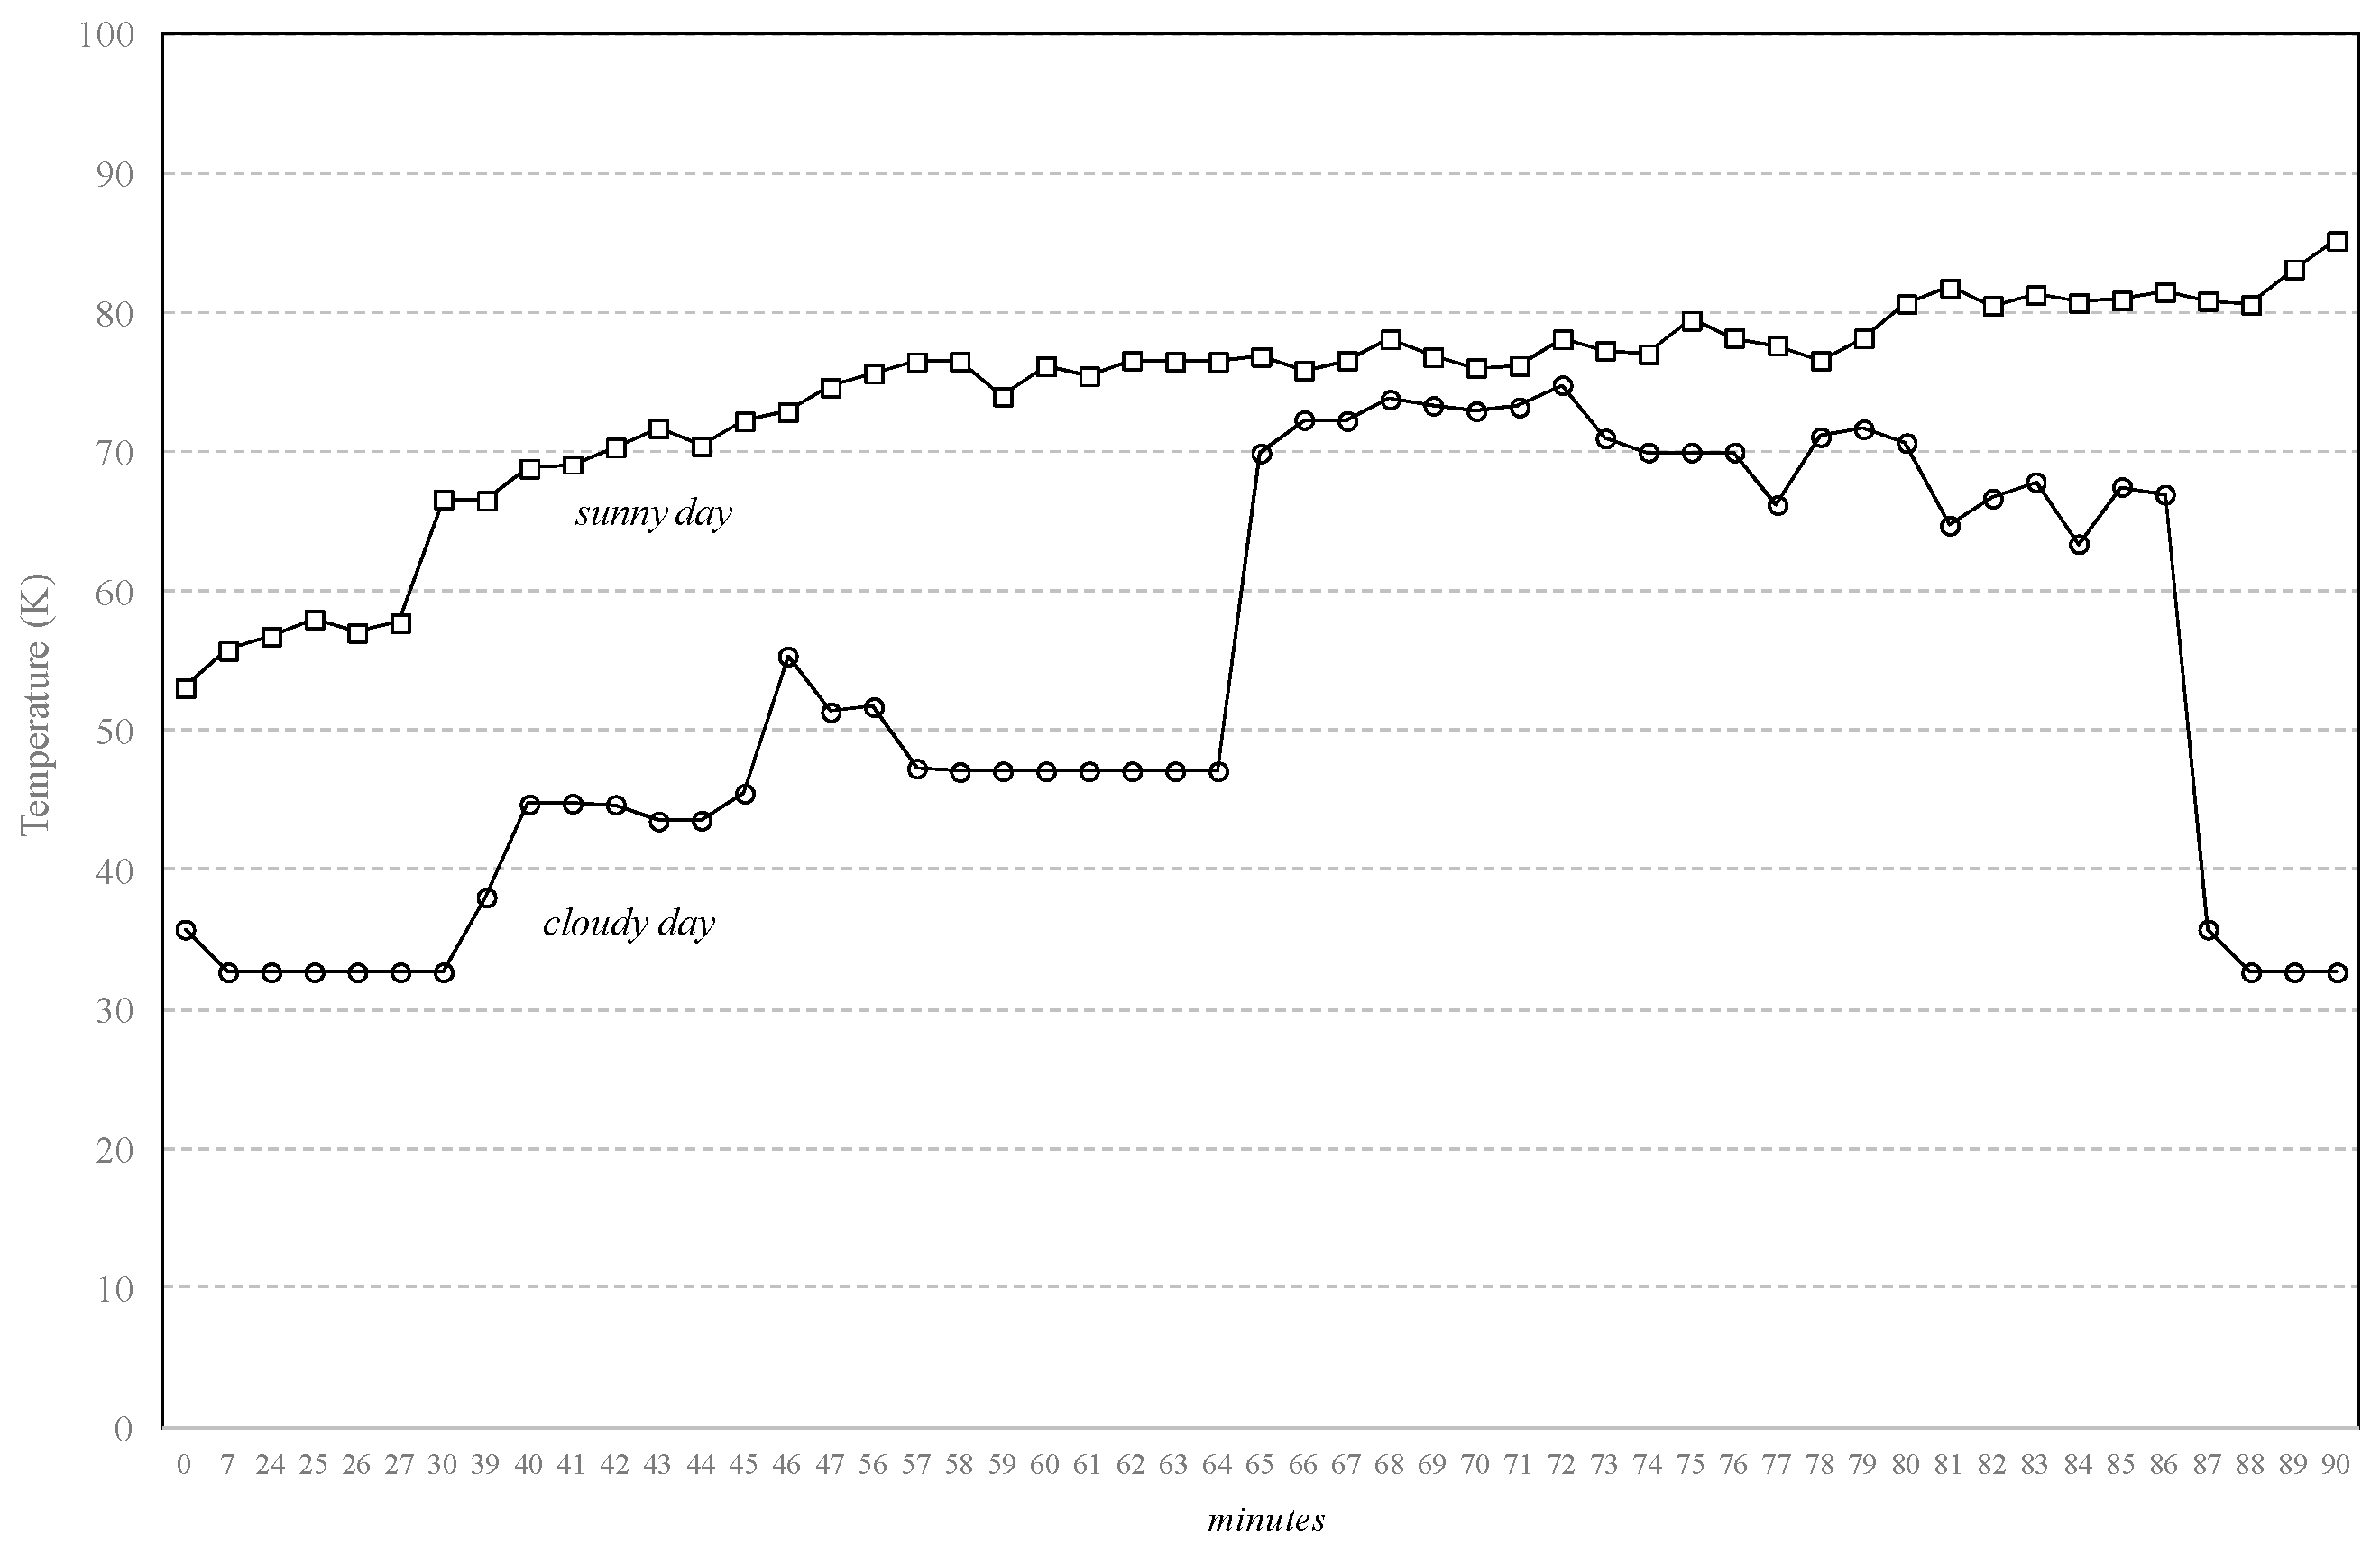
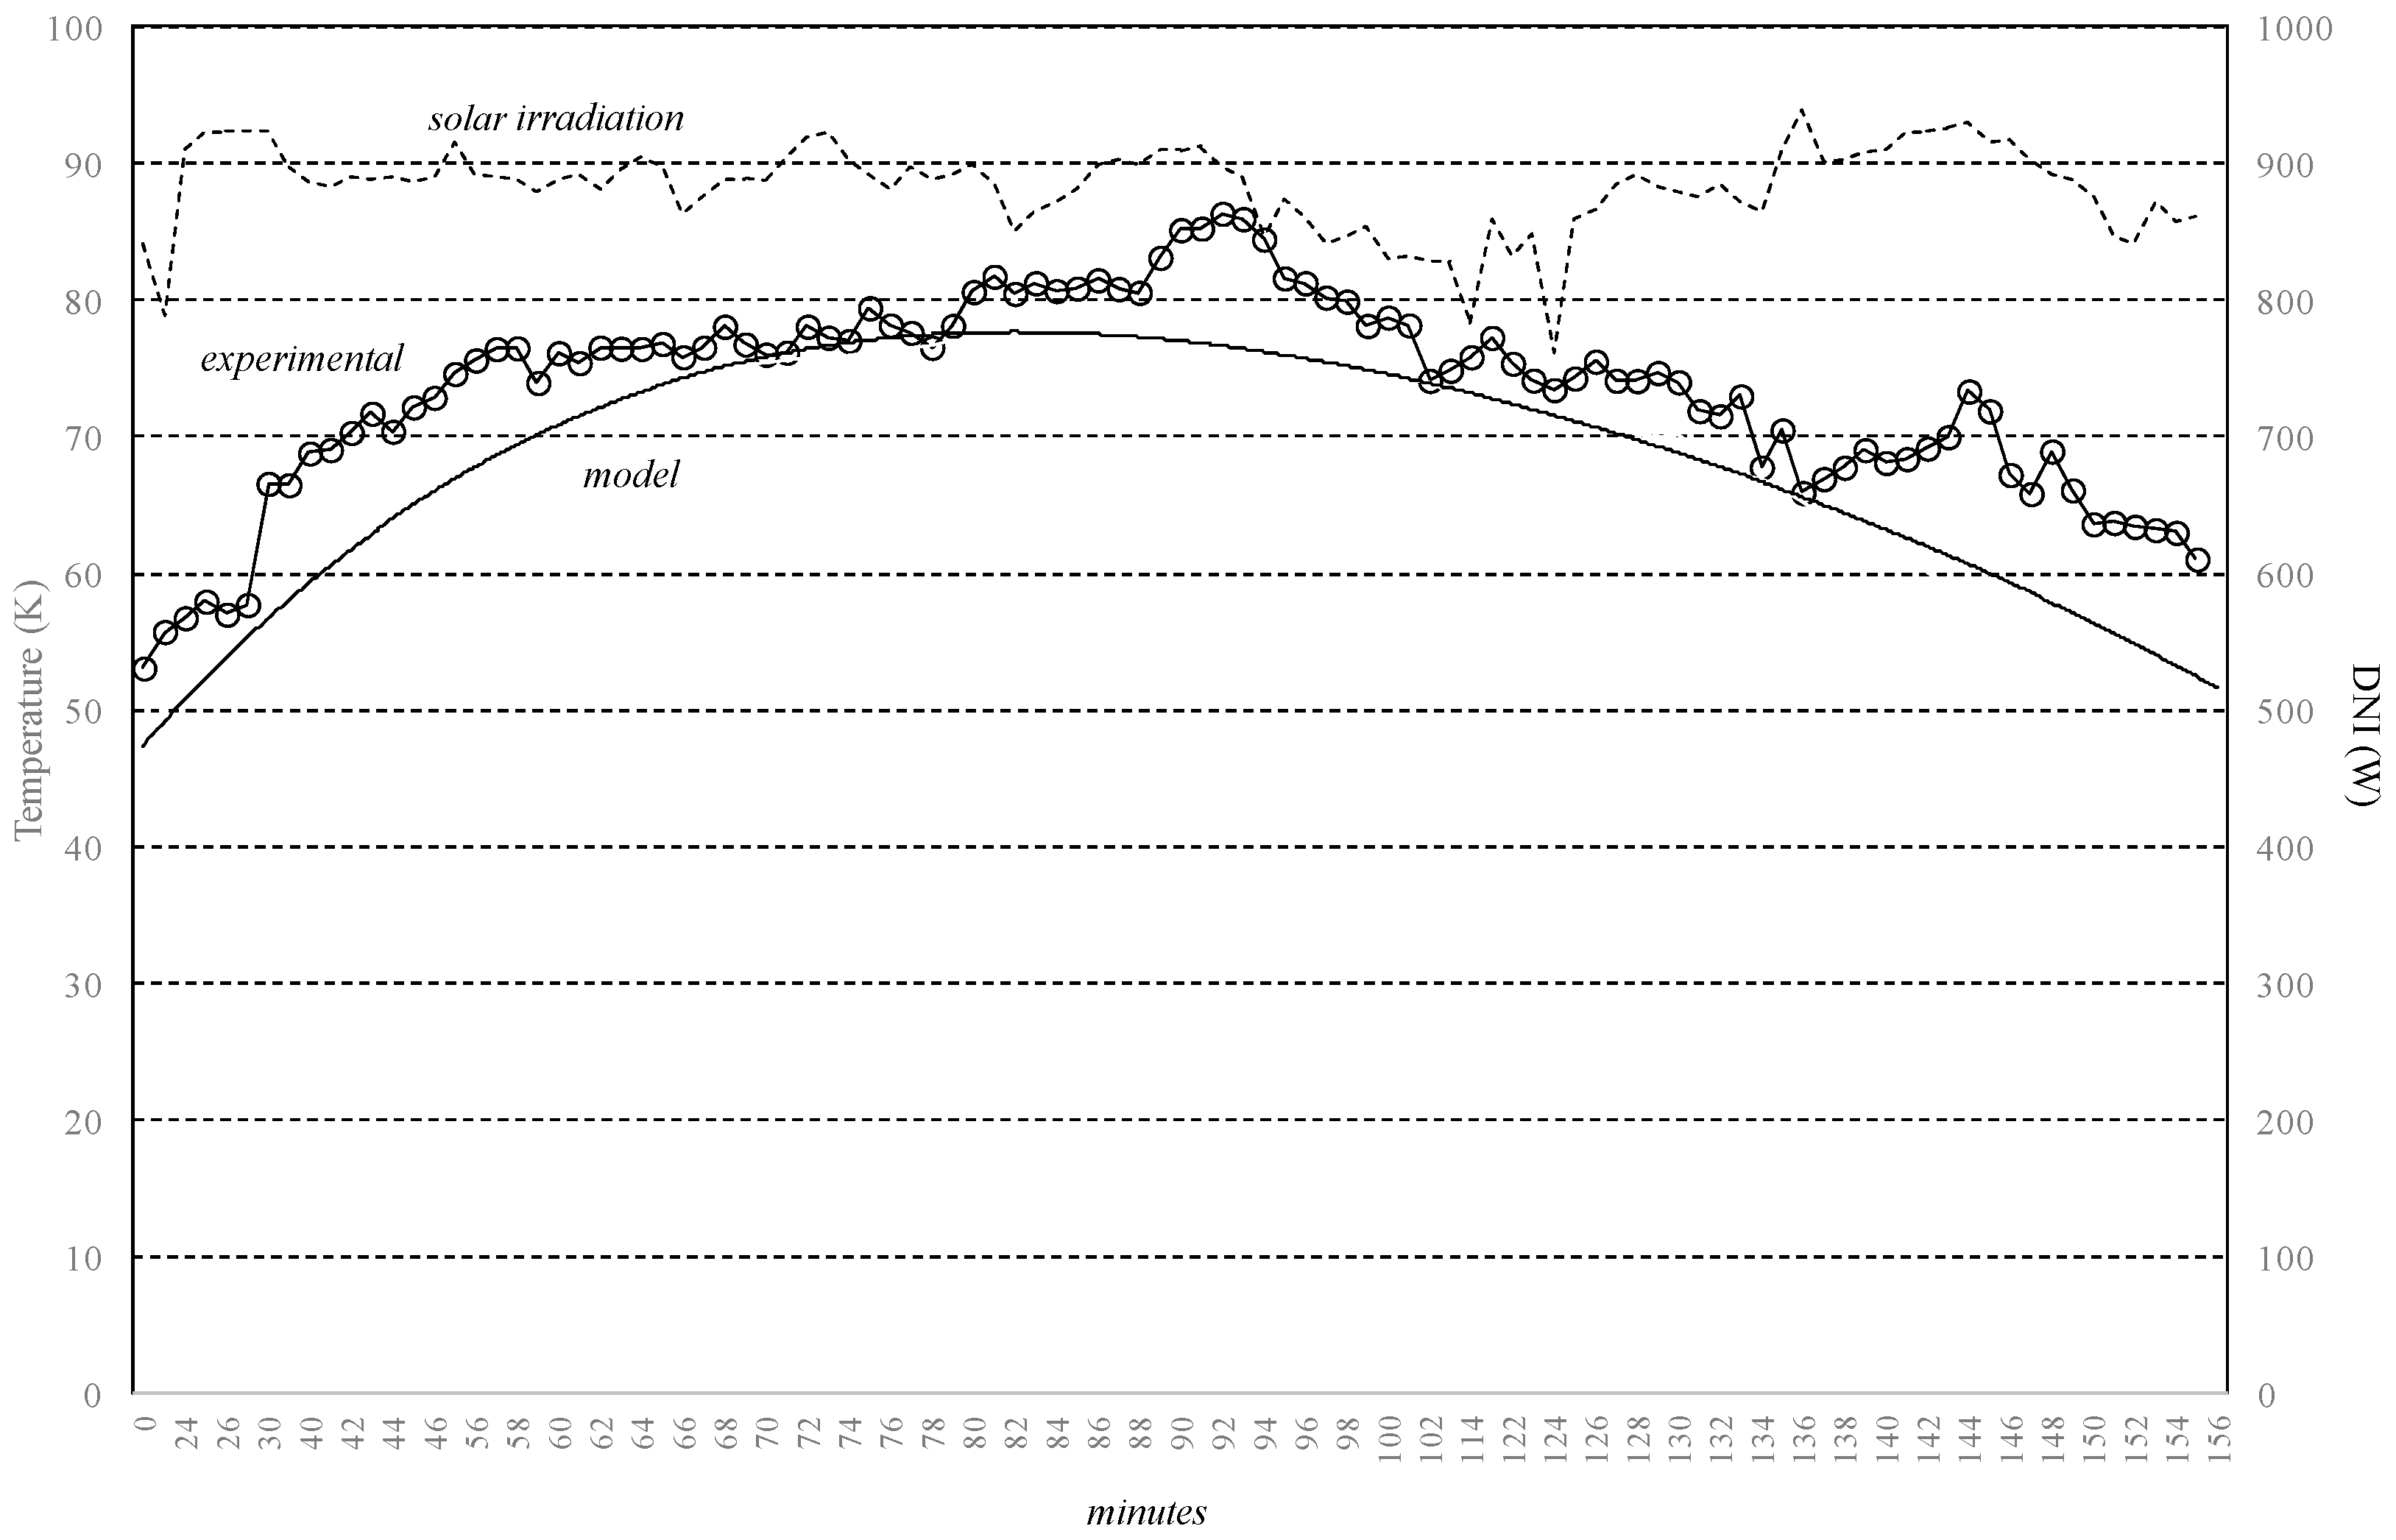
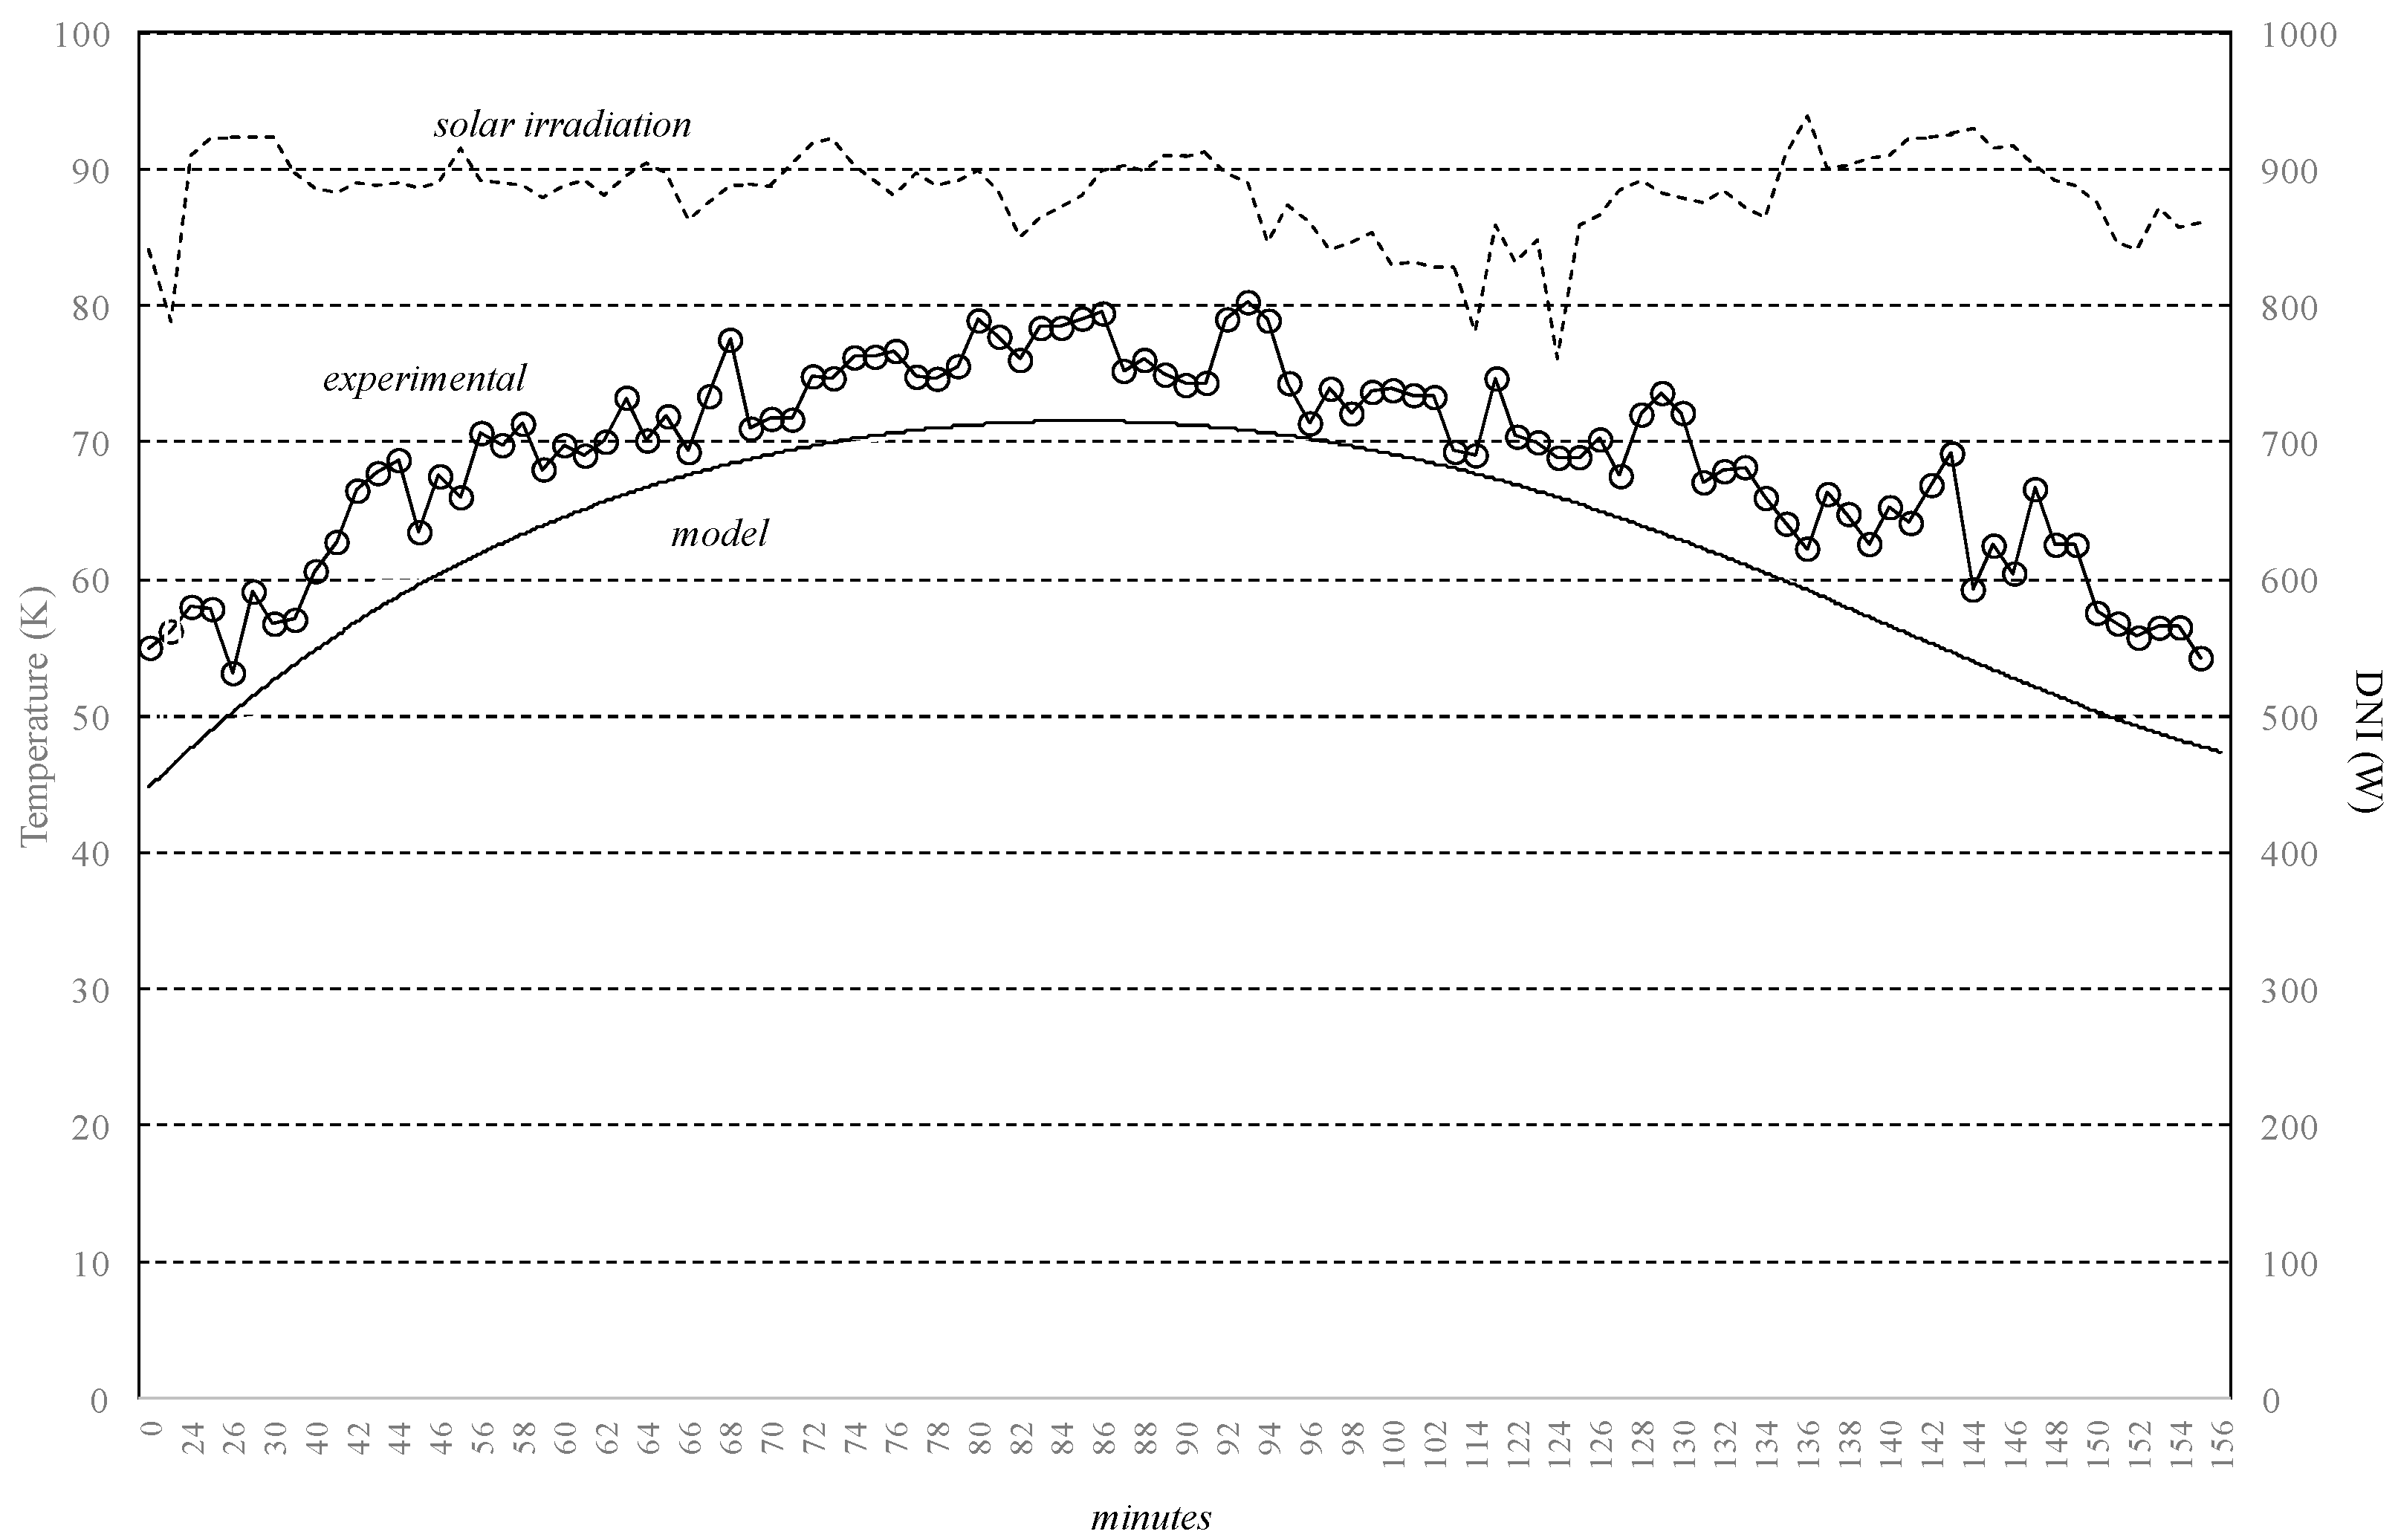
3. Results and Discussion

A CPV/T system allows generally to obtain both electrical and thermal energy. The electrical production depends on the TJ cell characteristics and C; the thermal production depends on the CPV/T system configuration and the DNI values [27]. Besides, the cell cooling is basic in order to raise its efficiency. For this, an active cooling, and thus heat recovery, is necessary. Hence, a theoretical and experimental study of the linear focus CPV/T system was conducted under different operation conditions and in terms of the cell, tube and fluid temperatures. In particular, an experimental linear focus CPV/T system that adopts TJ solar cells was introduced and analyzed in this paper under high concentration and for cogeneration purposes. The input data of this analysis are the DNI and environment temperature, while the output data are concentration factor, CPV/T system electrical power, circuit and cooling fluid temperatures (Figure 6).
Firstly, the electrical voltage and current values reached by the TJ cells were experimentally measured varying the focal length to have a maximum value of C. The focal length is the vertical distance between the horizontal axis, where the cells are located, and the parabolic mirror focus. It was varied by means of the experimental linear focus CPV/T system (Figure 2) and a maximum concentration factor of about 90x was obtained; thus, referring to the value of 107x considered in the sizing phase, a decrease of the C value of about 15% was noted during the actual operation. The maximum electrical power of a TJ cell, experimentally measured, was about 12 W corresponding to voltage and current values were equal to about 3 V and 4 A, respectively. During the experimental tests the focal length has been varied, determining the concentration factor values included between 10x and 90x, with an average voltage value equal to about 2.6 V and current values included between 0.5 and 1.2 A. The low electrical power values, besides the variability of the concentration factor, were also due to other parameters. For example, its oscillation over time was due to the cloudiness and the presence of wind [22]. As a consequence, it was experimentally observed that corresponding to 90x, the average real electrical power of the TJ cells was equal to about 6 W. Finally, in Figure 7, corresponding to the C value of about 90x, the electrical power obtained by means of the experimental CPV/T system was reported corresponding to thirty TJ solar cells.
From a thermal point of view, it has been important to evaluate, first of all, the temperature of the TJ cells on which the tube and refrigerant temperatures of the circuit depend. In particular, the cell temperatures were affected by the solar irradiation and the atmospheric conditions (strong wind, cloudiness, etc.). Moreover, the heating of the TJ cell could cause a degradation of its performance. During the operation of the CPV/T system, a variable thermal load was connected to each TJ cell, and its temperature was monitored. In Figure 8, it is possible to observe that the average TJ cell temperature, evaluated for example in the month of July, was about 363 K (90 °C).
The CPV/T system was experimentally tested to analyze the influence of the cooling fluid, monitoring the temperature in the circuit both with and without refrigerant fluid (Figure 9). The cell temperature trends in Figure 9 are different because they were both measured on the same day in July, but partially under different conditions of solar irradiation due to moments of cloudiness. The lack of water has caused a considerable increase in cell temperature. This affects the working of the cells and increases the risk of degradation, determining their inefficiency over time. In particular, it was noted that without refrigerant fluid, the cell temperature has reached values of about 403 K (130 °C), while when there was fluid in the circuit the cell temperature has assumed values up to 373 K (100 °C). Hence, the cell cooling allows to match different thermal loads and to preserve the cell integrity.
In this paper, a main aim was also to evaluate, the effects of the cooling fluid along the circuit and along the diameter of the circuit, as well as the temperature values of both the tube and the refrigerant fluid. Even if the incident radiation was uniformly focused through the parabolic mirror, it was possible to observe that the highest temperatures were measured in the central section of the tube under different working conditions. This was mainly due to the TJ cells that heated the fluid when it flowed in the circuit. In Figure 10, the experimentally evaluated DNI was reported for two different climatic situations: sunny days and cloudy days. For sunny days, the average DNI value was equal to about 900 W/m2, while for a day with high irradiance variability the DNI is varied between 100 W/m2 and 600 W/m2. In the experimental tests, the environment temperature was between 299 K (26 °C) and 307 K (34 °C). Corresponding to these DNI values, the refrigerant fluid temperature in the central section is presented in Figure 11 for a sunny day and for a day with high irradiance variability. It is possible to note that the temperature difference of the fluid between the sunny and cloudy conditions is varied between about 278 K (5 °C) and 303 K (30 °C).
Moreover, the theoretical evaluation of the working fluid temperature along the diameter at the central section is presented in Figure 12. In particular, the ANSYS screen for the configuration linear focus was introduced to show the temperature values along the diameter and the difference compared to the Tc once it had reached the steady-state condition. The reported analysis takes into account constant values for fluid velocity and insulation thickness, equal to 0.4 m/s and 1.0 cm, respectively.
The different degrees of freedom of the CPV/T system, including the focal length and the inclination between the mirror and the tube where the TJ cells are placed, were successively varied. In particular, this analysis was realized to evaluate the incidence of the concentration of the temperatures along the tube, considering their upper and inferior surfaces. By regulating the focal length and moving the mirror, the produced effect was to focus the sunlight in the central zone. It can be noted that the highest temperatures were obtained in the central section and, in particular, in the inferior part of the tube that faces the mirror. Figure 13 presents a comparison of the theoretical and experimental results in terms of fluid temperature for a sunny day, for the inferior part of the tube that faces the mirror. Using the same C value both for the experimental and theoretical analysis, the TJ cell temperature experimental values [22] were used as input for the ANSYS model, which was used to calculate the theoretical values of the cooling fluid temperatures. The experimental tests were conducted on a sunny day of July. With an average irradiance value of about 900 W/m2, the experimental values of the fluid temperature, which reached up to 360 K (87 °C), were obtained. Moreover, it was noted that the temperature difference between theoretical and experimental results is varied between about 276 K (3 °C) and 285 K (12 °C). The second tests were always realized on a sunny day. Figure 14 compares the theoretical results with the experimental values of the temperature of the fluid in the superior part of the tube where the cooling fluid flows. It can be noted that, both from theoretical and experimental point of view, the temperature difference between the inferior and superior parts of the circuit is generally varied between 276 K (3 °C) and 278 K (5 °C).
In addition, a comparison with the results reported in the literature was conducted. A first comparison was realized considering the results in [28], where a CPV/T system was analyzed and a cooling fluid temperature of about 70 °C was obtained, with a Tc of about 85 °C. This trend can be observed in Figure 13 under similar operation conditions. Moreover, the validation was also realized considering the results from [13], where the cooling fluid temperature was about 70 °C, a value that is comparable with those obtained in this paper.
The electrical and thermal results obtained both theoretically and experimentally in this paper allow us to understand the possibility of using of a CPV/T system as a cogenerator. In particular, when sizing a CPV/T system, it is generally assumed that the electrical demands of the user have to be totally satisfied, thus determining how much can be matched in terms of thermal energy. Hence, once the user input data are known (electrical load, available space and installation site), as well as the concentrator area, cell area and concentration factor, and once the necessary value of nc is determined by means of Equation (2), the linear focus CPV/T system performance in terms of the thermal energy (Equation (3)) and the number of modules and area occupied can be evaluated. For example, for a residential user, where the necessary electrical power is generally about 3 kW, about five hundred TJ solar cells are necessary in order to match the electrical load by means of the linear focus CPV/T system analysed in this paper. Moreover, the theoretical and experimental results obtained in this paper in terms of the working fluid temperature have showed that it is possible to reach the thermal levels necessary to satisfy the thermal loads of a user by means of a linear focus CPV/T system under high concentration, as shown in Figure 13.
Finally, the results presented in this paper have showed good electrical and thermal performance of the experimental linear focus CPV/T system under high concentration, representing an interesting cogeneration solution. Future developments in the research work will concern the development of a layout of the CPV/T linear focus system able to match the energy requirements of a specific user, both from an electrical and thermal point of view.

4. Conclusions

This paper has presented a theoretical and experimental study of a linear focus CPV/T system. A new experimental linear focus CPV/T plant has allowed the evaluation of its actual performances from an electrical and thermal point of view, which were then compared with the results of a theoretical model. The model, realized in ANSYS-CFX, has allowed to determine under different operation conditions the temperature values of the fluid that flows in the cooling circuit of a CPV/T system. The experimental values of the TJ cell temperature were adopted as input data of the model. The maximum value of C obtained experimentally during the operating hours of the CPV/T system has been about 90x, corresponding to a proper focal length. It has been experimentally observed that with the 90x value, the average actual electric power of the single TJ cell was about 6 W, while with thirty cells the electric power was about 190 W. The TJ solar cell, circuit tube and fluid refrigerant temperatures were experimentally measured under different operation conditions in terms of environmental temperature, sunny and cloudy conditions, focal length, etc. The theoretically and experimentally determined values of the fluid temperature, were compared with good agreement. Experimental values of the fluid temperature up to 360 K (87 °C) were obtained, corresponding to an average DNI value of about 900 W/m2, and the temperature difference between the theoretical and experimental results are varied between 276 K (3 °C) and 285 K (12 °C). Finally, the results obtained in this paper have demonstrated the good electrical and thermal performance of the experimental linear focus CPV/T system under high concentration, and this type of system can be an interesting solution from the cogeneration point of view.

Funding

This research received no external funding.

Conflicts of Interest

The author declares no conflict of interest.

Abbreviations

Aarea (m2)
Cconcentration factor
CPVConcentrating Photovoltaic
CPV/TConcentrating Photovoltaic and Thermal
cspecific heat (kJ/kgK)
DNIDirect Normal Irradiance (W/m2)
Eenergy (kWh)
h ¯ heat transfer coefficient (W/m2K)
InGaP/InGaAs/Geindium-gallium-phosphide/indium- gallium-arsenide/germanium
Kthermal conductance (W/m2K)
m ˙ mass flow rate (kg/s)
nnumber
RMSroot mean squared
Ttemperature (K)
TJTriple-Junction
Vvolume (m3)
xspace (m)
Greek symbols
αabsorptivity coefficient
ηefficiency
θtime (s)
ρdensity (kg/m3)
Subscripts
ccell
eenvironment
elelectrical
ffluid
iinternal
insinsulator
modmodule
optoptic
ttube

References

  1. Zsiborács, H.; Baranyai, N.H.; Vincze, A.; Háber, I.; Pintér, G. Economic and Technical Aspects of Flexible Storage Photovoltaic Systems in Europe. Energies 2018, 11, 1445. [Google Scholar] [CrossRef]
  2. Pintér, G.; Baranyai, N.H.; Wiliams, N.; Zsiborács, H. Study of Photovoltaics and LED Energy Efficiency: Case Study in Hungary. Energies 2018, 11, 790. [Google Scholar] [CrossRef]
  3. Zsembinszki, G.; Solé, A.; Barreneche, C.; Prieto, C.; Inés Fernández, A.; Cabeza, L.F. Review of Reactors with Potential Use in Thermochemical Energy Storage in Concentrated Solar Power Plants. Energies 2018, 11, 2358. [Google Scholar] [CrossRef]
  4. Sharaf, O.Z.; Orhan, M.F. Concentrated photovoltaic thermal (CPVT) solar collector systems: Part II—Implemented systems, performance assessment and future directions. Renew. Sustain. Energy Rev. 2015, 50, 1566–1633. [Google Scholar] [CrossRef]
  5. Castaneda, M.; Zapata, S.; Aristizabal, A. Assessing the Effect of Incentive Policies on Residential PV Investments in Colombia. Energies 2018, 11, 2614. [Google Scholar] [CrossRef]
  6. Xu, Z.; Kleinstreuer, C. Concentration photovoltaic–thermal energy co-generation system using nanofluids for cooling and heating. Energy Convers. Manag. 2014, 87, 504–512. [Google Scholar] [CrossRef]
  7. Renno, C. Optimization of a concentrating photovoltaic thermal (CPV/T) system used for a domestic application. Appl. Therm. Eng. 2014, 67, 396–408. [Google Scholar] [CrossRef]
  8. Kandilli, C. Performance analysis of a novel concentrating photovoltaic combined system. Energy Convers. Manag. 2013, 67, 186–196. [Google Scholar] [CrossRef]
  9. Renno, C.; Petito, F. Choice model for a modular configuration of a point-focus CPV/T system. Energy Build. 2015, 92, 55–66. [Google Scholar] [CrossRef]
  10. Xu, G.; Zhang, X.; Deng, S. Experimental study on the operating characteristics of a novel low-concentrating solar photovoltaic/thermal integrated heat pump water heating system. Appl. Therm. Eng. 2011, 31, 3689–3695. [Google Scholar] [CrossRef]
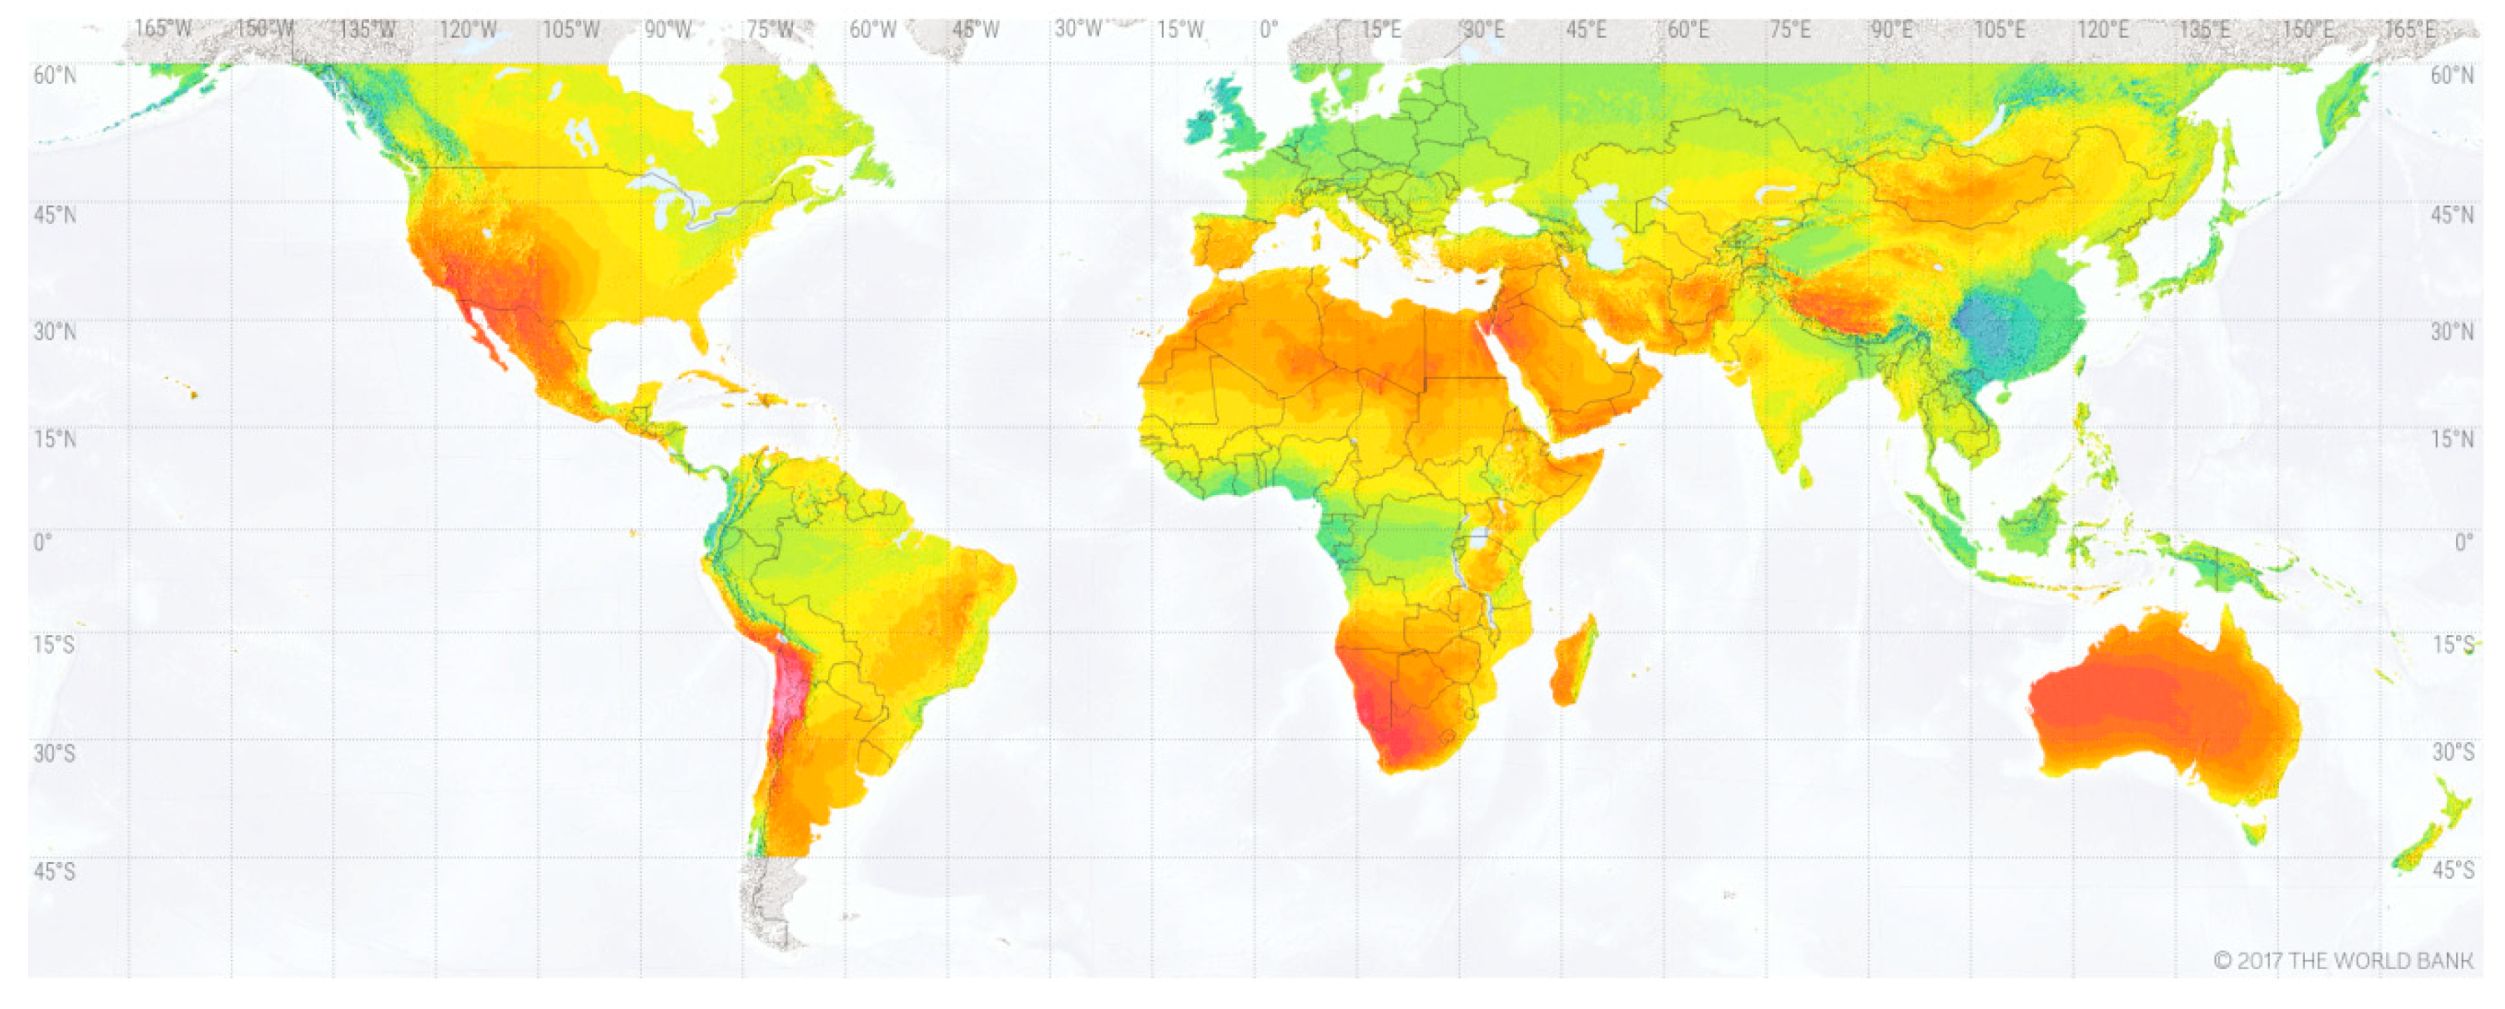
  11. Solargis.com. Solar Resource Maps and GIS Data for 180+ Countries. Available online: https://solargis.com/maps-and-gis-data/download/world (accessed on 18 October 2018).
  12. Renno, C.; Petito, F.; Landi, G.; Neitzert, H.C. Experimental characterization of a concentrating photovoltaic system varying the light concentration. Energy Convers. Manag. 2017, 138, 119–130. [Google Scholar] [CrossRef]
  13. Renno, C.; De Giacomo, M. Dynamic simulation of a CPV/T system using the finite element method. Energies 2014, 7, 7395–7414. [Google Scholar] [CrossRef]
  14. Kerzman, T.; Schaefer, L. System simulation of a linear concentrating photovoltaic system with an active cooling system. Renew. Energy 2012, 41, 254–261. [Google Scholar] [CrossRef]
  15. Rodrigo, P.; Fernández, E.F.; Almonacid, F.; Pérez-Higueras, P.J. Review of methods for the calculation of cell temperature in high concentration photovoltaic modules for electrical characterization. Renew. Sustain. Energy Rev. 2014, 38, 478–488. [Google Scholar] [CrossRef]
  16. Calabrese, G.; Gualdi, F.; Baricordi, S.; Bernardoni, P.; Guidi, V.; Pozzetti, L.; Vincenzi, D. Numerical simulation of the temperature distortions in InGaP/GaAs/Ge solar cells working under high concentrating conditions due to voids presence in the solder joint. Sol. Energy 2014, 103, 1–11. [Google Scholar] [CrossRef]
  17. Mahmoudinezhad, S.; Rezania, A.; Cotfas, D.T.; Cotfas, P.A.; Rosendahl, L.A. Experimental and numerical investigation of hybrid concentrated photovoltaic-Thermoelectric module under low solar concentration. Energy 2018, 159, 1123–1131. [Google Scholar] [CrossRef]
  18. Triple-Junction Solar Cell for Terrestrial Applications. CTJ photovoltaic cell, Datasheets Emcore September 2012. EmcoreCorporation. Available online: https://assets.componentsense.com/images/pdfs/89821_2_7da3431c2dc0e81925db4c73523bf624.pdf (accessed on 28 June 2018).
  19. Ferrera Cobos, F.; Valenzuela, R.X.; Ramírez, L.; Zarzalejo, L.F.; Nouri, B.; Wilbert, S.; García, G. Assessment of the impact of meteorological conditions on pyrheliometer calibration. Sol. Energy 2018, 168, 44–59. [Google Scholar] [CrossRef]
  20. Mittelman, G.; Kribus, A.; Dayan, A. Solar cooling with concentrating pho-tovoltaic/thermal (CPVT) systems. Energy Convers. Manag. 2007, 48, 2481–2490. [Google Scholar] [CrossRef]
  21. Renno, C.; Petito, F. Triple-junction cell temperature evaluation in a CPV system by means of a Random-Forest model. Energy Convers. Manag 2018, 169, 124–136. [Google Scholar] [CrossRef]
  22. Renno, C.; Petito, F. Experimental and theoretical model of a concentrating photovoltaic and thermal system. Energy Convers. Manag. 2016, 126, 516–525. [Google Scholar] [CrossRef]
  23. Aprea, C.; Renno, C. An air cooled tube-fin evaporator model for an expansion valve control law. Math. Comput. Model. 1999, 30, 135–146. [Google Scholar] [CrossRef]
  24. Mwesigye, A.; Huan, Z.; Meyer, J.P. Thermodynamic optimization of the performance of a parabolic trough receiver using synthetic oil–Al2O3 nanofluid. Appl. Energy 2015, 156, 398–412. [Google Scholar] [CrossRef]
  25. ANSYS Academic Research, Release 14.5, ANSYS CFX, Theory Guide. Available online: http://www.scirp.org/(S(351jmbntvnsjt1aadkposzje))/reference/ReferencesPapers.aspx?ReferenceID=2122979 (accessed on 12 June 2018).
  26. Chaabane, M.; Mhiri, H.; Bournot, P. Performance Optimization of Water-Cooled Concentrated Photovoltaic System. Heat Transf. Eng. 2016, 37, 76–81. [Google Scholar] [CrossRef]
  27. Renno, C.; Petito, F.; Gatto, A. ANN model for predicting the direct normal irradiance and the global radiation for a solar application to a residential building. J. Clean. Prod. 2016, 135, 1298–1316. [Google Scholar] [CrossRef]
  28. Jakhar, S.; Soni, M.S.; Gakkhar, N. Modelling and simulation of concentrating photovoltaic system with earth water heat exchanger cooling. Energy Procedia 2017, 109, 78–85. [Google Scholar] [CrossRef]
Figure 1. Direct normal irradiance [11].
Energies 11 02960 g001
Figure 2. Linear focus experimental plant: (a) Triple-junction solar cell; (b) cooling fluid circuit; (c) experimental CPV/T system.
Energies 11 02960 g002
Figure 3. Degrees of freedom of the experimental plant.
Energies 11 02960 g003
Figure 4. Control volumes.
Energies 11 02960 g004
Figure 5. Domains of the linear focus CPV/T system model.
Energies 11 02960 g005
Figure 6. Flow-chart of the experimental and theoretical analysis.
Energies 11 02960 g006
Figure 7. Electrical power of the experimental linear focus CPV/T system.
Energies 11 02960 g007
Figure 8. Experimental trend of the TJ cell temperature.
Energies 11 02960 g008
Figure 9. Experimental analysis of the linear focus system with and without fluid in the circuit.
Energies 11 02960 g009
Figure 10. Experimental trend of the DNI for a sunny day and a cloudy day.
Energies 11 02960 g010
Figure 11. Experimental trend of the fluid temperature for a sunny day and a cloudy day.
Energies 11 02960 g011
Figure 12. Temperature of the cooling fluid along the diameter.
Energies 11 02960 g012
Figure 13. Theoretical and experimental comparison for a sunny day corresponding to the inferior part of the tube that faces the mirror.
Energies 11 02960 g013
Figure 14. Theoretical and experimental comparison for a sunny day corresponding to the superior part of the tube.
Energies 11 02960 g014
Table 1. Cell characteristics [18].
Triple-Junction Cell
parametervalue
materialInGaP/InGaAs/Ge
dimensions1.0 cm × 1.0 cm
reference efficiency ηr (at 298 K, 50 W/cm2)38.7%
temperature coefficient (σt)−0.04%/K
Table 2. Thermal properties [18,19,20,21,22].
Thickness (m)Conductivity (W/mK)Thermal Resistance (m2k/W)
TJ cell1.0 × 10−31506.77 × 10−6
copper3.0 × 10−34007.47 × 10−6
epoxy resin1.0 × 10−41.407.26 × 10−5
insulator5.0 × 10−3 ÷ 15.0 × 10−30.015variable

