3.1. Characterisation of PSO Biodiesel-Diesel Blends
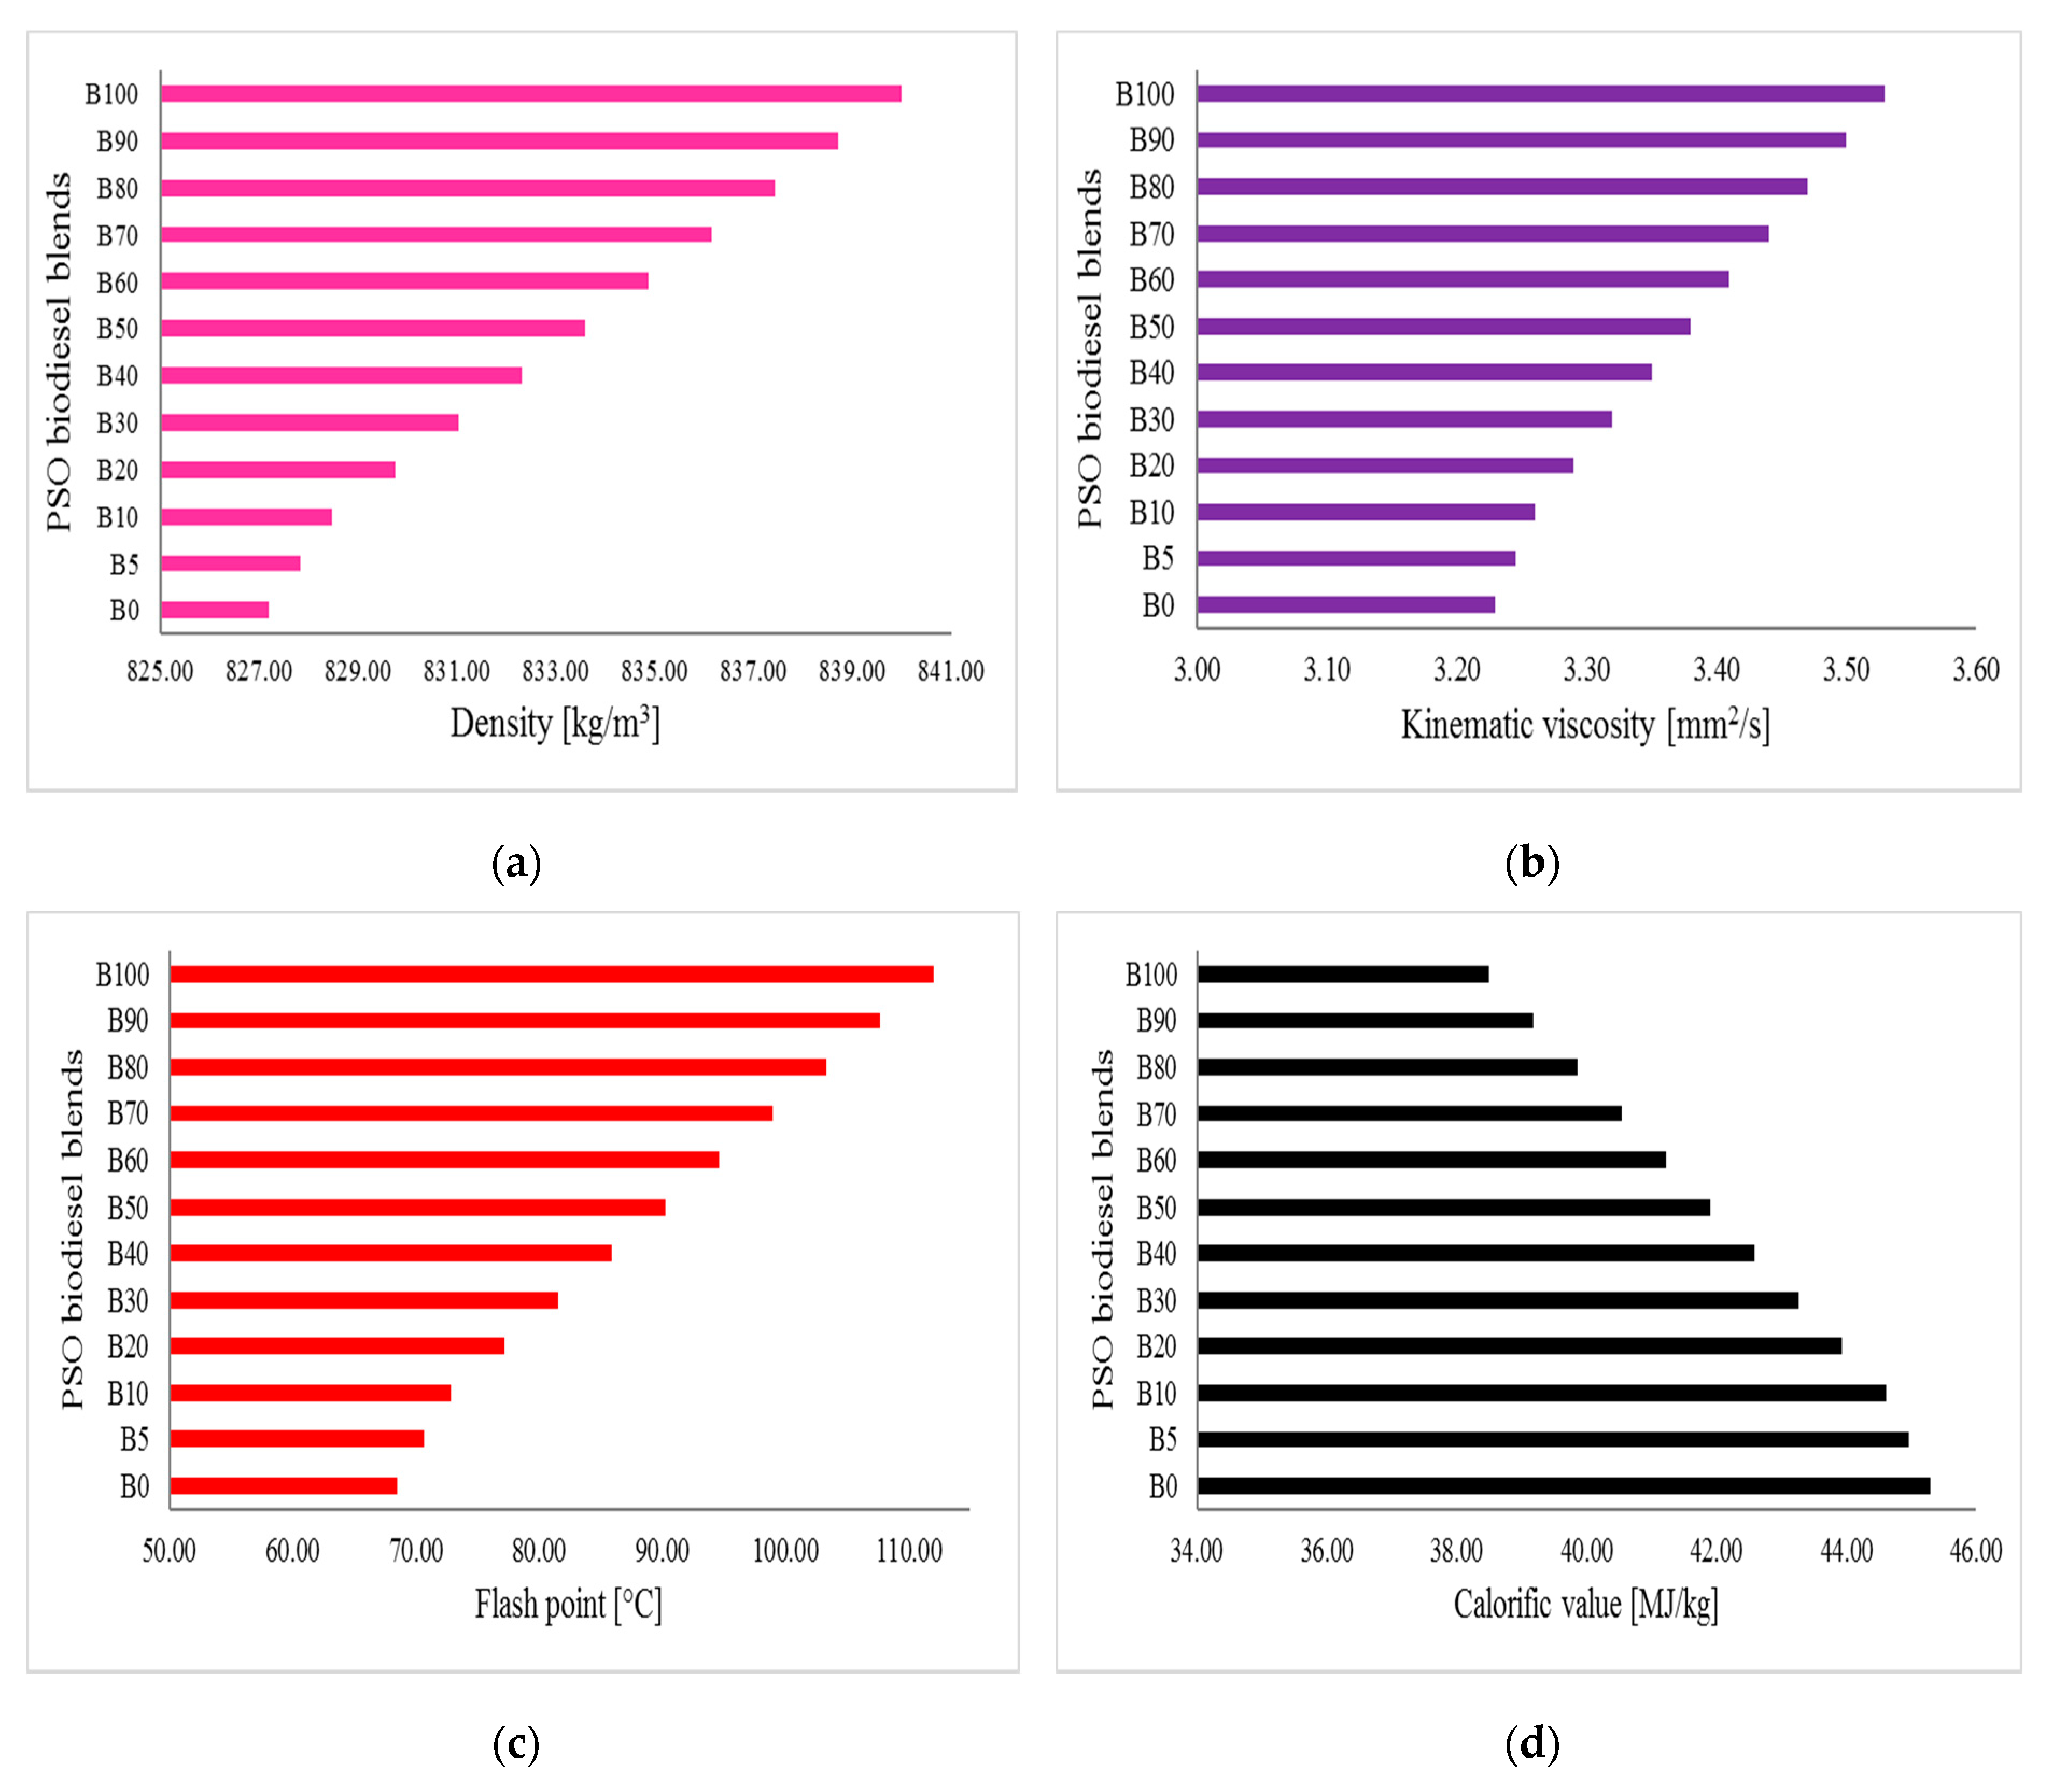
While the engine performance experiments in this study investigated B5, B10, and B20 biodiesel blends, the characteristics of a much broader series of PSO biodiesel-diesel blends has been investigated. A total of 10 PSO biodiesel-diesel blends (from B5-B90) were prepared, and their individual fuel properties of density, viscosity, flash point, calorific value, and oxidation stability have been analysed and are presented in
Figure 4a–e.
Density is one of the vital properties of biodiesel that affects fuel atomisation efficiency in an airless combustion system [
16]. According to relevant ASTM and EN standards, the density of biodiesel at 15 °C should be in the range of 860–900 kg/m
3. The densities of B5 (827.84 kg/m
3), B10 (828.48 kg/m
3), and B20 (829.76 kg/m
3) were very close to that of B0 diesel (827.20 kg/m
3). Generally, biodiesel has a slightly higher density than diesel. In addition, density increased as the percentage of PSO biodiesel in the blends increased (
Figure 4a).
Some vegetable oils have a higher viscosity, which causes poor fuel flow. Raw PSO has a viscosity of 27.3 mm
2/s, which is 8–9 times higher than diesel (B0). However, after the transesterification process, the viscosity of PSO drops to an acceptable limit. Generally, the viscosity of biodiesel ranges from 1.9–6.0 mm
2/s, and all PSO biodiesel-diesel blends in
Figure 4b fulfill this requirement. However, the viscosity of B5 (3.25 mm
2/s), B10 (3.26 mm
2/s), B20 (3.29 mm
2/s), and B30 (3.32 mm
2/s) were very close to B0 (3.23 mm
2/s). Therefore, those blends (B10–B30) can be used as a diesel engine fuel without any modifications to the engine.
According to ASTM D6751, the flashpoint should be 100–170 °C, and all of the biodiesel-diesel blends met that requirement as well. The flash point of B0 was recorded as 68.50 °C, whereas B5, B10, and B20 were found to be 70.68 °C, 72.85 °C, and 77.20 °C, respectively. Biodiesel tends to a higher flash point than diesel, and
Figure 4c shows the pattern of the increased flash point with increased biodiesel blends. The more the flashpoint is above 66 °C is indicative of a safer fuel with better storage ability [
1,
17]. From that perspective, all PSO biodiesel-diesel blends can be stored safely and they can be used to fuel a diesel engine without any modifications.
Calorific value is another important property in the selection of any fuel.
Figure 4d shows that pure PSO biodiesel and all of its blends have slightly lower calorific values than diesel although they are within the requirements of international standards. Biodiesel has nearly 10% more oxygen content than diesel, and less hydrogen-carbon content hence will produce less thermal energy [
17]. Calorific values of B5 (44.96 MJ/kg), B10 (44.62 MJ/kg), and B20 (43.94 MJ/kg) blends are very close to B0 (45.30 MJ/kg).
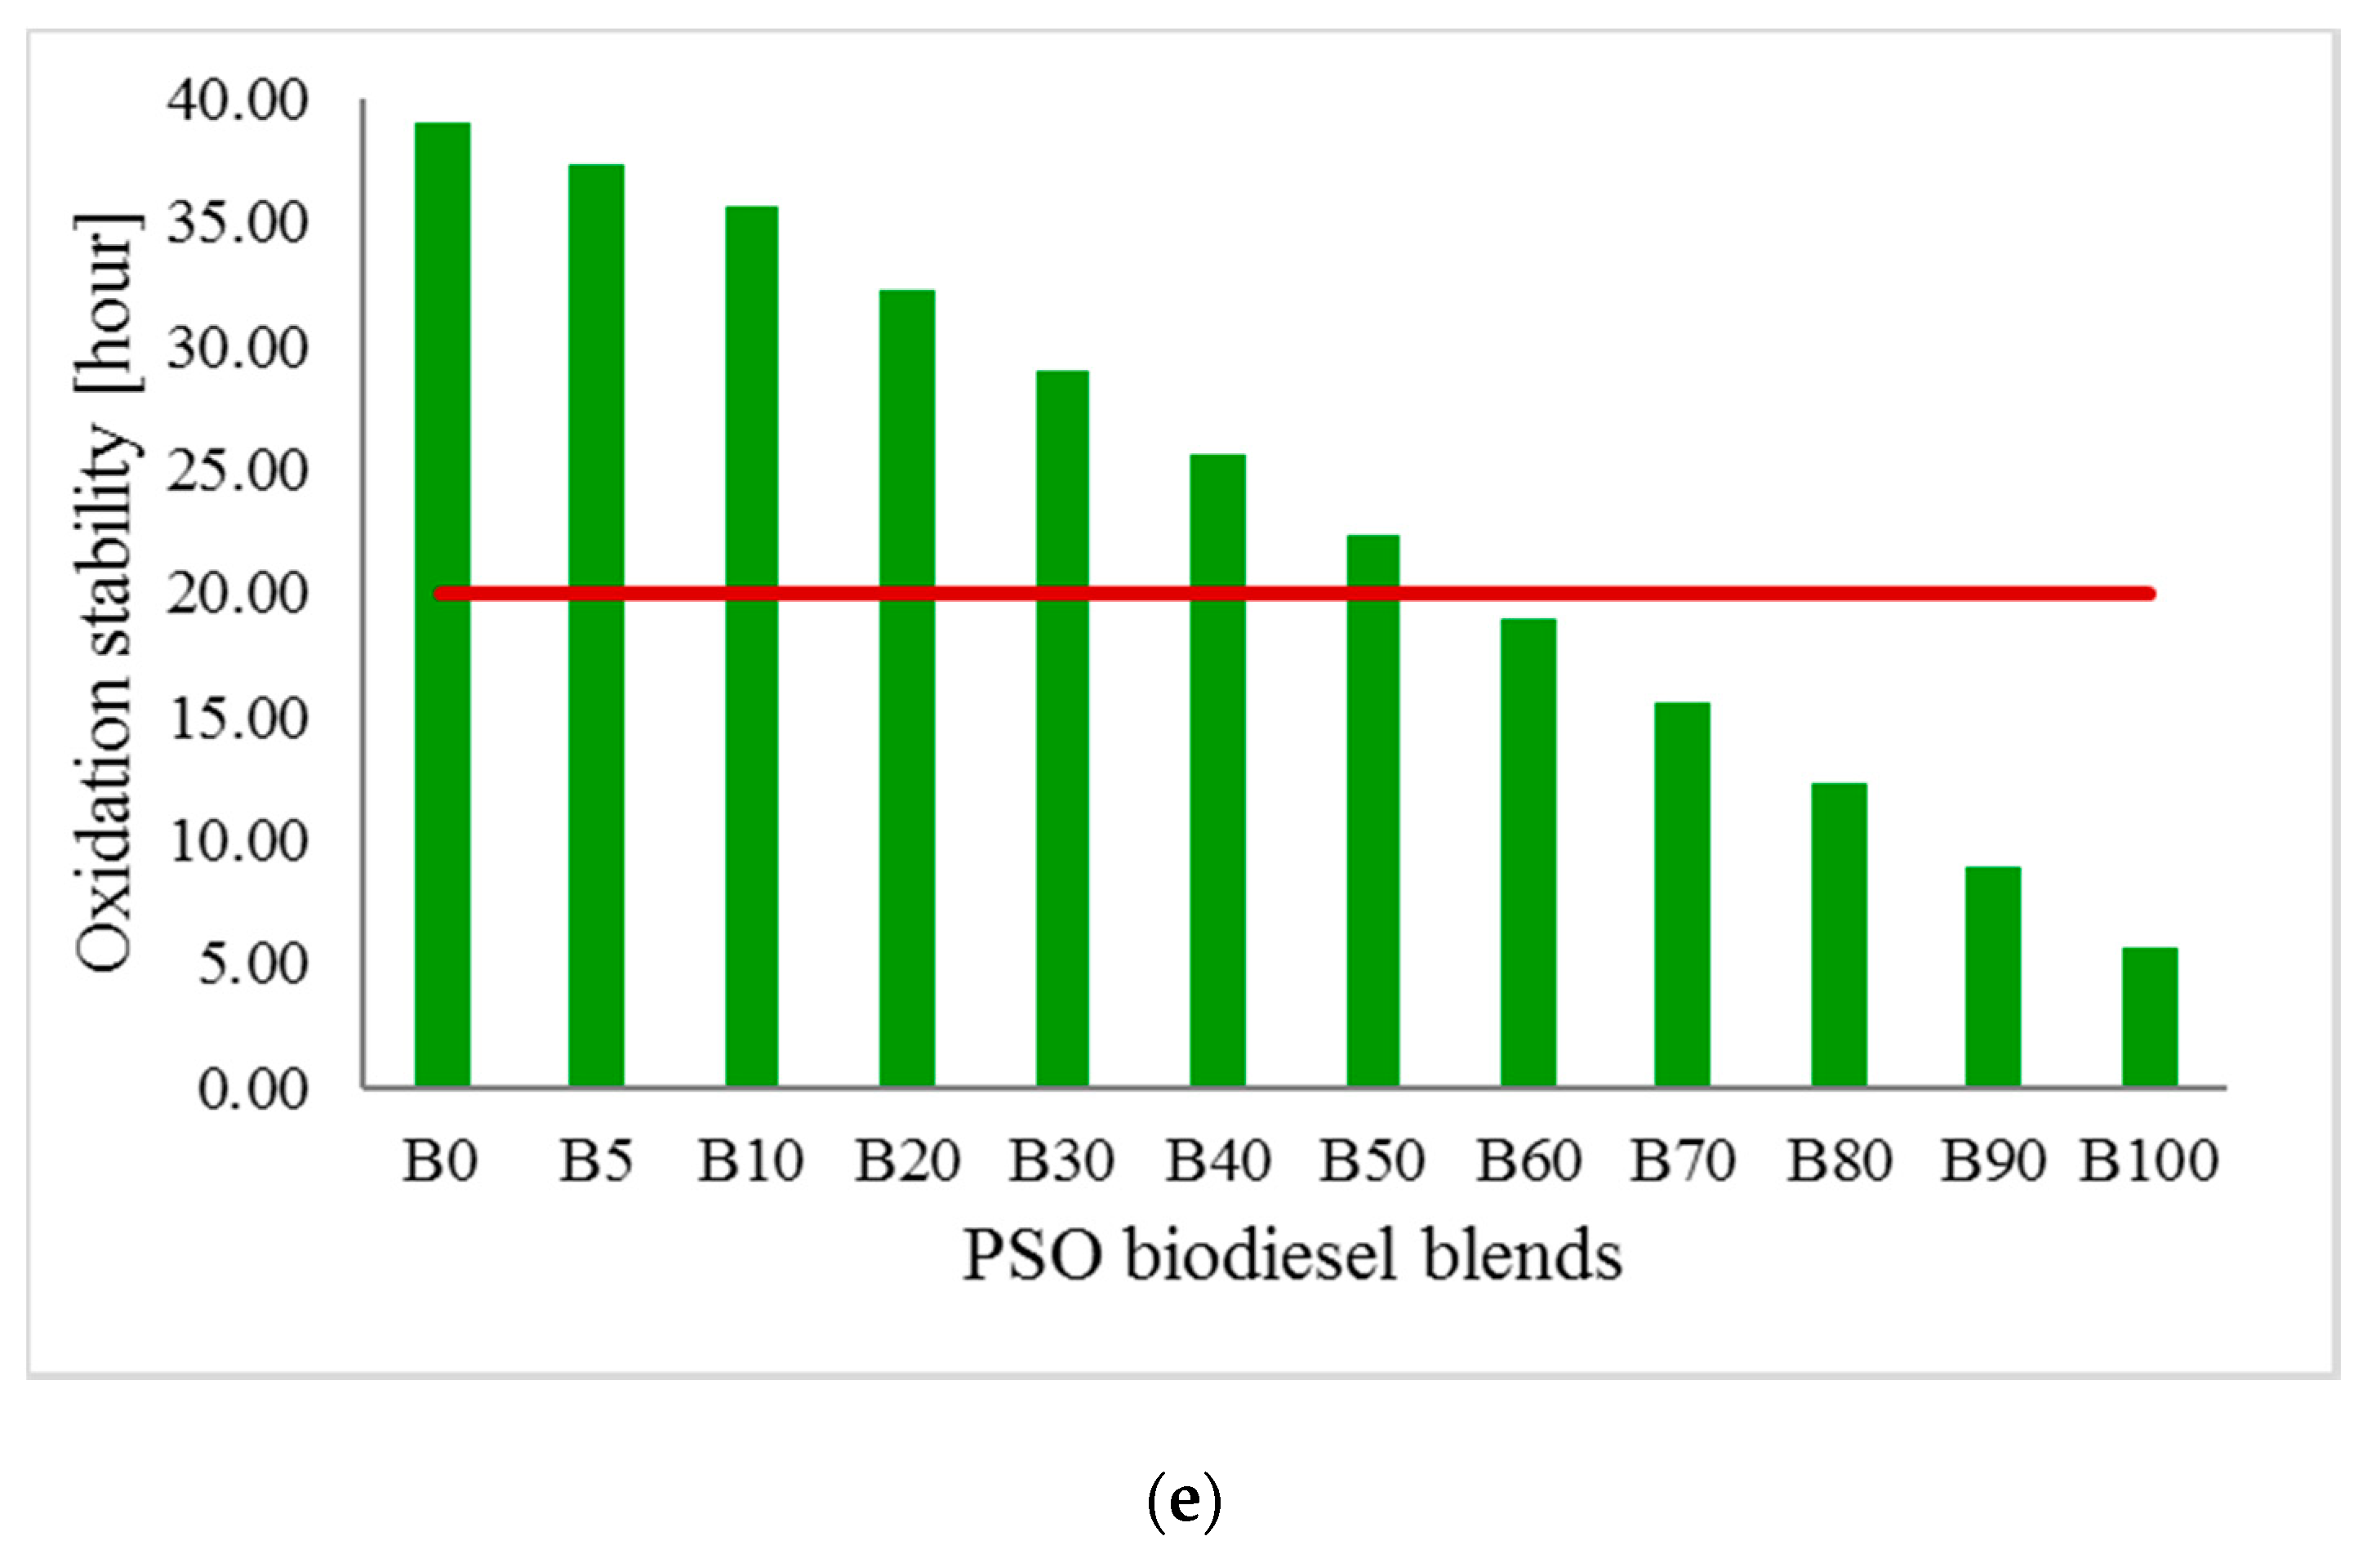
Another vital fuel property is oxidation stability (OS), as it indicates the degree of oxidation that occurs during prolonged storage. Hasni et al. [
18] mentioned that lower oxidation stability could adversely affect fuel quality. The higher the oxidation stability, the better the fuel quality. As the PSO biodiesel (unsaturated fatty acid) percentage increases, the OS decreases, which is shown in
Figure 4e. As per European standard EN 590, the minimum OS of any fuel should be 20 h (indicated by the red line on the
Figure 4e). PSO biodiesel-diesel blends B5 to B50 meet that standard. B5 has an OS value of 37.33 h and B50 is 22.31 h, while B0 has an OS value of 39 h. According to ASTM D6751 and EN14214, the minimum OS values are 3 and 6 h respectively. This study found the 100% PSO biodiesel has an OS value of 5.61 h, which falls within the ASTM and close to EN standards.
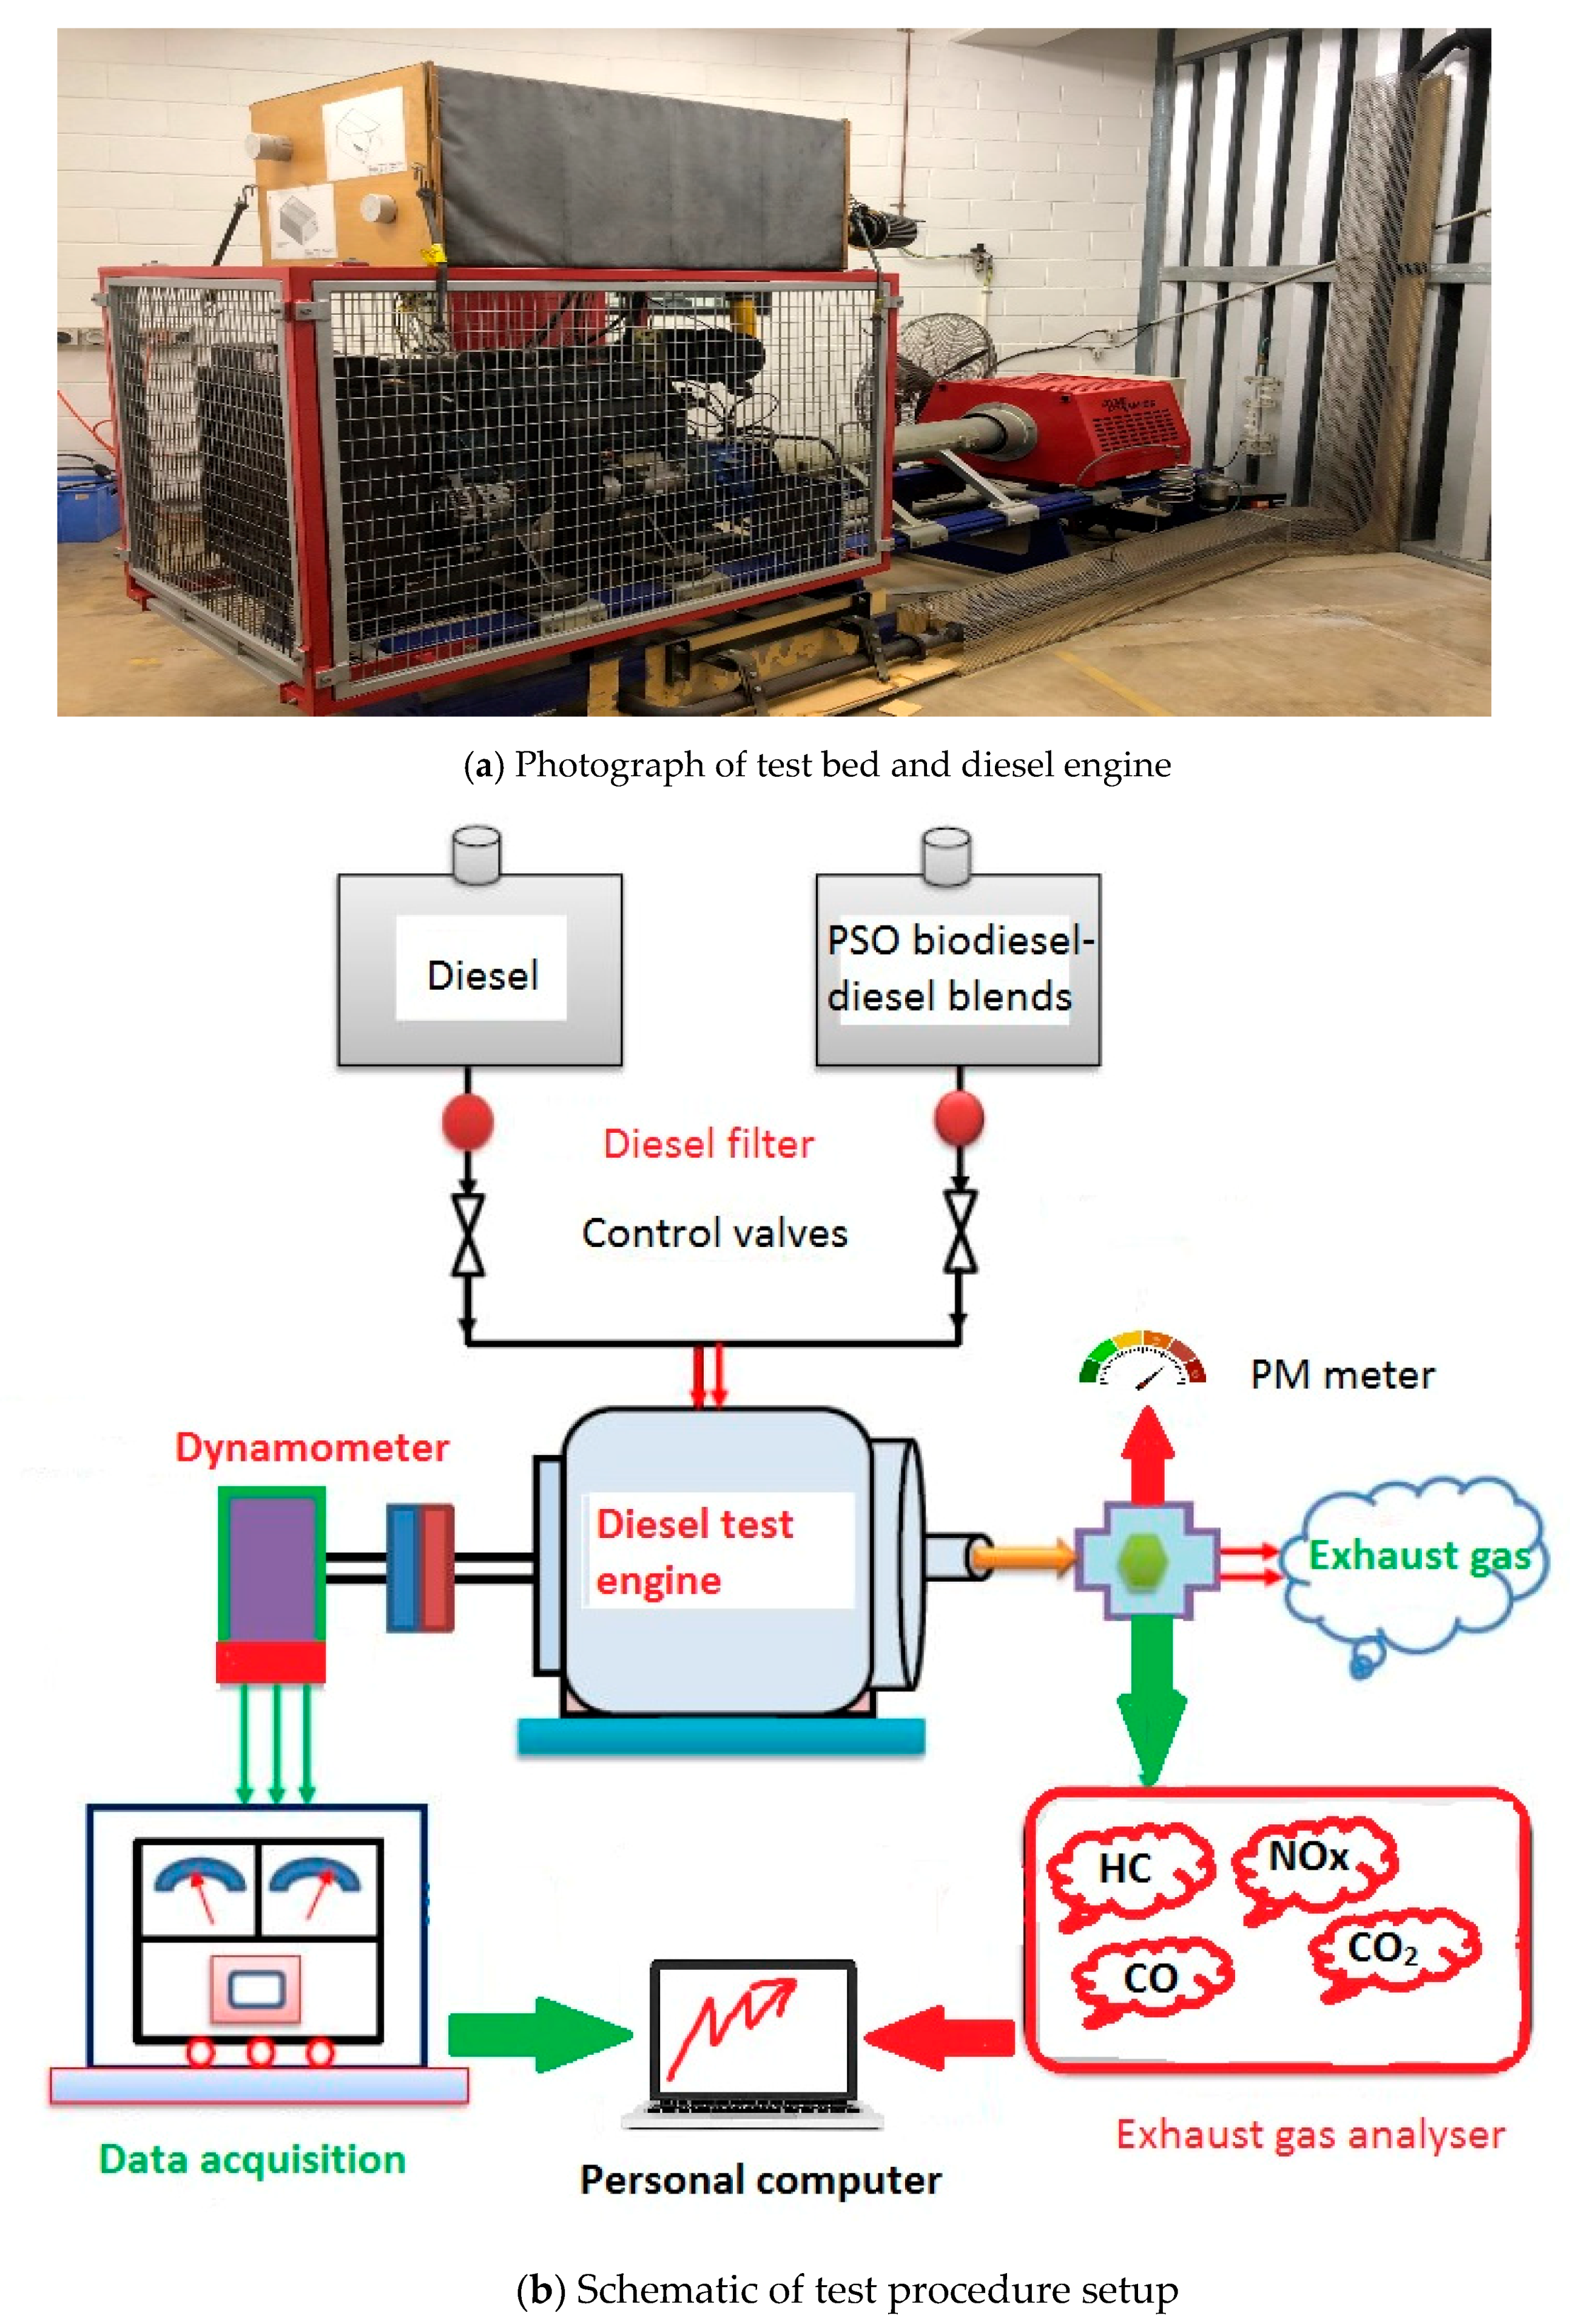
3.3. Interaction Effects of Operating Parameters on PSO Engine Performance
The complex interaction effects of operating parameters, such as biodiesel blends, load, and speed, on each engine output response (BP, torque, BSFC, and BTE) could not be analysed independently. The significance of each of the various parameters in the model was obtained via analysis of variance (ANOVA). The experiments were carried out by use of the Box-Behnken response surface design. Minitab 18 was used to carry out the statistical analysis.
Table 7 shows the factors and the range and levels of the investigated variables.
Once the experiments were completed, a full quadratic model was applied for the correlation of the response variable to the independent variables. The form of the full quadratic model is shown in Equation (2).
where R is the response factor; P
0 is a constant; P
1, P
2, P
3 are regression coefficients, P
1,1, P
1,2, P
1,3, P
2,2, P
2,3, and P
3,3 are quadratic coefficient; and, Q
1, Q
2, and Q
3 are independent variables.
Consideration was given to the linear, quadratic and combined effects of operating parameters to identify their impacts on the response. Each parameter’s the significance was evaluated by the probability value (p-value) from ANOVA. At the 95% confidence level, the p-values less than 0.05 indicate a ‘significant’ effect of those parameters on the response. In other words, p-values more than 5% or 0.05 indicate ‘not-significant’ effects of those parameters on the response.
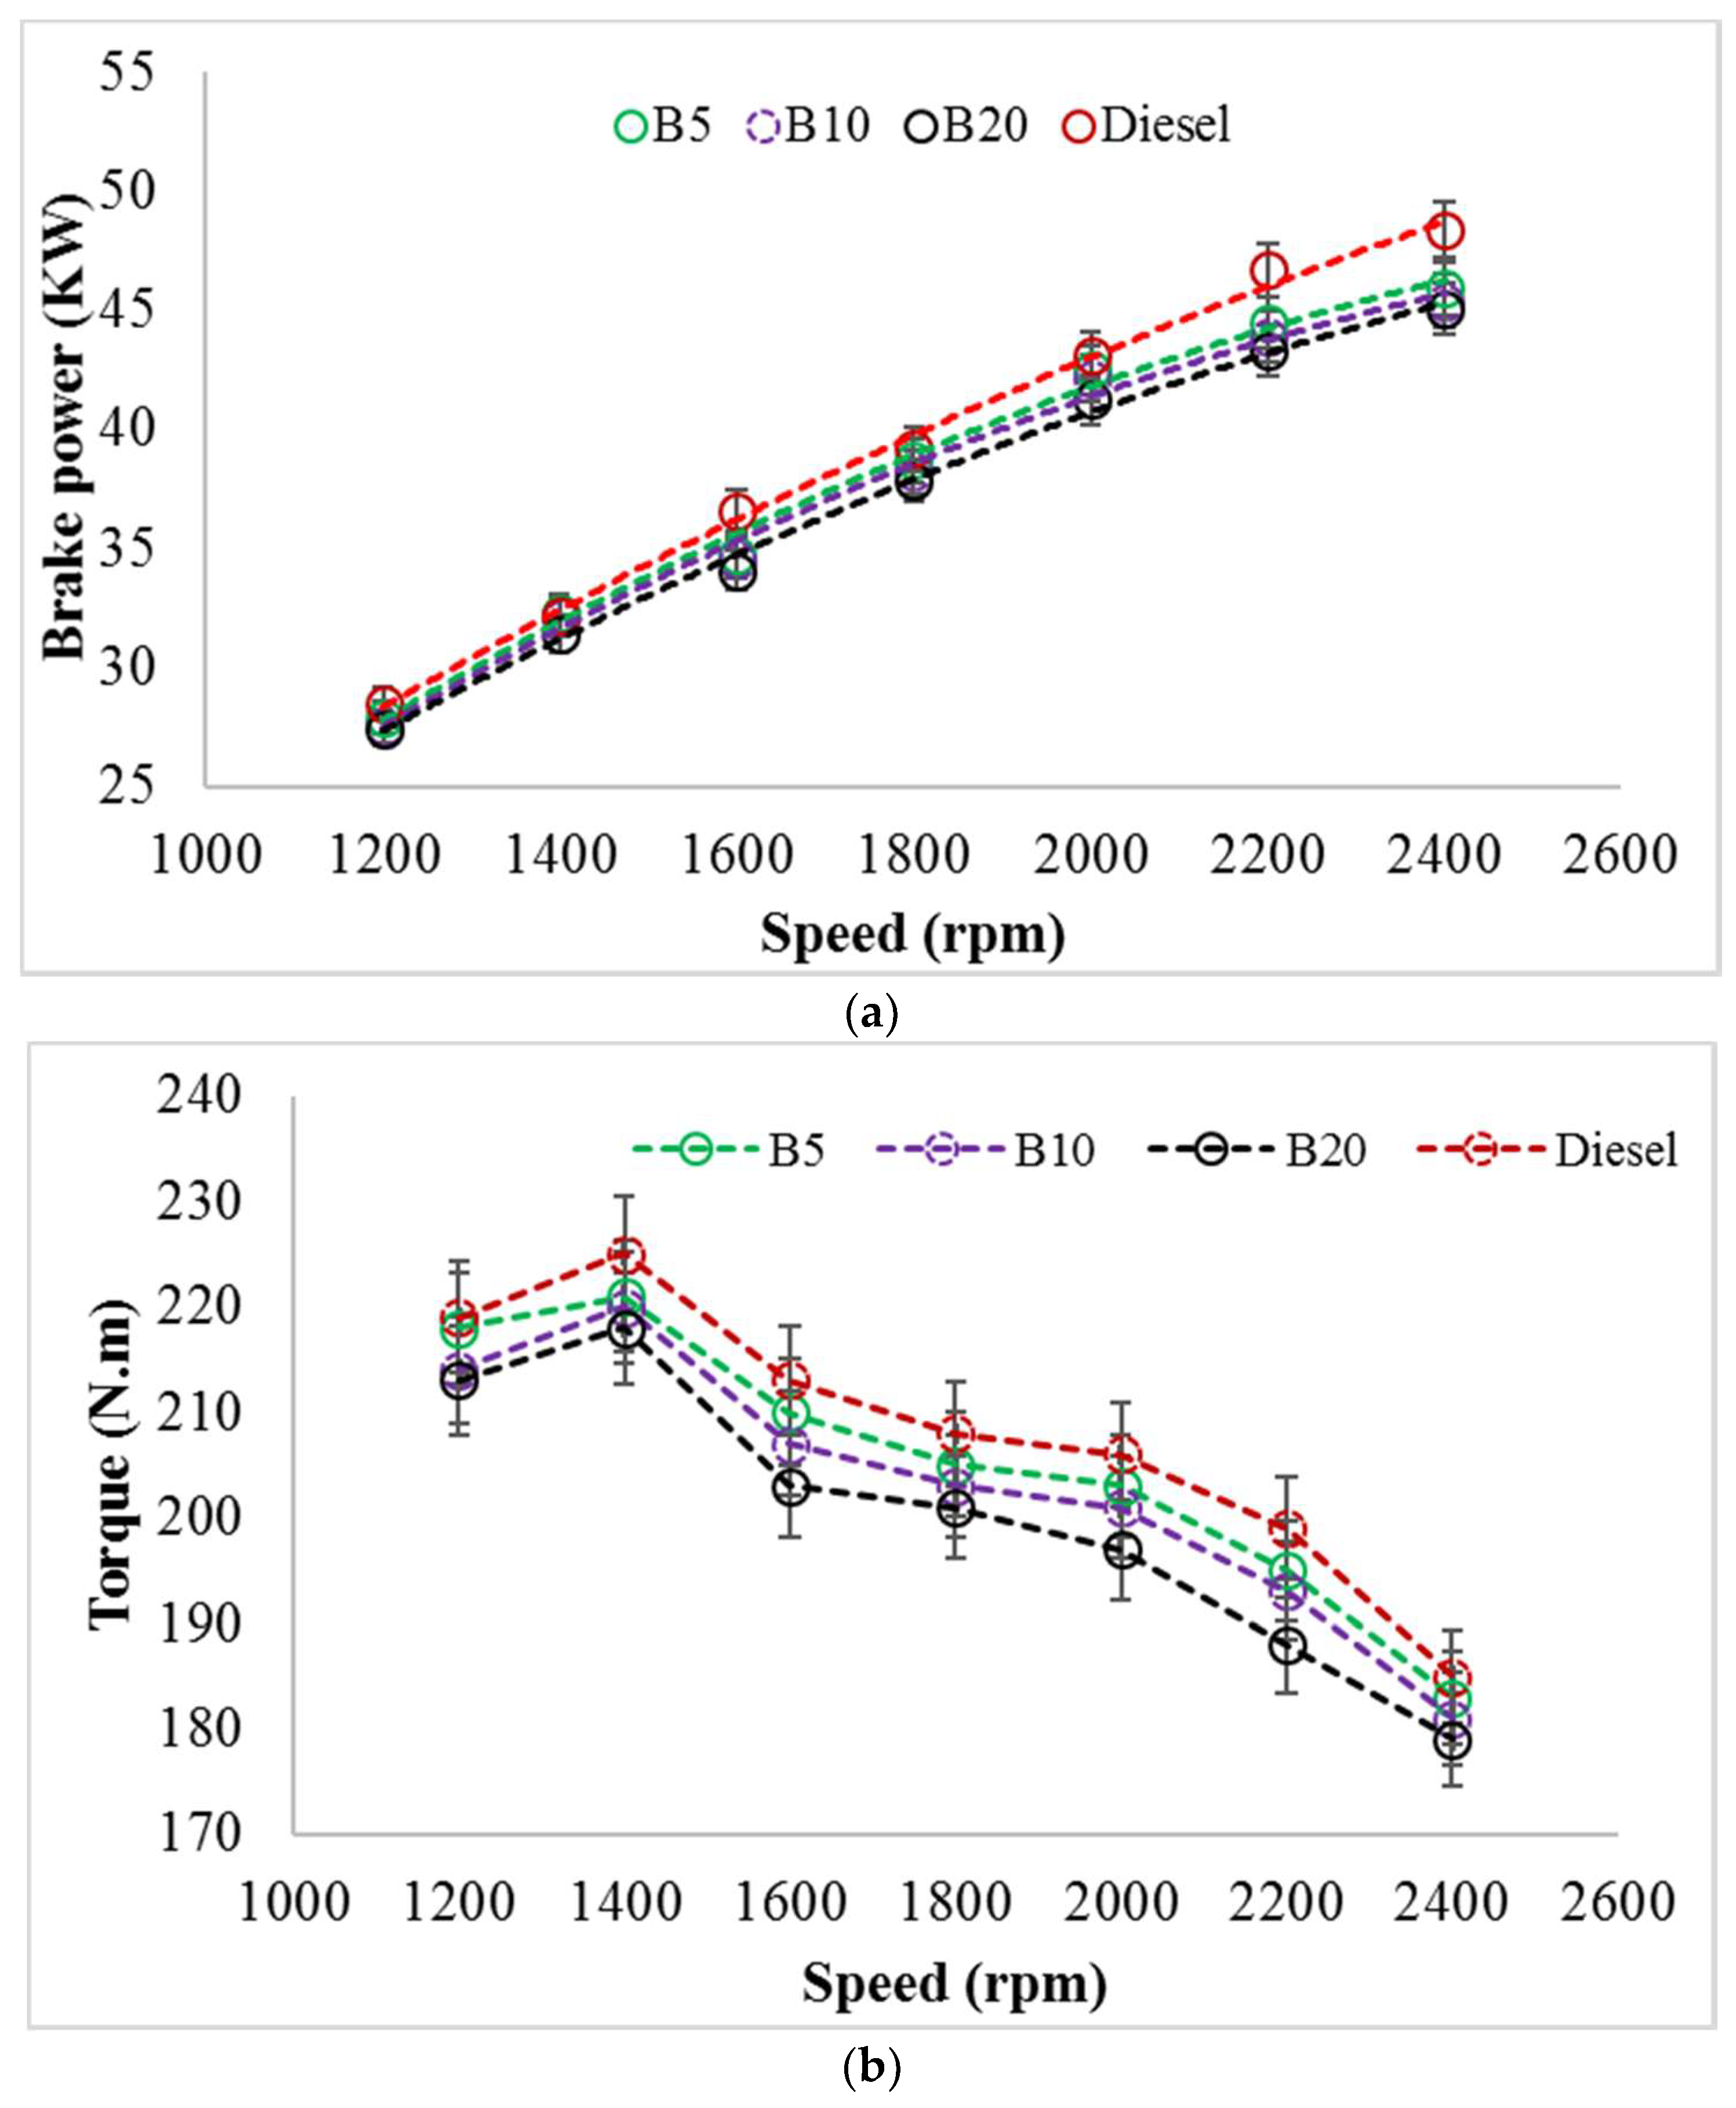
3.3.1. Effects of Biodiesel Blends, Load and Speed on Brake Power (BP)
The relationships between brake power and three operating parameters of biodiesel blends, load, and speed were analysed. A quadratic regression model based on the coded parameters with determined coefficients for statistical prediction as defined by Equation (3) was developed using Minitab 18 to predict BP (kW) as a function of biodiesel blends (BL), load (LD), and speed (SP).
p-values from
Table 8 show that the model is highly significant with an insignificant lack of fit. When considering the linear, quadratic, and combined effects, BL is not significant as a linear parameter; also, none of the quadratic terms is significant. Only the combined effects of LD and SP are highly significant, whereas BL and SP have a significant effect on BP. The ANOVA results in
Table 8 also show that both LD and SP have the lowest
p-values (<0.0001 each) and highest F-values (3307.29 and 199.74). According to the quadratic Equation (3), both LD and SP have positive effects on BP. This means that increasing the LD and SP will increase BP as well. The coefficient of determination (R
2) and the adjusted coefficient of determination (adj. R
2) were 99.86% and 99.61%, respectively, which indicates a high accuracy for the model.
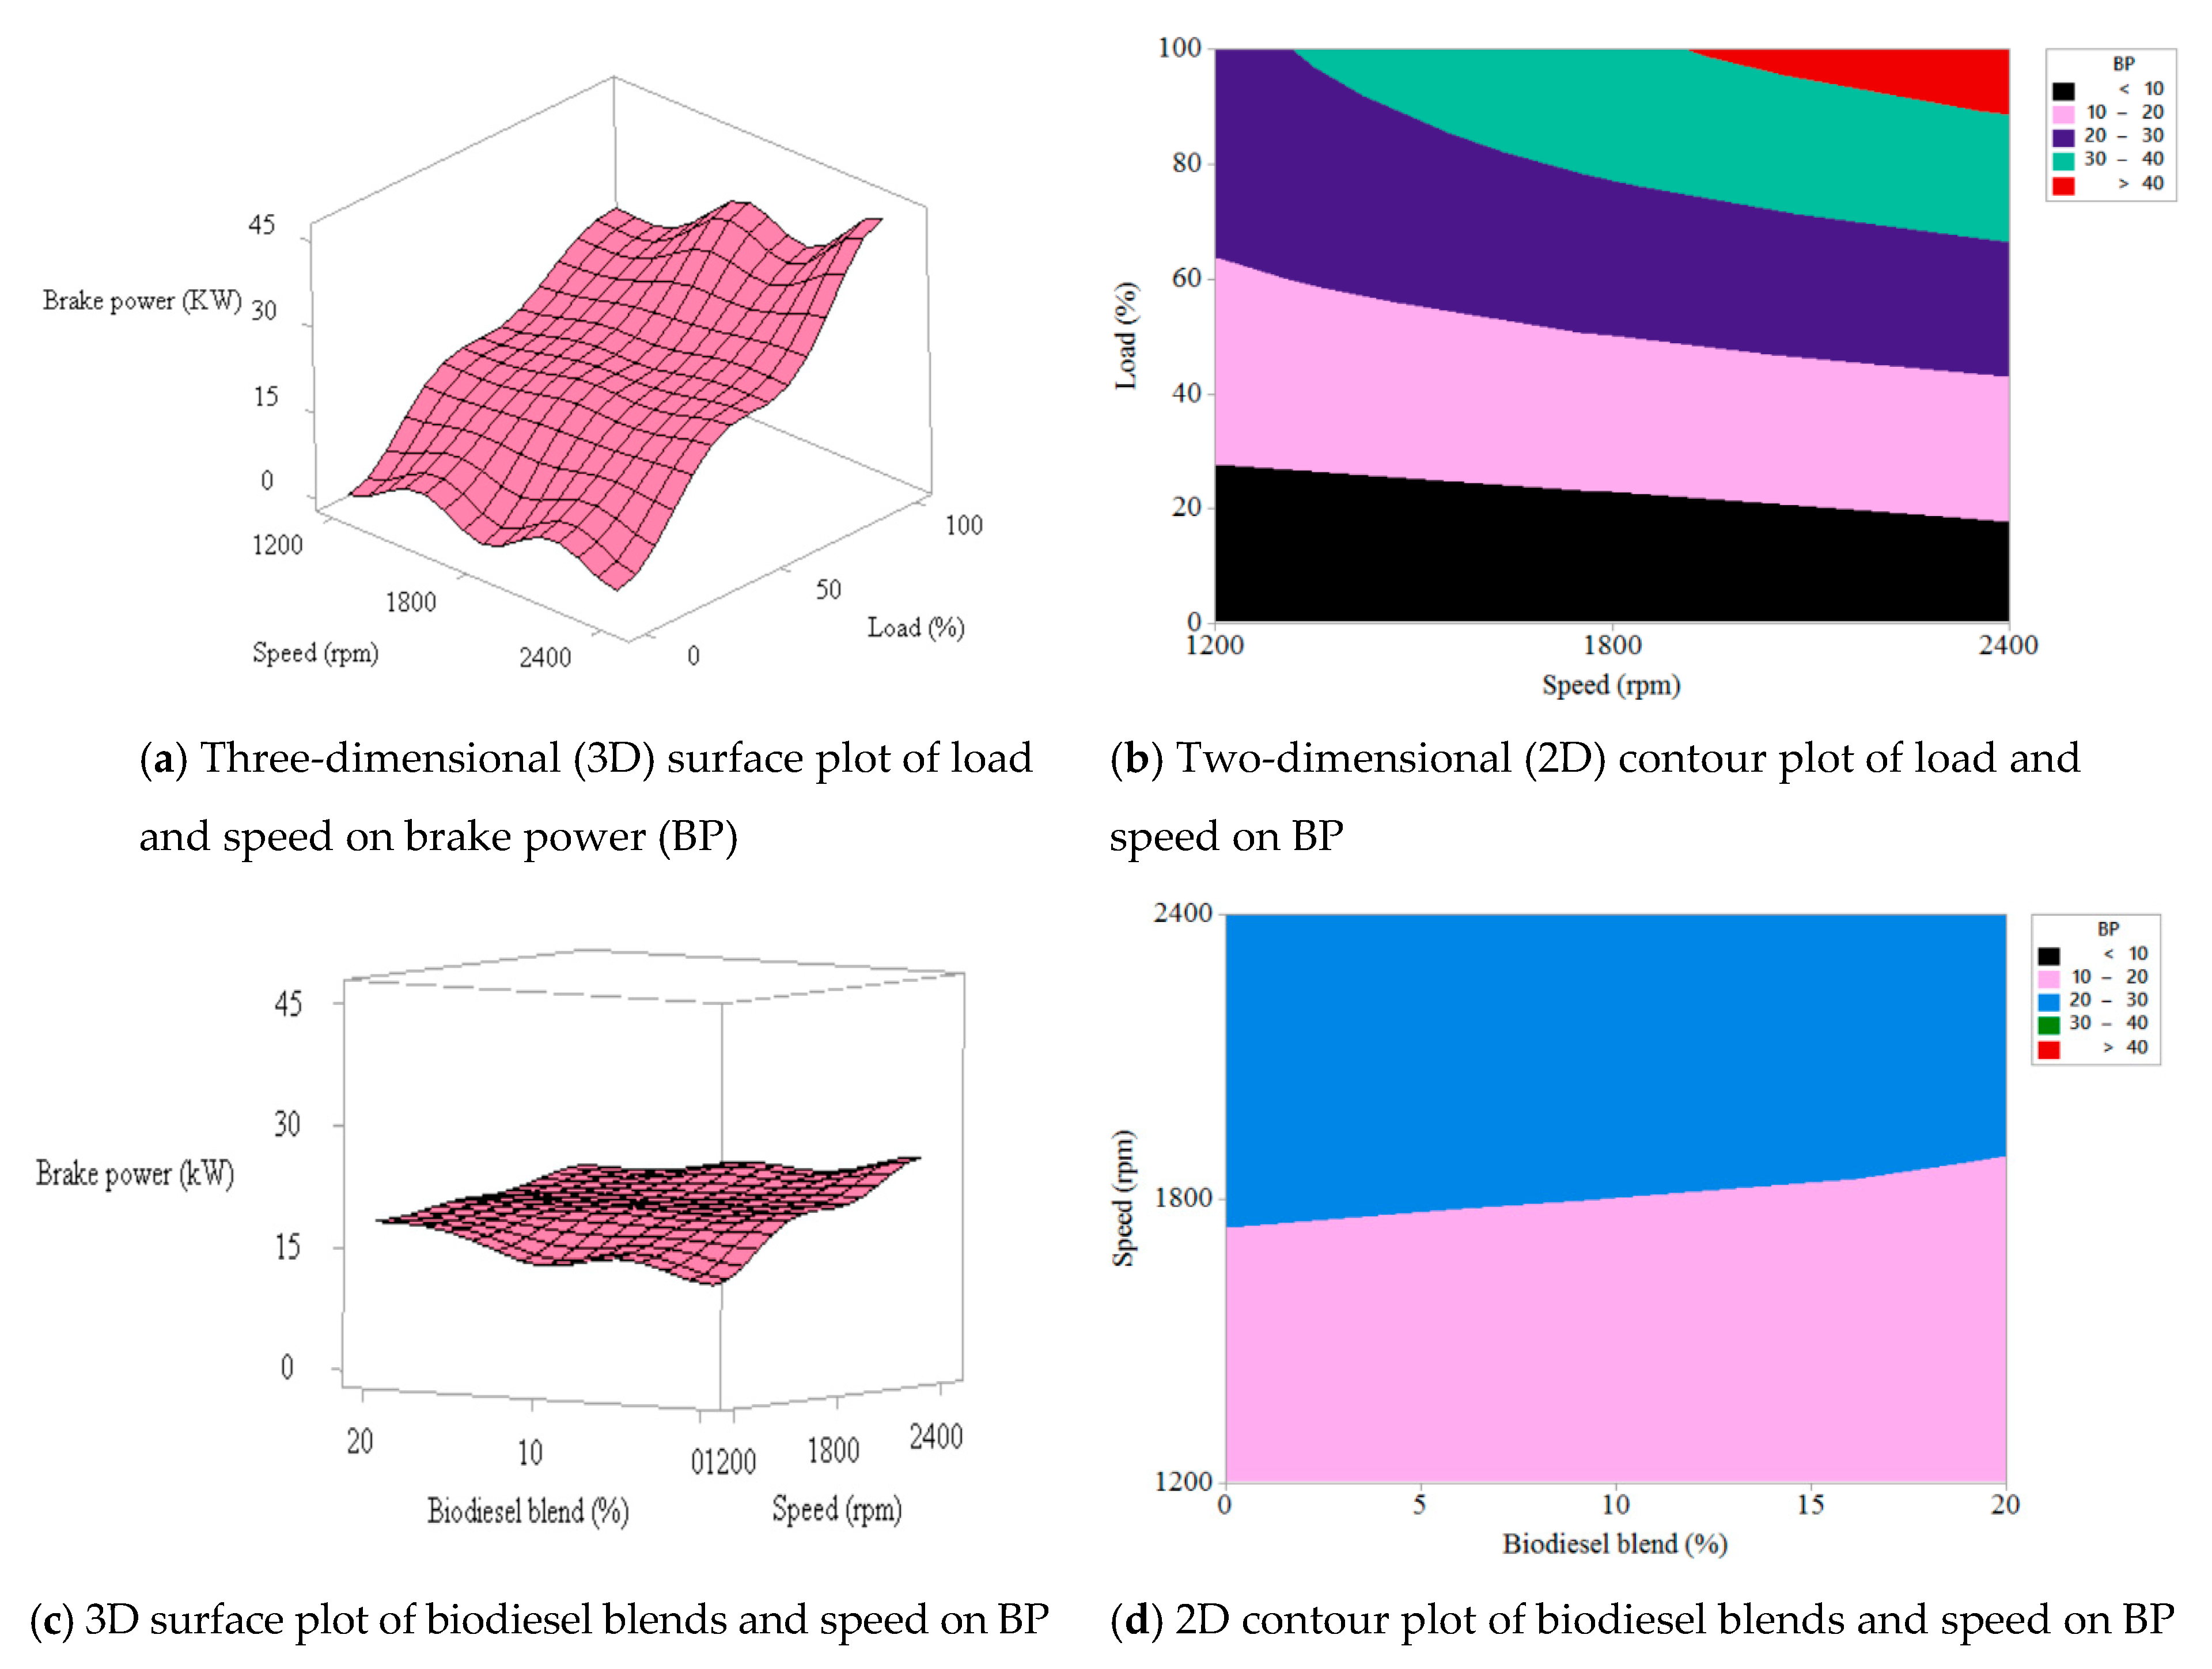
The ANOVA results in
Table 8 for both LD × SP, and BL × SP interaction effects on BP are shown graphically in
Figure 6. The three-dimensional (3D) surface plot and two-dimensional (2D) contour plot of LD and SP effects on BP are presented in
Figure 6a,b respectively. BP (kW) increases with the increase of LD up to 100% and exceeds 40 kW with SP of 2000 rpm onwards. The maximum BP was found to be 45 kW at 2400 rpm. At 50% LD, the average BP value was recorded at about 20 kW with minimum effects from SP. However, the combined effects of LD and SP on BP are more significant with an increase of LD above 50%.
Figure 6c,d present the 3D surface plot and 2D contour plot, respectively, which show only minor influences of changes of BL and SP on BP. It is therefore concluded that BL has a slight effect on BP, irrespective of SP changes.
3.3.2. Effects of Biodiesel Blends, Load, and Speed on Torque
The relationships between torque and three operating parameters of biodiesel blend, load, and speed were analysed. Based on the coded parameters, a quadratic regression model with determined coefficients for statistical prediction, as defined by Equation (4), was developed using Minitab 18 to predict torque (N.m) as a function of biodiesel blend (BL), load (LD), and speed (SP).
p-values from
Table 9 show that the model is highly significant with an insignificant lack of fit. When considering the linear, quadratic, and combined effects, only the combined effects of BL and LD are not significant. The ANOVA results in
Table 9 show that LD is not significant, as it has the lowest
p-value and highest F-value, while BL is found to be significant and all other parameters are highly significant. According to the quadratic Equation (4), both LD and BL have positive effects on torque. This means that increasing the LD and BL will increase torque as well. The coefficient of determination (R
2) and the adjusted coefficient of determination (adj. R
2) were 99.96% and 99.89%, respectively, which indicates the high accuracy of the model.
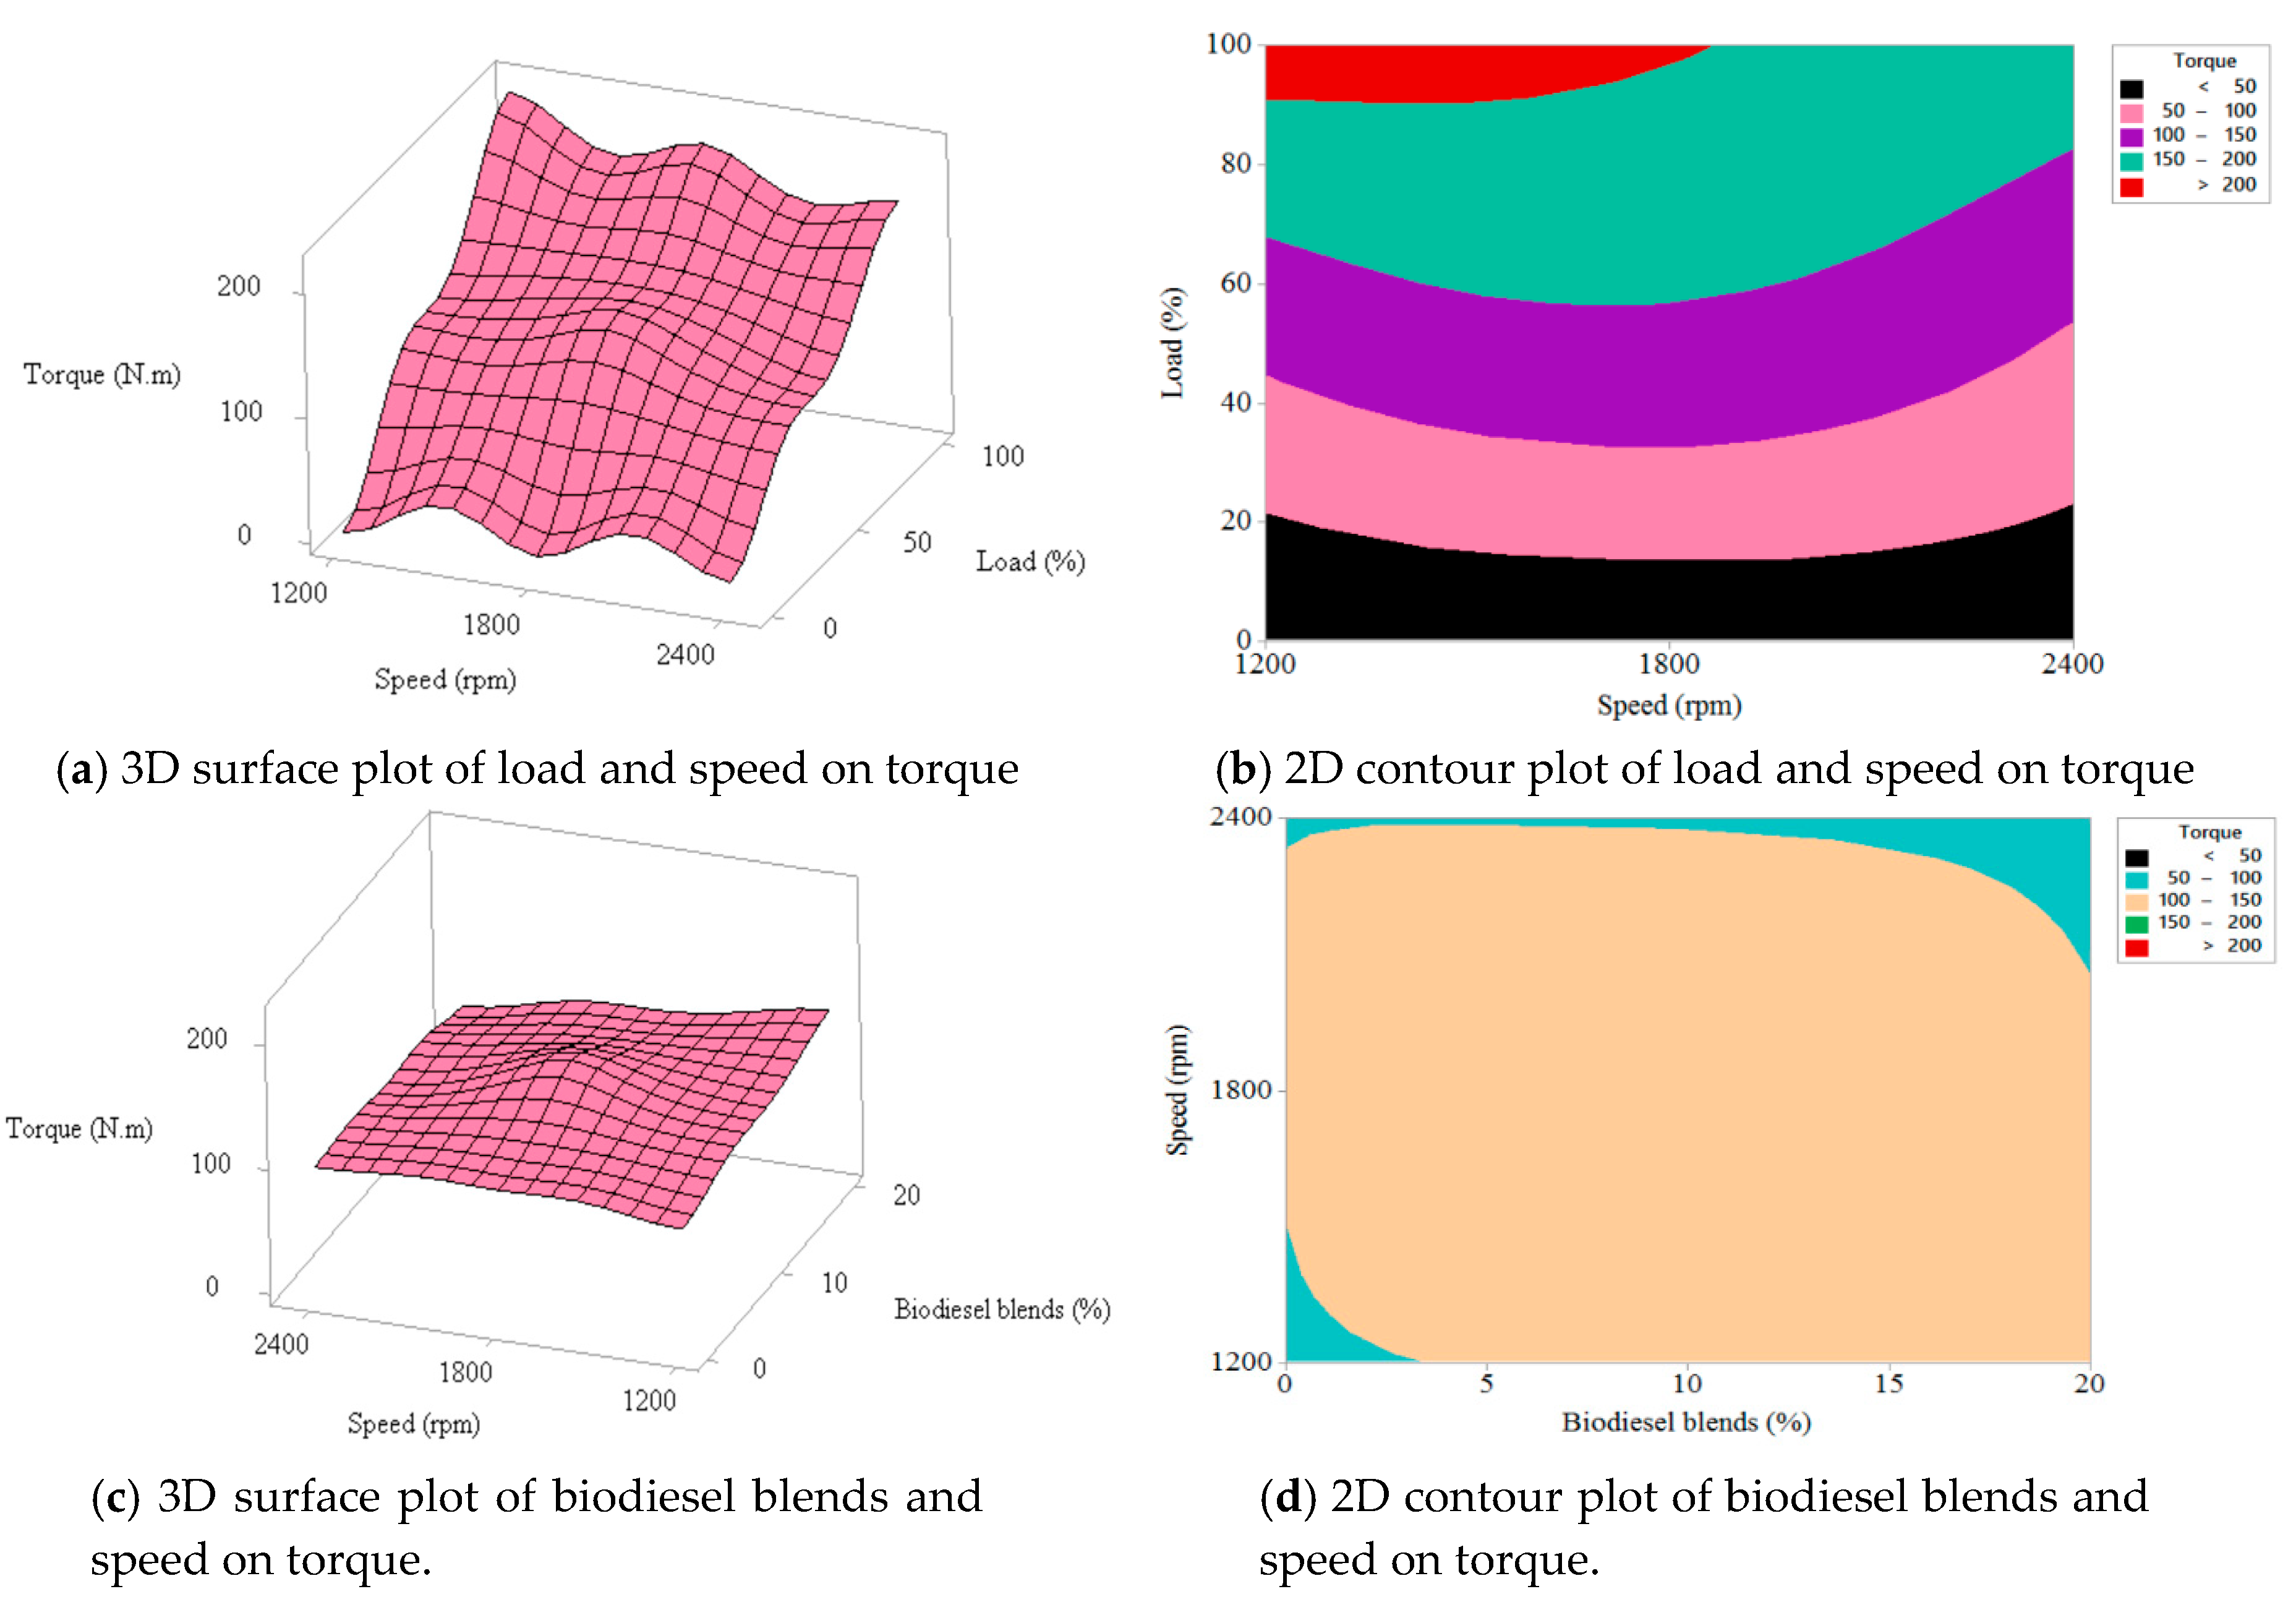
The ANOVA results in
Table 9 for LD × SP, and BL × SP interaction effects on torque are shown graphically in
Figure 7. The 3D surface plot and 2D contour plot of LD and SP effects on torque are presented in
Figure 7a,b, respectively. Torque (Nm) decreases with the increase of SP at 100% LD. The maximum torque was found to be 220 Nm at 1400 rpm. At 50% LD, the average torque was recorded as about 120 Nm with minimum effects from SP. However, the combined effects of LD and SP on torque are more significant with an increase of LD above 50%.
Figure 7c,d present the 3D surface plot and 2D contour plot, respectively, which show only minor influences of changes of BL and SP on torque. It is therefore concluded that BL has a slight effect on torque, irrespective of SP changes.
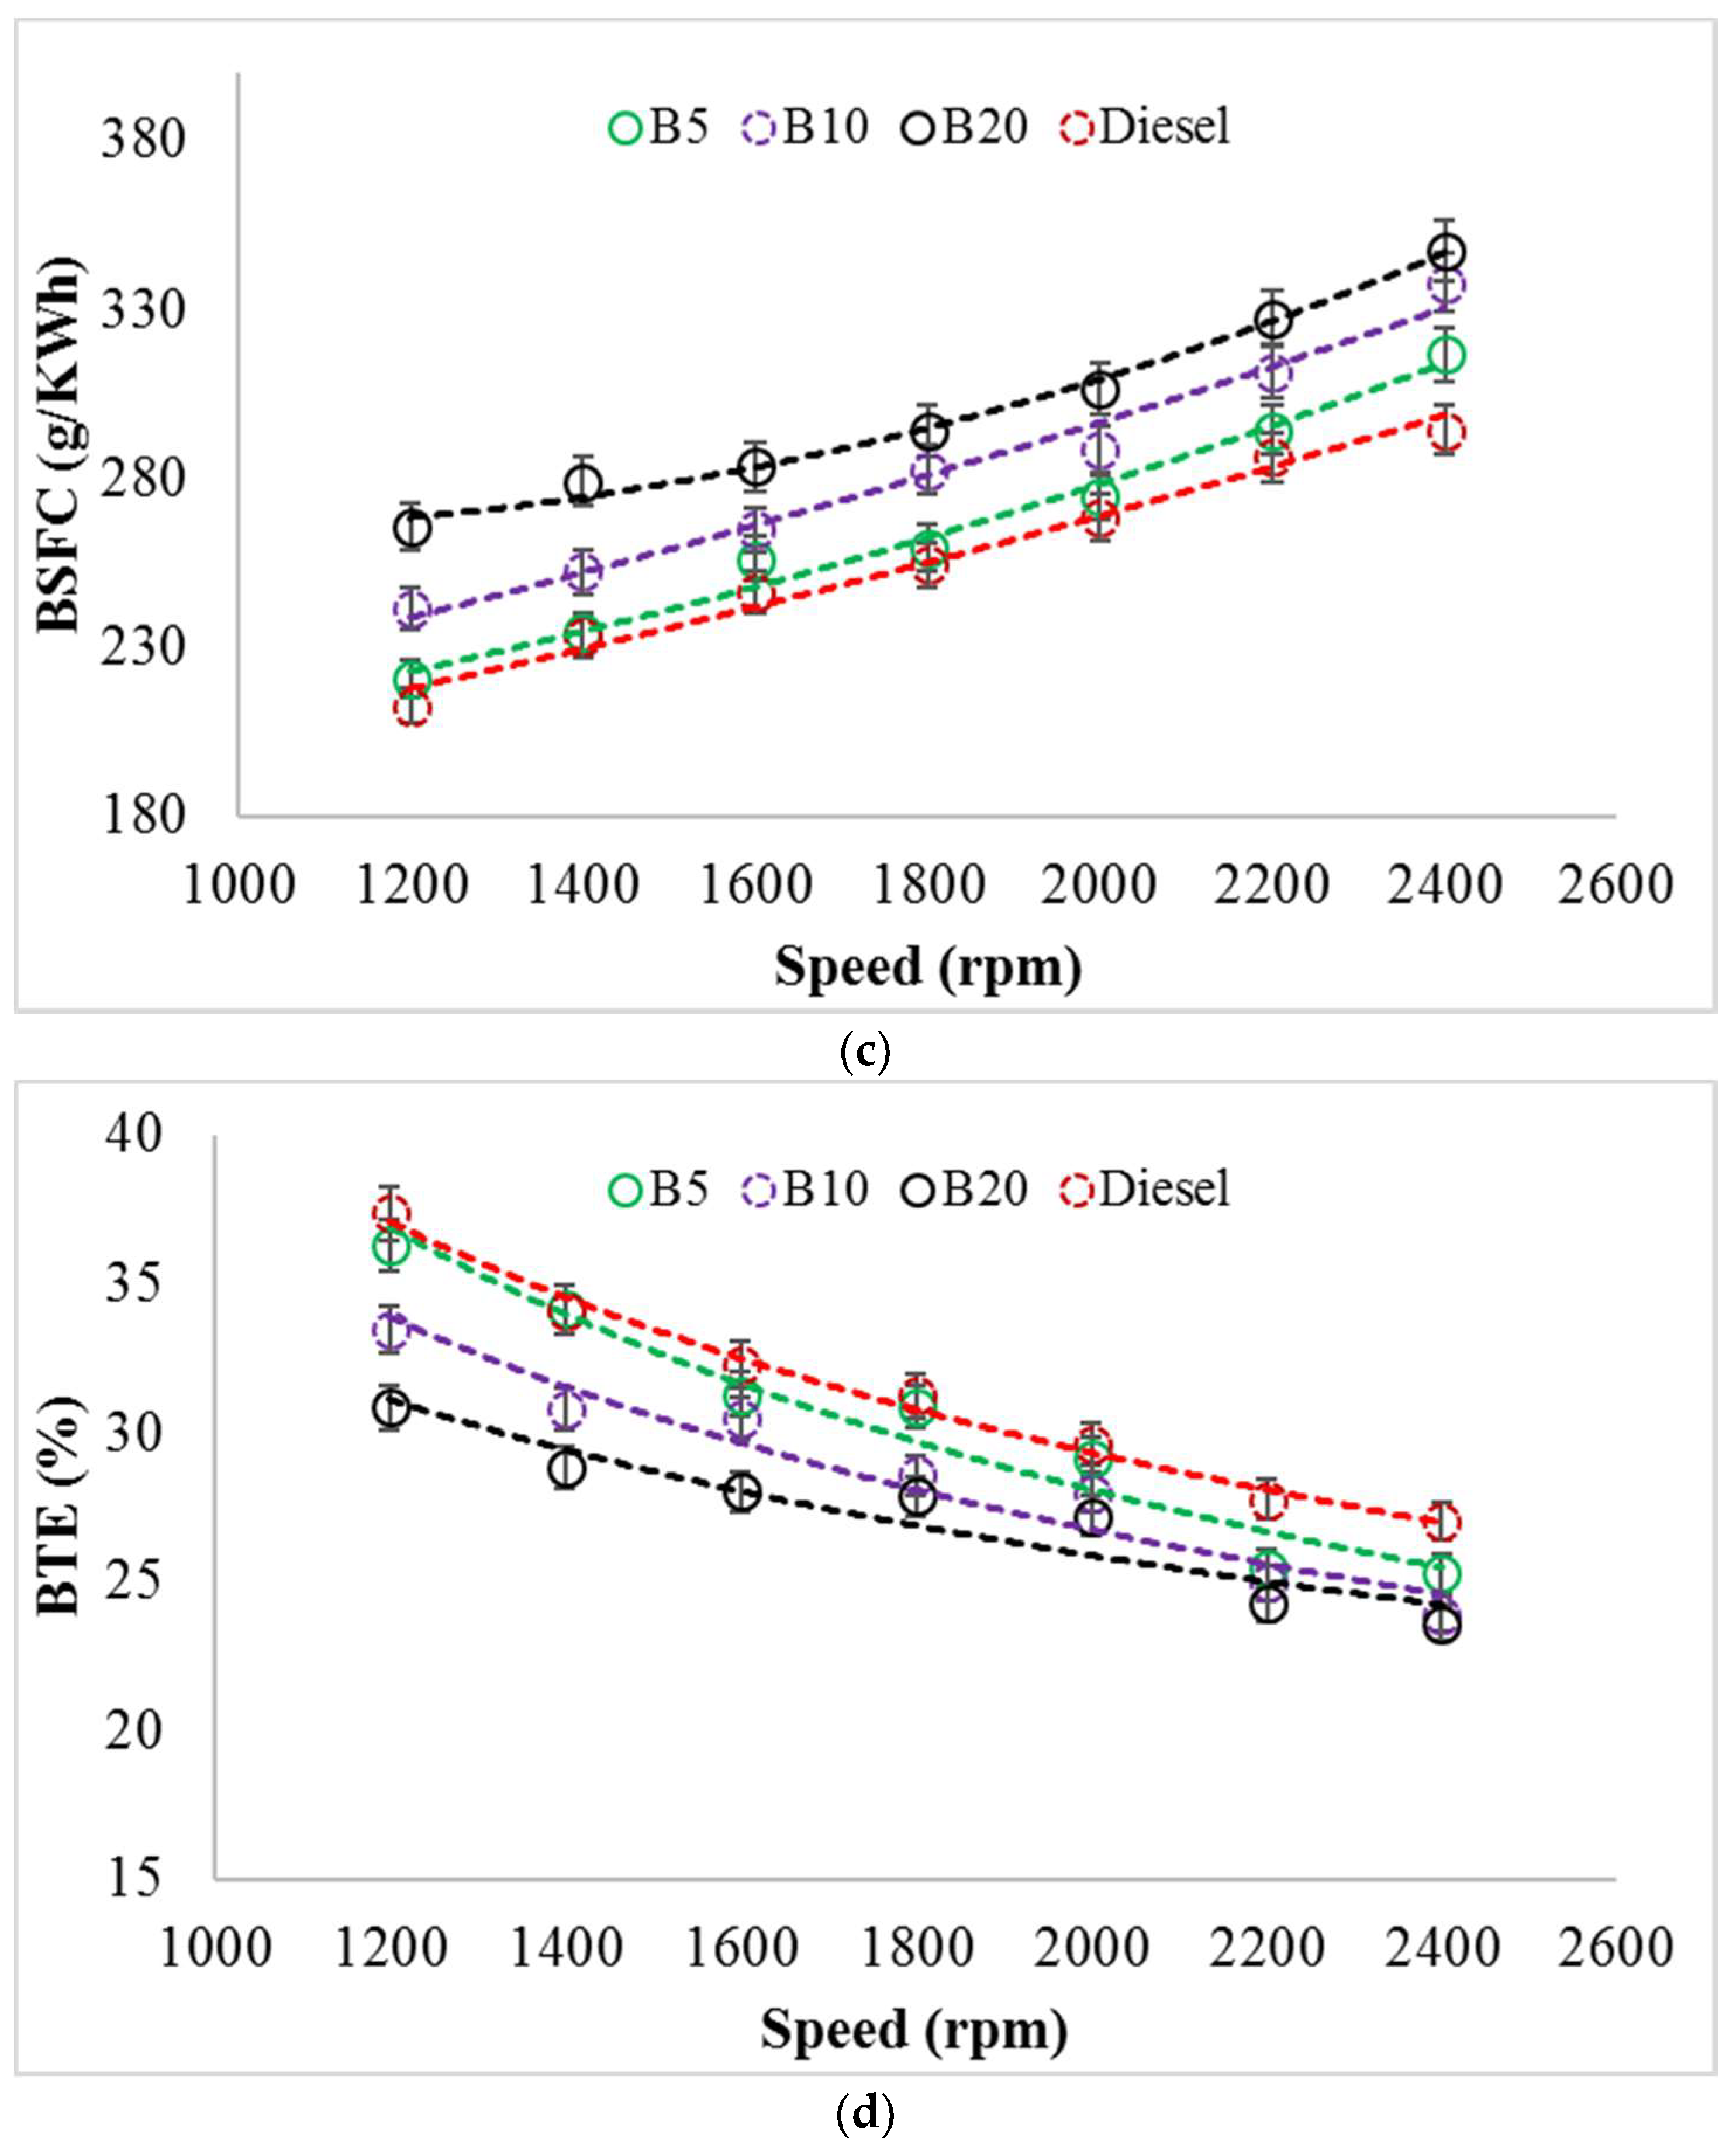
3.3.3. Effects of Biodiesel Blends, Load, and Speed on Brake Specific Fuel Consumption (BSFC)
The relationships between three operating parameters of biodiesel blend, load, and speed with brake specific fuel consumption (BSFC) were analysed. Based on the coded parameters, a quadratic regression model with determined coefficients for statistical prediction, as defined by Equation (5), was developed using Minitab 18 to predict BSFC (gm/kWh) as a function of biodiesel blends (BL), load (LD), and speed (SP).
p-Values in
Table 10 show that the model is highly significant with an insignificant lack of fit. When considering the linear, quadratic, and combined effects, all of the parameters are highly significant. Among all parameters, LD is the parameter with the lowest
p-value and highest F-value (20,429.23). According to the quadratic Equation (5), both LD and SP have a negative effect on BSFC. This means that increasing the LD will decrease BSFC, whereas decreasing the LD will increase BSFC. The SD parameter has less influence in changing BSFC. The coefficient of determination (R
2) and the adjusted coefficient of determination (adj. R
2) were 99.98% and 99.95%, respectively, which indicates the high accuracy of the model.
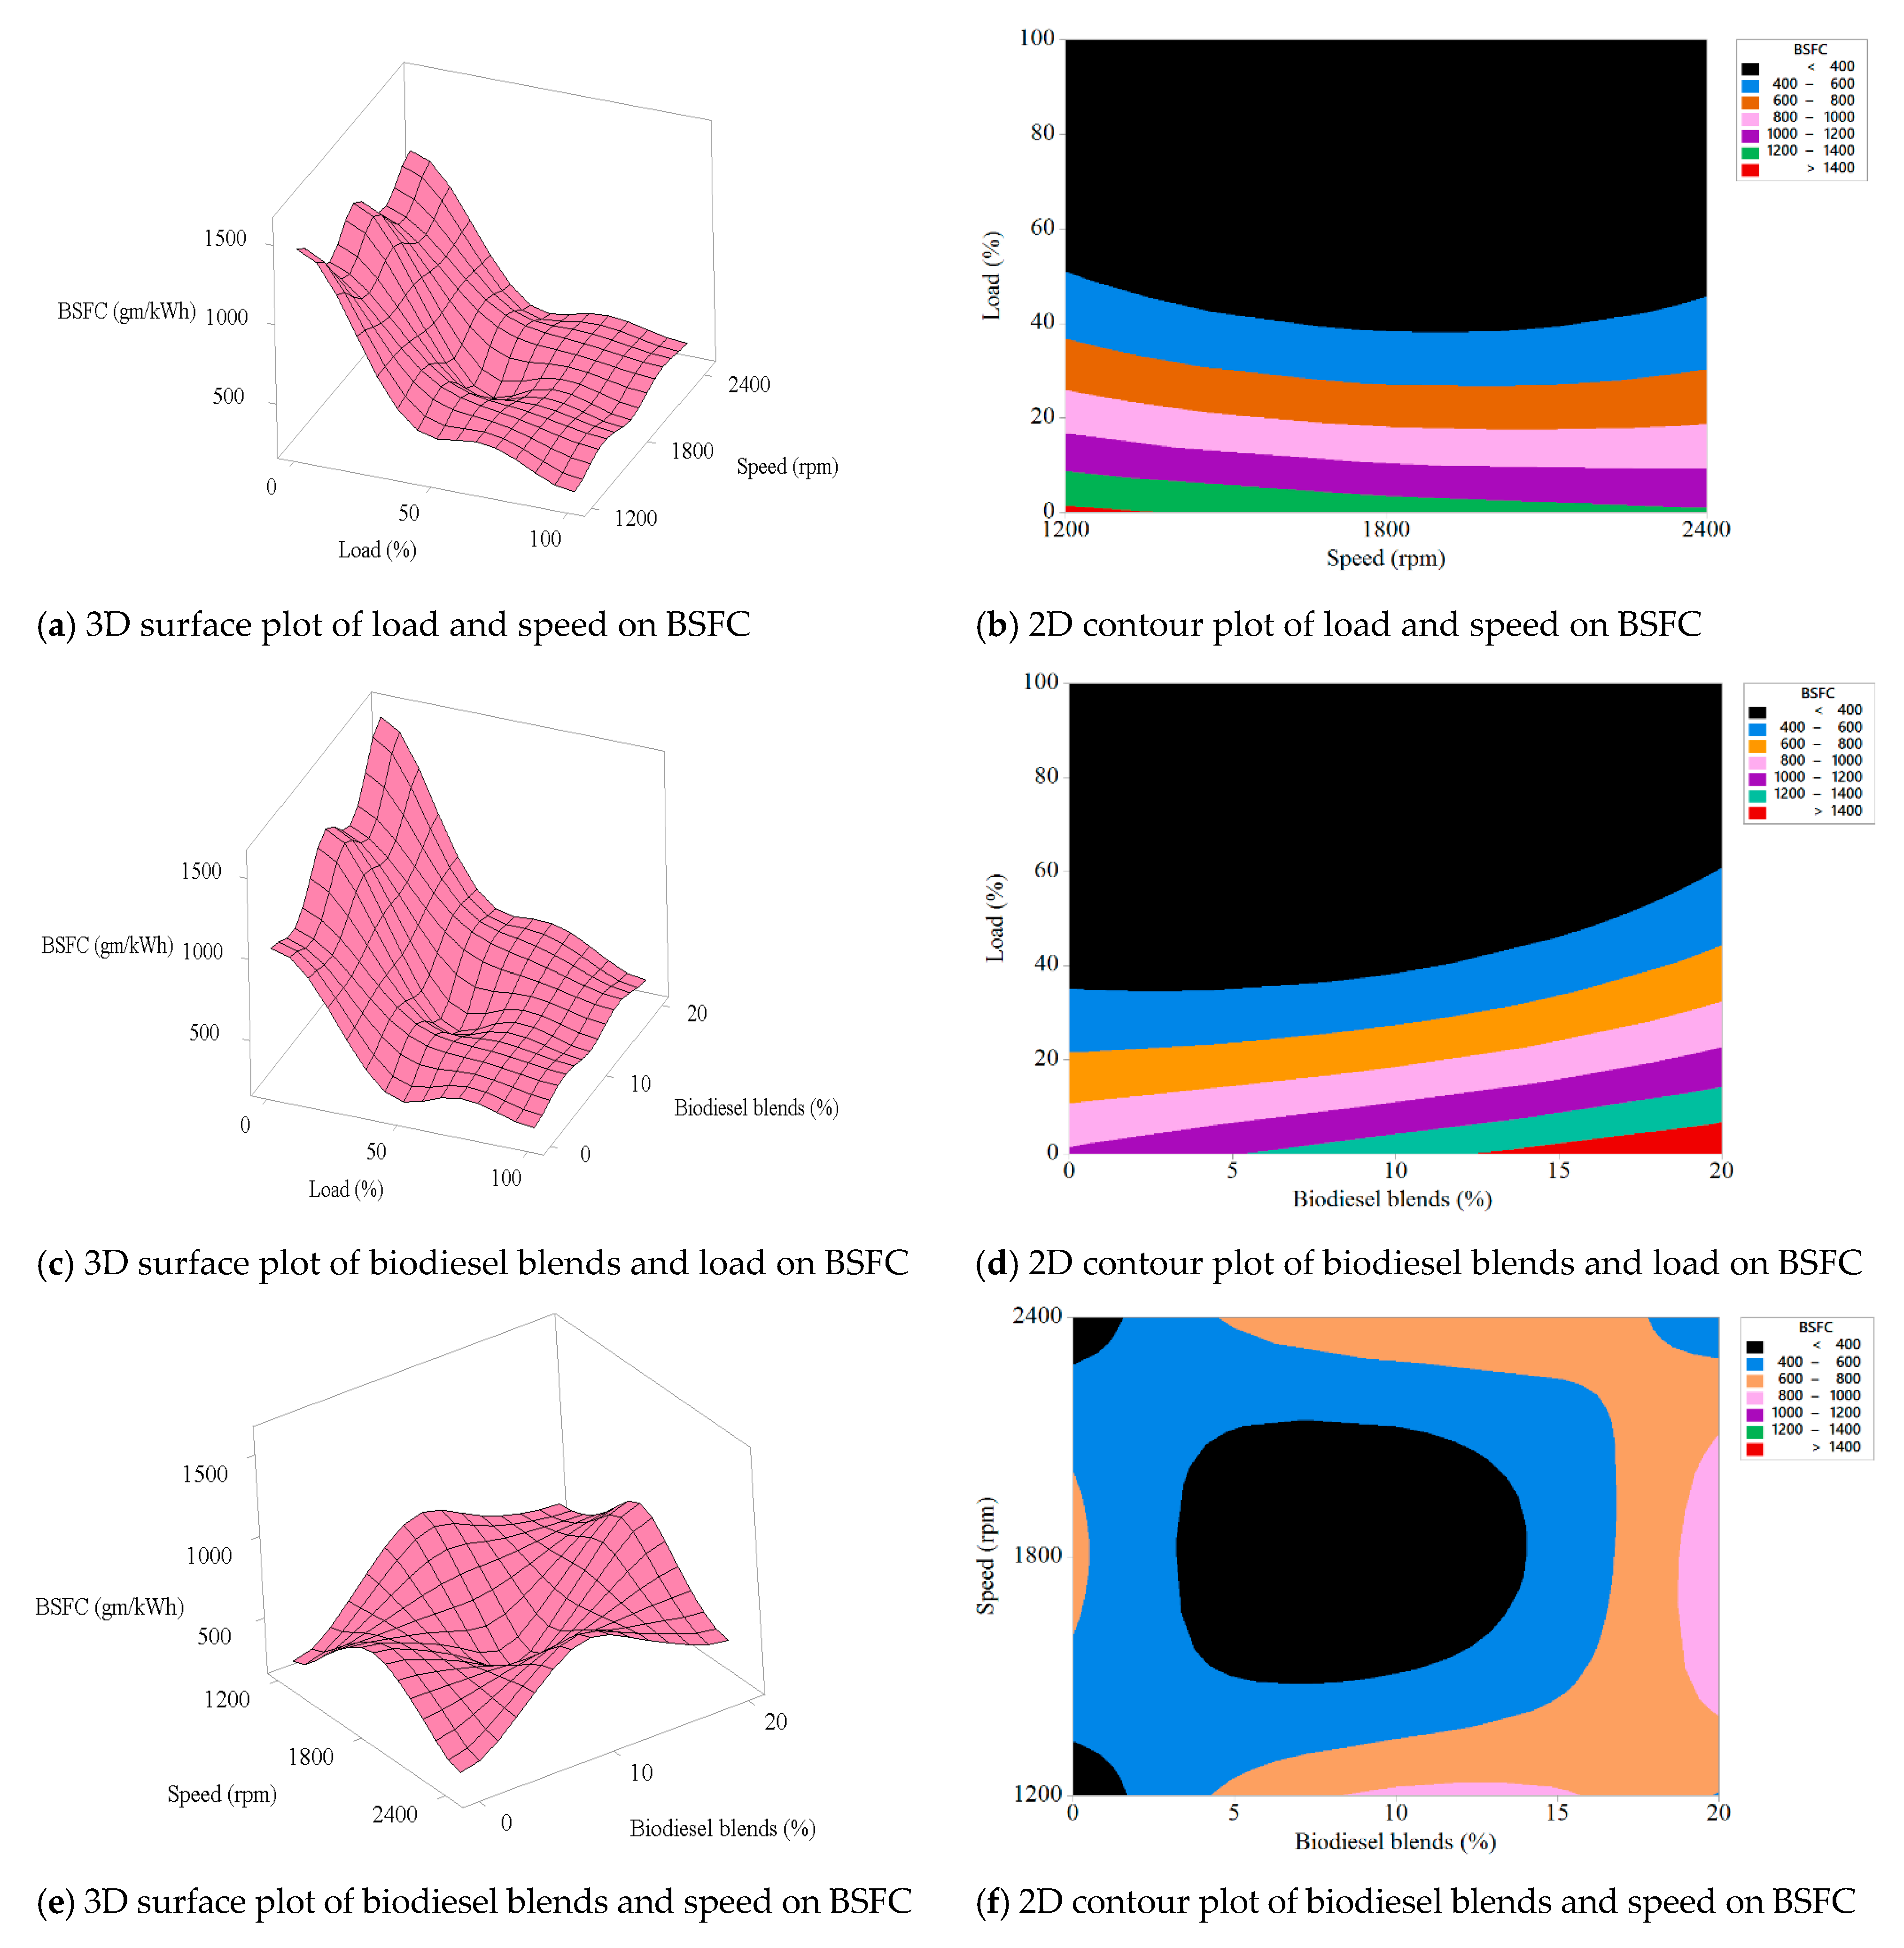
The ANOVA results in
Table 10 for LD × SP, BL × LD, and BL × SP interaction effects on BSFC are shown graphically in
Figure 8. The 3D surface plot and 2D contour plot of LD and SP effects on BSFC are presented in
Figure 8a,b respectively. BSFC decreases with the increase of LD, irrespective of SP. The maximum BSFC was found to be 1450 gm/kWh at 0% LD and 1200 rpm SP. At 50% LD, the average BSFC was recorded at about 400 gm/kWh with almost no effect from changes in SP (rpm).
Figure 8c,d present the 3D surface plot and 2D contour plot, respectively, of BL and LD effects on BSFC. At 0% LD, BL has a significant effect on BSFC. The 20% biodiesel blend (BL20) shows the maximum BSFC of 1450 gm/kWh at 0% LD. BSFC values decrease with the increase of LD, irrespective of BL. From
Figure 8d, it can be seen that, at 36% LD, the 0–10% biodiesel blends (BL0, BL5, and BL10) have low BSFC values whereas, at 60% LD, BL20 also has achieved a lower BSFC. It is therefore concluded that BL has a minor effect on BSFC, irrespective of SP changes.
Figure 8e,f show the 3D surface plot and 2D contour plot respectively of BL and SP effects on BSFC. BSFC values for BL0 have recorded for SP values in the range of 1200 to 2400 rpm and found to be less than 400 gm/kWh. Changes in both BL and SP influence BSFC values. From
Figure 8f, it can be seen that both BL at 5% and BL at 10% have low BSFC for SP values in the range of 1600 to 2000 rpm. Higher BL percentages with higher SP values (up to 2000 rpm) result in higher values of BSFC.
3.3.4. Effects of Biodiesel Blends, Load, and Speed on Brake Thermal Efficiency (BTE)
The relationships between brake thermal efficiency (BTE) and three operating parameters of biodiesel blends, load, and speed were analysed. Based on the coded parameters, a quadratic regression model with determined coefficients for statistical prediction, as defined by Equation (6), was developed using Minitab 18 to predict BTE (%) as a function of biodiesel blends (BL), load (LD), and speed (SP).
p-values in
Table 11 show that the model is highly significant with an insignificant lack of fit. When considering the linear, quadratic, and combined effects, only the BL × LD and BL × SP combined parameters are not significant; all other parameters are significant. Only the combined effects of LD × SP are significant, whereas the quadratic terms LD × LD, BL × BL, and SP × SP were all found to have significant effects on BTE. The ANOVA results in
Table 11 also show that LD has both the lowest
p-values (<0.0001) and highest F-value (940.76). According to the quadratic Equation (6), only LD has a positive effect on BTE. This means that increasing the LD will increase BTE as well. The coefficient of determination (R
2) and the adjusted coefficient of determination (adj. R
2) were 99.66% and 99.05%, respectively, which indicates the high accuracy of the model.
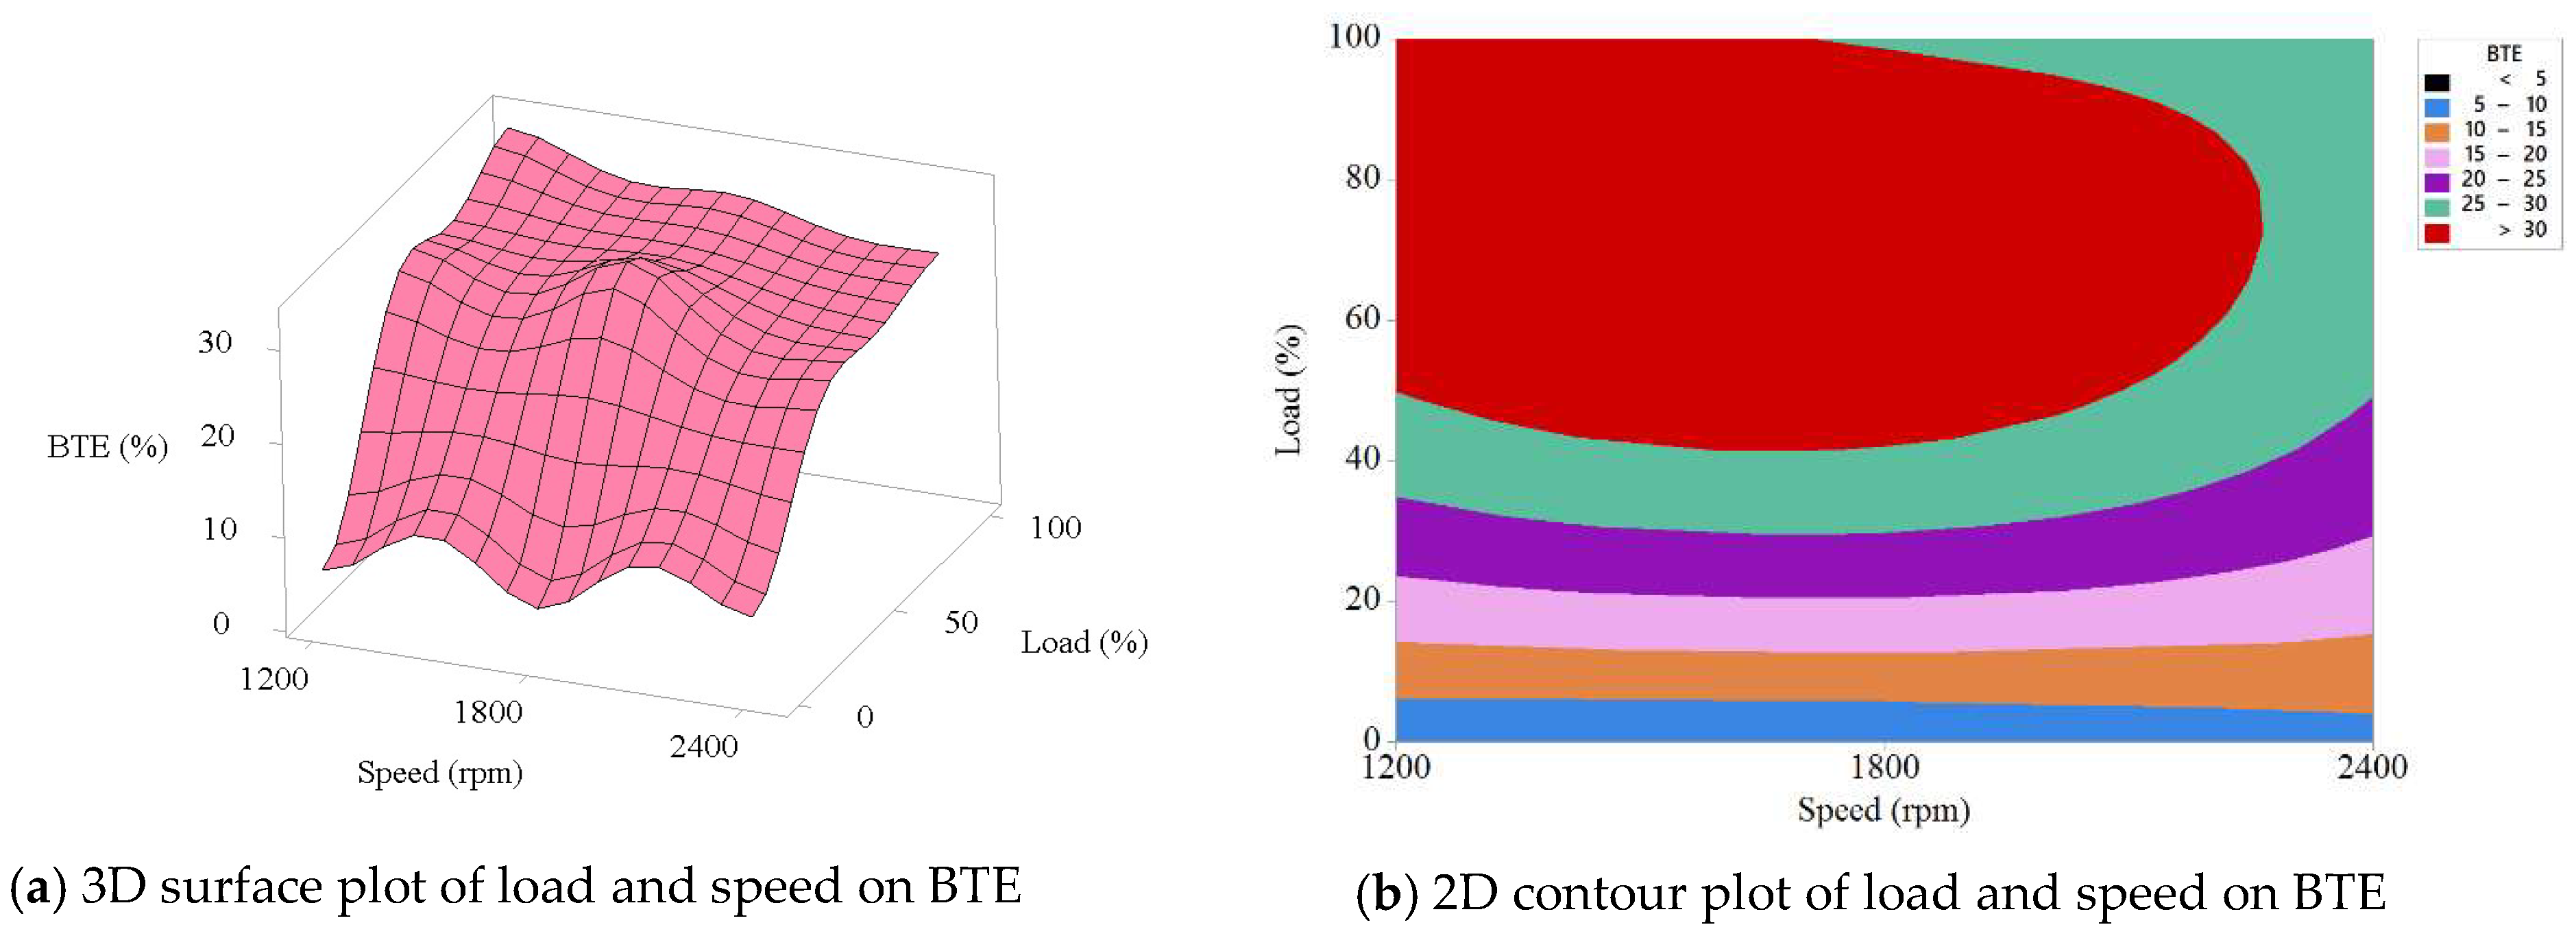
The ANOVA results in
Table 11 for LD × SP interaction effects on BTE are shown graphically in
Figure 9. The 3D surface plot and 2D contour plot of LD and SP effects on BTE are presented in
Figure 9a,b, respectively. BTE increases with the increase of LD with minimum impacts from SP. The maximum BTE was found to be 33.43% at 1200 rpm. However, the combined effects of LD and SP on BTE are affected by an increase of LD above 50%. It is therefore concluded that SP has a minor impact on BTE, irrespective of LD changes.


