A High-Speed Fault Detection, Identification, and Isolation Method for a Last Mile Radial LVDC Distribution Network

 , , ,
, , , 
Abstract
:1. Introduction
- A DC network is more suitable for renewable energy generators, such as photovoltaic panels, fuel cells, and energy storage systems such as batteries, which are DC based.
- DC loads currently represent almost 50% of the whole building consumption, which can be supplied through a DC network.
- The future integration of electric vehicles in the distribution network will increase the consumption of DC devices (batteries) in the buildings.
- DC distribution networks are more efficient than their AC counterparts, since there is no skin effect or reactive power in DC networks.
- Interconnecting and distributing energy through a DC distribution network avoids unnecessary DC/AC and AC/DC conversions which produce losses.
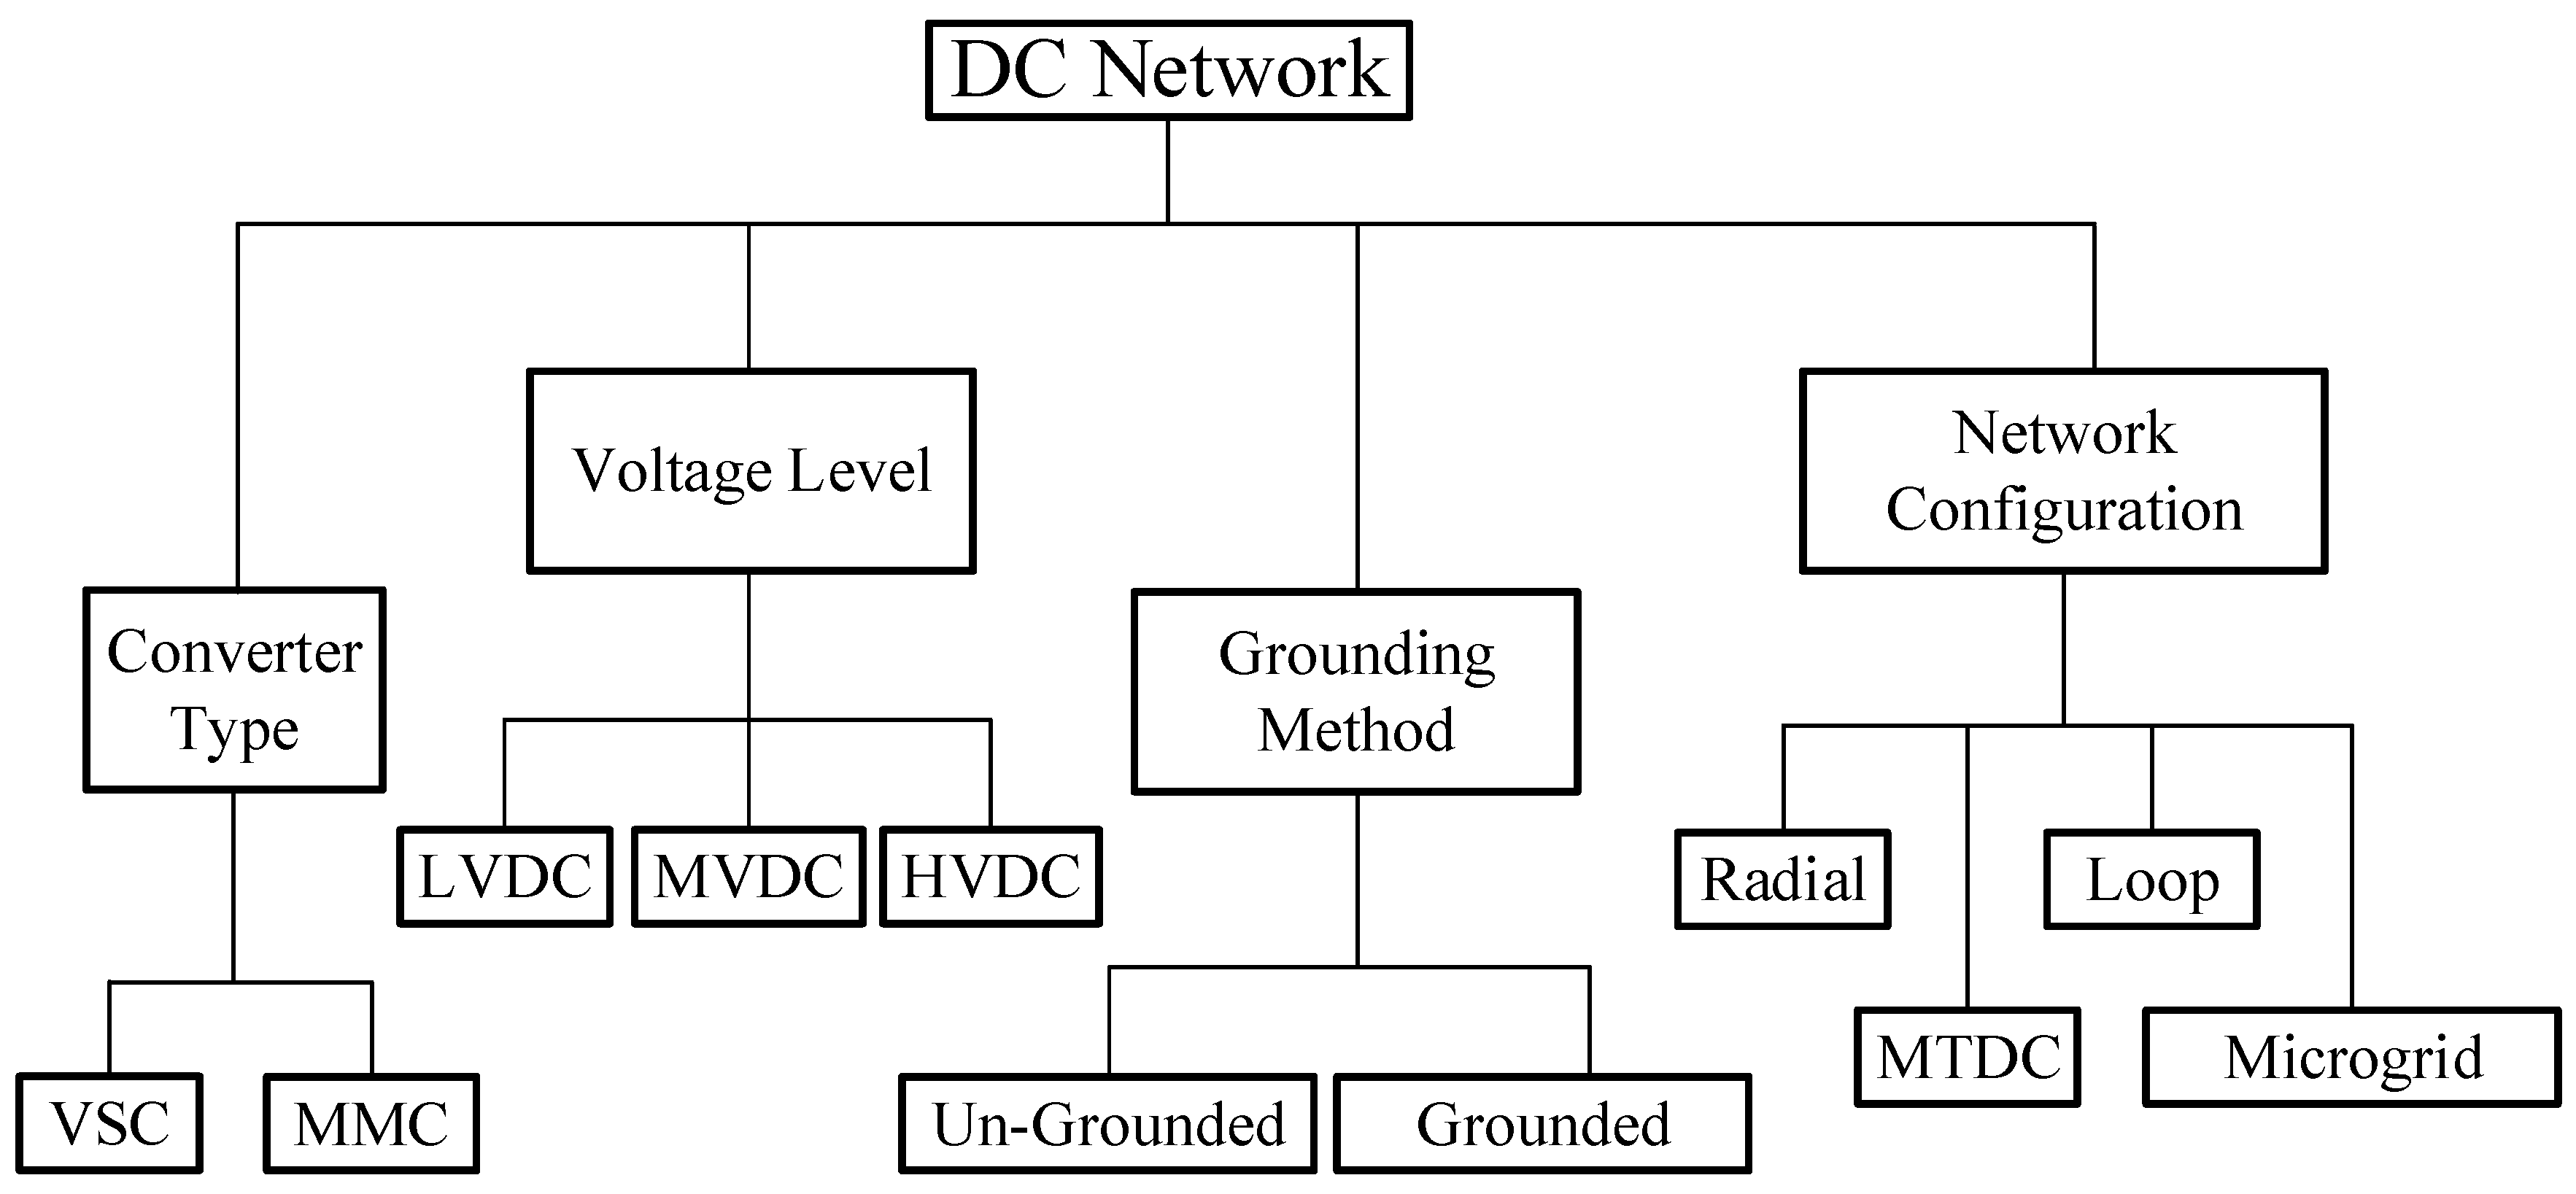
2. DC Network Classification
2.1. Converter Type
2.2. Voltage Level
2.3. Grounding Method
2.4. Network Configuration
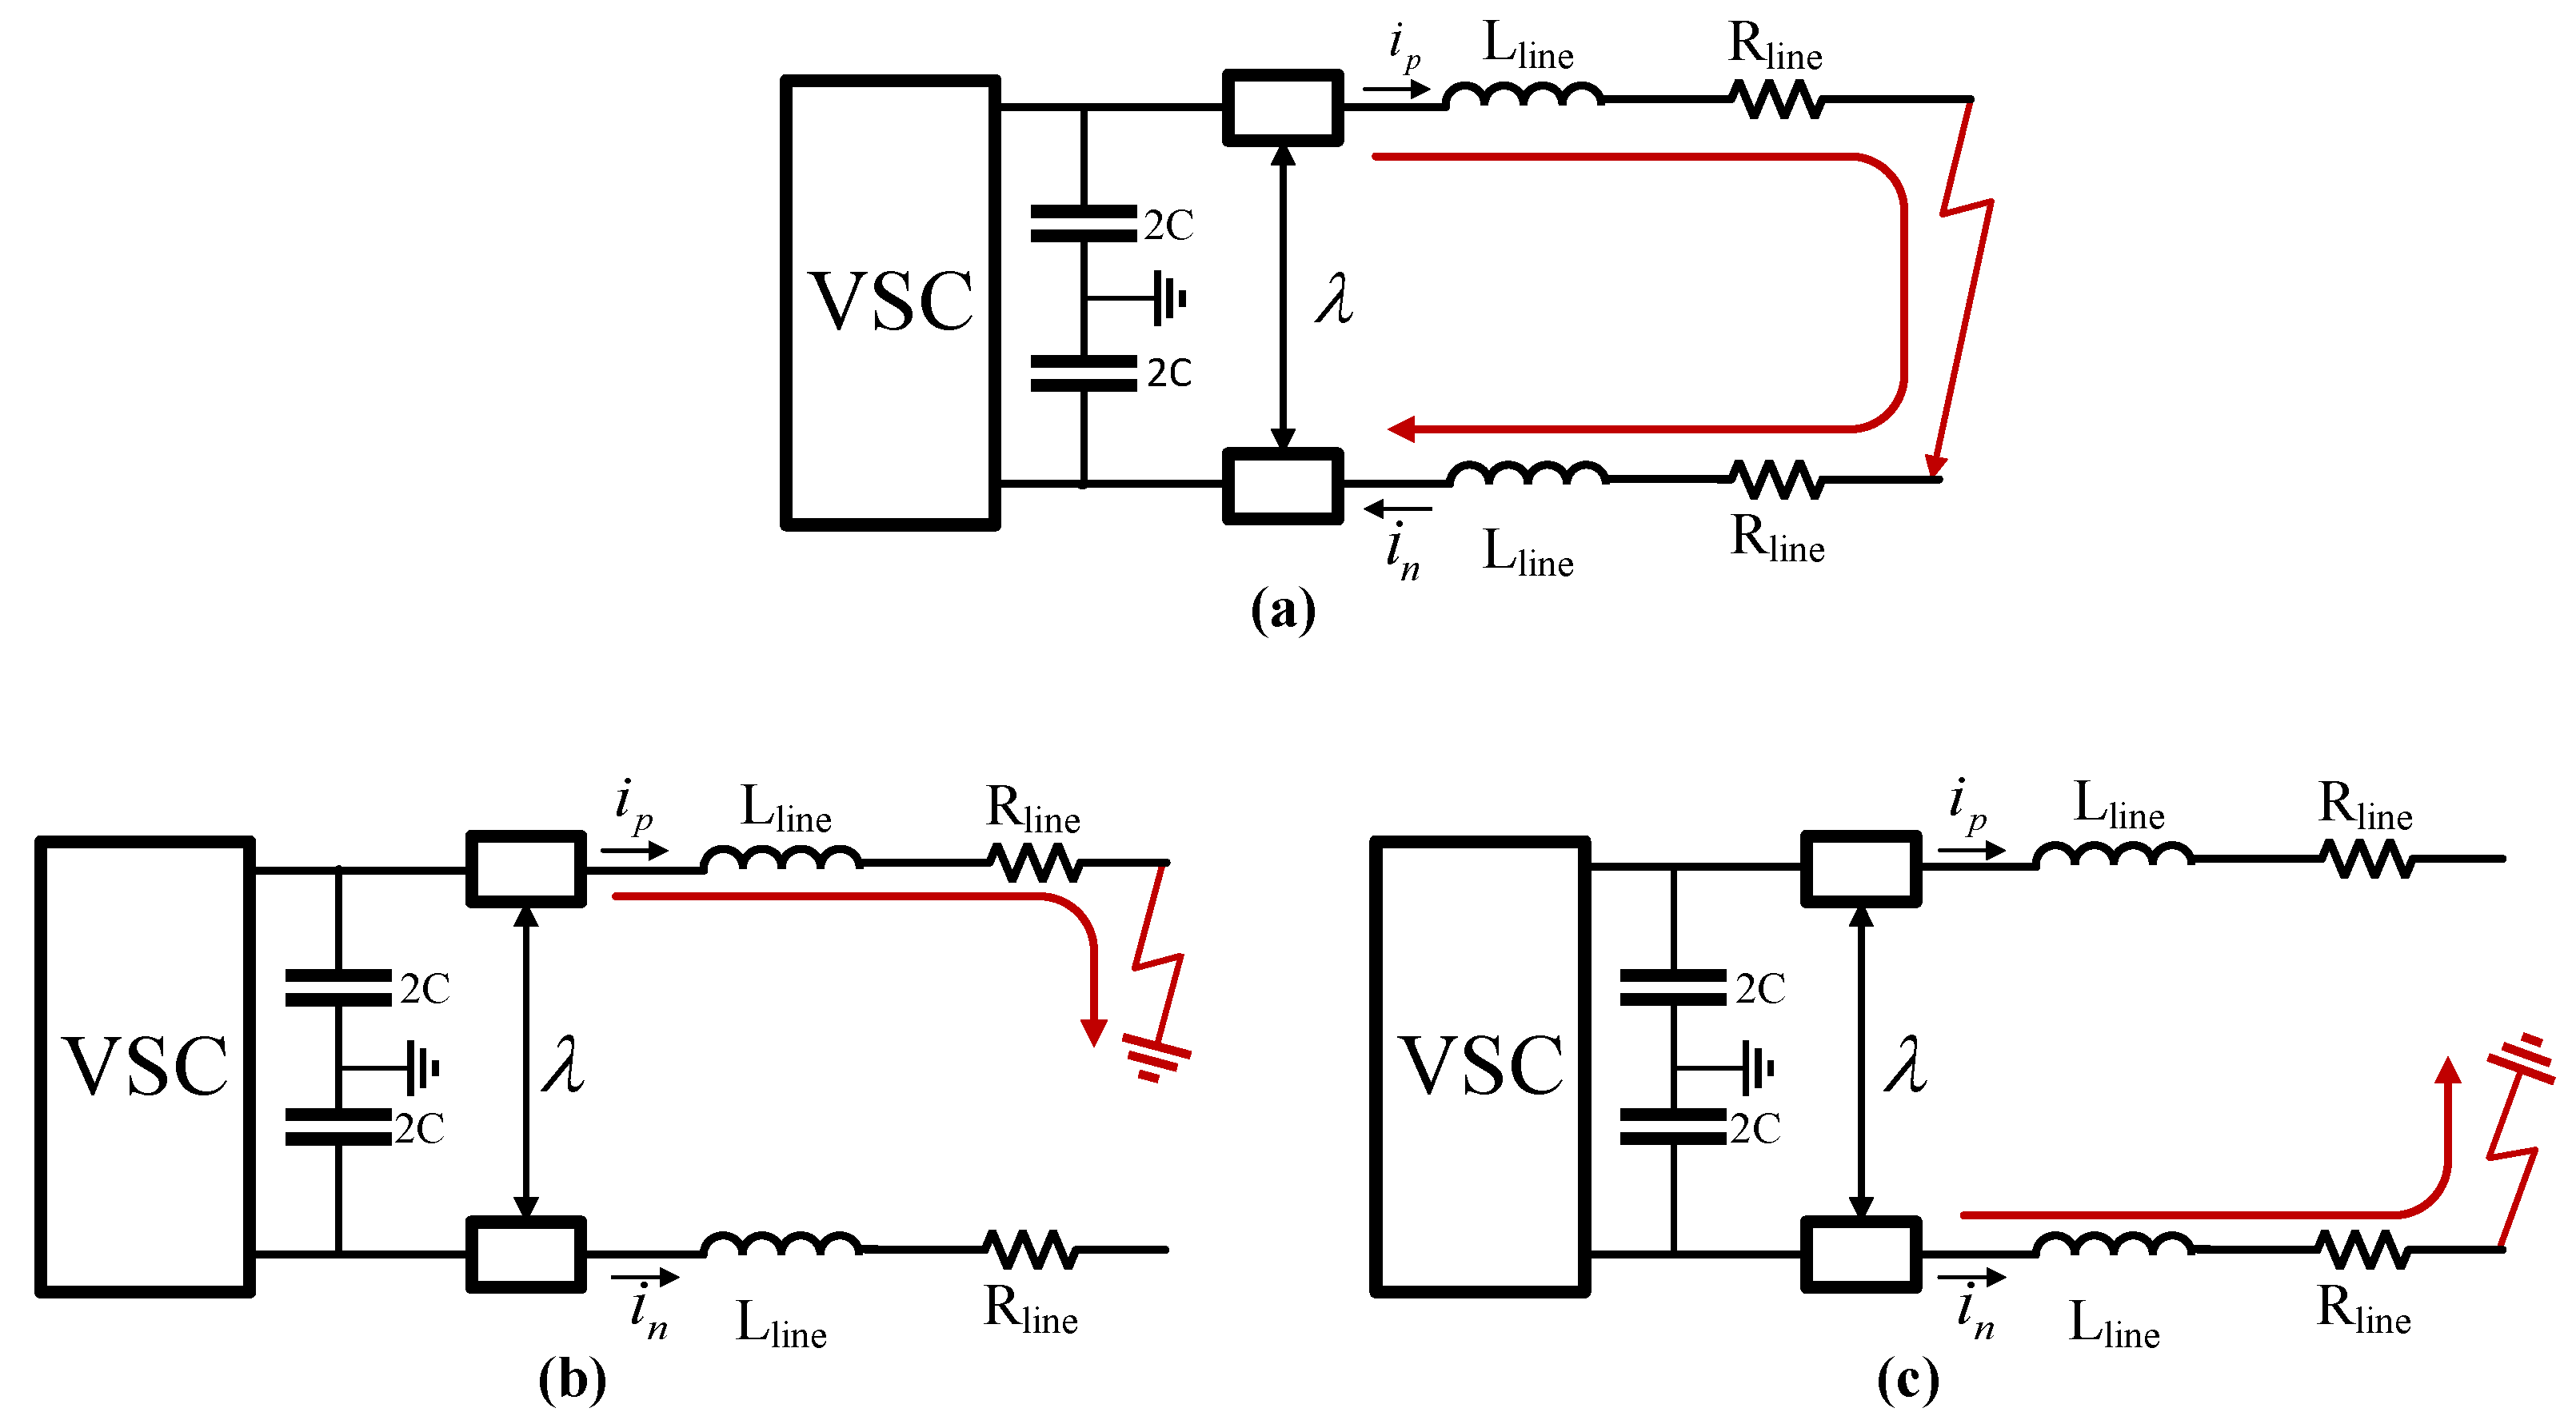
3. Proposed Protection Scheme
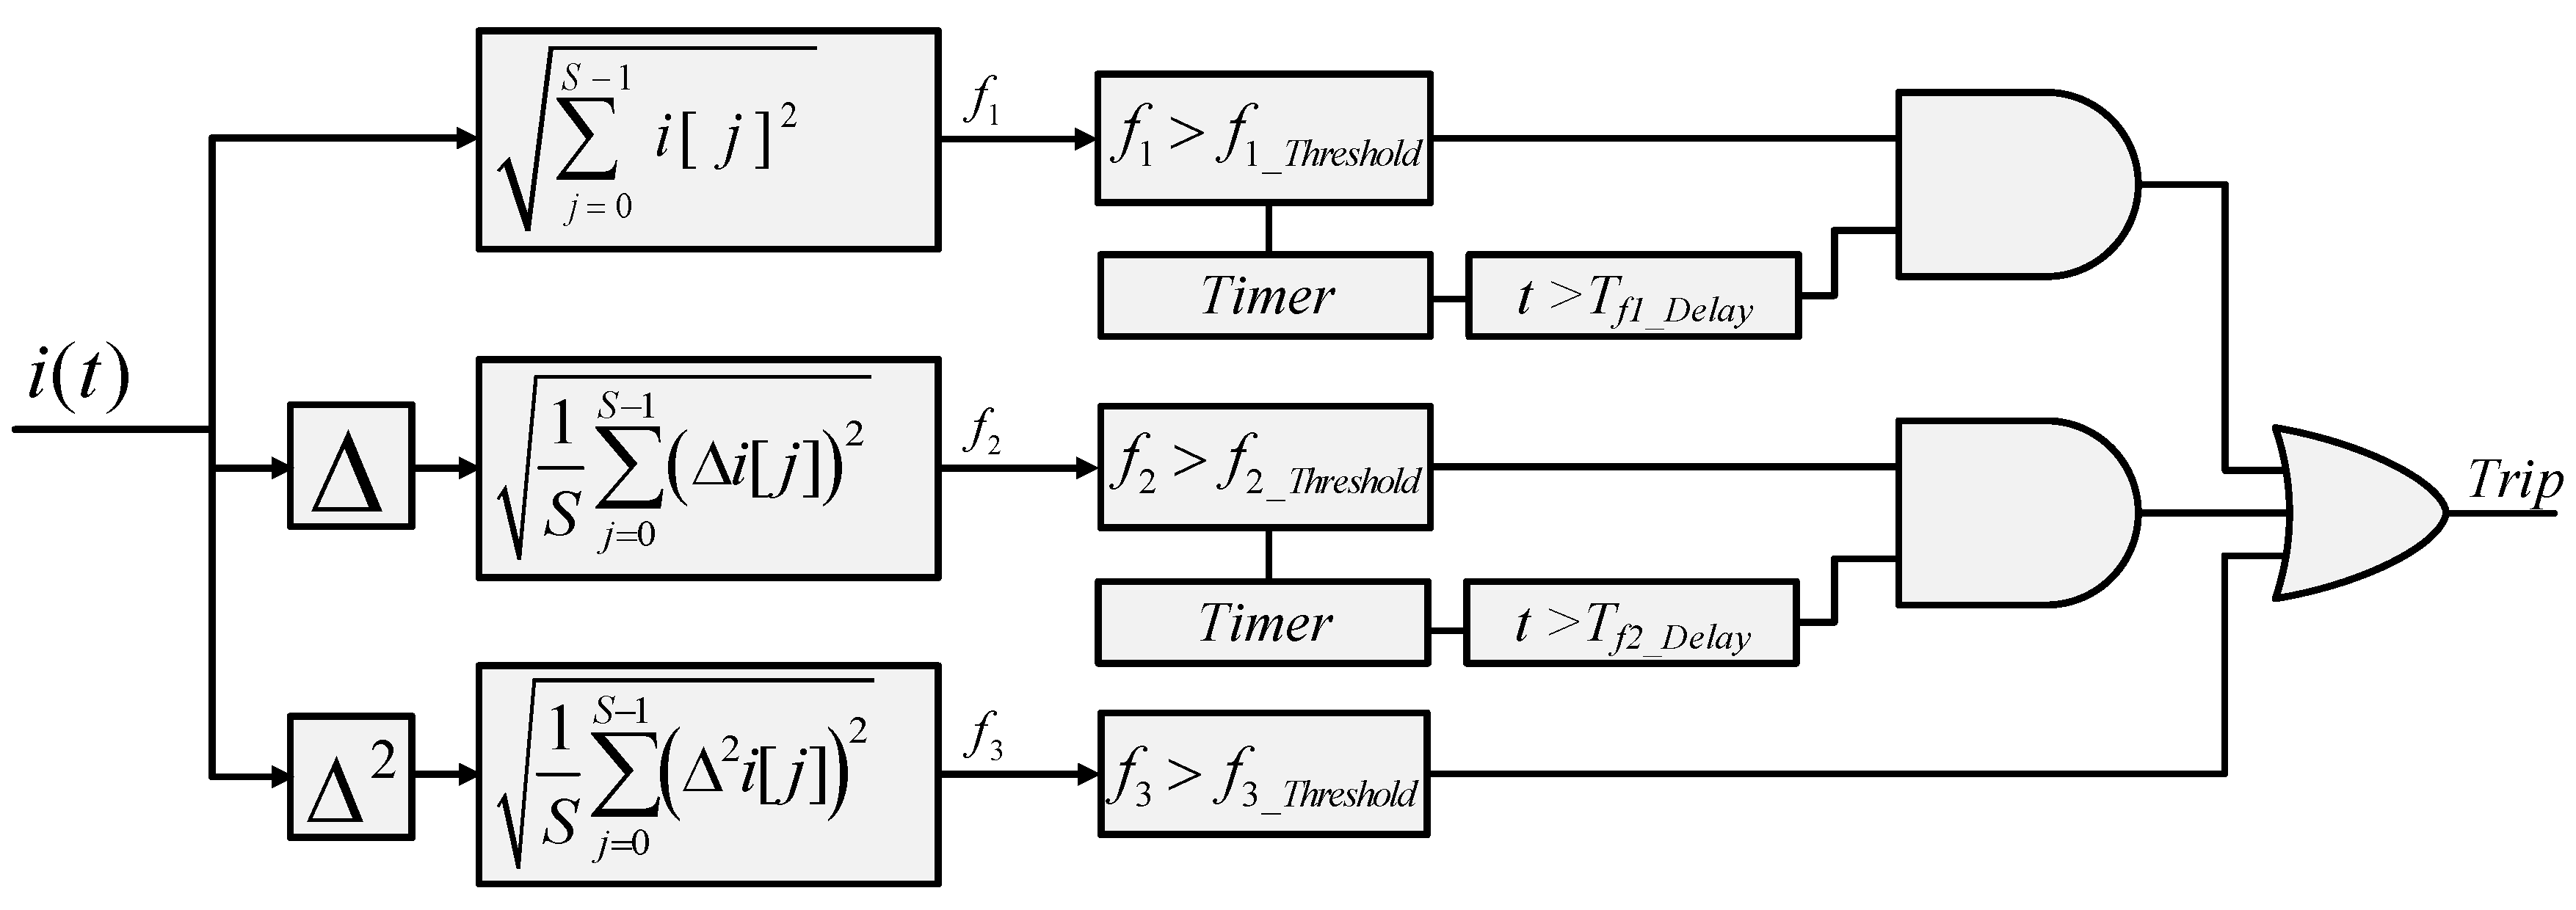
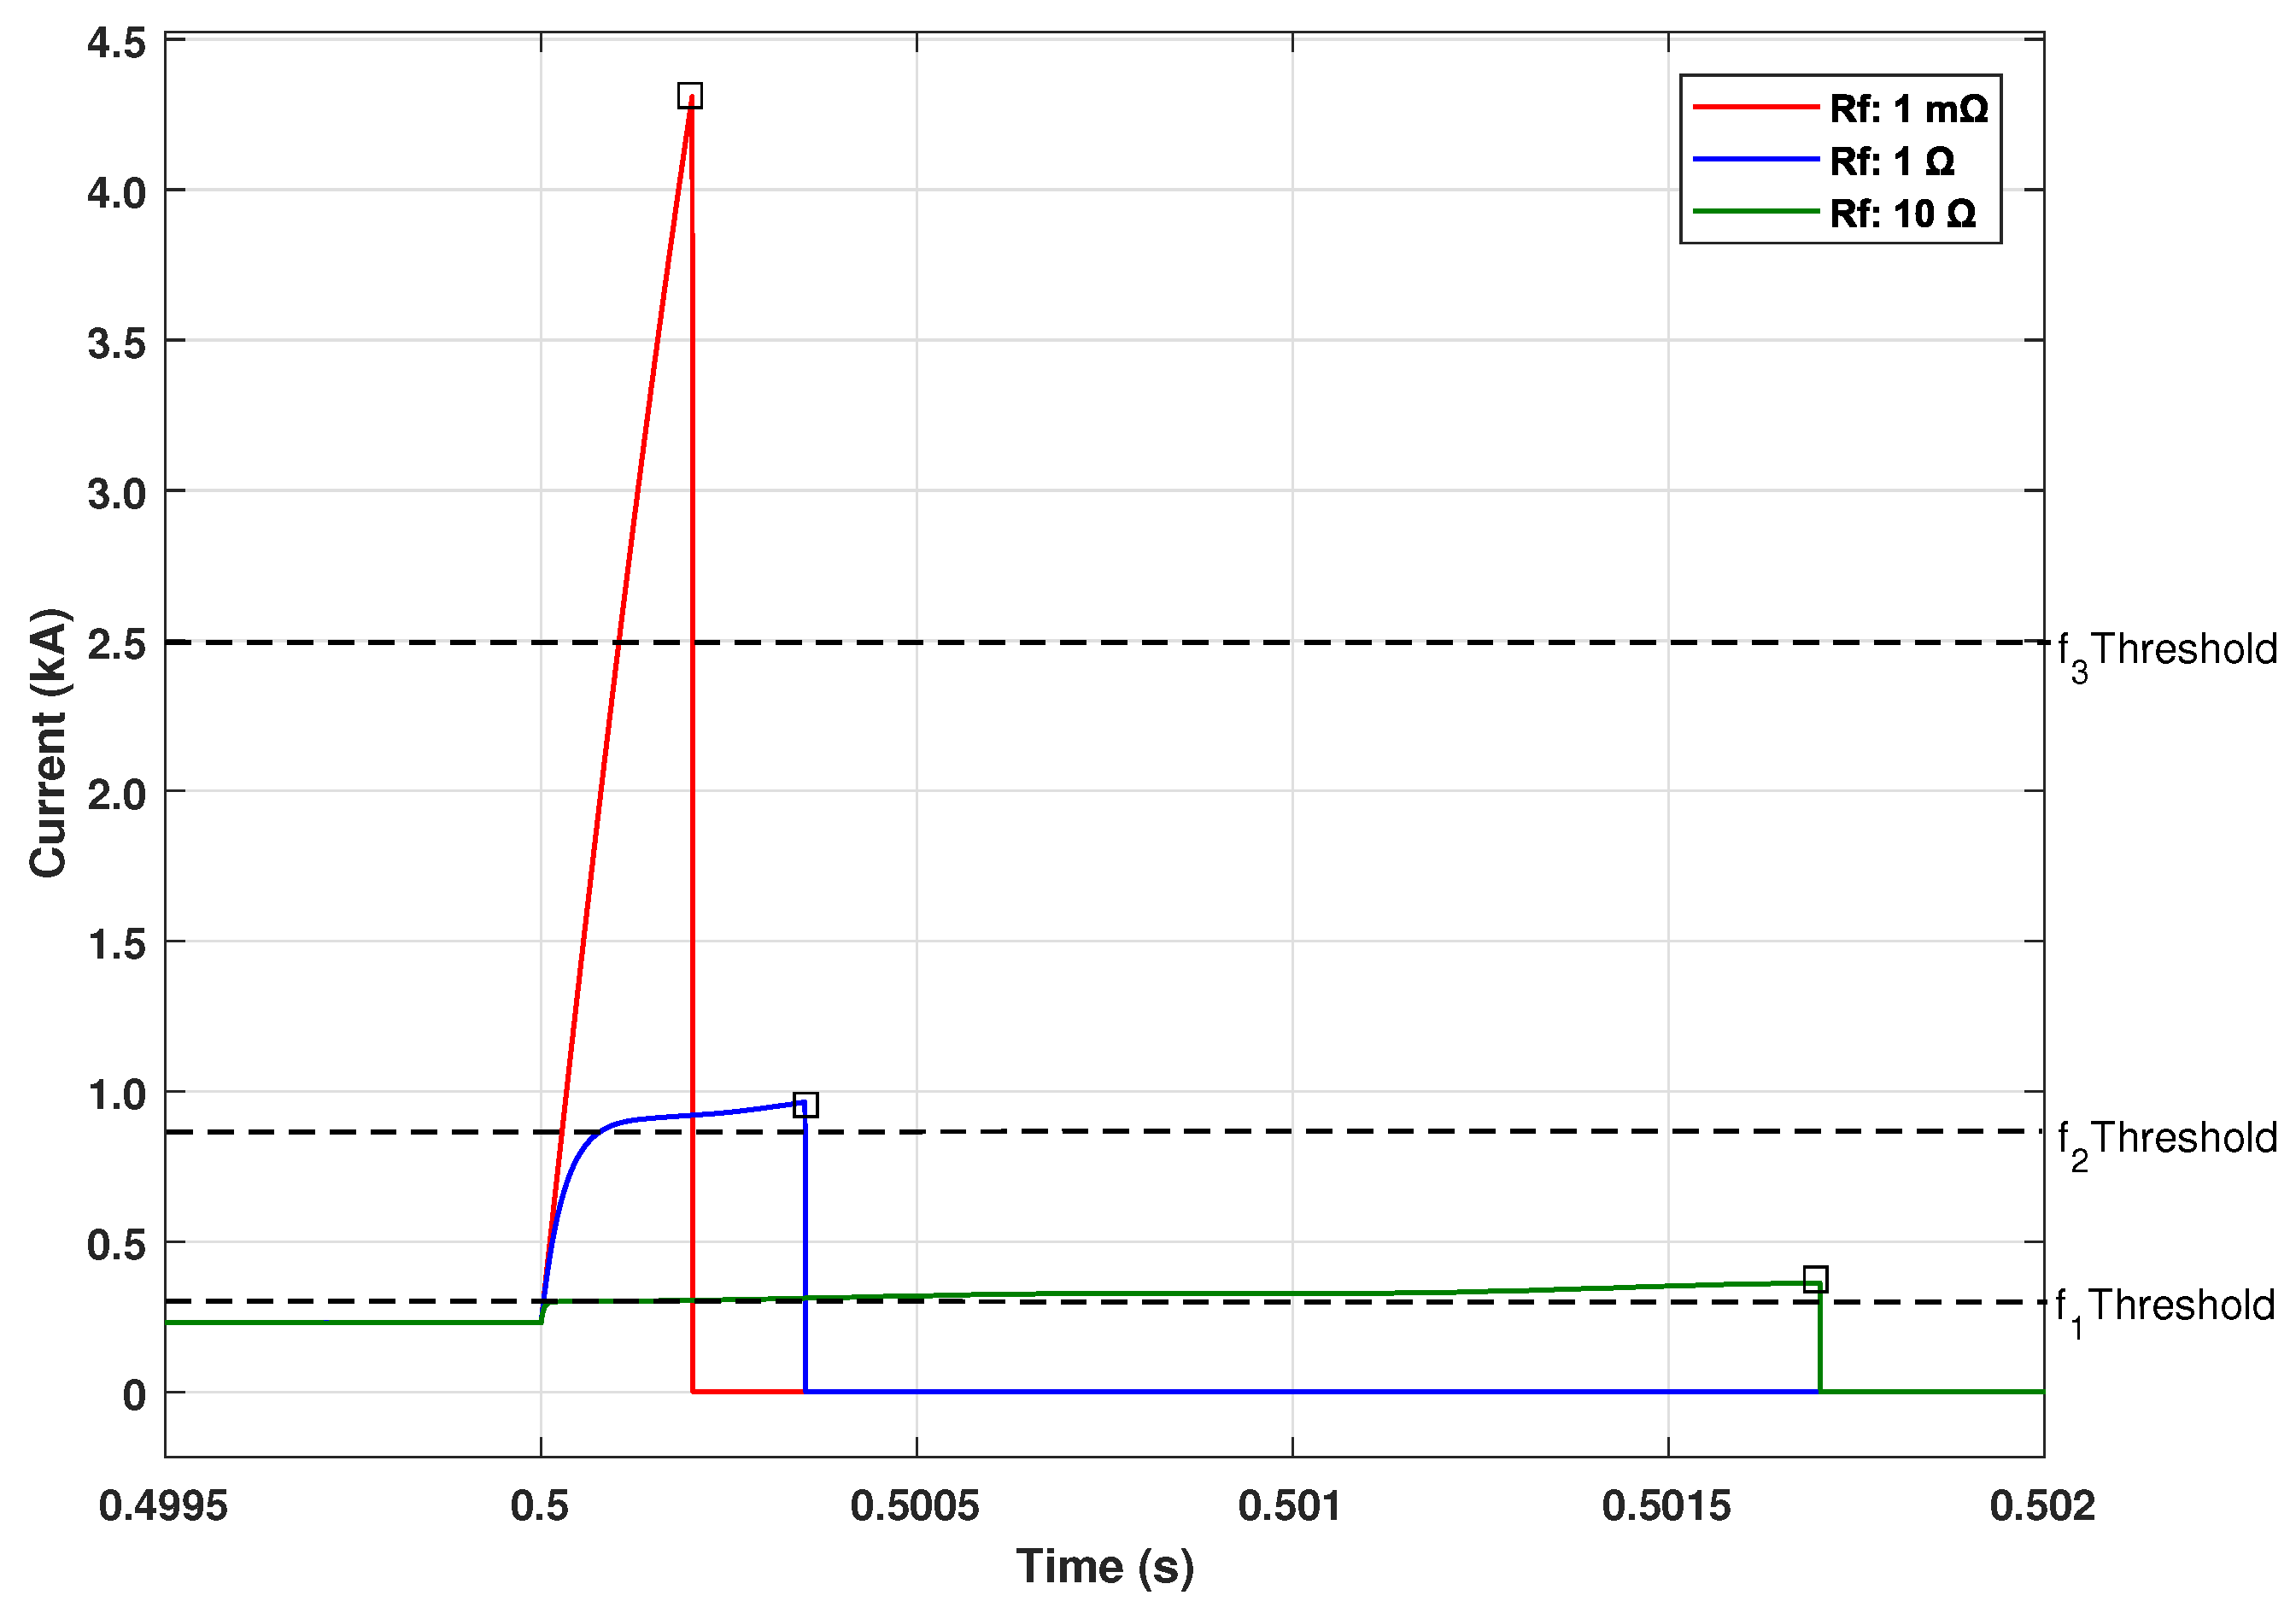
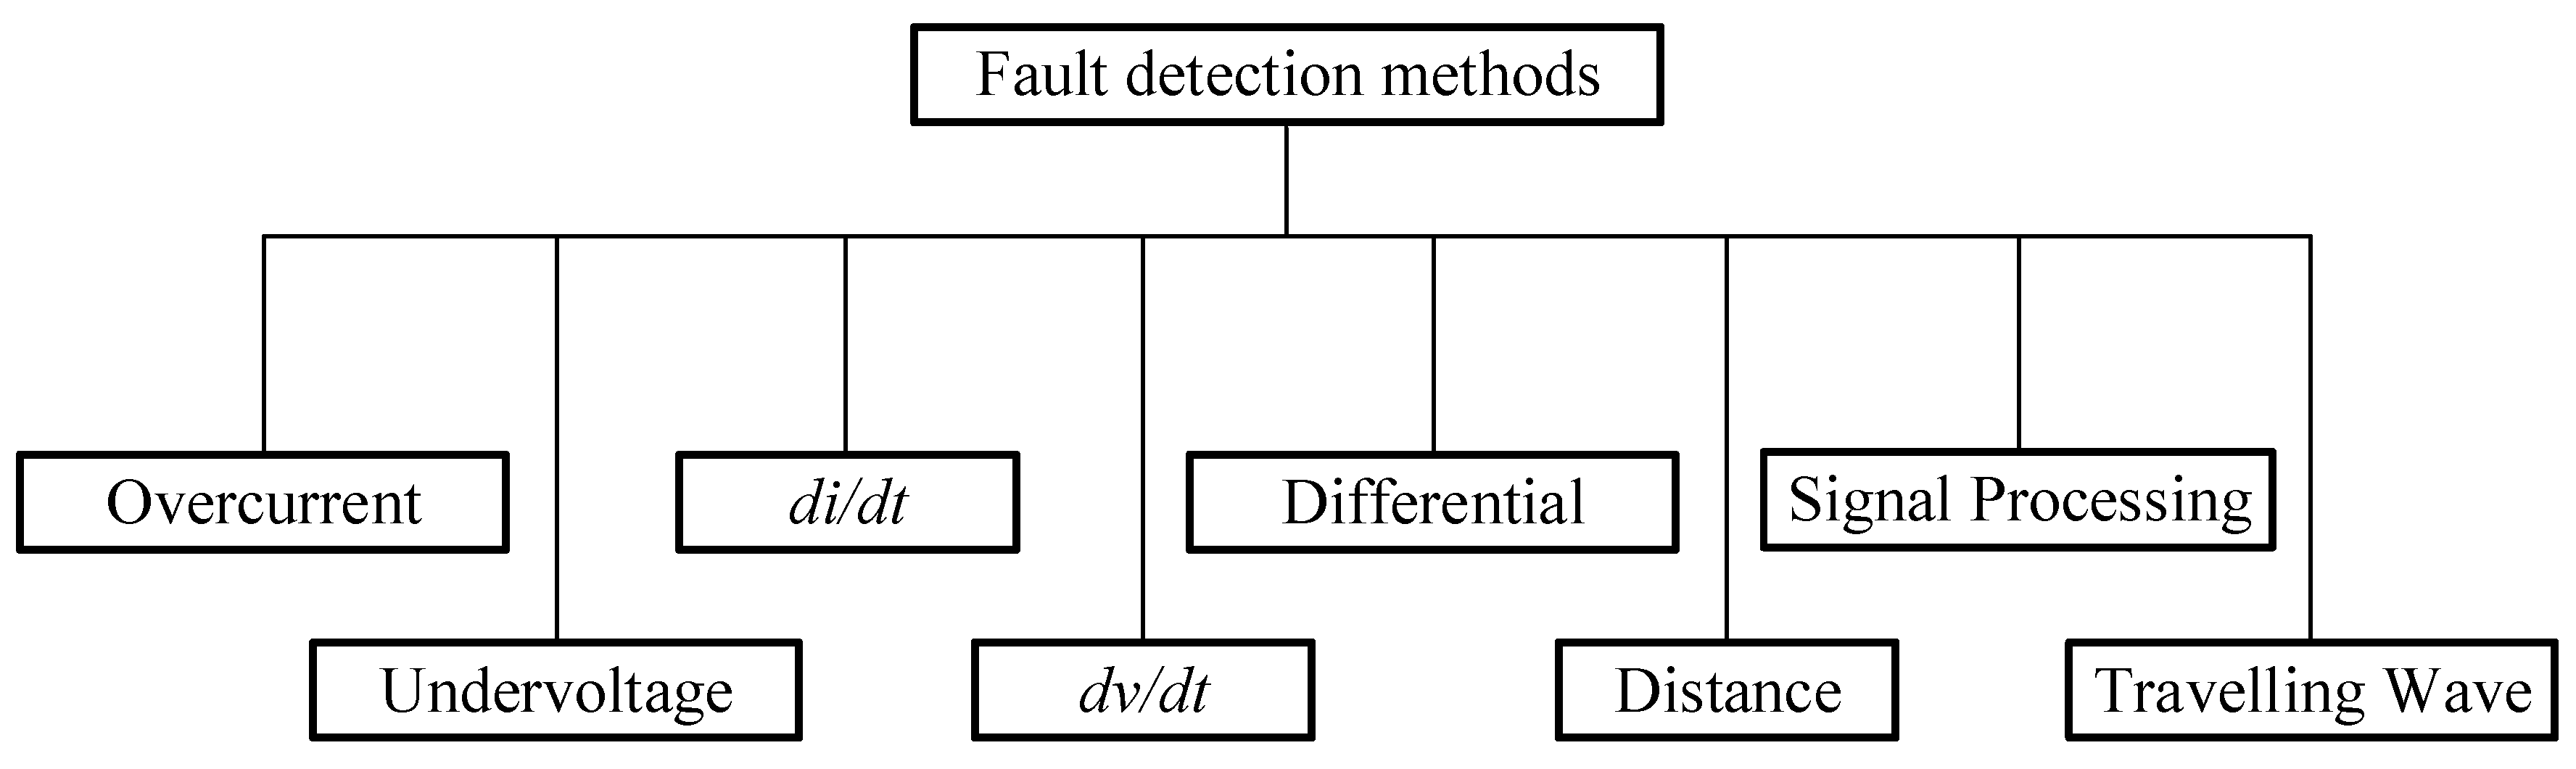
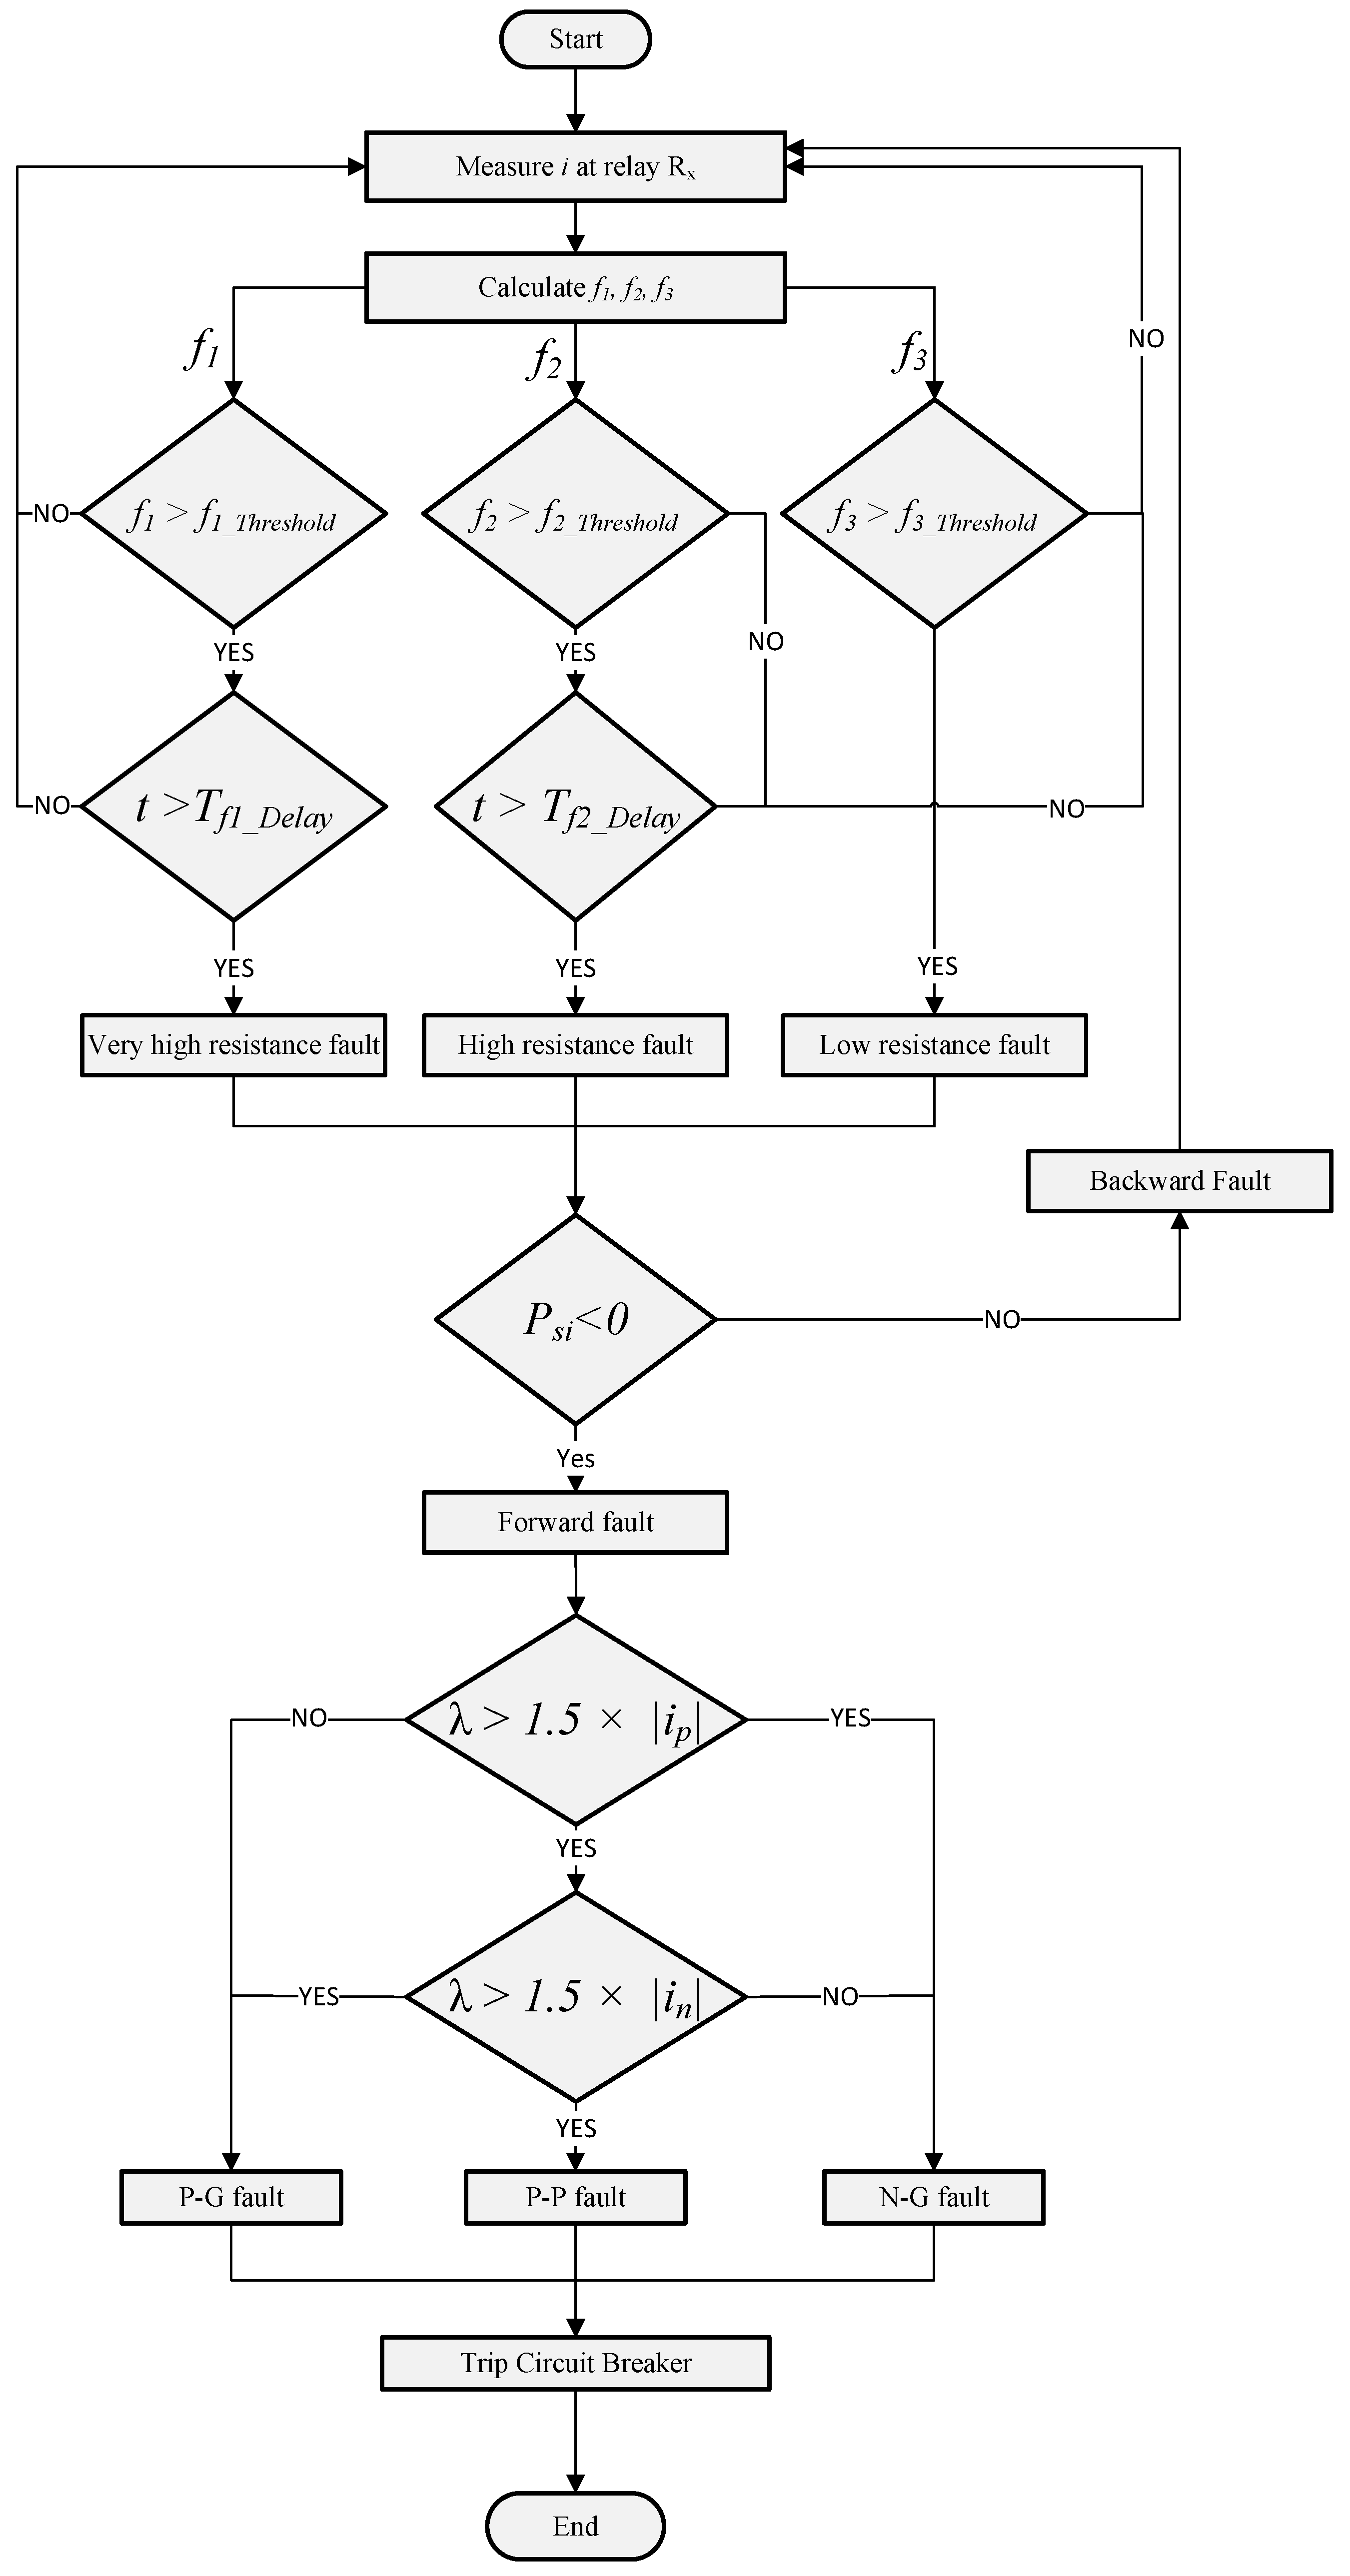
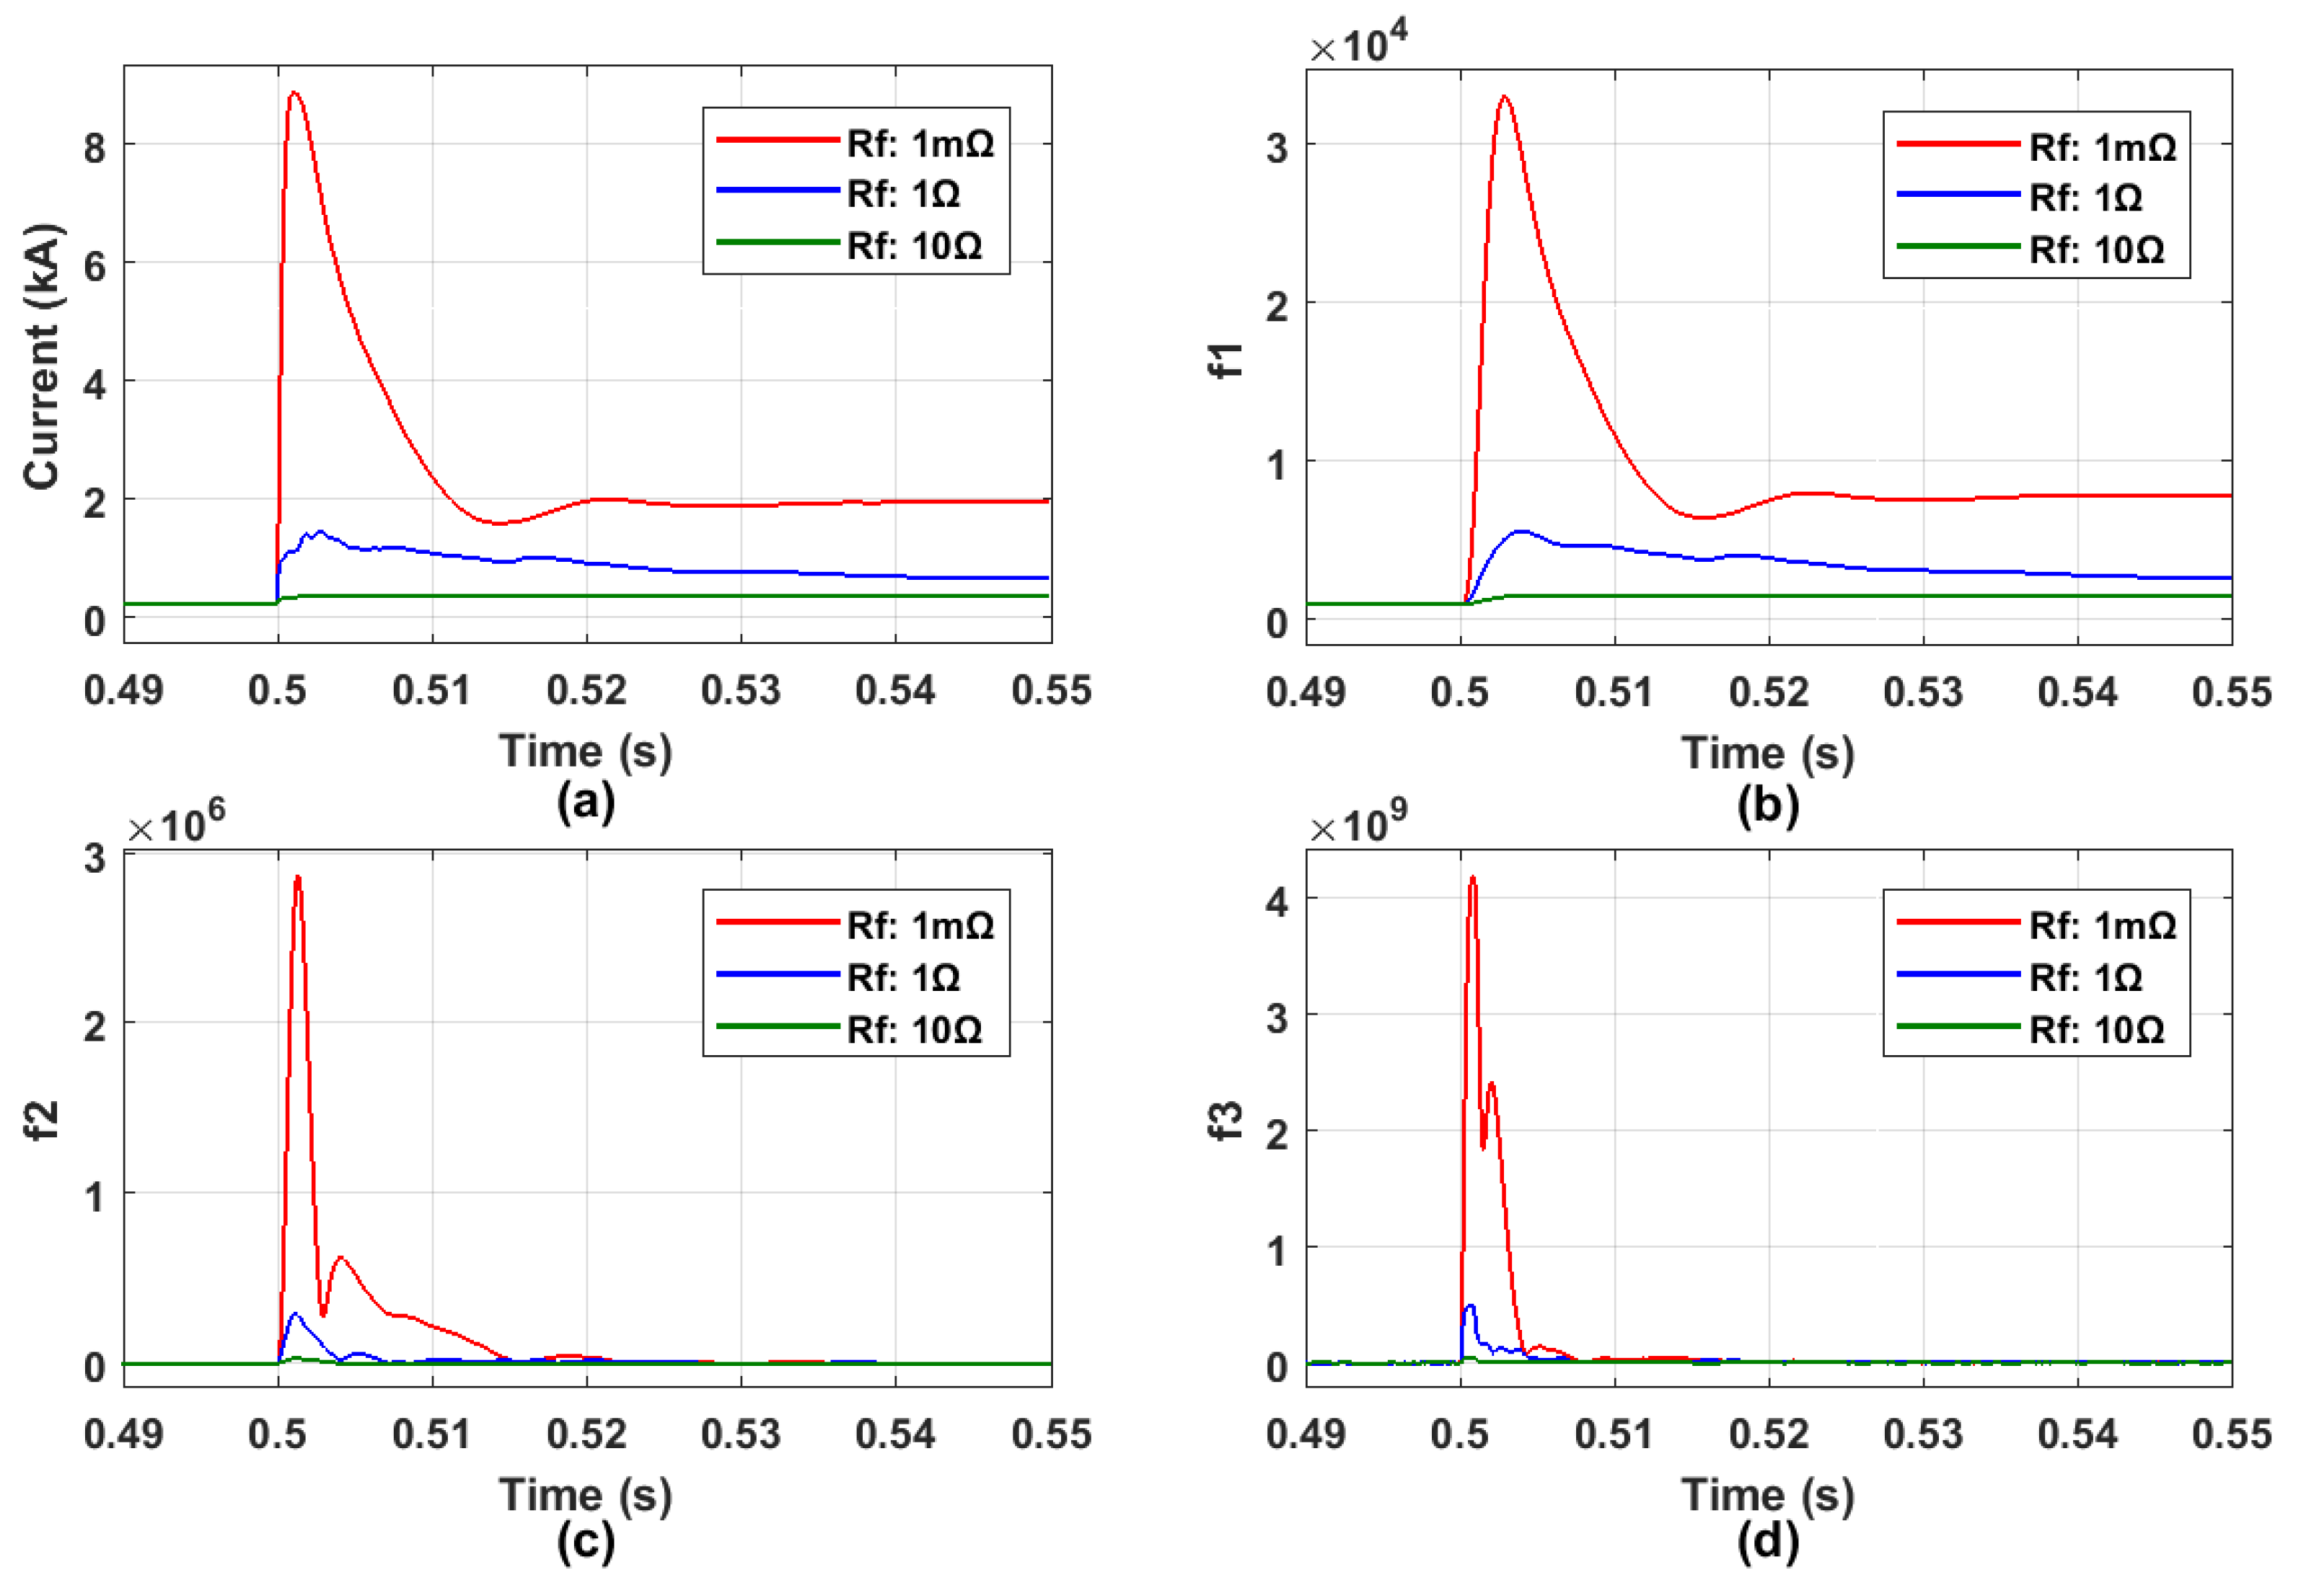
3.1. Fault Detection Method
3.2. Threshold Setting
3.3. Fault Location
3.4. Fault Pole Identification
4. Simulation Results
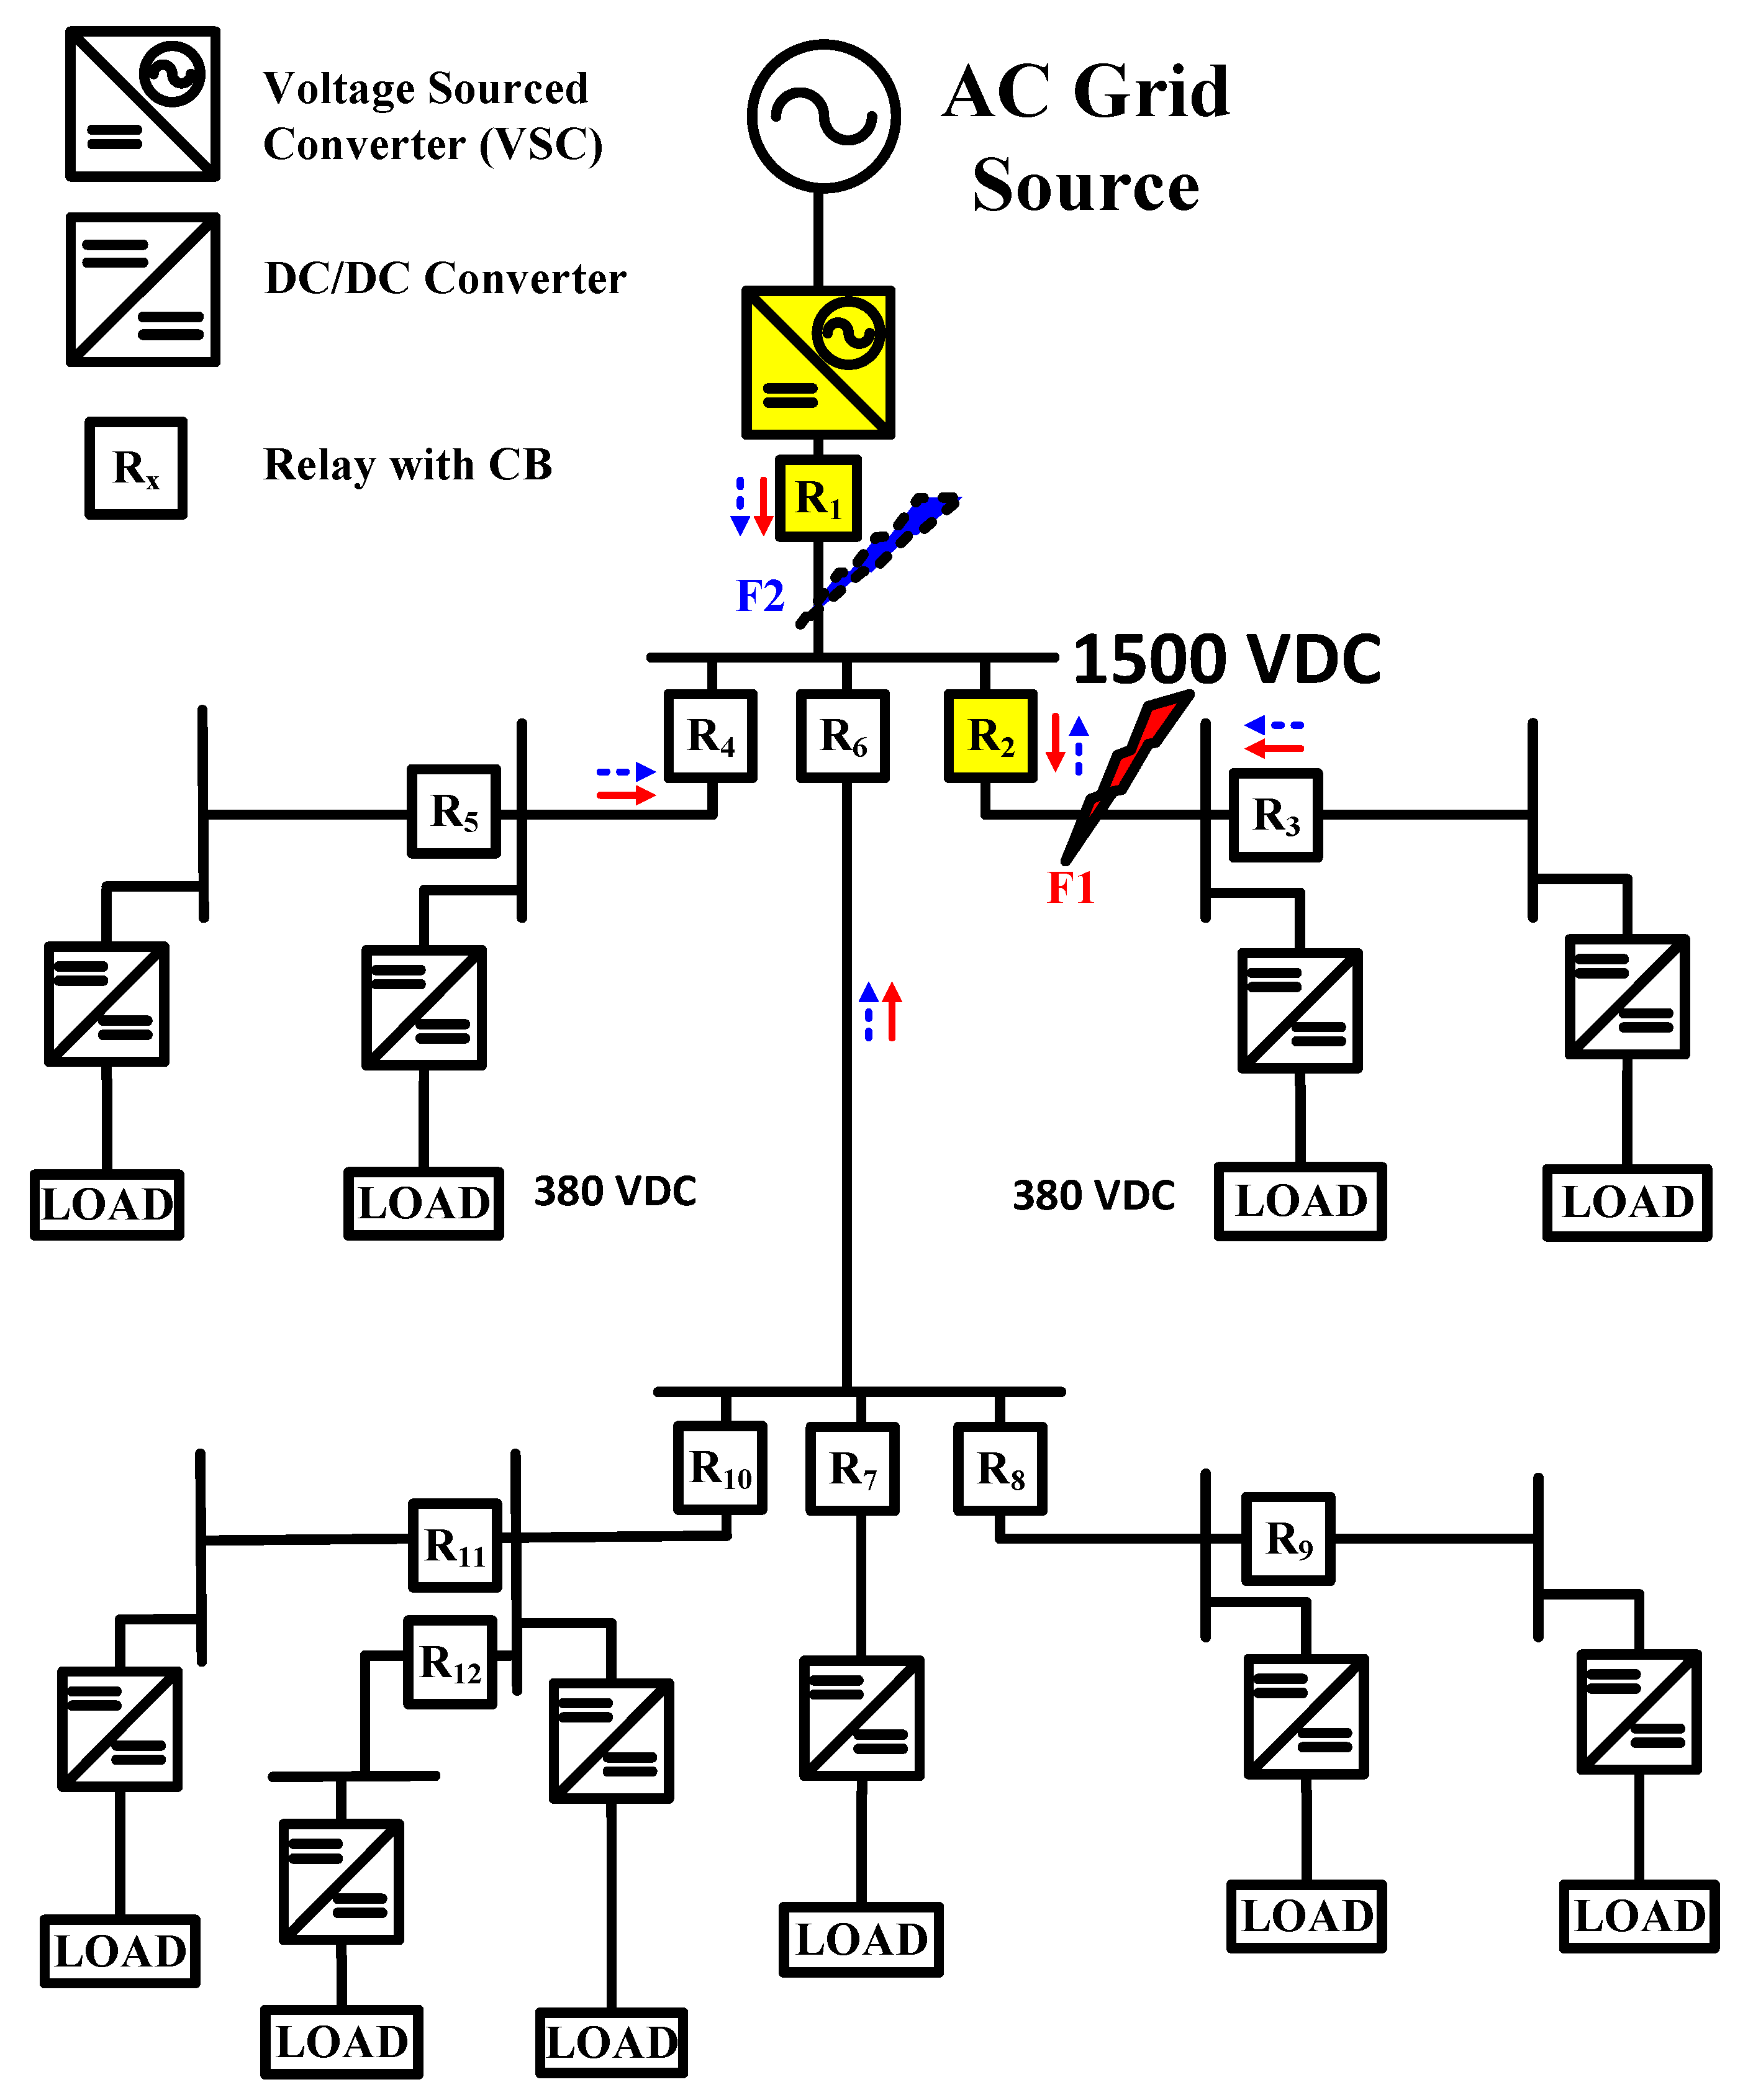
4.1. Test System
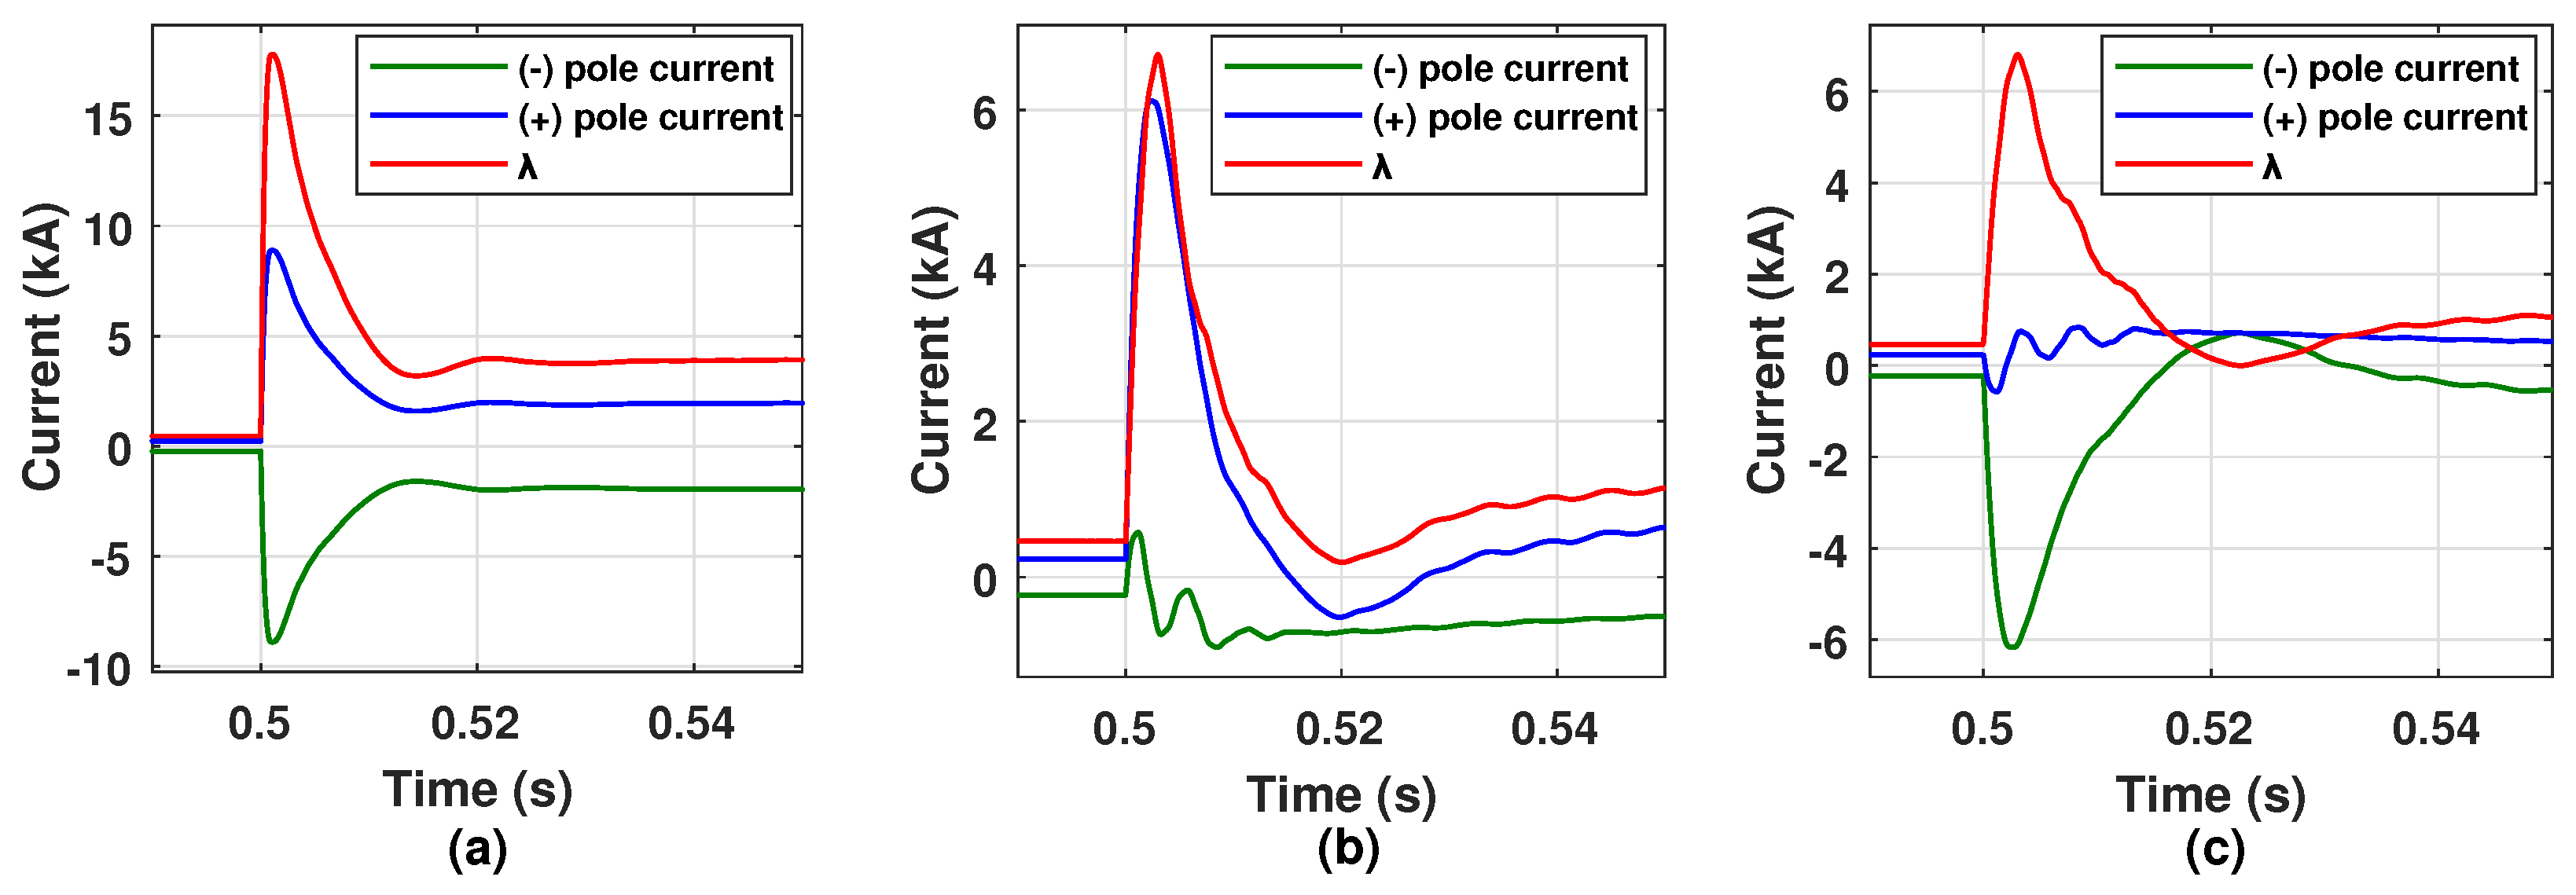
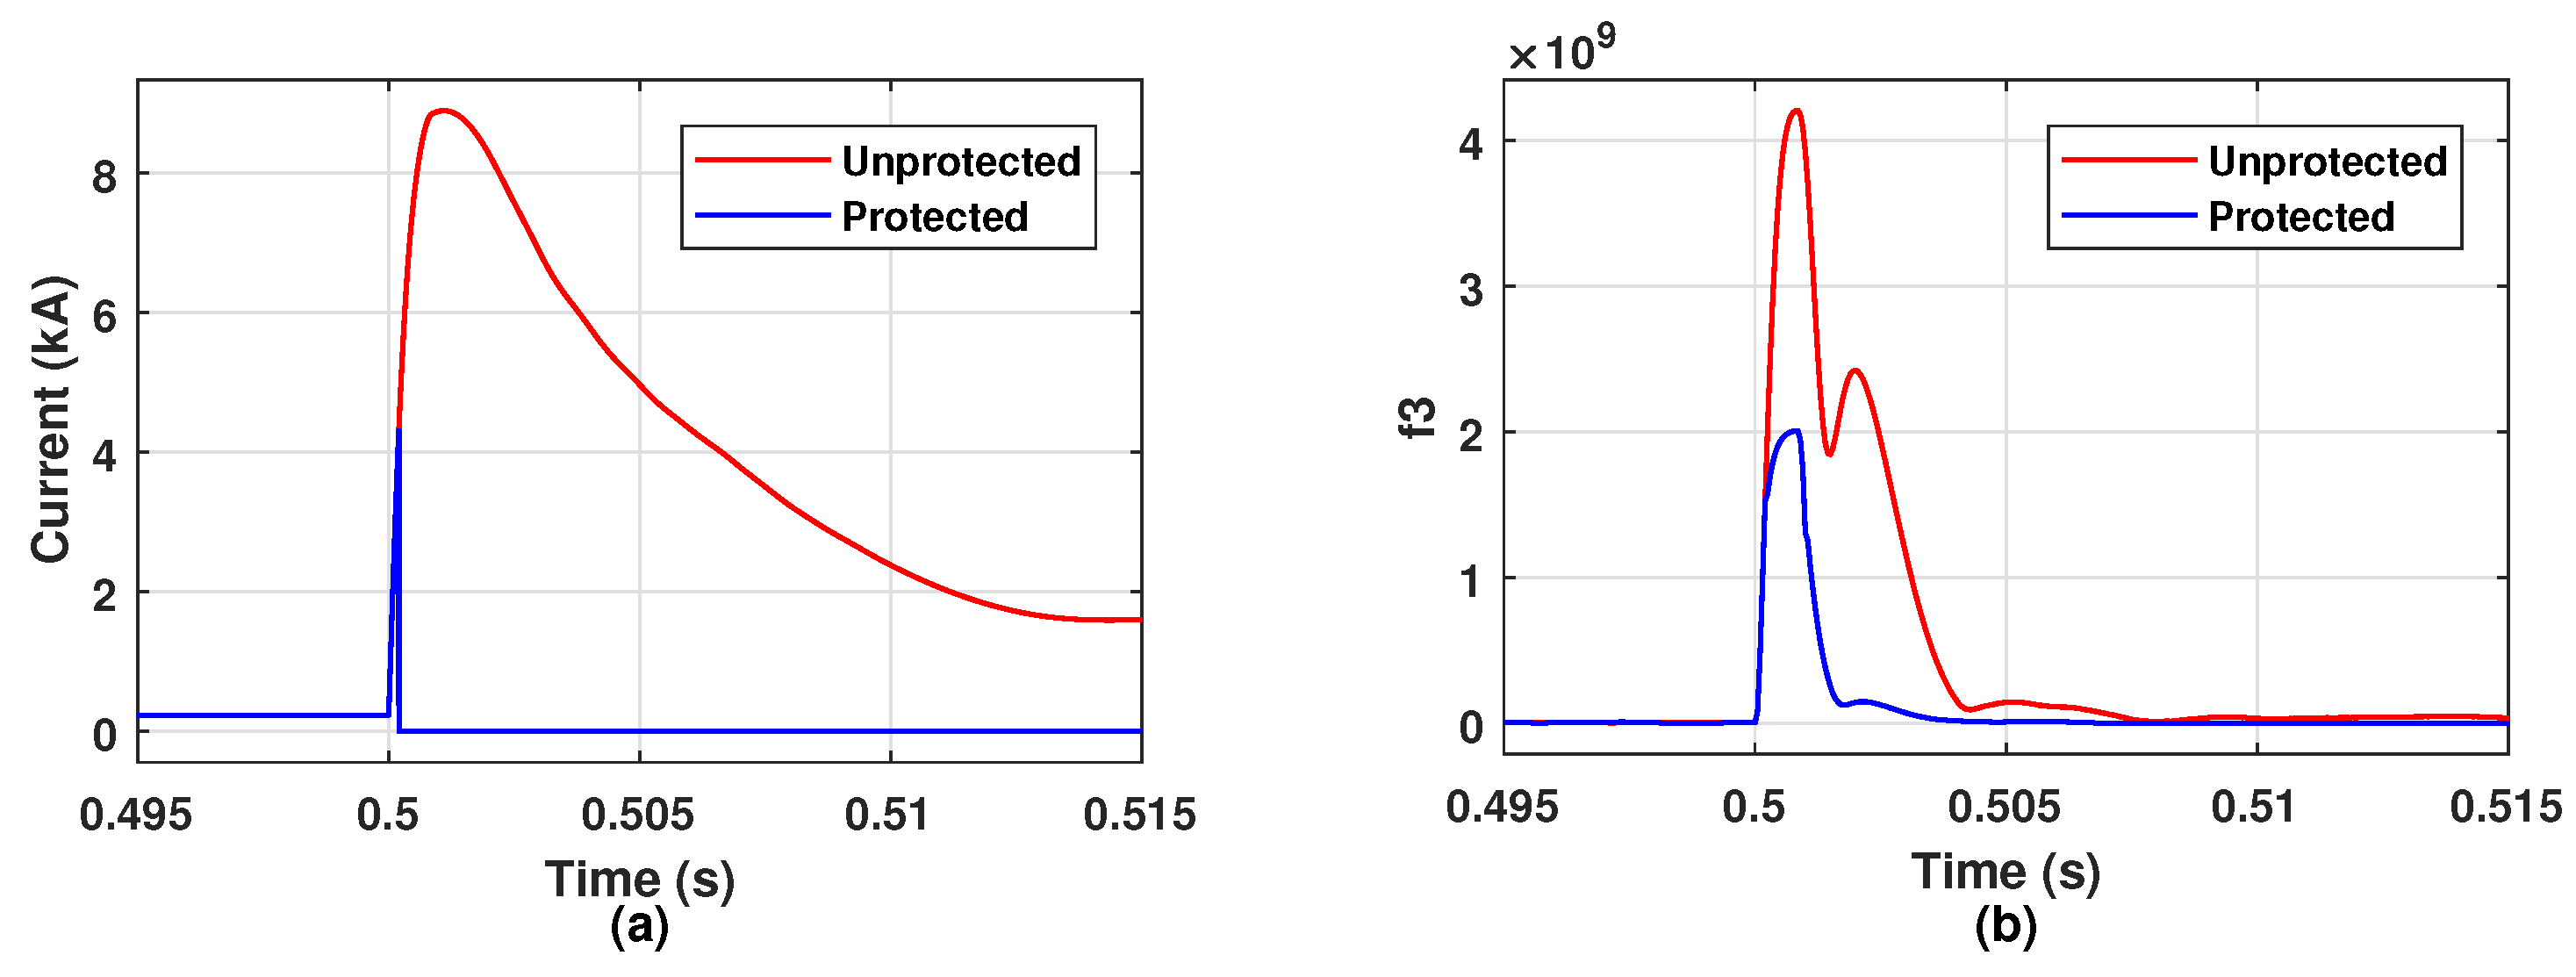
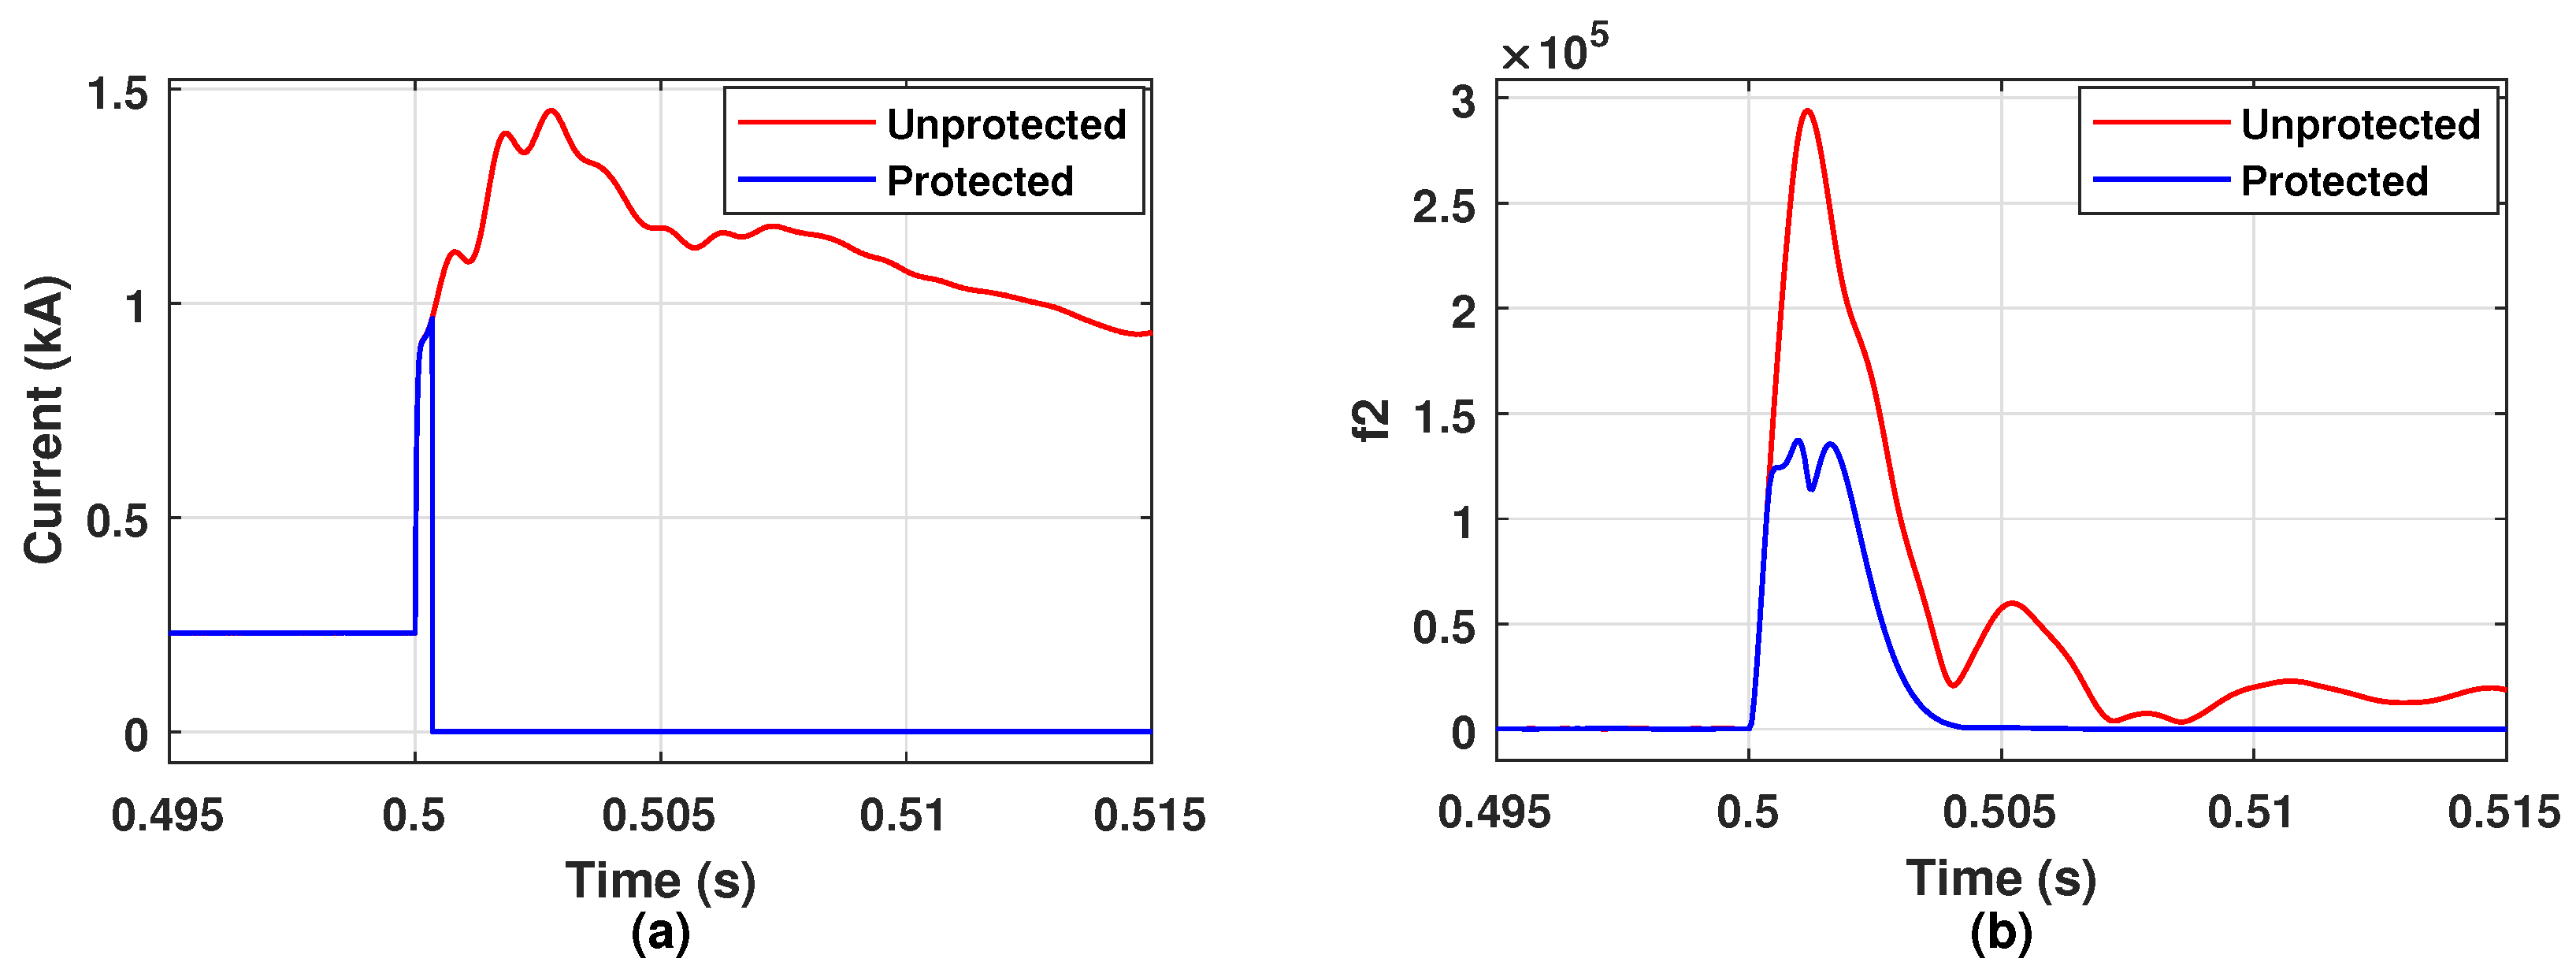
4.2. Results
4.3. Discussion
4.4. Comparison with Other Schemes
5. Conclusions
Author Contributions
Funding
Acknowledgments
Conflicts of Interest
Nomenclature
| Acronyms | |
| CB | Circuit Breaker |
| ELV | Extra Low Voltage |
| HVDC | High Voltage Direct Current |
| IGBT | Insulated-Gate Bipolar Transistor |
| LVD | Low Voltage Directive |
| LVDC | Low Voltage Direct Current |
| MMC | Modular Multi-level Converter |
| MTDC | Multi-Terminal Direct Current |
| MVDC | Medium Voltage Direct Current |
| VSC | Voltage Sourced Converter |
| Parameters & Variables | |
| First derivative | |
| Second derivative | |
| Vector sum of positive and negative pole currents | |
| C | VSC filter capacitor |
| Rate of change of current | |
| Rate of change of voltage | |
| Zero Order Moment | |
| Second Order Moment | |
| Fourth Order Moment | |
| h | Frequency index |
| Time domain current signal | |
| Sample j of the current signal, | |
| Negative pole current | |
| Positive pole current | |
| Current after a fault | |
| Current before a fault | |
| Superimposed current | |
| inductance from the relay till fault location | |
| Phase excluded Power spectrum | |
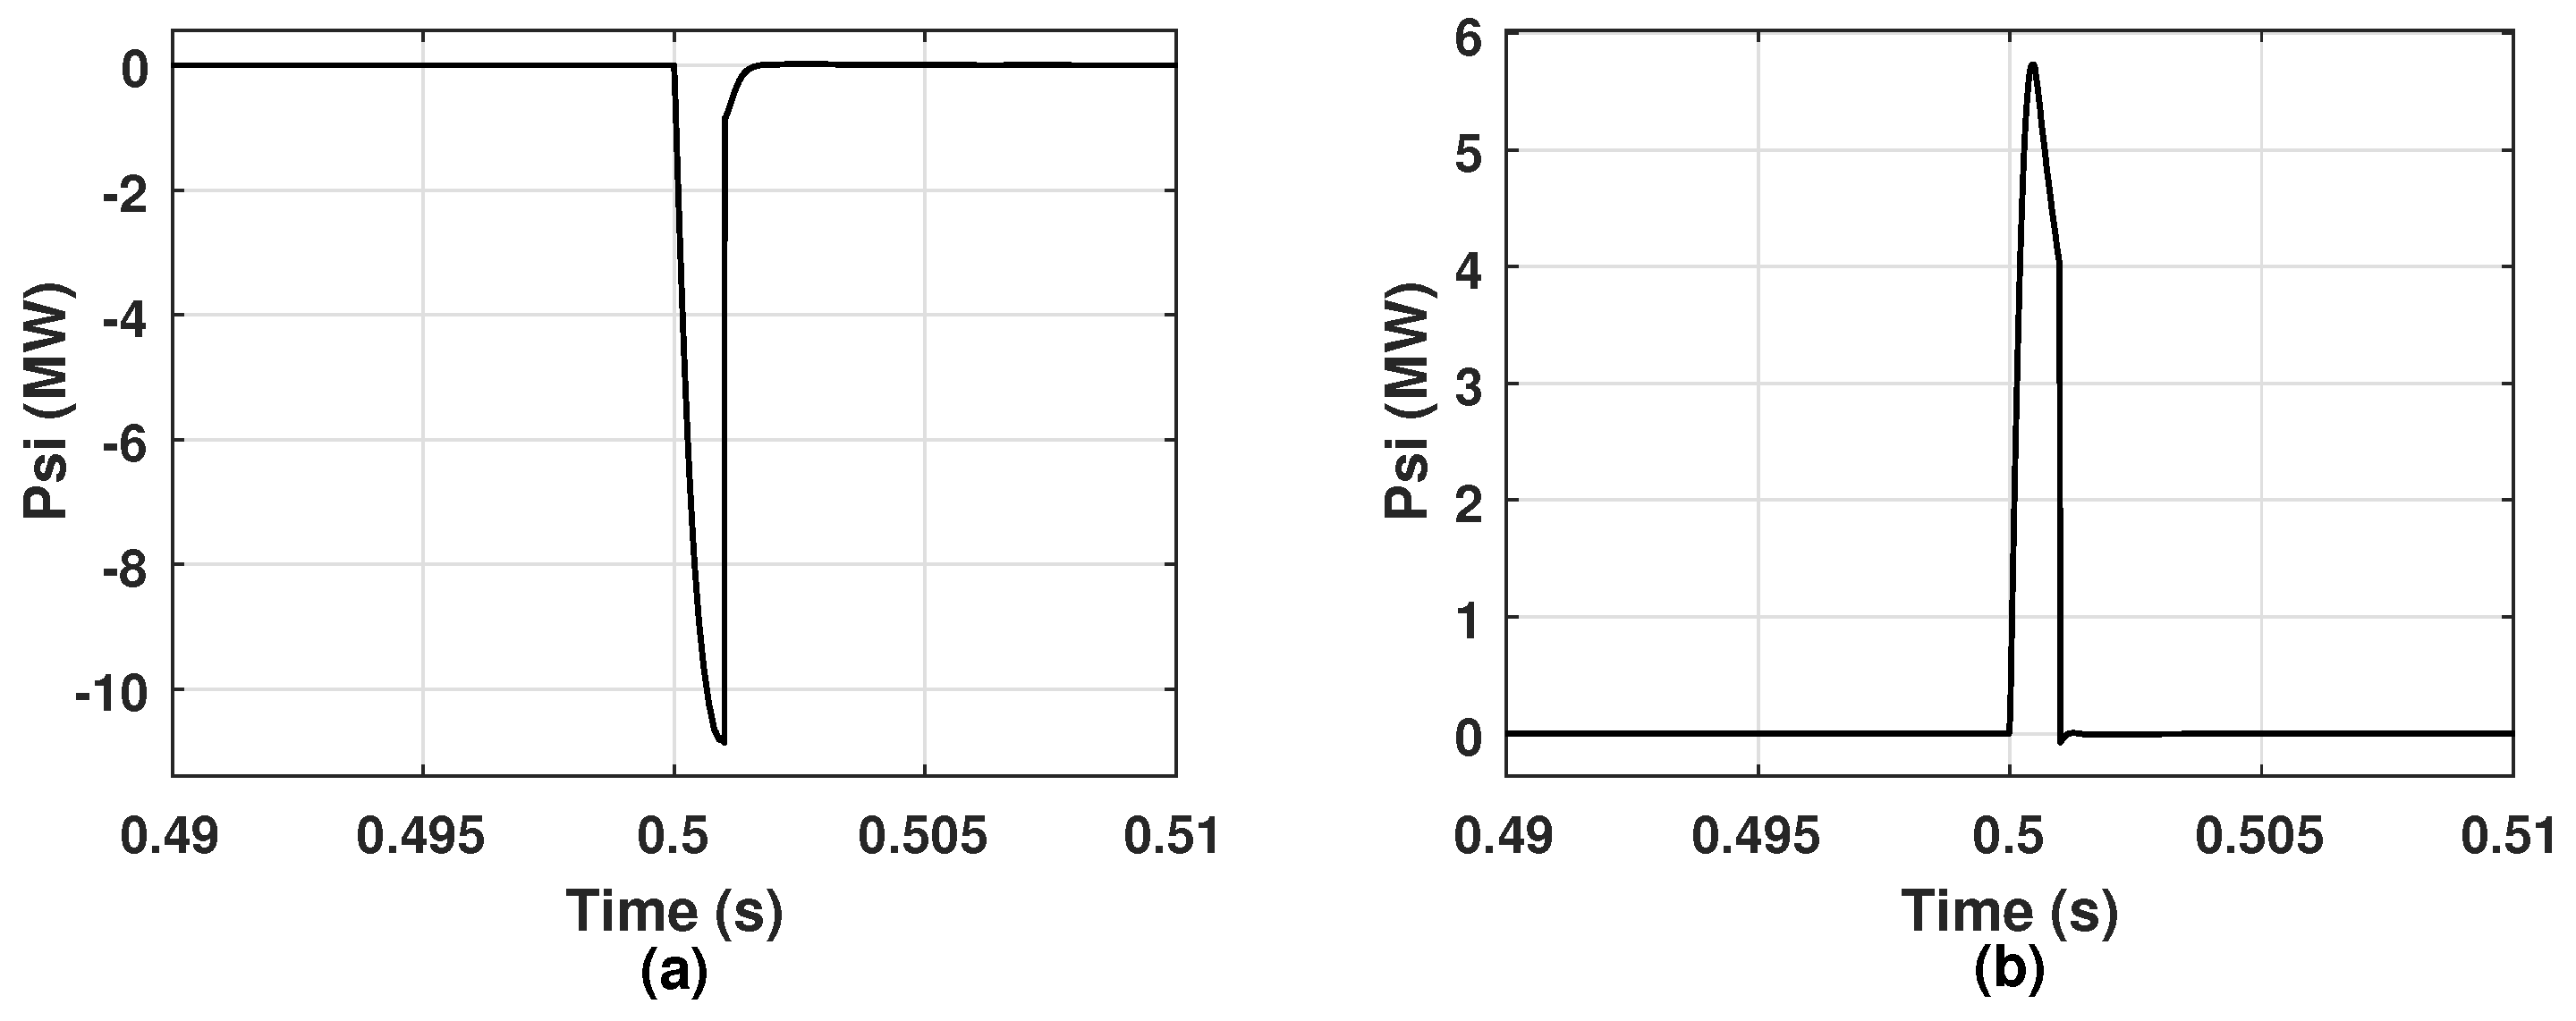
| Superimposed power | |
| maximum fault resistance that can cause an underdamping response in the network | |
| Relay with circuit breaker, x represents relay position | |
| Resistance from the relay till fault location | |
| Fault resistance | |
| S | Number of samples of the current signal |
| Voltage after a fault | |
| Voltage before a fault | |
| Superimposed voltage | |
| Discrete Fourier Transform of x | |
| Sample j of a signal, | |
References
- Larruskain, D.; Zamora, I.; Mazón, A.; Abarrategui, O.; Monasterio, J. Transmission and distribution networks: AC versus DC. In Proceedings of the 9th Spanish-Portuguese Congress on Electrical Engineering, Marbella, Spain, 30 June–2 July 2005. [Google Scholar]
- Dragicevic, T.; Vasquez, J.C.; Guerrero, J.M.; Skrlec, D. Advanced LVDC electrical power architectures and microgrids: A step toward a new generation of power distribution networks. IEEE Electrif. Mag. 2014, 2, 54–65. [Google Scholar] [CrossRef]
- Salomonsson, D.; Sannino, A. Low-voltage DC distribution system for commercial power systems with sensitive electronic loads. IEEE Trans. Power Deliv. 2007, 22, 1620–1627. [Google Scholar] [CrossRef]
- Apostolopoulos, P.A.; Tsiropoulou, E.E.; Papavassiliou, S. Demand response management in smart grid networks: A two-stage game-theoretic learning-based approach. Mob. Netw. Appl. 2018, 1–14. [Google Scholar] [CrossRef]
- Rodriguez-Diaz, E.; Savaghebi, M.; Vasquez, J.C.; Guerrero, J.M. An overview of low voltage DC distribution systems for residential applications. In Proceedings of the 2015 IEEE 5th International Conference on Consumer Electronics-Berlin (ICCE-Berlin), Berlin, Germany, 6–9 September 2015; pp. 318–322. [Google Scholar]
- Das, J.P.; Fatema, R.J.; Anower, M.S. Feasibility study of low voltage DC distribution system for residential buildings in bangladesh and hybrid home appliance design for tropical climate. In Proceedings of the International Conference on Electrical, Computer & Telecommunication Engineering (ICECTE), Rajshahi, Bangladesh, 8–10 December 2016; pp. 1–4. [Google Scholar]
- Jamali, S.; Bukhari, S.; Khan, M.; Mehdi, M.; Noh, C.-H.; Gwon, G.-H.; Kim, C.-H. Protection scheme of a last mile active LVDC distribution network with reclosing option. Energies 2018, 11, 1093. [Google Scholar] [CrossRef]
- Yazdani, A.; Iravani, R. Voltage-Sourced Converters in Power Systems: Modeling, Control, and Applications; John Wiley & Sons: Hoboken, NJ, USA, 2010. [Google Scholar]
- Yang, J.; Fletcher, J.E.; O’Reilly, J. Short-circuit and ground fault analyses and location in VSC-based DC network cables. IEEE Trans. Ind. Electron. 2012, 59, 3827–3837. [Google Scholar] [CrossRef]
- Xue, S.-M.; Liu, C. Line-to-line fault analysis and location in a VSC-based low-voltage DC distribution network. Energies 2018, 11, 536. [Google Scholar]
- Chaudhuri, N.; Chaudhuri, B.; Majumder, R.; Yazdani, A. Multi-Terminal Direct-Current Grids: Modeling, Analysis, and Control; John Wiley & Sons: Hoboken, NJ, USA, 2014. [Google Scholar]
- Monadi, M.; Koch-Ciobotaru, C.; Luna, A.; Candela, J.I.; Rodriguez, P. Multi-terminal medium voltage DC grids fault location and isolation. IET Gener. Transm. Distrib. 2016, 10, 3517–3528. [Google Scholar] [CrossRef] [Green Version]
- Baran, M.E.; Mahajan, N.R. Overcurrent protection on voltage-source-converter-based multiterminal DC distribution systems. IEEE Trans. Power Deliv. 2007, 22, 406–412. [Google Scholar] [CrossRef]
- Salomonsson, D.; Soder, L.; Sannino, A. Protection of low-voltage DC microgrids. IEEE Trans. Power Deliv. 2009, 24, 1045–1053. [Google Scholar] [CrossRef]
- Saleh, K.A.; Hooshyar, A.; El-Saadany, E.F. Hybrid passive-overcurrent relay for detection of faults in low-voltage DC grids. IEEE Trans. Smart Grid 2017, 8, 1129–1138. [Google Scholar] [CrossRef]
- Noh, C.-H.; Kim, C.-H.; Gwon, G.-H.; Khan, M.O.; Jamali, S.Z. Development of protective schemes for hybrid ac/DC low-voltage distribution system. Int. J. Electr. Power Energy Syst. 2019, 105, 521–528. [Google Scholar] [CrossRef]
- Feng, X.; Qi, L.; Pan, J. A novel fault location method and algorithm for DC distribution protection. IEEE Trans. Ind. Appl. 2017, 53, 1834–1840. [Google Scholar] [CrossRef]
- Fletcher, S.; Norman, P.; Galloway, S.; Burt, G. Fault detection and location in DC systems from initial di/dt measurement. In Proceedings of the Euro Tech Con Conference, Manchester, UK, 1 September 2003. [Google Scholar]
- Farhadi, M.; Mohammed, O.A. Event-based protection scheme for a multiterminal hybrid DC power system. IEEE Trans. Smart Grid 2015, 6, 1658–1669. [Google Scholar] [CrossRef]
- Meghwani, A.; Srivastava, S.; Chakrabarti, S. A non-unit protection scheme for DC microgrid based on local measurements. IEEE Trans. Power Deliv. 2017, 32, 172–181. [Google Scholar] [CrossRef]
- Li, R.; Xu, L.; Yao, L. DC fault detection and location in meshed multiterminal HVDC systems based on DC reactor voltage change rate. IEEE Trans. Power Deliv. 2017, 32, 1516–1526. [Google Scholar] [CrossRef]
- Qi, X.; Pei, W.; Li, L.; Kong, L. A fast DC fault detection method for multi-terminal AC/DC hybrid distribution network based on voltage change rate of DC current-limiting inductor. Energies 2018, 11, 1828. [Google Scholar] [CrossRef]
- Park, J.-D.; Candelaria, J. Fault detection and isolation in low-voltage DC-bus microgrid system. IEEE Trans. Power Deliv. 2013, 28, 779–787. [Google Scholar] [CrossRef]
- Fletcher, S.D.; Norman, P.J.; Fong, K.; Galloway, S.J.; Burt, G.M. High-speed differential protection for smart DC distribution systems. IEEE Trans. Smart Grid 2014, 5, 2610–2617. [Google Scholar] [CrossRef]
- Fletcher, S.D.; Norman, P.J.; Galloway, S.J.; Crolla, P.; Burt, G.M. Optimizing the roles of unit and non-unit protection methods within DC microgrids. IEEE Trans. Smart Grid 2012, 3, 2079–2087. [Google Scholar] [CrossRef] [Green Version]
- Christopher, E.; Sumner, M.; Thomas, D.W.; Wang, X.; de Wildt, F. Fault location in a zonal DC marine power system using active impedance estimation. IEEE Trans. Ind. Appl. 2013, 49, 860–865. [Google Scholar] [CrossRef]
- Yeap, Y.M.; Geddada, N.; Satpathi, K.; Ukil, A. Time and frequency domain fault detection in VSC interfaced experimental DC test system. IEEE Trans. Ind. Inform. 2018, 14, 4353–4364. [Google Scholar] [CrossRef]
- Geddada, N.; Yeap, Y.M.; Ukil, A. Experimental validation of fault identification in VSC-based DC grid system. IEEE Trans. Ind. Electron. 2018, 65, 4799–4809. [Google Scholar] [CrossRef]
- Li, W.; Monti, A.; Ponci, F. Fault detection and classification in medium voltage DC shipboard power systems with wavelets and artificial neural networks. IEEE Trans. Instrum. Meas. 2014, 63, 2651–2665. [Google Scholar] [CrossRef]
- De Kerf, K.; Srivastava, K.; Reza, M.; Bekaert, D.; Cole, S.; Van Hertem, D.; Belmans, R. Wavelet-based protection strategy for DC faults in multi-terminal VSC HVDC systems. IET Gener. Transm. Distrib. 2011, 5, 496–503. [Google Scholar] [CrossRef]
- Song, G.; Chu, X.; Cai, X.; Gao, S.; Ran, M. A fault-location method for VSC-HVDC transmission lines based on natural frequency of current. Int. J. Electr. Power Energy Syst. 2014, 63, 347–352. [Google Scholar] [CrossRef]
- Farshad, M.; Sadeh, J. A novel fault-location method for HVDC transmission lines based on similarity measure of voltage signals. IEEE Trans. Power Deliv. 2013, 28, 2483–2490. [Google Scholar] [CrossRef]
- Tong, N.; Lin, X.; Li, Y.; Hu, Z.; Jin, N.; Wei, F.; Li, Z. Local measurement-based ultra-high-speed main protection for long distance VSC-MTDC. IEEE Trans. Power Deliv. 2018. [Google Scholar] [CrossRef]
- Cheng, J.; Guan, M.; Tang, L.; Huang, H.; Chen, X.; Xie, J. Paralleled multi-terminal DC transmission line fault locating method based on travelling wave. IET Gener. Transm. Distrib. 2014, 8, 2092–2101. [Google Scholar] [CrossRef]
- Azizi, S.; Afsharnia, S.; Sanaye-Pasand, M. Fault location on multi-terminal DC systems using synchronized current measurements. Int. J. Electr. Power Energy Syst. 2014, 63, 779–786. [Google Scholar] [CrossRef]
- Khushaba, R.N.; Al-Timemy, A.H.; Al-Ani, A.; Al-Jumaily, A. A framework of temporal-spatial descriptors-based feature extraction for improved myoelectric pattern recognition. IEEE Trans. Neural Syst. Rehabil. Eng. 2017, 25, 1821–1831. [Google Scholar] [CrossRef] [PubMed]
- Zeng, Y.; Zou, G.; Wei, X.; Sun, C.; Jiang, L. A novel protection and location scheme for pole-to-pole fault in MMC-MVDC distribution grid. Energies 2018, 11, 2076. [Google Scholar] [CrossRef]
- European Commission, Low Voltage Directive, LVD 2006/95/EC. Available online: https://ec.europa.eu/growth/single-market/european-standards/harmonised-standards/low-voltage_en (accessed on 23 October 2018).
- IET Standards. Code of Practice for Low and Extra Low Voltage Direct Current Power Distribution in Buildings; IET Standards: London, UK, 2015. [Google Scholar]
- Kumar, D.; Zare, F.; Ghosh, A. DC microgrid technology: System architectures, AC grid interfaces, grounding schemes, power quality, communication networks, applications and standardizations aspects. IEEE Access 2017, 5, 12230–12256. [Google Scholar] [CrossRef]
- Zou, G.; Feng, Q.; Huang, Q.; Sun, C.; Gao, H. A fast protection scheme for VSC based multi-terminal DC grid. Int. J. Electr. Power Energy Syst. 2018, 98, 307–314. [Google Scholar] [CrossRef]
- Cairoli, P.; Dougal, R.A. Fault detection and isolation in medium-voltage DC microgrids: Coordination between supply power converters and bus contactors. IEEE Trans. Power Electron. 2018, 33, 4535–4546. [Google Scholar] [CrossRef]


| Feature | Threshold | Definite Time Delay | Target Faults |
|---|---|---|---|
| at 1.5× rated current | Very high-resistance faults | ||
| at 4× rated current | faults having an overdamped response | ||
| at peak current of | no delay | faults having an underdamped response |
| VSC rating | 1 MW | |
| Main line voltage | 1500 Vdc | |
| Customer voltage level | 380 Vdc | |
| Cable parameters | Resistance | 0.164 /km |
| Inductance | 0.24 mH/km |
| Fault Detection Methods | Reliability | Feasibility | Fault Discrimination | Processing Time |
|---|---|---|---|---|
| Proposed method | ✓ | ✓ | ✓ | Low |
| Overcurrent | ✓ | ✓ | ✗ | Low |
| First derivative of current | ✓ | ✓ | ✗ | Low |
| Differential | ✗ | ✗ | ✓ | Low |
| Distance | ✓ | ✗ | ✗ | Low |
| Travelling wave | ✗ | ✗ | ✓ | High |
| Signal Processing | ✓ | ✓ | ✓ | Very high |
© 2018 by the authors. Licensee MDPI, Basel, Switzerland. This article is an open access article distributed under the terms and conditions of the Creative Commons Attribution (CC BY) license (http://creativecommons.org/licenses/by/4.0/).
Share and Cite
Jamali, S.Z.; Bukhari, S.B.A.; Khan, M.O.; Mehmood, K.K.; Mehdi, M.; Noh, C.-H.; Kim, C.-H. A High-Speed Fault Detection, Identification, and Isolation Method for a Last Mile Radial LVDC Distribution Network. Energies 2018, 11, 2901. https://doi.org/10.3390/en11112901
Jamali SZ, Bukhari SBA, Khan MO, Mehmood KK, Mehdi M, Noh C-H, Kim C-H. A High-Speed Fault Detection, Identification, and Isolation Method for a Last Mile Radial LVDC Distribution Network. Energies. 2018; 11(11):2901. https://doi.org/10.3390/en11112901
Chicago/Turabian StyleJamali, Saeed Zaman, Syed Basit Ali Bukhari, Muhammad Omer Khan, Khawaja Khalid Mehmood, Muhammad Mehdi, Chul-Ho Noh, and Chul-Hwan Kim. 2018. "A High-Speed Fault Detection, Identification, and Isolation Method for a Last Mile Radial LVDC Distribution Network" Energies 11, no. 11: 2901. https://doi.org/10.3390/en11112901
APA StyleJamali, S. Z., Bukhari, S. B. A., Khan, M. O., Mehmood, K. K., Mehdi, M., Noh, C.-H., & Kim, C.-H. (2018). A High-Speed Fault Detection, Identification, and Isolation Method for a Last Mile Radial LVDC Distribution Network. Energies, 11(11), 2901. https://doi.org/10.3390/en11112901