Article

Dissociation Behaviors of CO2 Hydrate-Bearing Sediment Particle during Settling in Water

1
Institute of Mechanics, Chinese Academy of Sciences, Beijing 100190, China
2
School of Engineering Science, University of Chinese Academy of Sciences, Beijing 100049, China
*
Author to whom correspondence should be addressed.
Energies 2018, 11(11), 2896; https://doi.org/10.3390/en11112896
Submission received: 18 September 2018 / Revised: 12 October 2018 / Accepted: 22 October 2018 / Published: 24 October 2018

Abstract

:
Dissociation processes of gas hydrate-bearing sediment particles in water flow condition were investigated. Experiments were carried out by observing a spherical CO2 hydrate-bearing sediment (CHBS) particle settling in water. The release process of gas bubbles from CHBS particles was recorded by a high-speed camera and the total time of dissociation was obtained for different particle diameters and water temperatures. An intrinsic dissociation model was presented based on the assumption that the dissociation rate of the CHBS particle is exponential with the concentration of remaining hydrate. The model considered the influences of changing temperature, pressure and the particle concentration on the dissociation rate. The constants in the model were obtained based on fitting the experimental data. The presented model can reveal the dissociation behavior of the CHBS particle.

1. Introduction

Gas hydrate (GH) is a kind of solid cage-type compound consisting of gas (methane, CO2, propane, etc.) and water. Naturally, methane gas hydrate exists extensively in the sediments of seafloor, permafrost and deep lakes [1,2,3]. The challenges of the commercial development of methane hydrate (MH) in sediments are to improve recovery efficiency and to ensure seabed stability.
Solid fluidization exploitation is a highly efficient and safe method for shallow marine hydrate due to the utilization of warm surface seawater and convective heat transfer [4,5,6]. Similar to mining, sediments were cut into small bodies of different sizes (mm to cm), and transported into the well. Gas hydrate in the well dissociates during upward flow and the dissociation rate is affected by the water temperature, flow velocity and size of gas hydrate-bearing sediment particles, etc. Hence, the dissociation behaviors of gas hydrate-bearing sediment particles in the water flow condition are essential to understand the transportation processes and to optimize the new exploitation method.
A great deal of research on the GH dissociation has been carried out. In general, the dissociation rate involves many factors, such as intrinsic dissociation rate, heat transfer rate and mass transfer rate [7]. Among them, the intrinsic dissociation rate is essential for the prediction of gas production. Kim et al. [8] performed some experiments to study the kinetics of MH dissociation in a stirring reactor and proposed a mathematical model to describe the hydrate dissociation. Clarke and Bishnoi [9] carried out a kinetic study on the CO2 hydrate, ethane hydrate and MH, both using experimental work and an analytical model. Their experiments were conducted in stirred tank-type reactors to eliminate the effects of mass and heat transfer resistances. Their analytical model was deduced based on the model of Kim et al. [8]. Their results showed that the dissociation rate is proportional to the particle surface area and the difference in the fugacities of carbon dioxide at the equilibrium pressure and the dissociation pressure. The Kim-Bishnoi dissociation model is regarded as classic and is the most commonly used model to stimulate the hydrate dissociation process. Sean et al. [7] and Fukumoto et al. [10] estimated the dissociation rate of MH and CO2 hydrate at a given surface area of the hydrate particle in water flow, respectively, by means of experiments and numerical simulations. The dissociation rate was given based on the rate constant multiplied by the driving force, which was assumed to be the molar Gibbs free energy difference between the hydrate phase and the ambient aqueous phase. However, all the above models are constructed based on the mechanism of pure hydrate dissociation and have not considered the influences of continuously changing temperature, pressure and particle concentration on the dissociation rate. Therefore, they are not suitable for describing the hydrate dissociation of CO2 hydrate-bearing sediment (CHBS) particles in the multiphase flow condition.
CO2 can form structure I (sI) gas hydrate under lower phase equilibrium conditions compared to methane. CO2 hydrate is similar to MH in thermal and mechanical properties, and is often used as a substitution in experiments. In addition, forming CO2 hydrate in deep marine sediment is a promising approach for CO2 sequestration [11,12,13].
The objective of the present paper is to develop a new model to describe the dissociation behaviors of CO2 hydrate in CHBS particles using an analytical and experimental approach. First, an analytical model is presented in Section 2 and the constants in the model are defined. Second, the dissociation experiments of a single CHBS particle and group particles with the various diameters at the atmospheric pressure (see Section 3) were conducted in water with a temperature range of 283.15 K–298.15 K and initial temperature of 253 K. Third, the model parameters were obtained by fitting the data of the single particle experiments. Finally, the data of the group particles experiments were used to verify the validity of the model. This research can reveal the main feature of the dissociation process of gas hydrates.

2. Gas Hydrate Dissociation Model

To establish the dissociation model of gas hydrate, it was assumed that CHBS particles were ideal spheres and consist of three components (hydrate, water and clay), and GH were homogeneously distributed in the sediments. Fragmentation of the CHBS particles during the dissociation process is not considered. Kim et al. [8] pointed out that the hydrate dissociation process included the destruction of clathrate host lattice on the surface of particles and the desorption of gas molecules through the surface. According to this knowledge, Sun and Chen [14] formulated the hydrate dissociation process by assuming that the dissociation rate of hydrate was directly linearly proportional to the concentration of remaining hydrates. In this paper, we assume the rate of hydrate dissociation is exponential with the concentration of remaining hydrates:
r = d C GH d t = k C GH η
where r is the reaction rate of GH dissociation, kmol / s ; C GH is the molar concentration of remaining GH, kmol; η is the rate exponent used to adjust the reaction rate, dimensionless; and k is the rate constant. An Arrhenius-type equation is applied [7]
k = A ( T s T e ) β exp ( E a R T s )
where A is the pre-exponential factor, kmol 1 η s 1 ; β is the temperature exponent, dimensionless; E a is the activation energy, J / mol ; R is the universal gas constant; J / mol K . T s is the temperature of particles, K; T e is the GH phase equilibrium temperature. Sloan’s expression [15] for the phase equilibrium pressure P e (MPa) as a function of T e is given by
P e = 10 3 exp ( α + β T e )
where α = 44.6 and β = 1.02 × 10 4 . Thus, Equation (1) can describe the effect of continuously varying temperature, pressure and the particle concentration on the dissociation rate.
The initial condition is
t = 0 , C GH = C 0
where C 0 is the total molars of hydrate contained in the CHBS particles initially.
Due to the fact that the hydrate dissociation process occurs at the particle surface, the mass transfer rate of the released gas can be ignored [14]. The temperature of the solid particle is assumed to be constant during dissociation process. This means that the heat transfer effect is ignored to obtain the intrinsic dissociation rate [7] and the temperature of particles quickly rises from the initial value T s 0 to the temperature of the ambient water T l 0 . So k can be viewed as a constant when the phase equilibrium temperature remains unchanged. Integrating Equation (1) and substituting Equation (4) gives
t = 1 k 1 1 η ( C 0 1 η C GH 1 η )
So,
C GH = [ C 0 1 η k ( 1 η ) t ] 1 1 η
Thus, the relationship between the amount of released gas and the dissociation time can be derived as
V gt = ( C 0 C GH ) M g ρ g = { C 0 [ C 0 1 η k ( 1 η ) t ] 1 1 η } M g ρ g
where M g represents the molar mass of gas and ρ g is the gas density.
Substituting C GH = 0 into Equation (5) can yield the time t dis required for the complete dissociation of a certain amount of hydrates:
t dis = 1 k 1 1 η C 0 1 η
For a single hydrate-bearing spherical particle, the total molars of hydrate contained in the particle is
C 0 = π d s 3 ρ GH φ S H 6 M GH
where d s is the particle diameter; ρ GH is the density of hydrate; φ is the porosity of the particle; S H is the hydrate saturation; and M GH is the molar mass of hydrate. Thus, the total dissociation time t dis is
t dis = 1 A ( T l 0 T e ) β exp ( E a R T l 0 ) 1 1 η ( π d s 3 ρ GH φ S H 6 M GH ) 1 η
It can be seen that t dis is dependent on T s , d s and S H for the single spherical particle case. The four model parameters ( A , E a , β and η ) can be determined by the experimental data of time for the complete dissociation of the CHBS particles under different operating conditions.

3. Experimental Setup

3.1. Preparation of CHBS Particles

3.1.1. Experimental Apparatus

The clay sample from the Shenhu area in the South China Sea was used as the soil skeleton with a grain size ranging from 300 μ m to 450 μ m . The specific weight of the samples was 2.81 [16]. The dry soil was mixed with deionized water until reaching a water content of 22%. A given amount of the soil was mounted in a spherical rubber mold with the inner diameters of 7–10 mm. In this way, spherical soil particles of different diameters were obtained with a porosity of 0.4. The spherical soil particles were then used to prepare spherical CHBS particles in a high-pressure vessel. This vessel was put inside a cold room, which is able to control temperatures ranging from 243 K to 303 K with an accuracy of ± 0.5 K. Figure 1 shows the schematic diagram of the experimental apparatus used to prepare the CHBS particles. The apparatus consists of a high-pressure vessel, gas tank, gas pressurization system and cold room. The vessel is made of stainless steel with the maximum pressure of 30 MPa. The inner volume of the vessel can be changed by using a movable piston. The inner diameter of the vessel is 7.5 cm and the maximum height is 30 cm. The gas pressurization system is used to supply gas at a given pressure to the vessel.

3.1.2. Preparation Procedure

The procedure for preparing CHBS particles is as follows:
  • The temperature of the cold room was set as 268 K and was kept constant during the formation of CHBS particles.
  • CO2 was injected into the vessel through the gas pressurization system. When the gas pressure achieved 5 MPa, the vessel was closed as an isochoric system to form CHBS particles.
  • The formation process lasted for 48–72 h until the pressure did not decrease with time.
  • The vessel was depressurized to 0.1 MPa after Step 3 by slowly venting gas through the valve.
  • The temperature of the cold room was reduced to 253 K for 3–4 h.
  • The CHBS particles were obtained as shown in Figure 2a,b. The dissociation experiments were performed at the atmospheric pressure. According to Equation (3), the phase equilibrium temperature T e at the atmospheric pressure is 257.15 K. The initial sample temperature T s 0 was set to 253 K, which is about 1.5% lower than the phase equilibrium temperature at the atmospheric pressure. The main purpose was to prevent the hydrate from dissociating immediately when the vessel was depressurized to the atmospheric pressure. If the initial sample temperature was higher than 257.15 K, the hydrate began to dissociate immediately when the prepared CHBS particles were taken out from the vessel, and the released water formed ice to make the particles stick together, as shown in Figure 2c.

3.1.3. Measurement of Hydrate Saturation

The procedure for the hydrate saturation measurement are as follows:
  • Get a closed container for the CHBS particle. The mass of the container is weighed and recorded as m 0 .
  • Put a single CHBS particle in the closed container. The mass of the container and the particle is weighed by a NewClassic ME analytical balance with an accuracy of ± 0.0001 g. The mass is recorded as m 1 .
  • The closed container is kept at room temperature until the hydrate is completely dissociated. After the CO2 produced due to dissociation is released, the mass is weighed and recorded as m 2 .
  • The particle is dried at 373.15 K for 12 h and then weighed, and the mass is recorded as m 3 .
The hydrate saturation is defined as the volume ratio of hydrate to the pore and then can be shown as
S H = V GH V a + V w + V GH
where V GH = m CO 2 M GH / ( M CO 2 ρ GH ) . In addition, m CO 2 = m 1 m 2 is the mass of carbon dioxide which forms the hydrate in a single particle and ρ GH = 1117   kg / m 3 is the density of hydrate [10]. Moreover, V w = m w / ρ w , where m w = m 2 m 3 is the mass of the added water in a single particle. ρ w = 1000   kg / m 3 is the density of water. Hence, the air volume V a in a single CHBS particle can be derived as
V a = φ 1 φ V sand V w V GH
where φ = 0.4 . The volume of the soil skeleton V sand = m sand / ρ sand , where m sand = m 3 m 0 , is the mass of the soil skeleton in a single particle.

3.2. Dissociation Experiments of Single CHBS Particle

Hydrate dissociation experiments were conducted with a CHBS particle settling in water with a certain initial velocity under the given conditions of atmospheric pressure and water temperature T l 0 (ranging from 283.15 K to 298.15 K). The CHBS particle was dropped from a height of 3 cm over the water surface and then the particle was immersed in water. The dissociation of hydrate was driven by the temperature difference between the particle and water. When the temperature of the particle exceeded the equilibrium phase boundary condition, the hydrate started to dissociate and produce gas bubbles. The whole dissociation process was recorded by using a high-speed camera (Phantom VEO410L) equipped with a DC source bright LED light. The time required for the particle to be dissociated completely was recorded.
During the process of the particle settling in water, a sufficient amount of heat for dissociation was supplied from the ambient water. Hence the hydrate dissociation can be assumed to occur under isothermal conditions and the local thermal effect was ignored [7]. Due to the fact that the experiments were carried out at atmospheric pressure, the process of hydrate dissociation was rapid and occurred at the particle surface. Hence, the mass transfer resistance of the released gas can be ignored [14] and the dissociation rate obtained by these experiments can be recognized as the intrinsic dissociation rate.

3.3. Dissociation Experiments of Group Particles

Figure 3 shows a schematic drawing of the experimental apparatus used for the dissociation of group CHBS particles. A Plexiglass tube (inner diameter of 4.24 cm and height of 35.60 cm) was used. Initially, group CHBS particles accumulated at a certain height h 0 from the bottom of the tube and then had a volume fraction of α s 0 . The initial temperature of CHBS particles was T s 0 and hydrate saturation was S H . The tap water at temperature T l 0 was injected into the tube from the bottom inlet at a certain velocity v l 0 . The flow of the water was measured by a turbine meter. A drying tank connected to the outlet was used to dry the released gas. A gas flow meter with a measurement error of ± 1 % was used to measure the CO2 gas volume. It is noted that the effect of the excess air in the tube was eliminated through a parallel test which conducted with spherical soil particles without hydrate. When the water reached the top of the tube, the inlet was closed to prevent the mixture of gas and water from flowing into the drying tank and the gas flow meter. Before the inlet was closed, water was flowing into the tube continuously, and heat transfer between the water and particles was dominated by convection. The temperature of the ambient water did not significantly decrease due to the hydrate dissociation. After the inlet was closed, the water in the tube did not flow upwards and heat conduction played the dominant role in the heat transfer between the water and particles. During the hydrate dissociation, the water temperature decreased significantly, which in turn reduced the dissociation rate. Thus, only the experimental data obtained before the inlet was closed were useful and can be used to compare with the theoretical model determined by the dissociation experiments of a single particle. At the same time, the flowing water can take away part of the released gas, avoiding excessive gas concentration around the particles, which would affect the dissociation of hydrate.

4. Results and Discussion

Figure 4 shows gas bubbles emerging from the surface of the single CHBS particle. When the particle was immersed in water, gas was progressively released from the particle in the pattern of small bubbles which deviated from the particle and went upwards in the water. After a certain time, a group of gas bubbles occurred around the CHBS particle because enough heat had transferred into its surface through convective heat transfer between the water and particle. Surface soil grains (at sizes from several microns to tens of microns) were separated from the CHBS particle due to the great decrease in the cohesion between the soil grains after the dissociation of hydrate took place.

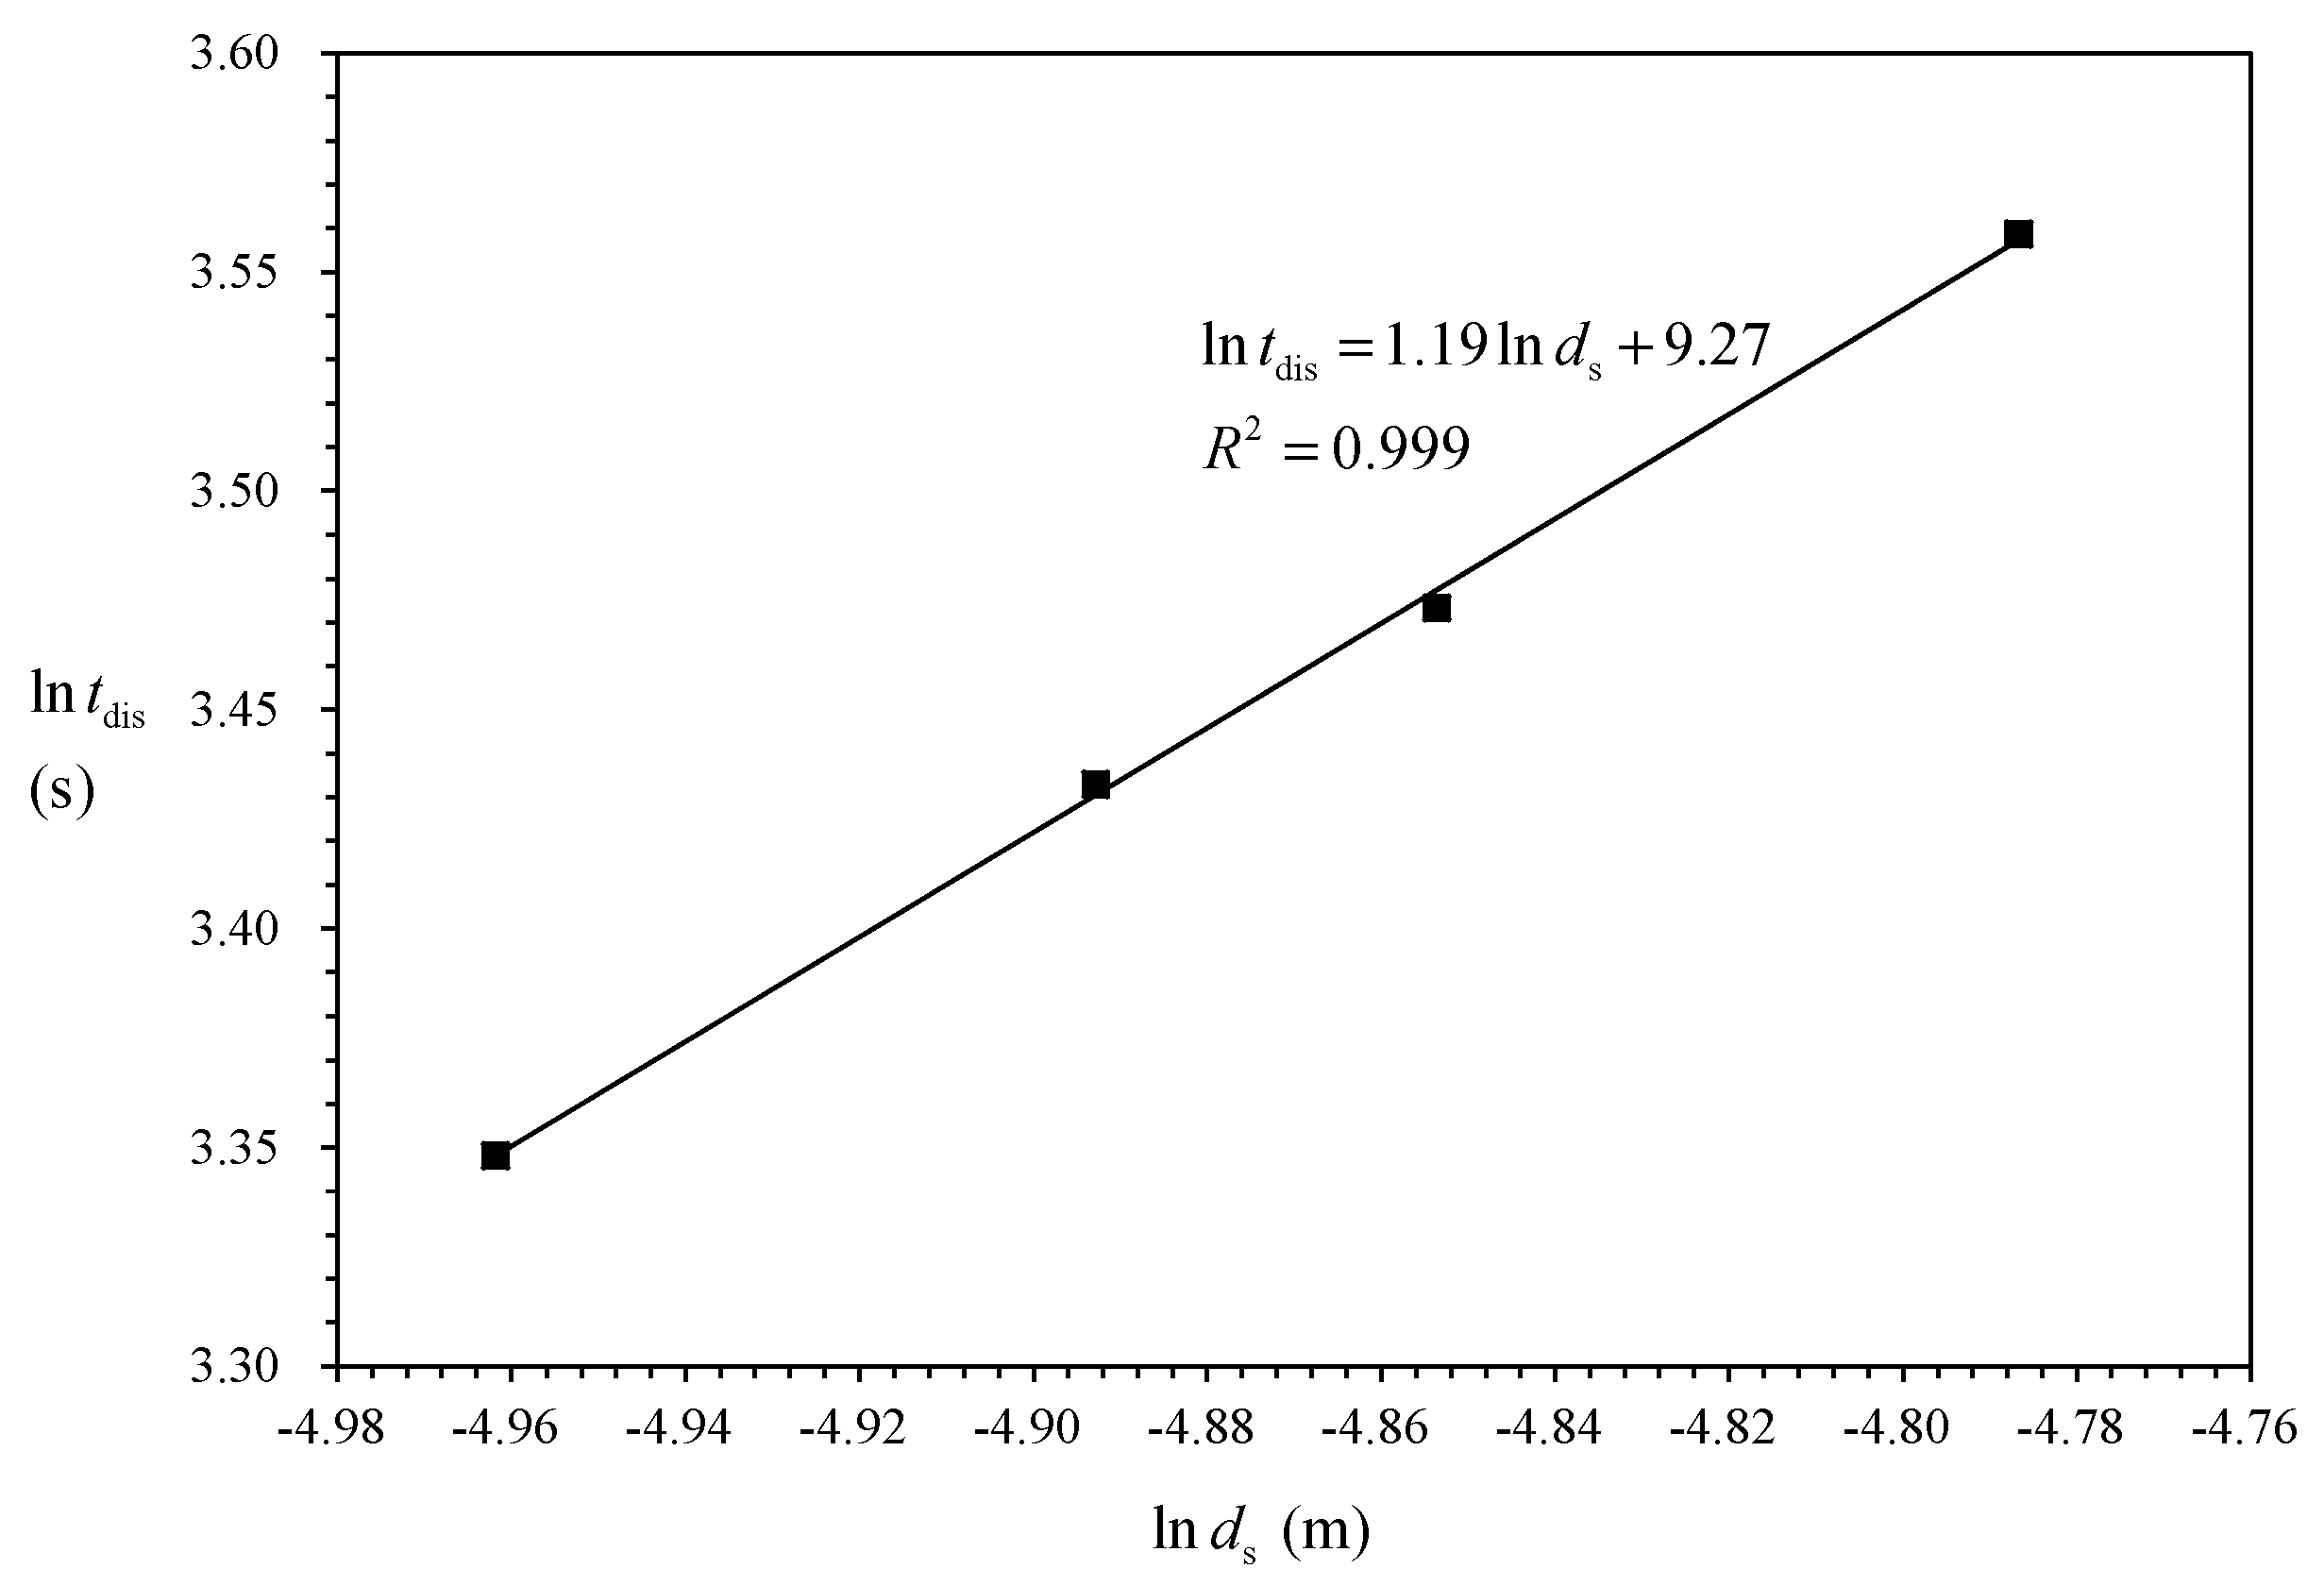
4.1. Determination of the Dissociation Model

Table 1 summarizes the results for the dissociation experiments of a single CHBS particle at atmospheric pressure. The dissociation experiments were performed according to the procedures described in Section 3.2. The hydrate dissociation time was obtained at different water temperatures and particle diameters.
Figure 5 shows that the dissociation time of the single particle with different diameters (cases 1–4) at the initial water temperature of 283.15 K. It can be seen that the dissociation time t dis increases as d s increases because the larger diameter contains more hydrate. The relationship between ln t dis and ln d s is approximately linear. The correlation shown in Figure 5 can be expressed as
ln t dis = 1.19 ln d s + 9.27
For the same water temperature cases, it can be seen that ln t dis is proportional to 3 ( 1 η ) ln d s by taking logarithmic Equation (10). Thus, 3 ( 1 η ) = 1.19 , which gives η = 0.6 .
For the same particle diameter cases, taking the natural logarithm for both sides of Equation (10) gives
ln t dis = E a R T l 0 β ln T l 0 + m
where m is a constant. Figure 6 shows the dissociation time of the single particle with a particle diameter of 7.50 mm (cases 2 and 5–7) under conditions of different initial water temperatures. Higher water temperature provides greater driving force for hydrate dissociation. In other words, the higher T l 0 causes faster hydrate dissociation. Figure 6 shows a correlation for ln t dis and T l 0 as
ln t dis = 1744 T l 0 2 ln T l 0 + 8.56
The values of E a and β can be obtained by comparing Equations (14) and (15), which result in E a = 1.45 × 10 4   J / mol and β = 2 . Substituting the values of η , E a and β into Equations (13) and (15) yields A = 2.76 × 10 2   kmol 1 η s 1 . Note that M GH = 147.5   kg / kmol and T e = 257.15   K at atmospheric pressure for the CO2 hydrate.

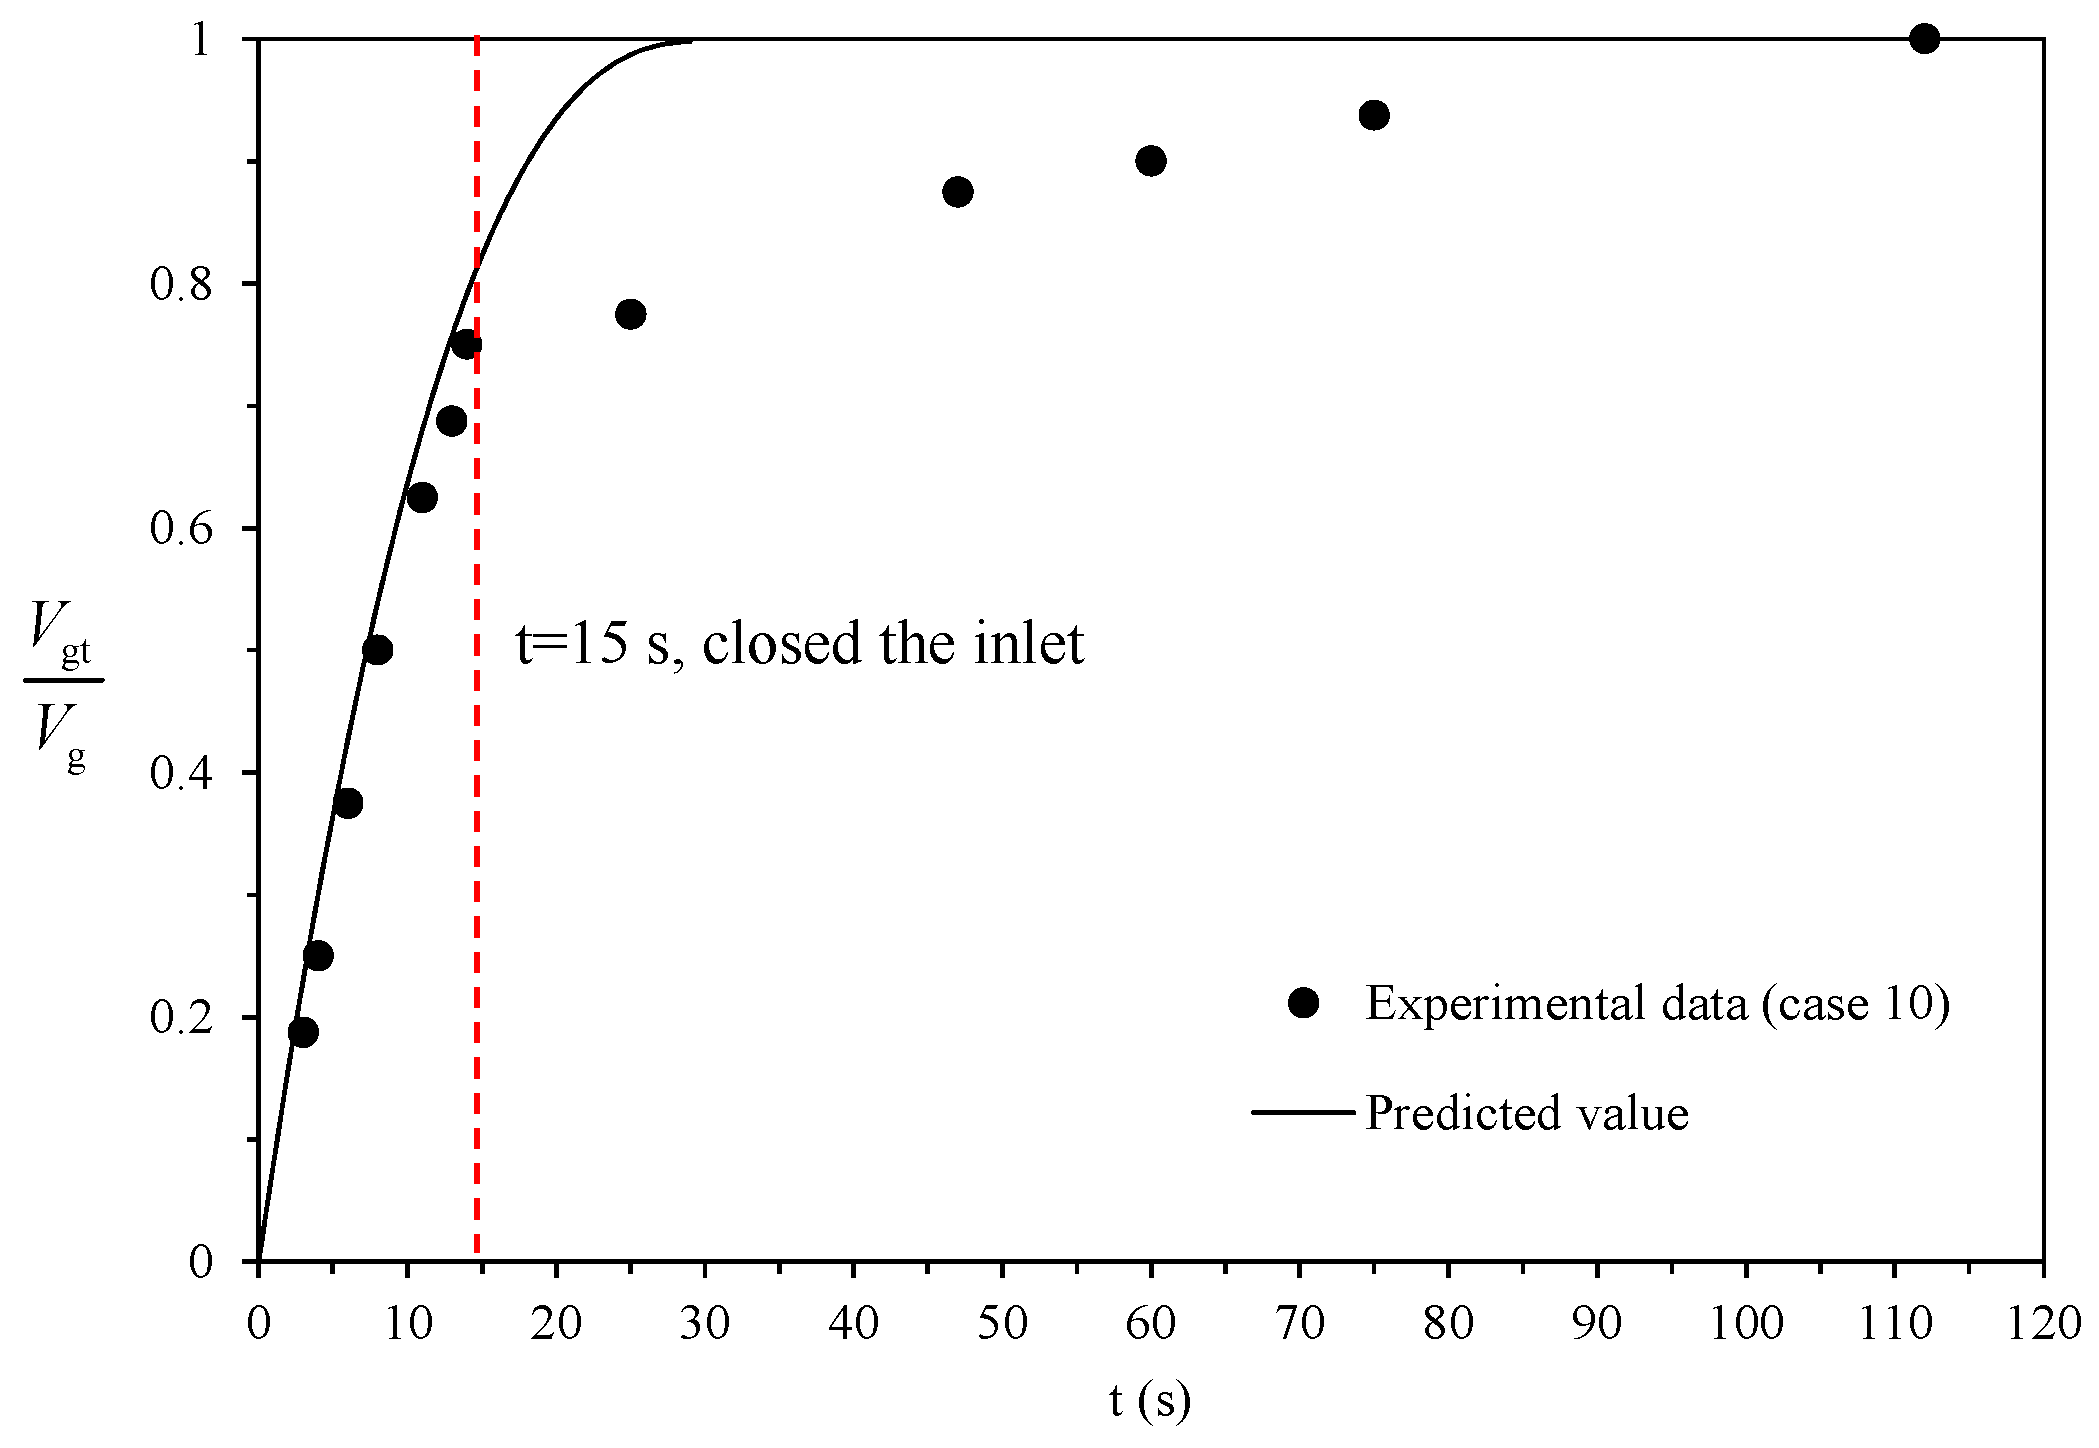
4.2. Model Prediction

The amount of gas released at different times for the CHBS particles can be predicted based on the established intrinsic dissociation rate model where the parameters are obtained in Section 4.1. The dissociation experiments are performed according to the procedures described in Section 3.3. Figure 7 shows the experimental phenomenon of the group CHBS particles dissociation. When water flowed through the particles packed at the bottom of the tube, a large number of up floating bubbles in the water can be observed. Table 2 summarizes the experimental conditions and results for the dissociation experiments of the group CHBS particles.
Figure 8, Figure 9 and Figure 10 show the changes of the cumulative gas production with time for cases 8–10. The absolute amounts of gas recovered in each case are different due to the different amounts of gas hydrate formed in each case. Therefore, all the experimental data are normalized to the final recovered gas volume V g . The tap water reached the top of the tube at about t = 15 s in all of the experiments, so the inlet was closed at 15 s. It can be seen that the rate of dissociation decreases due to the decrease in water temperature after the inlet is closed. The total dissociation time was 60 s, 95 s, and 112 s for cases 8, 9 and 10, respectively. These are much slower than the predicted results. Thus, the experimental data obtained for the first 15 s are effective compared with the theoretical values predicted by Equation (7). It can be seen that in the first 15 s the predicted results agree well with that of the experiments for all the three cases. The differences between the experimental data and the theoretical values can be explained: when water flows through a group of particles packed at the bottom of tube, the released gas gathered around the particles would affect the outward diffusion of gas and heat transfer. Although the flowing water can take away part of gas, the gas concentration is higher than that of a single particle dissociation. The hydrate dissociation is affected by both the intrinsic dissociation rate and the heat and mass transfer rate. However, Equation (7) only considers the intrinsic dissociation rate. Here, ρ g = 1.788   kg / m 3 , M g = 44   kg / kmol .

5. Conclusions

The intrinsic dissociation model of CHBS is presented, assuming that the dissociation rate of hydrate is exponential with the concentration of remaining hydrates. The dissociation phenomenon of the single CHBS particle settling in water was observed under conditions of atmospheric pressure and water temperature ranging from 283.15 K–298.15 K.
The dissociation experiments of the single CHBS particle in water were carried out for four particle diameters. When the particle falls into the water, a group of gas bubbles is released from the surface of the particle. The complete dissociation time increases as the particle diameter increases, and decreases as the water temperature increases.
The model parameters are determined based on the experimental data of the single CHBS particle for different particle diameters and water temperatures. With the presented model, the dissociation behaviors of the group of CHBS particles in the water flow condition were predicted well.

Author Contributions

Conceptualization: P.L., X.Z. and X.L.; formal analysis: P.L., X.Z. and X.L.; investigation: P.L.; methodology: P.L.; project administration: X.Z.; supervision: X.Z. and X.L.; validation: P.L.; visualization: P.L.; writing original draft: P.L.; review and editing of manuscript: P.L., X.Z. and X.L.

Funding

This study is part of project No.51639008 funded by National Natural Science Foundation of China, and Youth Innovation Promotion Association of Chinese Academy of Sciences No. 2017027.

Acknowledgments

The authors thank Boyi Wang (Member of the English Translation Association of Institute of Mechanics, Chinese Academy of Sciences) for the English revisions.

Conflicts of Interest

The authors declare no conflict of interest.

References

  1. Kvenvolden, K.A.; Lorenson, T.D. The global occurrence of natural gas hydrate. Geophys. Monogr. 2001, 124, 3–18. [Google Scholar]
  2. Koh, C.A. Towards a fundamental understanding of natural gas hydrates. Chem. Soc. Rev. 2002, 31, 157–167. [Google Scholar] [CrossRef] [PubMed]
  3. Song, Y.C.; Yang, L.; Zhao, J.F.; Liu, W.G.; Yang, M.J.; Li, Y.H.; Liu, Y.; Li, Q.P. The status of natural gas hydrate research in China: A review. Renew. Sustain. Energy Rev. 2014, 31, 778–791. [Google Scholar] [CrossRef]
  4. Xu, H.L.; Lin, L.C.; Wu, W.R.; Wu, B. Cutter-suction exploitation mode of marine gas hydrate. Acta Sci. Nat. Univ. Sunyatseni Nat. Sci. (China) 2011, 50, 48–52. [Google Scholar]
  5. Zhang, X.H.; Lu, X.B.; Liu, L.L. Advances in natural gas hydrate recovery methods. Prog. Geophys. (China) 2014, 29, 858–869. [Google Scholar]
  6. Zhou, S.W.; Chen, W.; Li, Q.P. The green solid fluidization development principle of natural gas hydrate stored in shallow layers of deep water. China Offshore Oil Gas 2014, 26, 1–7. [Google Scholar]
  7. Sean, W.Y.; Sato, T.; Yamasaki, A.; Kiyono, F. CFD and experimental study on methane hydrate dissociation Part I. Dissociation under water flow. AIChE J. 2007, 53, 262–274. [Google Scholar] [CrossRef]
  8. Kim, H.C.; Bishnoi, P.R.; Heidemann, S.S.; Rizvi, S.S.H. Kinetics of methane hydrate decomposition. Chem. Eng. Sci. 1987, 42, 1645–1653. [Google Scholar] [CrossRef]
  9. Clarke, M.A.; Bishnoi, P.R. Determination of the intrinsic rate constant and activation energy of CO2 gas hydrate decomposition using in-situ particle size analysis. Chem. Eng. Sci. 2004, 59, 2983–2993. [Google Scholar] [CrossRef]
  10. Fukumoto, A.; Sean, W.Y.; Sato, T.; Yamasaki, A.; Kiyono, F. Estimation of dissociation rate constant of CO2 hydrate in water flow. Greenh. Gases 2014, 4, 1–11. [Google Scholar] [CrossRef]
  11. Aaron, D.; Tsouris, C. Separation of CO2 from flue gas: A review. Sep. Sci. Technol. 2005, 40, 321–348. [Google Scholar] [CrossRef]
  12. Kim, Y.; Wan, J.; Kneafsey, T.J.; Tokunaga, T.K. Dewetting of silica surfaces upon reactions with supercritical CO2 and brine: Pore-scale studies in micromodels. Environ. Sci. Technol. 2012, 46, 4228–4235. [Google Scholar] [CrossRef] [PubMed]
  13. Mekala, P.; Busch, M.; Mech, D.; Patel, R.S.; Sangwai, J.S. Effect of silica sand size on the formation kinetics of CO2 hydrate in porous media in the presence of pure water and seawater relevant for CO2 sequestration. J. Pet. Sci. Eng. 2014, 122, 1–9. [Google Scholar] [CrossRef]
  14. Sun, C.Y.; Chen, G.J. Methane hydrate dissociation above 0 °C and below 0 °C. Fluid Phase Equilib. 2006, 242, 123–128. [Google Scholar] [CrossRef]
  15. Sloan, E.D. Clathrate Hydrate of Natural Gases; Marcel Dekker: New York, NY, USA, 1998. [Google Scholar]
  16. Zhang, Y.; Li, X.S.; Wang, Y.; Chen, Z.Y.; Li, G. Methane hydrate formation in marine sediment from South China Sea with different water saturations. Energies 2017, 10, 561. [Google Scholar] [CrossRef]
Figure 1. Experimental apparatus for preparing the CO2 hydrate-bearing sediment (CHBS) particles.
Energies 11 02896 g001
Figure 2. CHBS particles synthesized under laboratory conditions. (a,b) T s 0 = 253   K . (c) The phenomenon of icing agglomeration of group particles, T s 0 = 268   K .
Energies 11 02896 g002
Figure 3. Experimental apparatus for group CHBS particles dissociation.
Energies 11 02896 g003
Figure 4. Visualization of gas bubbles emerging from the surface of the particle. P = 0.1   MPa , T l 0 = 294.15   K , d s = 7   mm .
Energies 11 02896 g004
Figure 5. Dependence of the dissociation time of a single CHBS particle on the particle diameter. T s 0 = 253.15   K , T l 0 = 283.15   K , S H = 3.22 % .
Energies 11 02896 g005
Figure 6. Dependence of the dissociation time of the single CHBS particle on the initial water temperature. T s 0 = 253.15   K , d s = 7.50   mm , S H = 3.22 % .
Energies 11 02896 g006
Figure 7. Visualization of gas bubbles emerging from the group CHBS particles.
Energies 11 02896 g007
Figure 8. Time variation of gas volume of dissociation for case 8. S H = 8.10 % , T l 0 = 293.15   K , h 0 = 0.12   m , α s 0 = 0.557 , d s = 7.50   mm .
Energies 11 02896 g008
Figure 9. Time variation of gas volume of dissociation for case 9. S H = 5.44 % , T l 0 = 298.15   K , h 0 = 0.15   m , α s 0 = 0.500 , d s = 8.00   mm .
Energies 11 02896 g009
Figure 10. Time variation of gas volume of dissociation for case 10. S H = 5.18 % , T l 0 = 293.15   K , h 0 = 0.15   m , α s 0 = 0.500 , d s = 8.00   mm .
Energies 11 02896 g010
Table 1. Experimental conditions and results for the dissociation of the single CHBS particle settling in water.
Case #Initial Particle Temperature T s 0 (K)Hydrate Saturation S H (%) Water Temperature T l 0 (K) Particle Diameter d s (m)Dissociation Time t dis (s)
1253.153.22283.157.00 × 10−328.450
2253.153.22283.157.50 × 10−330.970
3253.153.22283.157.80 × 10−332.240
4253.153.22283.158.34 × 10−335.120
5253.153.22288.157.50 × 10−326.180
6253.153.22294.157.50 × 10−322.538
7253.153.22298.157.50 × 10−320.513
Table 2. Experimental conditions and results for the dissociation experiments of the group CHBS particles at atmospheric pressure. Inlet water velocity v l 0 = 0.03   m / s for all cases.
Case #Initial Particle Temperature T s 0 (K)Hydrate Saturation S H (%)Water Temperature T l 0 (K)Initial Height of Particles h 0 (m)Initial Particle Volume Fraction α s 0 Particle Diameter d s (m)Gas Production V g (mL)
8253.158.10293.150.120.5577.50 × 10−3570
9253.155.44298.150.150.5008.00 × 10−3429
10253.155.18293.150.150.5008.00 × 10−3409

