1. Introduction
During well cementing, a service company pumps cement slurry down the casing and up the annular space between the casing and the formation with the help of various tools. The primary functions of the hardened cement are as follows:
- –
Provide zonal isolation
- –
Provide casing protection against corrosive fluids from the reservoir
- –
Prevent aquifers contamination
Cements are made from calcareous and argillaceous rocks that are dried, ground, and mixed in different proportions. Afterwards, this mix is heated to temperatures between 1426–1540 °C (2600–2800 °F) and a clinker is obtained, which is cooled down and mixed with other products (e.g., gypsum) to form Portland cement [
1].
American Petroleum Institute (API) Specification 10 A specifies the requirements and use conditions of different cement classes. These can vary by maximum depth, temperature, pressure, and sulfate resistance. Cementing additives control different properties and modify the behavior of the cement slurry under different conditions, which is crucial to run a good cementing job. They can be classified as accelerators, retarders, extenders weighting agents, and others.
Depending on the water-to-cement ratio and the cement components and additives, the final properties of the cement (flow parameters, wait-on-cement time, mechanical properties) vary. Portland cement sets and develops compressive strength as a result of hydration, which consists of a series of chemical reactions between anhydrous cement constituents and water.
The main components of the hydrated cement are the so-called C-S-H gel and calcium hydroxide. The hydration process of the two major phases can be described for the different major components by using the shorthand forms for the cement compounds as follows [
2]:
- –
Hydration of silicate phases, which consists of four different periods (pre-induction, induction, acceleration/deceleration, and diffusion), with the following outcome:
- –
Hydration of aluminate phases, leading to the following outcome:
During cement hardening, the transition from water and anhydrous components to the CSH gel gradually takes place, with about 30% of the reaction being completed after one day and reaching 70% after 28 days. This process is slow and can be affected by the temperature and additives.
Various researchers have performed work on enhancing geothermal well construction through adjusting cement thermal properties. Bao et al. [
3] described experiments focused on measuring and understanding the thermal properties of selected materials used for shallow geothermal applications. Li [
4] presented experimental investigations on thermo-responsive cement to achieve good insulation of high temperature wells. Lummer et al. [
5] discussed a customized system for cementing geothermal wells, including the thermal properties of the cement, insisting on the importance of measuring these properties. Jimenez et al. [
6] discussed the thermal conductivity and thermal expansion of neat, foamed, and elastic oil-well cements, also showing the importance of data to allow for risk reduction and production maximization.
However, none of the existing investigations provides a thorough foundation of how the intrinsic cement components and their hydration will affect the final cement stone thermal properties. To reduce data uncertainty, this paper proposes an analytical method to calculate these based on the cement mix thermal properties.
2. Materials and Methods
As mentioned above, well cementing is a crucial element in the construction and throughout the life span of a well from a technical, financial, and Health Safety and Environment (HSE) point of view. Since the cement is permanently in contact with cement and formation, the heat from and into the well flows through the cement as well.
One important thermal property of cement is its thermal conductivity. Thermal conductivity (
k) relates to the property of a material to conduct heat, and it is defined as the quantity of heat (
Q) transmitted through a unit thickness (
L) in one direction normal to a surface of unit area (
A) due to a unit temperature gradient (Δ
T) under steady state conditions and when the heat transfer is dependent only on the temperature gradient [
7]. This becomes the following equation after solving Fourier’s heat equation for k and assuming a constant temperature gradient:
Despite its importance, well engineers often neglect the importance of thermal conductivity of cements by using one thermal conductivity coefficient value for the entire wellbore. This can lead to flaws in designing oil and gas wells, where cement is needed to protect wellbore equipment, or the lower part of geothermal wells, where a high rate of heat transfer between the rock and the wellbore is envisaged.
The mathematical prediction of thermal conductivities is a complex task and can be accomplished through the following methods [
8]:
- –
Applying mixing laws for a rock-fluid system
- –
Using theoretical models based on heat transfer mechanisms and simplified geometries
- –
Using empirical models where adjustable parameters are defined for a set of materials through laboratory measurements.
In the search for the thermal conductivity model best describing cements, different sources were used. In the literature, cement’s thermal conductivity (
kcem) ranges from 0.2 to 3.63 W/(m-K) [
9,
10].
Table 1 presents some thermal conductivities of cements’ main components as found in the literature [
11].
Proposed here are two different approximations for calculating the thermal conductivity of cements, following the model shown in [
12], where the conductivity is a pondered sum of individual conductivity terms,
representing the volume fraction:
1. Weighted average of main components before the hydration reactions, which would yield an approximation of the cement powder thermal conductivity.
With this approach, the thermal conductivity of a Class G cement powder before the hydration reactions can be calculated by multiplying the components’ thermal conductivities with their associated percentage by mass and then adding them. Unfortunately, no extensive datasets about the thermal conductivities of these main components have been published. However, it is worthwhile to mention that with the calcium silicates having the highest percentage by mass in the Class G example, they are also the components influencing the thermal conductivity of the cement powder the most.
Table 2 shows the percentage by mass of the main components of Class G cement.
2. Weighted average of main components after hydration, which would yield an approximation of the cement stone thermal conductivity.
This approximation follows the same principle as the first one, but it takes into account the products of the complete hydration taking place after mixing the components from
Table 2 with water (e.g., w/c = 0.42). The results are shown in
Table 3. In this case too, inadequate amounts of reliable data were available to test the accuracy of the calculations. Nonetheless, a decrease in the thermal conductivity of the G class cement after setting is expected. This decrease could be explained by the amount of water—thermal conductivity of 0.604 W/(m-K)—involved in the reaction.
Baghban et al. [
9] presented an interesting approach for the calculation of a set cement’s thermal conductivities by using a three-phase model. This is a concept very close to reality, in which the porosity of settled cement and the fluids within the pores (water or air) are considered. The model is described by the equation:
where the indices
w,
a, and
s stand for water-, air-, and solids-hardened cement paste,
represents the total porosity in the cement,
is the volume fraction of free water, and
represents an empirical correlation factor used to fit the model with experimental data in the best manner. This model is an improvement to the two-phase serial and parallel models described by the following equation:
where
represents volume fractions and
the corresponding thermal conductivities. For
n = 1, the components are connected in series and for
n = −1 in parallel [
8].
Furthermore, when estimating thermal conductivities, one can also make use of the two-phase and three-phase Hashin–Shtrikman boundaries, defining the lower bound (
) and the upper bound (
) thermal conductivities of composite materials as follows:
for the two-phase case, and:
with the following correction coefficients for the three-phase case:
According to [
8,
9], the described models are in agreement with experimentally determined values, and the two-phase model, together with the two-phase lower and upper boundaries, can be used to estimate the range for the thermal conductivity of the hardened cement paste by using the thermal conductivity of water (
), the thermal conductivity of the cement powder (
), and their volume fractions. This value can then be used as an input parameter in the three-phase model in order to calculate the thermal conductivity of the hardened cement with porosity filled with air and/or free water.
3. Results
In order to prove the applicability of this method, experimentally determined thermal conductivities from a study of thermal conductivities of geothermal cementing systems [
13] were compared with mathematical calculations. The following cements were used in the respective paper (
Table 4).
Equations (3) to (10) require volume percentages of the components, so the given compositions of cements A–D and F were first converted accordingly (see
Table 5).
The calculation of the powdered solids’ thermal conductivities followed, based on Equation (4) and assuming the thermal conductivities of the components presented in
Table 6.
Cement system A is a mix of 100 pbw API Cement H, 35 pbw silica flour and 59.4 pbw water, which according to
Table 5 translates into 35.04% cement, 33.28% silica flour, and 31.68% water by volume. By using the assumed thermal conductivities of the three components (
Table 6) as input parameters in Equations (5) and (6) for two-phase systems, the approximations for the Hashin– Shtrikman (HS) two-phase boundaries were obtained, and the series and parallel models for the hardened cement paste are shown in
Table 7.
These parameters were alternatively used in the three-phase models to determine the overall thermal conductivity of a partially hydrated cement system with an assumed porosity of 10% filled with water, as shown in
Table 8.
The obtained value is 0.7962 W/(m-K), which shows an absolute deviation of 3.78 × 10⁻³ (0.4735% difference) from the experimentally determined value, proving the practicality of this mathematical prediction method.
Cement system B is a mix of 100 pbw API Cement H, and 38 pbw water, which according to
Table 8 translates into 63.36% cement and 36.64% water by volume. The approximations for the Hashin–Shtrikman (HS) two-phase boundaries and the series and parallel models for the hardened cement paste were obtained and are shown in
Table 9.
These parameters were alternatively used in the three-phase models to determine the overall thermal conductivity of the fully hydrated cement system with an assumed porosity of 28%, as shown in
Table 10.
The obtained value is 0.7164 W/(m-K), which shows an absolute deviation of 6.36 × 10⁻³ (0.8921% difference) from the experimentally determined value.
Cement system D is a mix of 100 pbw API Cement G, 77.1 pbw water, 40 pbw silica flour, 8 pbw expanded perlite, 4 pbw bentonite, and 2.2 pbw additives, which according to
Table 8 converts to 16.84% API Cement G, 19.76% water, 18.27% silica flour, 42.67% expanded perlite, 1.73% bentonite, and 0.73% by volume additives. The estimated values for the hardened cement paste are shown in
Table 11.
These parameters were alternatively used in the three-phase models to determine the overall thermal conductivity of the cement system with an assumed porosity of 28% filled with irreducible water, as shown in
Table 12.
The obtained value is 0.5103 W/(m-K), which shows an absolute deviation of 9.685 × 10⁻³ (1.88% difference) from the experimentally determined value.
Cement system C is a mix of 100 pbw Aluminate Cement and 45 pbw water, which according to
Table 8 translates into 68.89% cement and 33.11% water by volume. Again, approximations for the HS two-phase boundaries and the series and parallel models for the hardened cement paste were calculated, as shown in
Table 13.
These parameters were alternatively used in the three-phase models to determine the overall thermal conductivity of the cement system with an assumed porosity of 28% filled with irreducible water, as shown in
Table 14.
The obtained value is 1.0176 W/(m-K), which shows a high absolute deviation of 0.6076 (85.12% difference) from the experimentally determined value of [
13]. This can be explained by the different thermal conductivity of the Aluminate Cement powder, which, indeed, has another thermal conductivity than the API Class G/H cements, due to the fact that its chemical composition is different (high percent of Calcium Aluminate instead of Calcium Silicates). However, values determined by [
14] fit the calculated data, which are in the range of 0.8–1.01 W/(m-K) (0.7497% difference from the upper boundary).
Cement system F is a mix of 100 pbw API Cement G, 40 pbw silica flour, 2 pbw bentonite, 1 pbw additives, and 45 pbw water, which according to
Table 8 gives the following volume percentages: 29.81% cement, 32.35% silica flour, 1.53% bentonite, 0.59% additives, and 33.11% water by volume. The hardened cement paste thermal conductivity was approximated, as shown in
Table 15.
These parameters were alternatively used in the three-phase models to determine the overall thermal conductivity of the cement system with an assumed porosity of 28% filled with irreducible water, as shown in
Table 16.
The obtained value is 0.5485 W/(m-K), which shows an absolute deviation of 0.34 (46.94% difference) from the experimentally determined value of [
13]. However, values determined by other authors [
15] fit the calculated data, which are in the range of 0.5–0.7 W/(m-K) for different w/c mixing ratios.
4. Discussion
All thermal conductivity calculations based on the new model are presented in
Table 17.
Sources of errors and differences between measured and estimated values can be represented by different thermal conductivities of the different cement powders. In the case of Cement System C, which consists of 68.89% aluminate cement and 33.11% water by volume, it is mandatory to mention the high content of calcium aluminate, which also has a different thermal conductivity compared to the calcium silicates—the main components in API standard cements. The overall chemical composition of the cement powder (clinker) together with the other powdered components can also yield inaccuracies. Silica flour shows thermal conductivities between 0.0810 and 0.3570 W/(m-K) depending on its particle size [
16]. For the purpose of these calculations, the chosen thermal conductivity corresponds to an approximate particle size of 74 nm. Also, thermal conductivities of the additives and retarders were considered as negligible because of their small percentages. Structural changes caused by these additives and by the hydration reactions were not taken into account during these calculations.
The porosities and water contents of the different cement systems were inserted (with respect to literature values) to best fit the experimental values. A series of porosities for different cement mixes were measured by [
17] using the mercury intrusion technique on samples cured for seven days at 76 °C. This type of experiment enables the calculation of the cumulative porosity of a sample after correlating it with the total volume of mercury that penetrated the interconnected pores and percolated the closed pores. Values of 10 to 51.2% porosity were reported [
17,
18,
19]. Moreover, the existence of a loose contact zone between the cementation and the casing was proposed as a reason for lower produced temperatures of a borehole heat exchanger (BHE) by Kohl et al. [
20], who estimated that a 100 mm thick layer with a porosity of 72% over 1/3 of the wellbore length decreases the input temperature to a yearly average of 10.6 °C (instead of the expected 15 °C). This makes the assumed porosities of the thermal conductivity calculations in this work adequate and also enables the estimation of the void space in the cement sheath.
A unified framework is the key to calculating the thermal conductivities of cements. Lack of data and dealing with experimental values acquired through different methods can lead to erroneous end-values, which in turn can lead to uncertainties when used in different applications (e.g., simulations, planning). Through an extensive dataset developed especially for calculations based on thermal conductivities, the methods presented in this paper could be used to determine parameters such as the porosity of cement and its water content. In order to test the applicability of this method, a series of ad hoc experiments and analyses should be sequentially performed:
- –
Experimental determination of the cement powder component’s thermal conductivity.
- –
Calculation of the cement powder thermal conductivity.
- –
Experimental determination of the cement powder thermal conductivity and comparison with the calculated values.
- –
Calculation of the hardened cement thermal conductivity based on presented model.
- –
Experimental determination of the hardened cement thermal conductivity and comparison with the estimated values.
- –
Experimental determination of the hardened cement porosity and water content and comparison with the estimated values.
- –
Adjust model through the correlation parameter.
- –
Delivery of a conclusion regarding the applicability of the calculation method.
In what follows, the use of cements with modified thermal properties to better design geothermal wells is discussed. The previous calculations show that the addition of metallic particles could boost the cement thermal conductivity above one, although with moderate variations between low and high values. Being able to calculate the cement thermal properties will allow engineers to identify if thermally enhanced cements (with low or high conductivity) could be of benefit for well construction. An example of wellbore construction using modified thermal cements was shown by Teodoriu et al. [
21]. The main idea was to use various cement types along the wellbore to heat the injection fluid under controlled conditions while minimizing the surface impact of heating the wellbore surrounding.
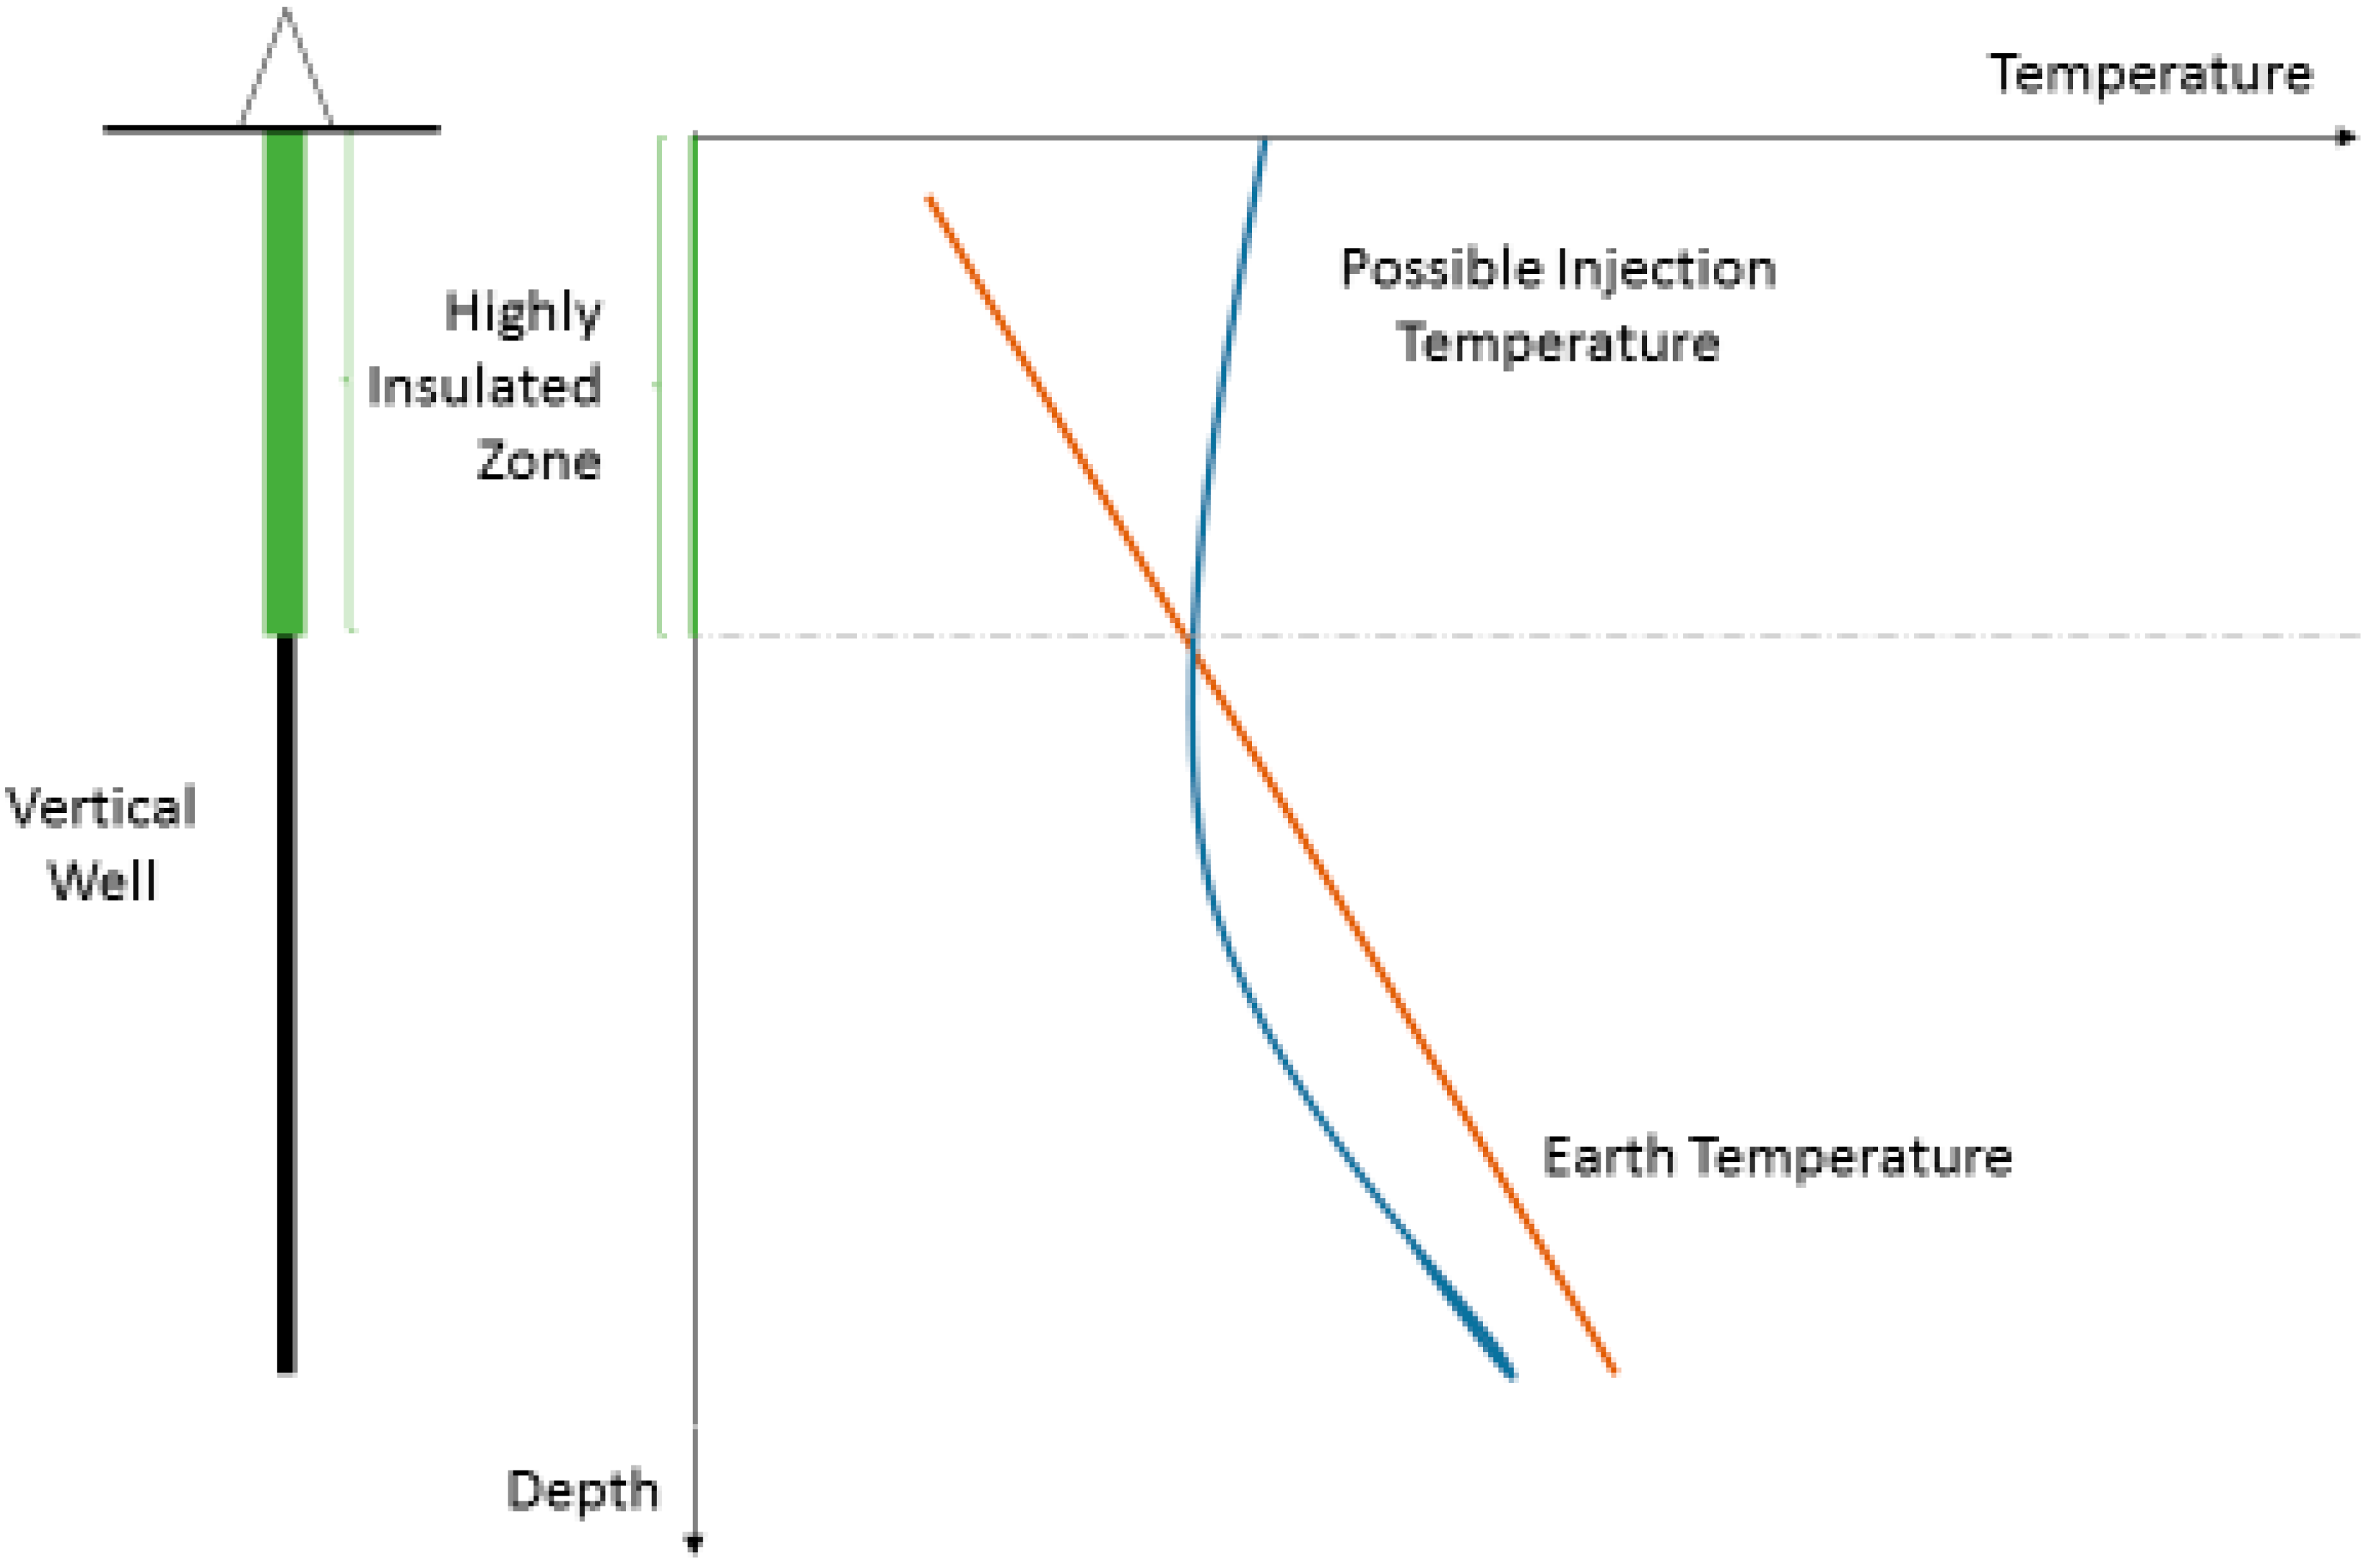
Figure 1 shows a novel well cementing concept, where cement thermal properties (particularly thermal conductivity) are carefully selected to minimize heat loss in the upper well section and increase thermal conductivity to bring heat to the well in the lower part of the well. Using the proposed calculation method, engineers will save time and reduce costs, since no initial expensive experimental measurements are needed. Cement specialists can also use the method to understand the minimum requirements of different cement ingredients that may lead to the desired results. For example, a high metallic content may boost the heat conductivity, but this can also be achieved through a high water content and higher cement porosity. They will now have a new instrument to design cement on paper prior to any experimental work.
5. Conclusions
A method to calculate the cement thermal properties using the three-phase method was presented. The method helps engineers to better design cements for geothermal wells, where wellbore heat properties are particularly important.
It was also found that the current literature lacks consistent data on cement thermal properties, and there is a need to investigate not only overall cement thermal properties, but also those of its individual components, which allow the use of the theoretical method presented above to calculate final cement sheath properties.
Using the presented cement conductivity estimation method, the engineers have a new tool that may be utilized to design better wells for geothermal applications.
One example at the end of the paper shows the importance of reliable cement thermal properties during the design phase of geothermal wells.


