Brief Report

Data Report: Molecular and Isotopic Compositions of the Extracted Gas from China’s First Offshore Natural Gas Hydrate Production Test in South China Sea

Guangzhou Marine Geological Survey, China Geological Survey, Guangzhou 510760, China
*
Author to whom correspondence should be addressed.
Energies 2018, 11(10), 2793; https://doi.org/10.3390/en11102793
Submission received: 2 September 2018 / Revised: 9 October 2018 / Accepted: 14 October 2018 / Published: 17 October 2018

Abstract

:
Three hundred gas samples recovered from SHSC-4 during China’s first gas hydrate production test in the South China Sea were examined for gas component and isotopic composition. According to the gas chromatography analysis, all the gas samples from SHSC-4 are predominated by CH4, with minor N2 + O2, as well as trace amounts of CO2, C2H6, and C3H8. No H2S was detected. The molecular and isotopic data of the gas samples fall into the region of “mixed origin” on the plot of C1/(C2 + C3) − δ13C1, which is close to the microbial origin. The discrimination diagram of δ13C1 − δDCH4 shows that the methane in all of the samples is of microbial origin, and is derived from the CO2 reduction.

1. Introduction

In 2017, the first offshore natural gas hydrate (NGH) production test in the South China Sea (SCS) was conducted by the China Geological Survey (CGS). The production test site, SHSC-4, is located in the middle of the continental slope of southeast Shenhu area, northern SCS, about 300 km southeastward away from Hong Kong (Figure 1). The water depth of SHSC-4 is about 1263.5 m, according to the ROV (Remote Operated Vehicle) in situ survey. The production test lasted for 60 days, from 10 May to 9 July. The cumulative gas volume produced during the sixty-day test was approximately 309,000 m3 (under the atmospheric pressure). The gas production rate was approximately 5454 m3/day, with a maximum of 35,000 m3/day. The gas hydrate production test in SCS holds the new record for the longest production time and the highest cumulative volume in the world’s offshore gas hydrate production test, which is essential to the future global energy supply.
The core data from site SHSC-4 showed that gas hydrate occurred over a 50-meter interval from 201 mbsf (meter blow the seafloor) to 251 mbsf [1]. The characteristics of gas hydrate-bearing sediment is clayey silt, which accounts for more than 90% of the global NGH [2]. The gas hydrate saturation from both the pore-water freshening and pressure core mass balance is variable throughout the interval, with mean values of 35%. The mean effective porosity of the gas hydrate reservoir is about 34%, and the mean permeability is 2.9 mD [1].
In this document, we report on the shore-based analyses of the produced gas component and isotopic composition from the SHSC-4 site. The objective of this report is to present the gas characteristics of China’s first gas hydrate production test in SCS, based on the molecular and isotopic analysis.

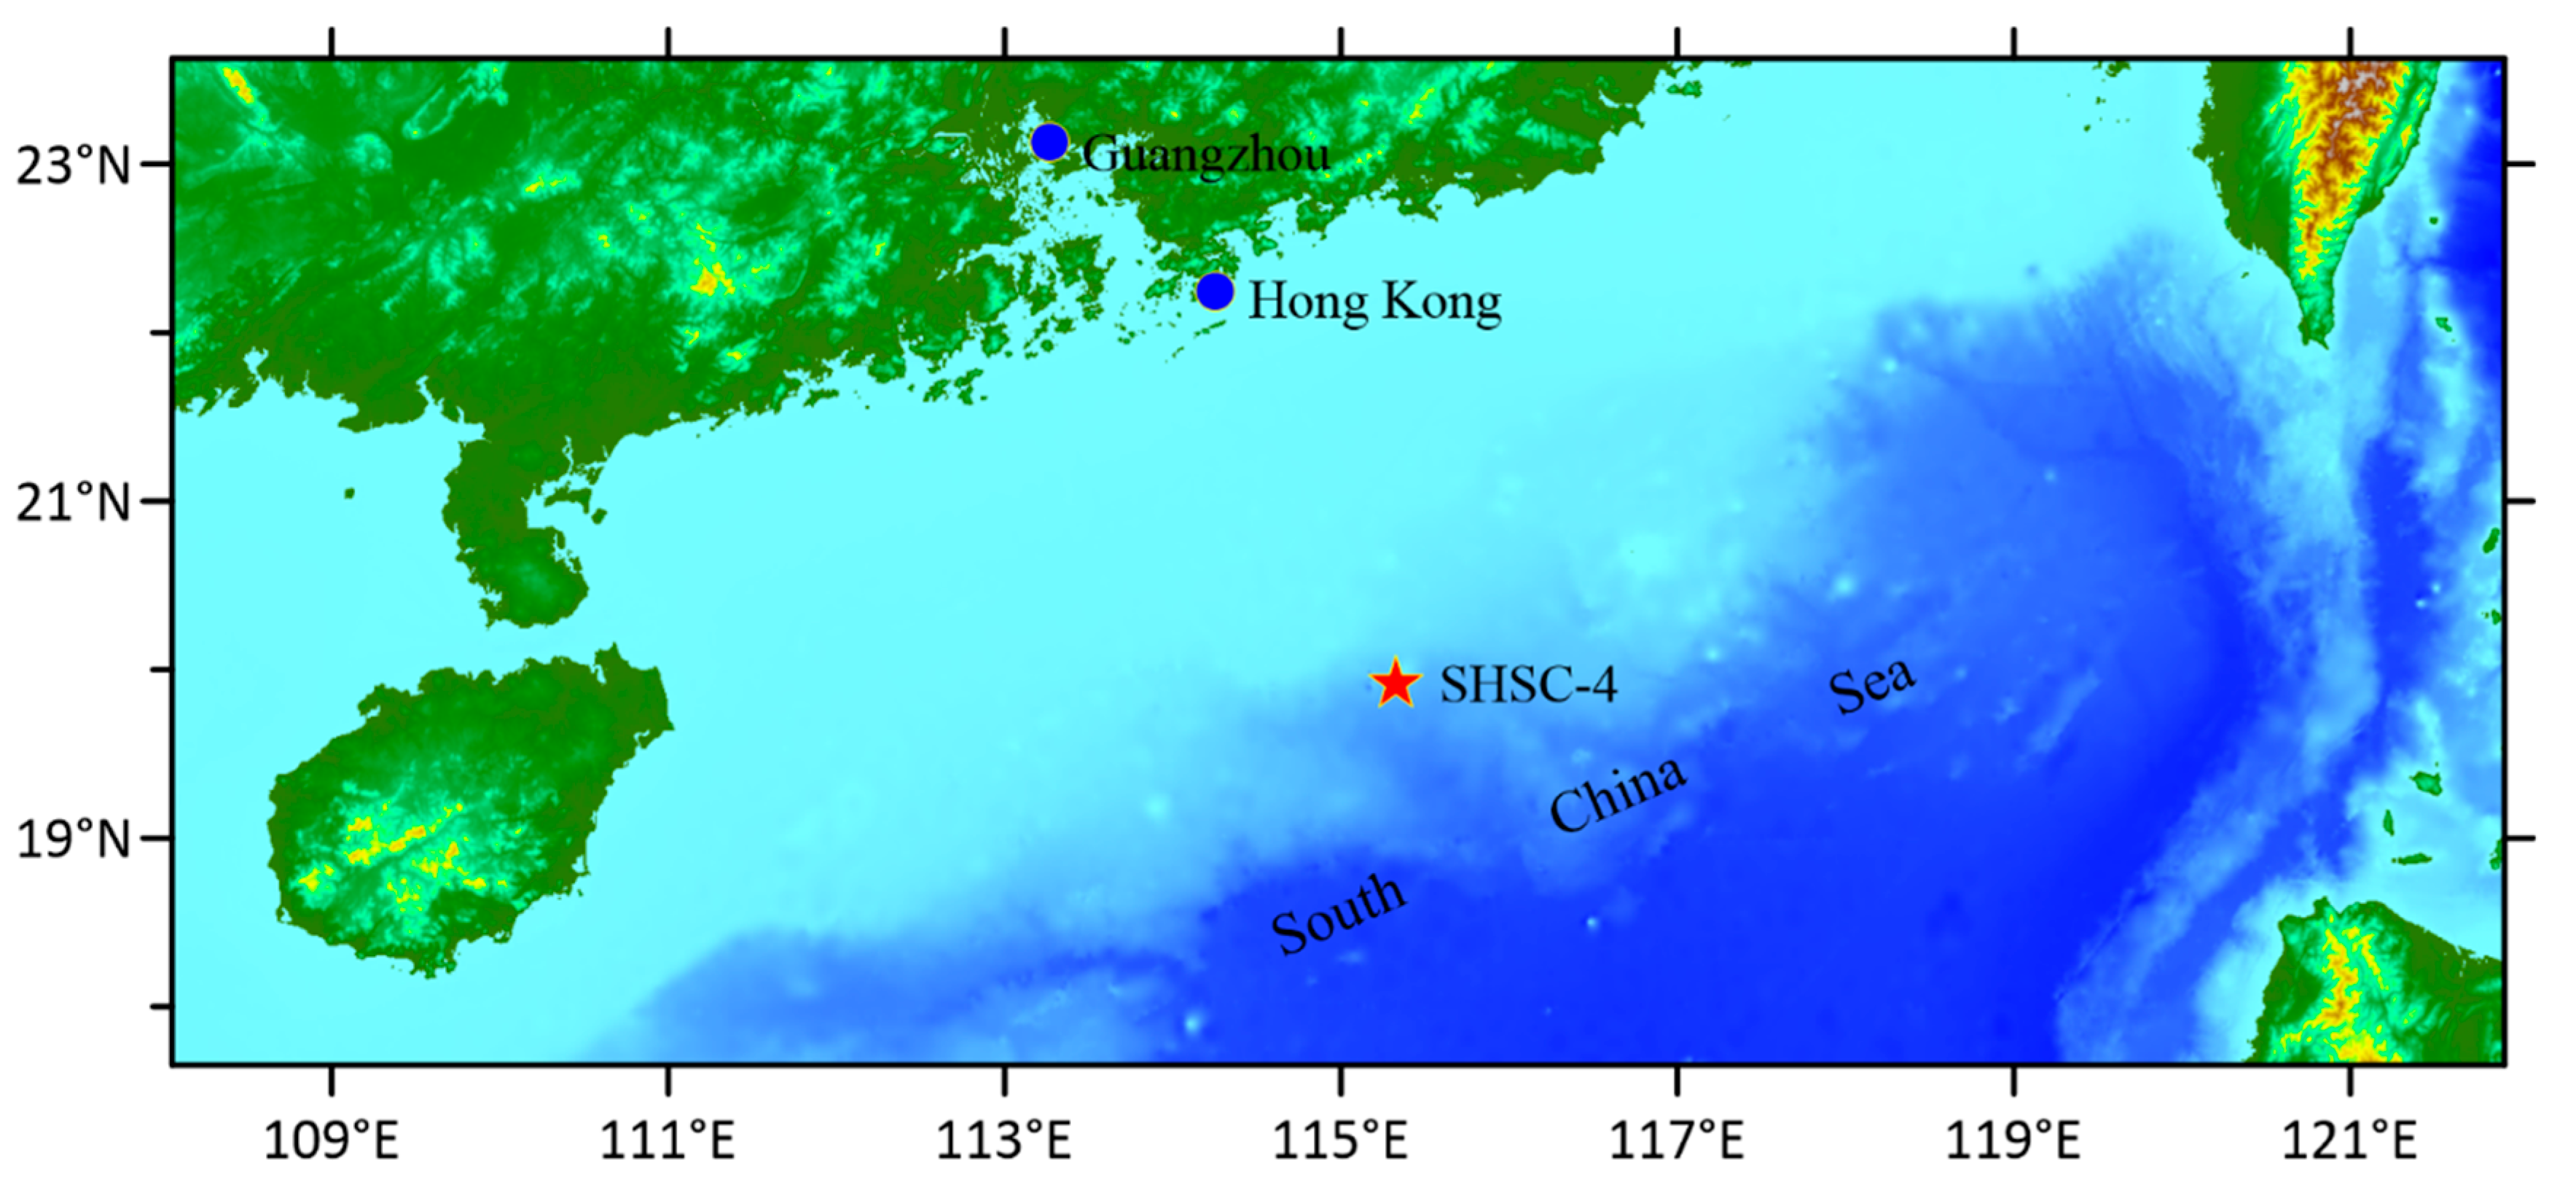
2. Samples and Analytical Methods
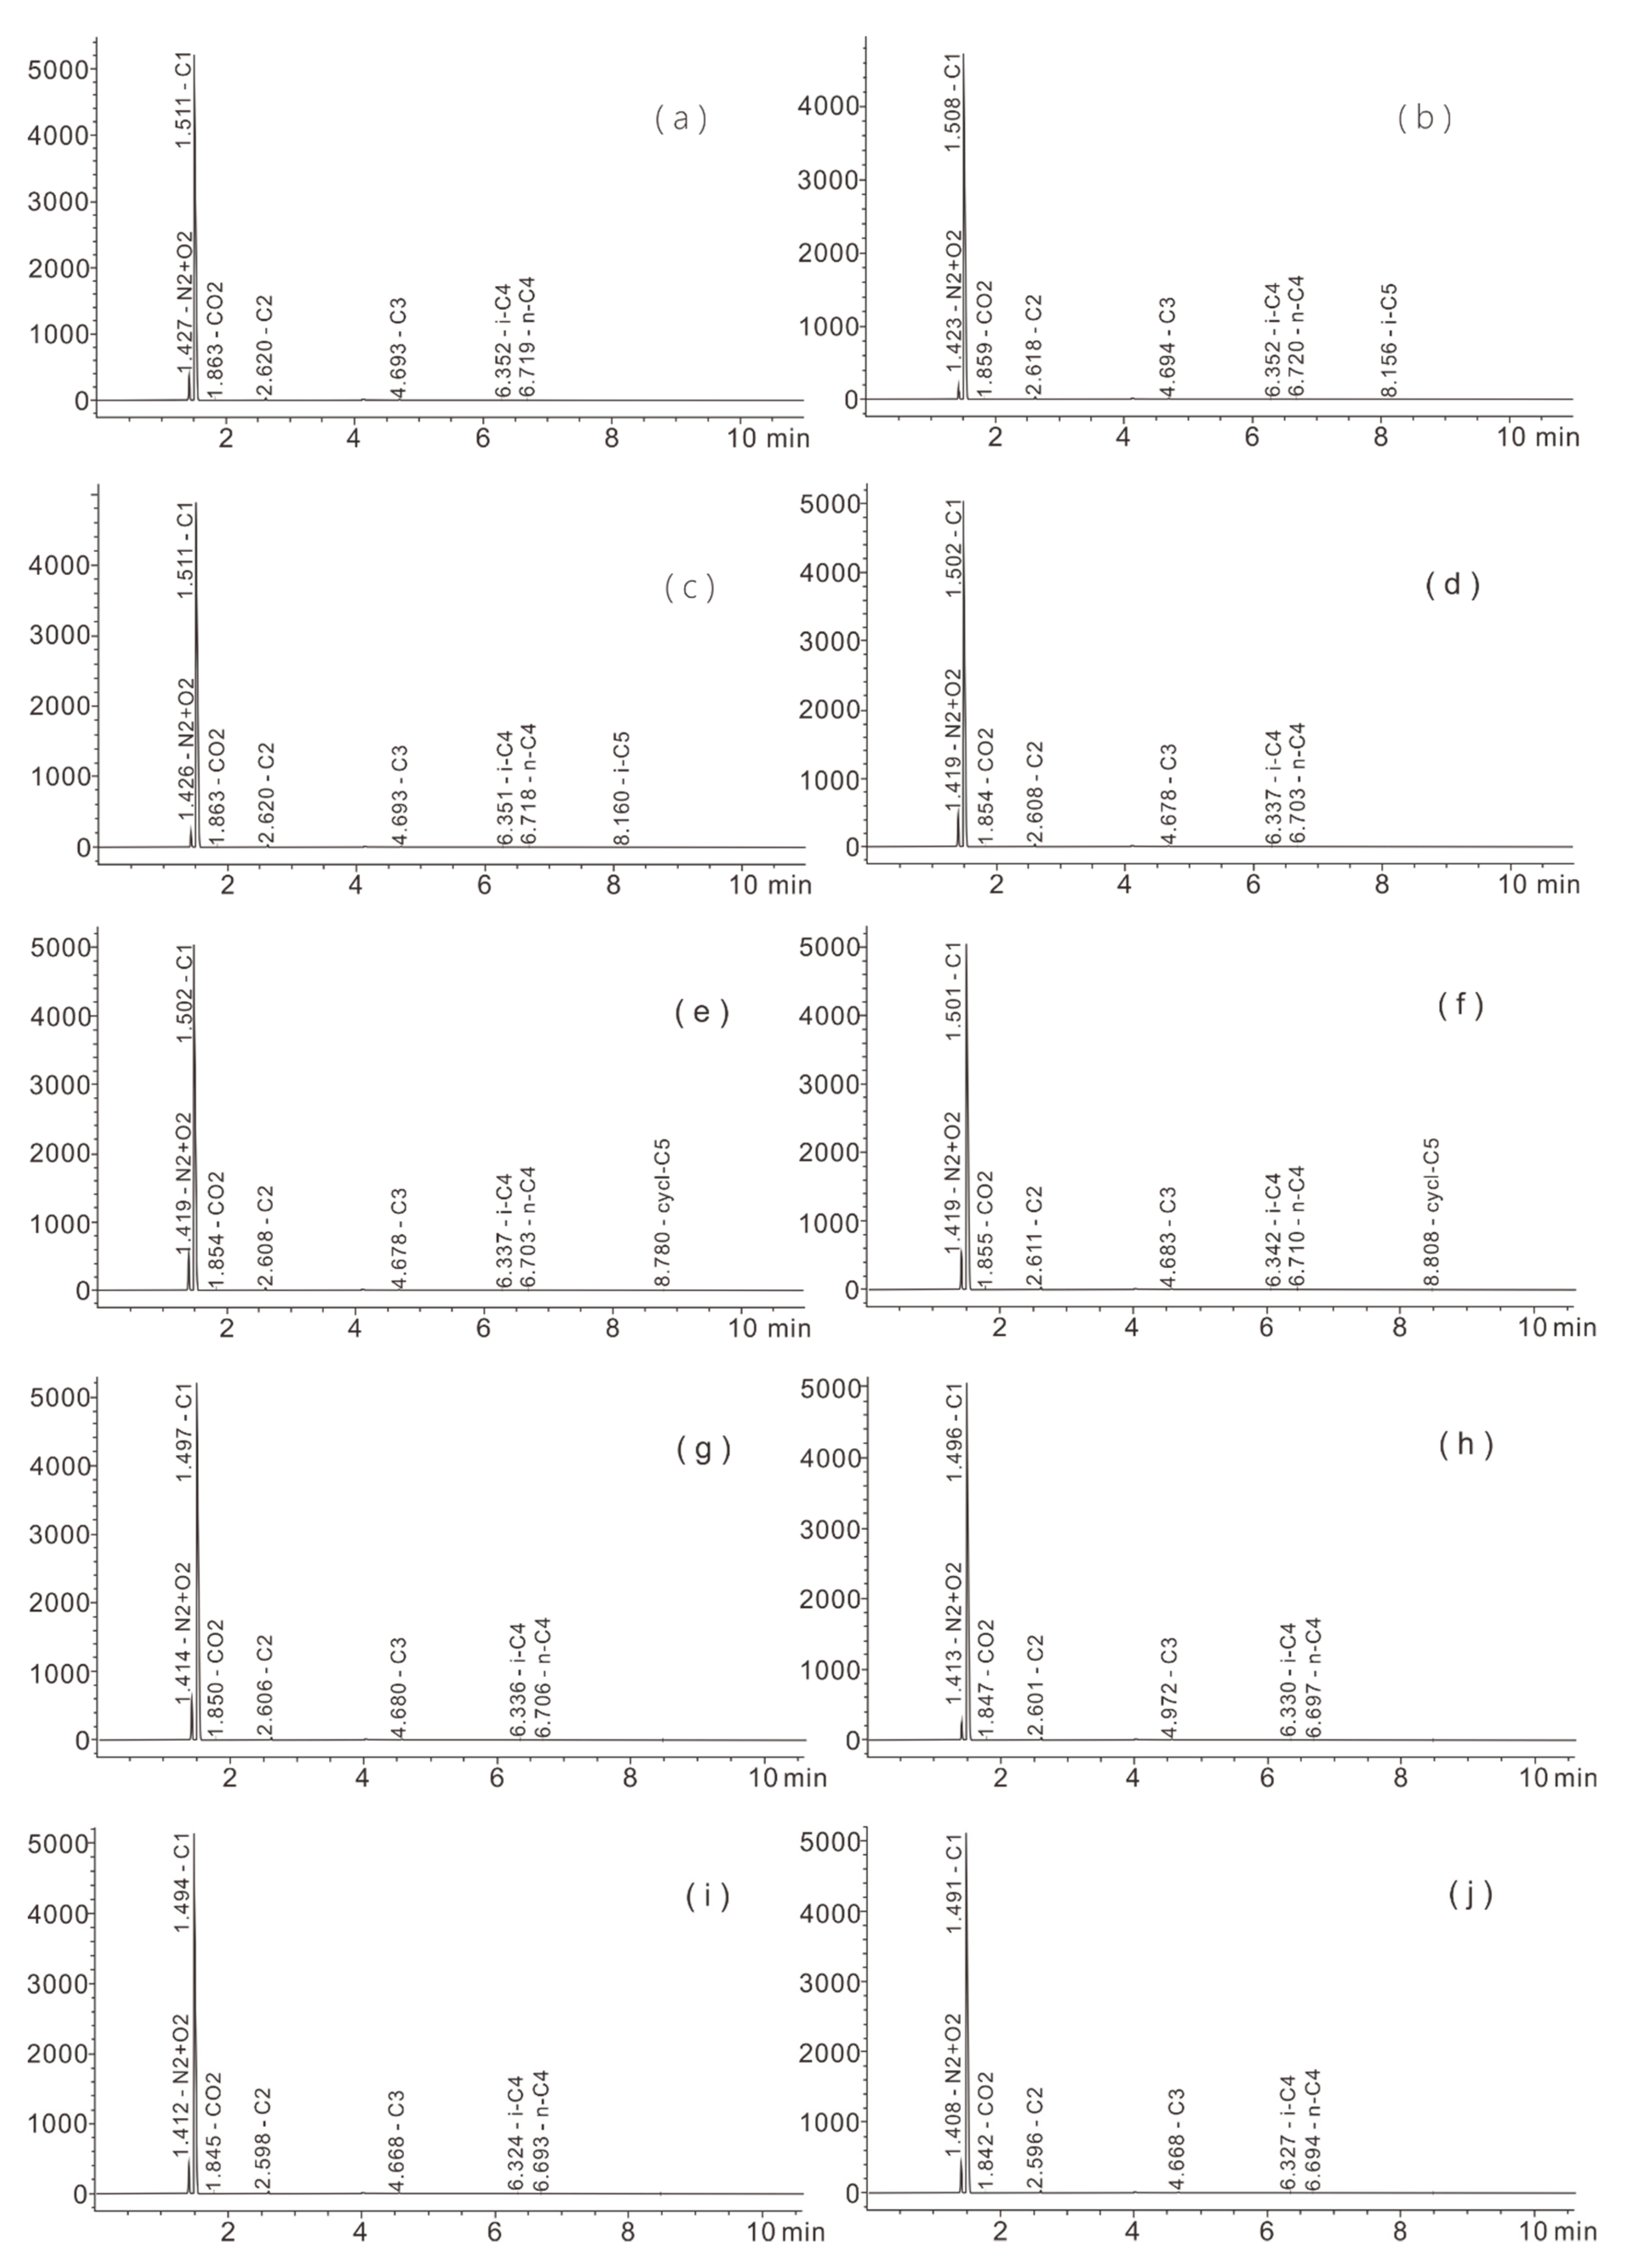
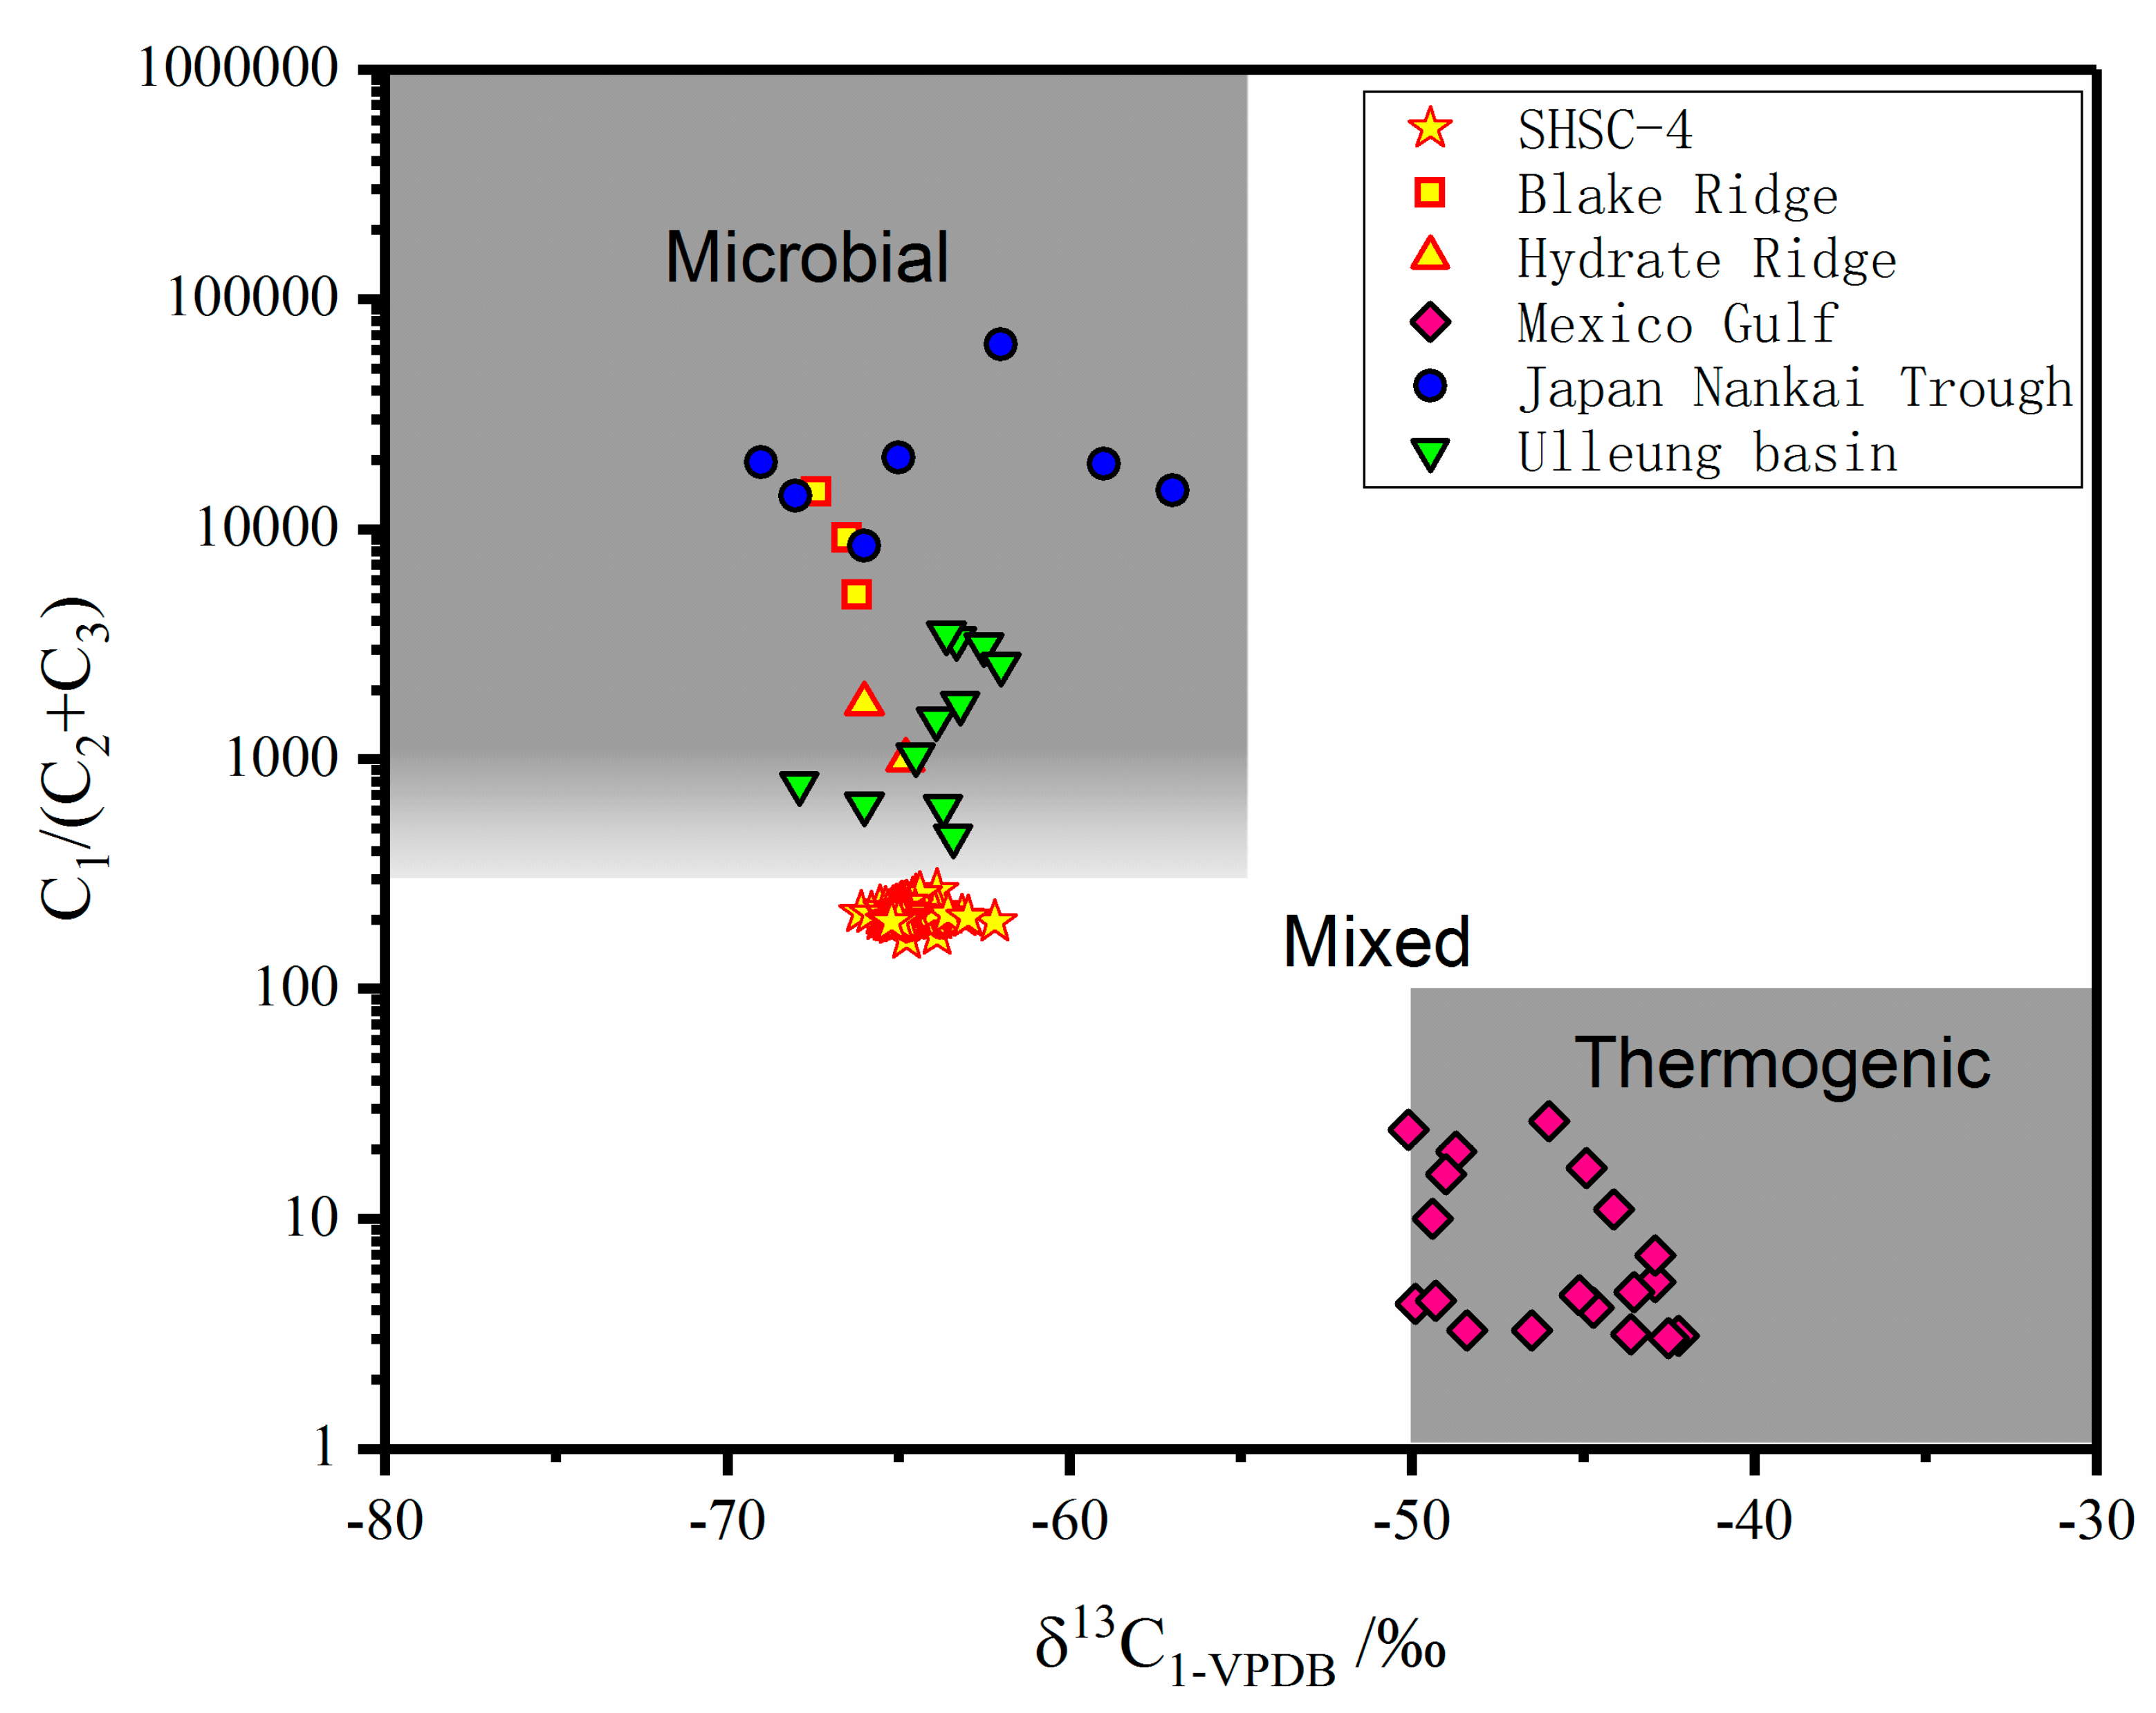
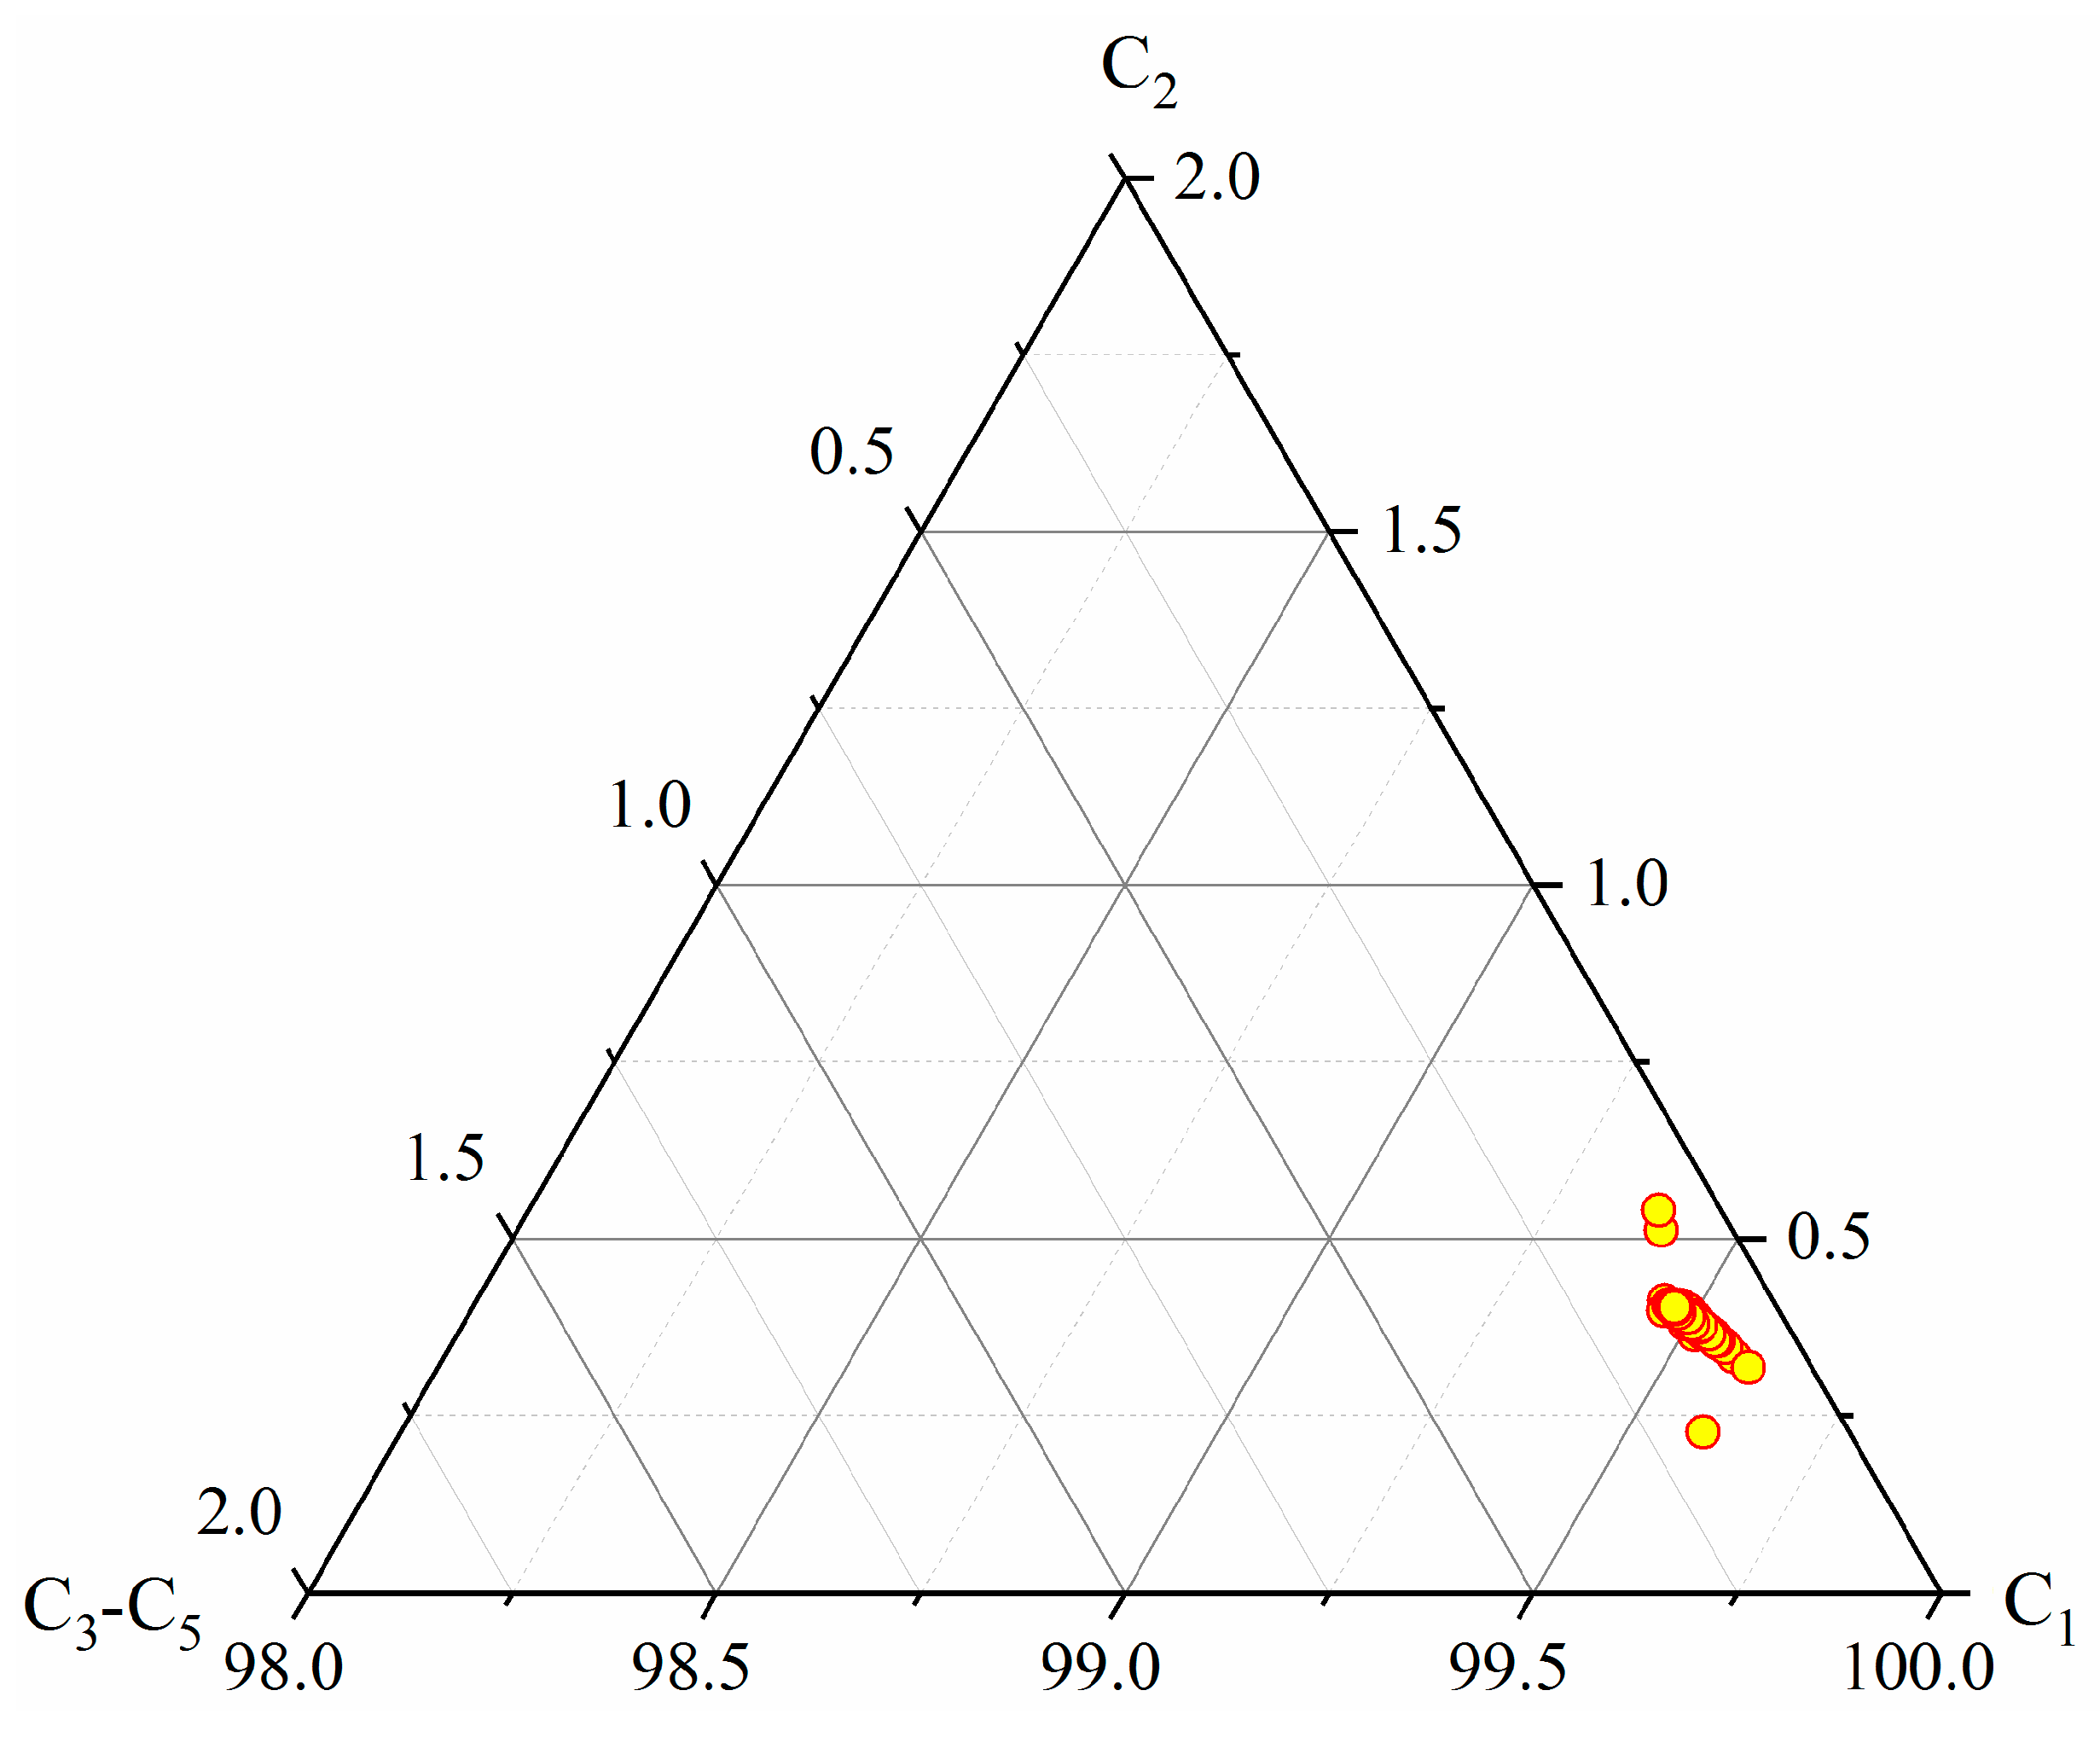
All of the gas samples were collected from the flow line on the rig, which was extracted from the gas hydrate interval between 201 mbsf and 251 mbsf with depressurization. All of the samples had no hydrogen sulfide smell. They were sealed in sample bags and were taken back for onshore analysis immediately. Three hundred gas samples were examined for geochemistry by gas chromatography (GC) and isotope ratio mass spectrometer.
An Agilent 7890A GC equipped with a 30 m × 0.53 mm HP-PLOT/Q column was used to measure the hydrocarbon gases from C1 to C5. The Agilent 7890 A is configured with a 1-mL, valve-actuated, sample loop for injection, and a thermal conductivity detector (TCD) for gas detection. The samples were introduced by syringes under atmospheric pressure, and a minimum of 10 mL of gas was used to flush the injection loop. The experiments were initially performed under 50 °C, with an increasing temperature rate of 20 °C/min to 200 °C. Helium was used as the carrier gas at a constant flow rate of 5 mL/min. The TCD temperature was kept under 200 °C. The GC was calibrated using the hydrocarbon gas standards of known concentrations.
Isotopic ratios of carbon and hydrogen in the hydrocarbon gases were measured with a Thermo Fisher Trace GC ultra-gas chromatography coupled to a MAT-253 isotope ratio mass spectrometer via a GC-isolink interface, at Guangzhou Marine Geological Survey Laboratory. The gas components were separated on a 30 m × 0.3 mm ID HP-PLOT/Q column using helium as the carrier gas. The flow rate was 1.5 mL/min. The GC oven was set under 50 °C for 2 min, then programmed to increase to 140 °C at a rate of 30 °C/min, and was maintained under 140 °C for 4 min. The GC injection port was set under 100 °C and then the split ratio was 50:1. The combustion oven temperature was 1000 °C in order to convert all of the hydrocarbons to CO2, and the high temperature cracked oven temperature was 1420 °C in order to determine the hydrogen isotope. The δ13C values were reported in the unit of per mil (‰), relative to the VPDB (Vienna Pee Dee Belemnite) standard. The carbon isotope data are more accurate for the hydrocarbon gases (accuracy within ±0.15‰). The δD values were also reported in the unit of ‰ (accuracy within ±1.0‰), relative to VSMOW (Vienna Standard Mean Ocean Water). The carbon and hydrogen isotopic ratio for both methane and ethane were measured, and other hydrocarbon gases were not detected because of the instrument limit.

3. Results

All of the 300 gas samples show similar GC curves, which exhibit a large C1 peak (Methane), but a weak peak of the other components (Figure 2). The GC analysis shows that all of the gas samples are predominated by CH4 (91.35–97.69%, average = 95.87%) with minor N2 + O2 (1.79–8.18%, average = 3.63%), and trace CO2 (0.007–0.142%, average = 0.013%), C2H6 (0.294–0.521%) and C3H8 (0.062–0.108%). No H2S was detected. Among all of the hydrocarbon gases, CH4 consists 99.38~99.60%, with an average of 99.50% (Figure 3).
The molecular {C1/(C2 + C3)} compositions of the 300 gas samples collected from the production test range from 165 to 259 (ave. = 209). The δ13C and δD in methane are within the range of −66.09–−63.14‰ (average = −64.88‰) and −195.8–−186.0‰ (average = −191.3‰), respectively, which are similar to those of the methane experimentally released from the natural gas hydrate samples collected from the Shenhu Area (δ13C1 = −64.38–−61.57‰, δDCH4 = −220.00–−191.00‰ [3]).
The relationship between the C1/C2+ ratios and the δ13C values of methane is a good way to distinguish the origin of hydrocarbon. High C1/C2+ ratios (C1/C2+ ≥1000) and low methane δ13C values (δ13C ≤ −55‰) are characteristic of a microbial origin, while low C1/C2+ ratios (C1/C2+ ≤ 100) and high methane δ13C values (δ13C ≥ −50‰) are characteristic of a thermogenic origin [4,5,6,7,8,9,10]. On the plot of C1/(C2 + C3) − δ13C1, all of the gas samples from the production test fall into the “mixed origin” region close to the microbial origin (Figure 4), which is different from the gas hydrate from Blake Ridge, Hydrate Ridge, Mexico gulf, and a Japan gas hydrate prodution test site in Nankai Trough, but close to the Ulleung basin of Korea. Moreover, the discrimination diagram of δ13C1 − δDCH4 (Figure 5) shows that the methane in all of the samples is of microbial origin and is derived from a CO2 reduction, which is different from the nearby LW3-1-1 gas well with methane thermogenic origin in SCS, but is the same as Blake Ridge, Hydrate Ridge, and the Ulleung basin of Korea. The information from Figure 4 and Figure 5 indicate that the gas extracted from China’s first gas hydrate production test possibly originate from bacterial and thermogenic gas mixtures, but have more of a bacterial component.

4. Summary and Conclusions

The extracted gas from China’s first natural gas hydrate production test in SCS are predominantly by methane, which accounts for 99.38~99.60% of all of the hydrocarbon gases. The δ13C and δD in methane are within the range of −66.09–−63.14‰ and −195.8–−186.0‰, respectively. Different from those of the nearby LW3-1-1 gas well with a thermogenic origin, these values imply that the methane of the natural gas hydrate in the Shenhu area was mainly derived from the bacterial reduction of CO2. Nevertheless, the contribution of the thermogenic origin cannot be excluded in this study. It is possible that the bacterial gas is the main gas origin for gas hydrate formation in SHSC-4.

Author Contributions

J.Y. made the substantial contributions of research conception and design. X.Q. contributed to made the critical revision. H.Q. contributed to data collection. W.X. made the contribution of data interpretation. H.L. drafted the article and made final approval of the article. C.L., J.Z. and J.L. analysed the component of samples. T.Y. collected the gas samples. J.C. and R.S. made the isotope analysis.

Funding

This research was funded by the GH Programs of China Geological Survey grant number DD20189320 and DD20160221.

Acknowledgments

This study was financially supported by the GH Programs of China Geological Survey (No. DD20189320 and No. DD20160221). We thank all of the scientists and staff who participated in China’s natural gas hydrate production test in SCS. The authors are grateful to Kuang Zenggui, Zhang Ruwei, Li Zhanzhao, Wang Tinghui, Wei Jiangong, and Liang Qianyong for their sampling and measurements in the field. We also thank Jiang Xuexiao and Deng Yinan for helping the carbon and oxygen isotope analyses in the laboratory.

Conflicts of Interest

The authors declare no conflicts of interest.

References

  1. Li, J.; Ye, J.; Qin, X.; Qiu, H.; Wu, N.; Lu, H.; Xie, W.; Lu, J.; Peng, F.; Xu, Z.; et al. The first offshore natural gas hydrate production test in South China Sea. China Geol. 2018, 1, 1–12. [Google Scholar] [CrossRef]
  2. Johnson, H. Global resource potential of gas hydrate—A new calculation. Fire Ice Methane Hydrate Newslett. 2011, 11, 1–4. [Google Scholar]
  3. Liu, C.; Meng, Q.; Li, C.; Sun, J.; He, X.; Yang, S.; Liang, J. Characterization of natural gas hydrate and its deposits recovered from the northern slope of the South China Sea. Earth Sci. Front. 2017, 24, 41–50, (In Chinese with English abstract). [Google Scholar]
  4. Bernard, B.B.; Brooks, J.M.; Sackett, W.M. Light-hydrocarbons in recent Texas continental-shelf and slope sediments. J. Geophys. Res.-Oceans 1978, 83, 4053–4061. [Google Scholar] [CrossRef]
  5. Claypool, G.E.; Kvenvolden, K.A. Methane and other hydrocarbon gases in marine sediments. Earth Planet. Sci. 1983, 11, 299–327. [Google Scholar] [CrossRef]
  6. Whiticar, M.J. Carbon and hydrogen isotope systematics of bacterial formation and oxidation of methane. Chem. Geol. 1999, 161, 291–314. [Google Scholar] [CrossRef]
  7. Milkov, A.V.; Claypool, G.E.; Lee, Y.-J.; Sassen, R. Gas hydrate systems at Hydrate Ridge offshore Oregon inferred from molecular and isotopic properties of hydrate-bound and void gases. Geochim. Cosmochim. Acta 2005, 69, 1007–1026. [Google Scholar] [CrossRef]
  8. Pape, T.; Bahr, A.; Rethemeyer, J.; Kessler, J.D.; Sahling, H.; Hinrichs, K.-U.; Klapp, S.A.; Reeburgh, W.S.; Bohrmann, G. Molecular and isotopic partitioning of low molecular-weight hydrocarbons during migration and gas hydrate precipitation in deposits of a high-flux seepage site. Chem. Geol. 2010, 269, 350–363. [Google Scholar] [CrossRef]
  9. Kim, J.-H.; Park, M.H.; Chun, J.H.; Lee, J.Y. Molecular and isotopic signatures in sediments and gas hydrate of the central/southwestern Ulleung Basin: High alkalinity escape fuelled by biogenically sourced methane. Geo-Mar. Lett. 2011, 31, 37–49. [Google Scholar] [CrossRef]
  10. Kim, J.-H.; Torres, M.E.; Choi, J.Y.; Bahk, J.J.; Park, M.H.; Hong, W.L. Inferences on gas transport based onmolecular and isotopic signatures of gases at acoustic chimneys and background sites in the Ulleung Basin. Org. Geochem. 2012, 43, 26–38. [Google Scholar] [CrossRef]
  11. Matsumoto, R.; Takashi, U.; Waseda, A.; Uchida, T.; Takeya, S.; Hirano, T.; Yamada, K.; Maeda, Y.; Okui, T. Occurrence, structure, and composition of natural gas hydrate recovered from the Blake Ridge, Northwest Atlantic. Proc. Ocean Drill. Program Sci. Results 2000, 164, 13–28. [Google Scholar]
  12. Sassen, R.; Sweet, S.T.; Milkov, A.V.; DeFreitas, D.A.; Kennicutt, M.C.; Roberts, H.H. Stability of thermogenic gas hydrate in the Gulf of Mexico: Constraints on models of climate change. In Natural Gas Hydrates: Occurrence, Distribution, and Detection; Paull, C.K., Dillon, W.P., Eds.; American Geophysical Union: Washington, DC, USA, 2001; pp. 131–143. [Google Scholar]
  13. Kida, M.; Jin, Y.; Watanabe, M.; Konno, Y.; Yoneda, J.; Egawa, K.; Ito, T.; Nakatsuka, Y.; Suzuki, K.; Fujii, T.; et al. Chemical and crystallographic characterizations of natural gas hydrates recovered from a production test site in the eastern Nankai Trough. Mar. Pet. Geol. 2015, 66, 396–403. [Google Scholar] [CrossRef]
  14. Choi, J.; Kim, J.-H.; Torres, M.E.; Hong, W.-L.; Lee, J.-W.; Yi, B.Y.; Bahk, J.J.; Lee, K.E. Gas origin and migration in the Ulleung Basin, East Sea: Results from the Second Ulleung Basin Gas Hydrate Drilling Expedition (UBGH2). Mar. Pet. Geol. 2013, 47, 113–124. [Google Scholar] [CrossRef]
  15. Zhu, J.; Shi, H.; He, M.; Pang, X.; Yang, S.; Li, Z. Origins and Geochemical Characteristics of Gases in LW3-1-1 Well in the Deep Sea Region of Baiyun Sag, Pearl River Mouth Basin. Nat. Gas Geosci. 2008, 19, 229–233, (In Chinese with English abstract). [Google Scholar]
  16. Winckler, G.; Werner, A.H.; Holocher, J.; Kipfer, R.; Levin, I.; Poss, C.; Rehder, G.; Suess, E.; Schlosser, P. Noble gas and radiocarbon in natural gas hydrates. Geophys. Res. Lett. 2002, 29, 1–4. [Google Scholar] [CrossRef]
Figure 1. Location of China’s first offshore gas hydrate production test in the South China Sea (SCS). The production test site named SHSC-4 (red solid star), which water depth is about 1263.5 m.
Energies 11 02793 g001
Figure 2. The representative GC curves of the gas samples from China’s first offshore gas hydrate production test in SCS. (a,b) stand for the GC curves of gas extracted from the early depressurization; (ch) are the curves of the gas samples from the middle production; (i,j) are the samples from the late production. All of the samples exhibit a large C1 peak and other weak peaks, which show that all of the gas samples are predominated by CH4.
Energies 11 02793 g002
Figure 3. Ternary diagram of hydrocarbons from China’s first offshore gas hydrate production test in SCS. All of the data points fall into the C1 end member, which indicate that methane is the main component of gas.
Energies 11 02793 g003
Figure 4. Relationship between C1/(C2 + C3) and δ13C-C1 of hydrocarbon from China’s first offshore gas hydrate production test in SCS (adapted from Whiticar et al. [6]). The data from the Blake Ridge [11], the Hydrate Ridge [7], the Mexico Gulf [12], the Japan Nankai Trough [13], and the Ulleung Basin [14] were plotted for comparison.
Energies 11 02793 g004
Figure 5. Relationship between δ13C and δD of CH4 from China’s first offshore gas hydrate production test in SCS (base map from Whiticar et al. [6]). The data from the LW3-1-1 gas well in SCS [15], the Hydrate Ridge [16], the Blake Ridge [11], the Mexico Gulf [12], and the Ulleung Basin [14] were plotted for comparison.
Energies 11 02793 g005

