1. Introduction
European Directive 2012/27/EU [
1] provides guidelines for developing retrofitting actions in public buildings within Europe. Educational buildings make up a large part of the building stock currently in need of refurbishment and therefore account for much of the overall energy consumption, and consequent expense to national budgets [
2].
The increasing average world temperatures resulting from climate change noticeably affect the building sector, and an increase in cooling demands is expected in 2000–2100 [
3]. In summer, high outdoor temperatures lead to increased air conditioning consumption [
4] or worsened comfort conditions with high indoor temperatures.
Several studies analysed solutions for improving energy efficiency and reducing energy consumption in schools, favouring passive techniques rather than mechanical solutions for improving energy performance [
5]. Rospi et al. analysed several schools in southern Italy, calculating the difference between measured and simulated consumption. After assessing several passive strategies of the building envelope, the authors concluded that actions on windows result in higher primary energy savings [
6]. This solution is of great importance in climates with higher solar radiation levels, given the high internal loads of school buildings (mainly due to high occupancy). In addition, in the absence of proper shading devices, there were noticeable heat gains through glazed surfaces. These systems were therefore considered potential components for the reduction of energy consumption, but this is also conditioned by user patterns, as concluded in the laboratory experiments by Zeiler et al. [
7].
While solar radiation through glazed surfaces severely affects indoor temperatures and visual comfort, heat gains through window openings improve natural illuminance levels and increase indoor temperatures in winter, causing visual discomfort and overheating in summer. Although solar energy facilitates the passive heating of buildings, excessive solar gains can lead to overheating and glare, so that solar control systems must therefore cover aspects such as thermal and visual comfort and energy saving. Although it should be possible to look out and maintain visual contact with the exterior while respecting the architectural aesthetics of the building, the main function of shading devices is to reduce solar gains in the summer season.
Various authors have attempted to establish a classification [
8] and comparative evaluation of different solar-control systems [
9] using integrated solutions for energy, acoustic, and lighting performances [
10]. Much of this analysis focuses on the impact on energy requirements [
11] and energy demand [
12] in office buildings. Dynamic control strategies are needed to promote optimum performance of these shading devices given the opposing requirements in winter and summer.
Eltaweel and Su [
13] proposed modifying the position and angle of Venetian blinds, using Grasshopper’s plugins to optimize daylight in office buildings, whereas other authors preferred simplified solutions which are easier to apply in building refurbishment. Freewan [
14] compared the effect of different external vertical and diagonal fins and egg-crate devices behind a brise-soleil in an office building in Jordan, recording indoor ambient conditions (air temperature and illuminance level) and comparing these with an office with no shading device during July and August. Computer simulation was used to evaluate the performance of these shading devices and solar and daylight distribution. The effect of the use of curtains by occupants was also assessed. Egg-crate shading devices display a better annual energy performance, blocking sunlight in warmer periods while allowing it into the spaces in winter. Users prefer egg-crate models, as they contribute to creating vivid working environments while simultaneously maintaining a level of contact with the outside.
Research to date has focused mostly on office buildings rather than on educational buildings, whose significant indoor thermal loads are due to high occupancy. Most studies used simulation tools [
15] to evaluate the energy improvements of shading devices and interactions between cooling and lighting energy [
16]. Moreover, controlled ambient analysis is also used in test rooms [
17] to assess real scale models and the effects of different shading device configurations on thermal and lighting consumption [
18]. Given the importance of these shading devices in retrofitting, classrooms with and without shading devices should be compared, bearing in mind real user patterns and annual performance. The presence of blinds, the most frequently used solar control devices in educational buildings in southern Spain, should also be taken into consideration in these assessments.
In general, studies conducted support the view that the reaction of occupants to discomfort usually has a negative impact in terms of energy. This research aims to evaluate the potential for reducing lighting and air conditioning consumption, using low-cost shading devices in the retrofitting of educational buildings in a Mediterranean climate, studying real user patterns and considering occupants’ use of blinds. The impact of these devices on indoor natural illuminance, solar radiation levels, and operative temperatures was also analysed without considering user influence.
2. Methodology
The ambient conditions of two identical classrooms in a school in Seville (southern Spain), with a Mediterranean climate, were monitored. An egg-crate solar protection system was installed on the outside of the window of one of these classrooms, while the second classroom was left in its original state. Both classrooms were evaluated simultaneously, considering identical climate conditions and following real use patterns. Ambient and thermal variables were monitored over a 12-month period to analyse the influence of the solar protection system, followed by a descriptive statistical analysis using the integrated development environment (IDE) of the Statistics Toolbox of the MATLAB matrix software [
19]. This research focused mainly on the analysis of electric consumption (kWh) from air conditioning (AC) and artificial lighting systems. This paper also includes the results of indoor operative temperatures (°C) and indoor illuminance levels (lux).
2.1. Description of Case Study
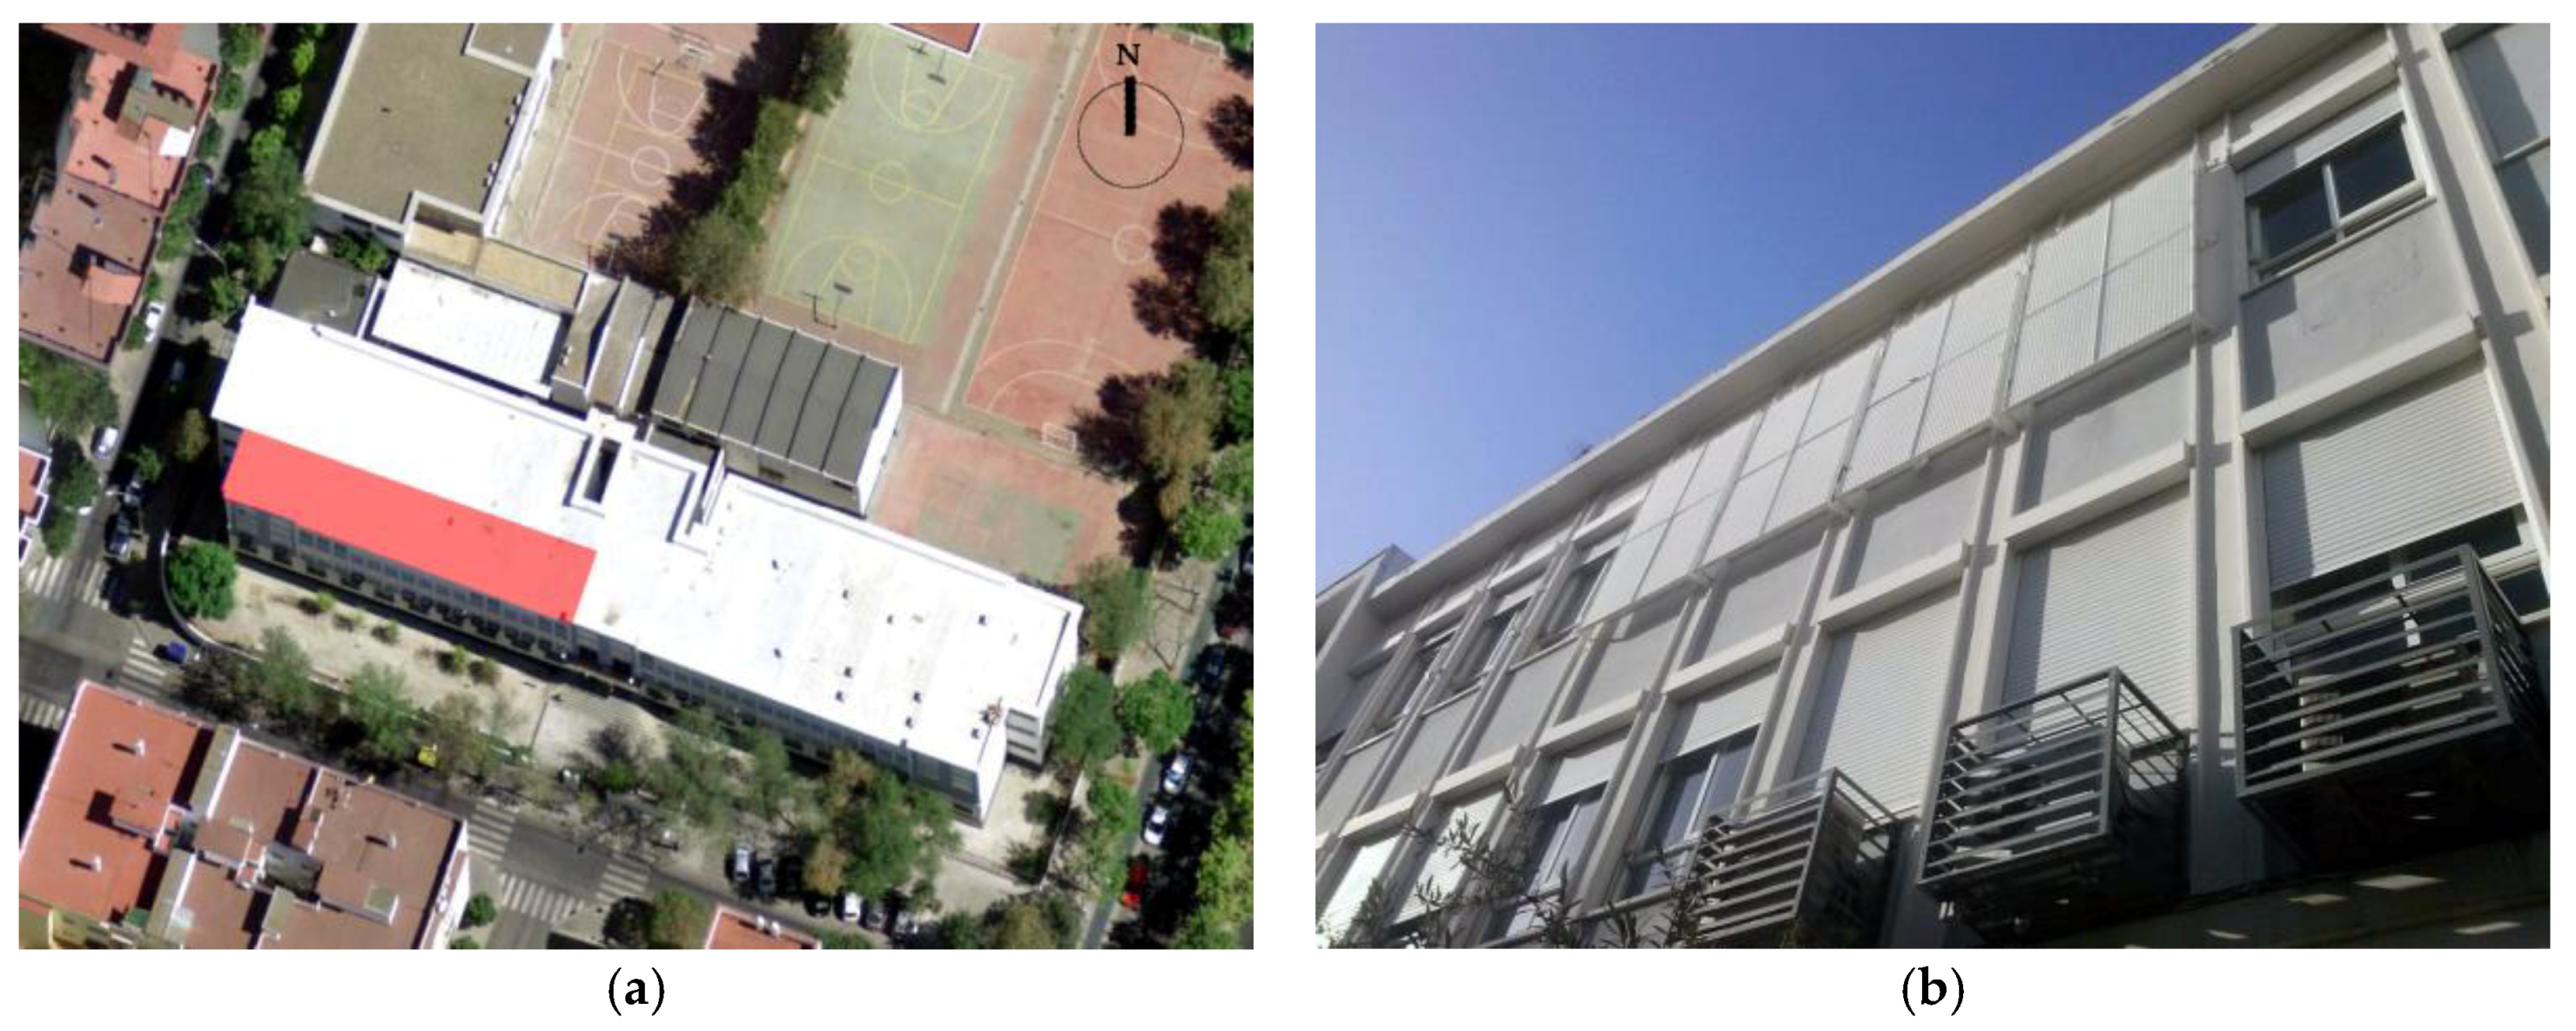
The case study monitored was Martínez Montañés Secondary School, a state school building managed by the Regional Government of Andalusia (Spain), which considers this school to be representative of those in the Mediterranean climate in the region. This school, built in 1967 and renovated in 1998, is located in the city of Seville (
Figure 1a): latitude 37.37° N and longitude: −5.97° W. The Köppen-Geiger Classification [
20] places Seville in the Csa climate, with hot and dry summers and a maximum average temperature of 36.3 °C in the warmest month, while the Spanish Technical Building Code [
21] considers Seville a B4 climate zone.
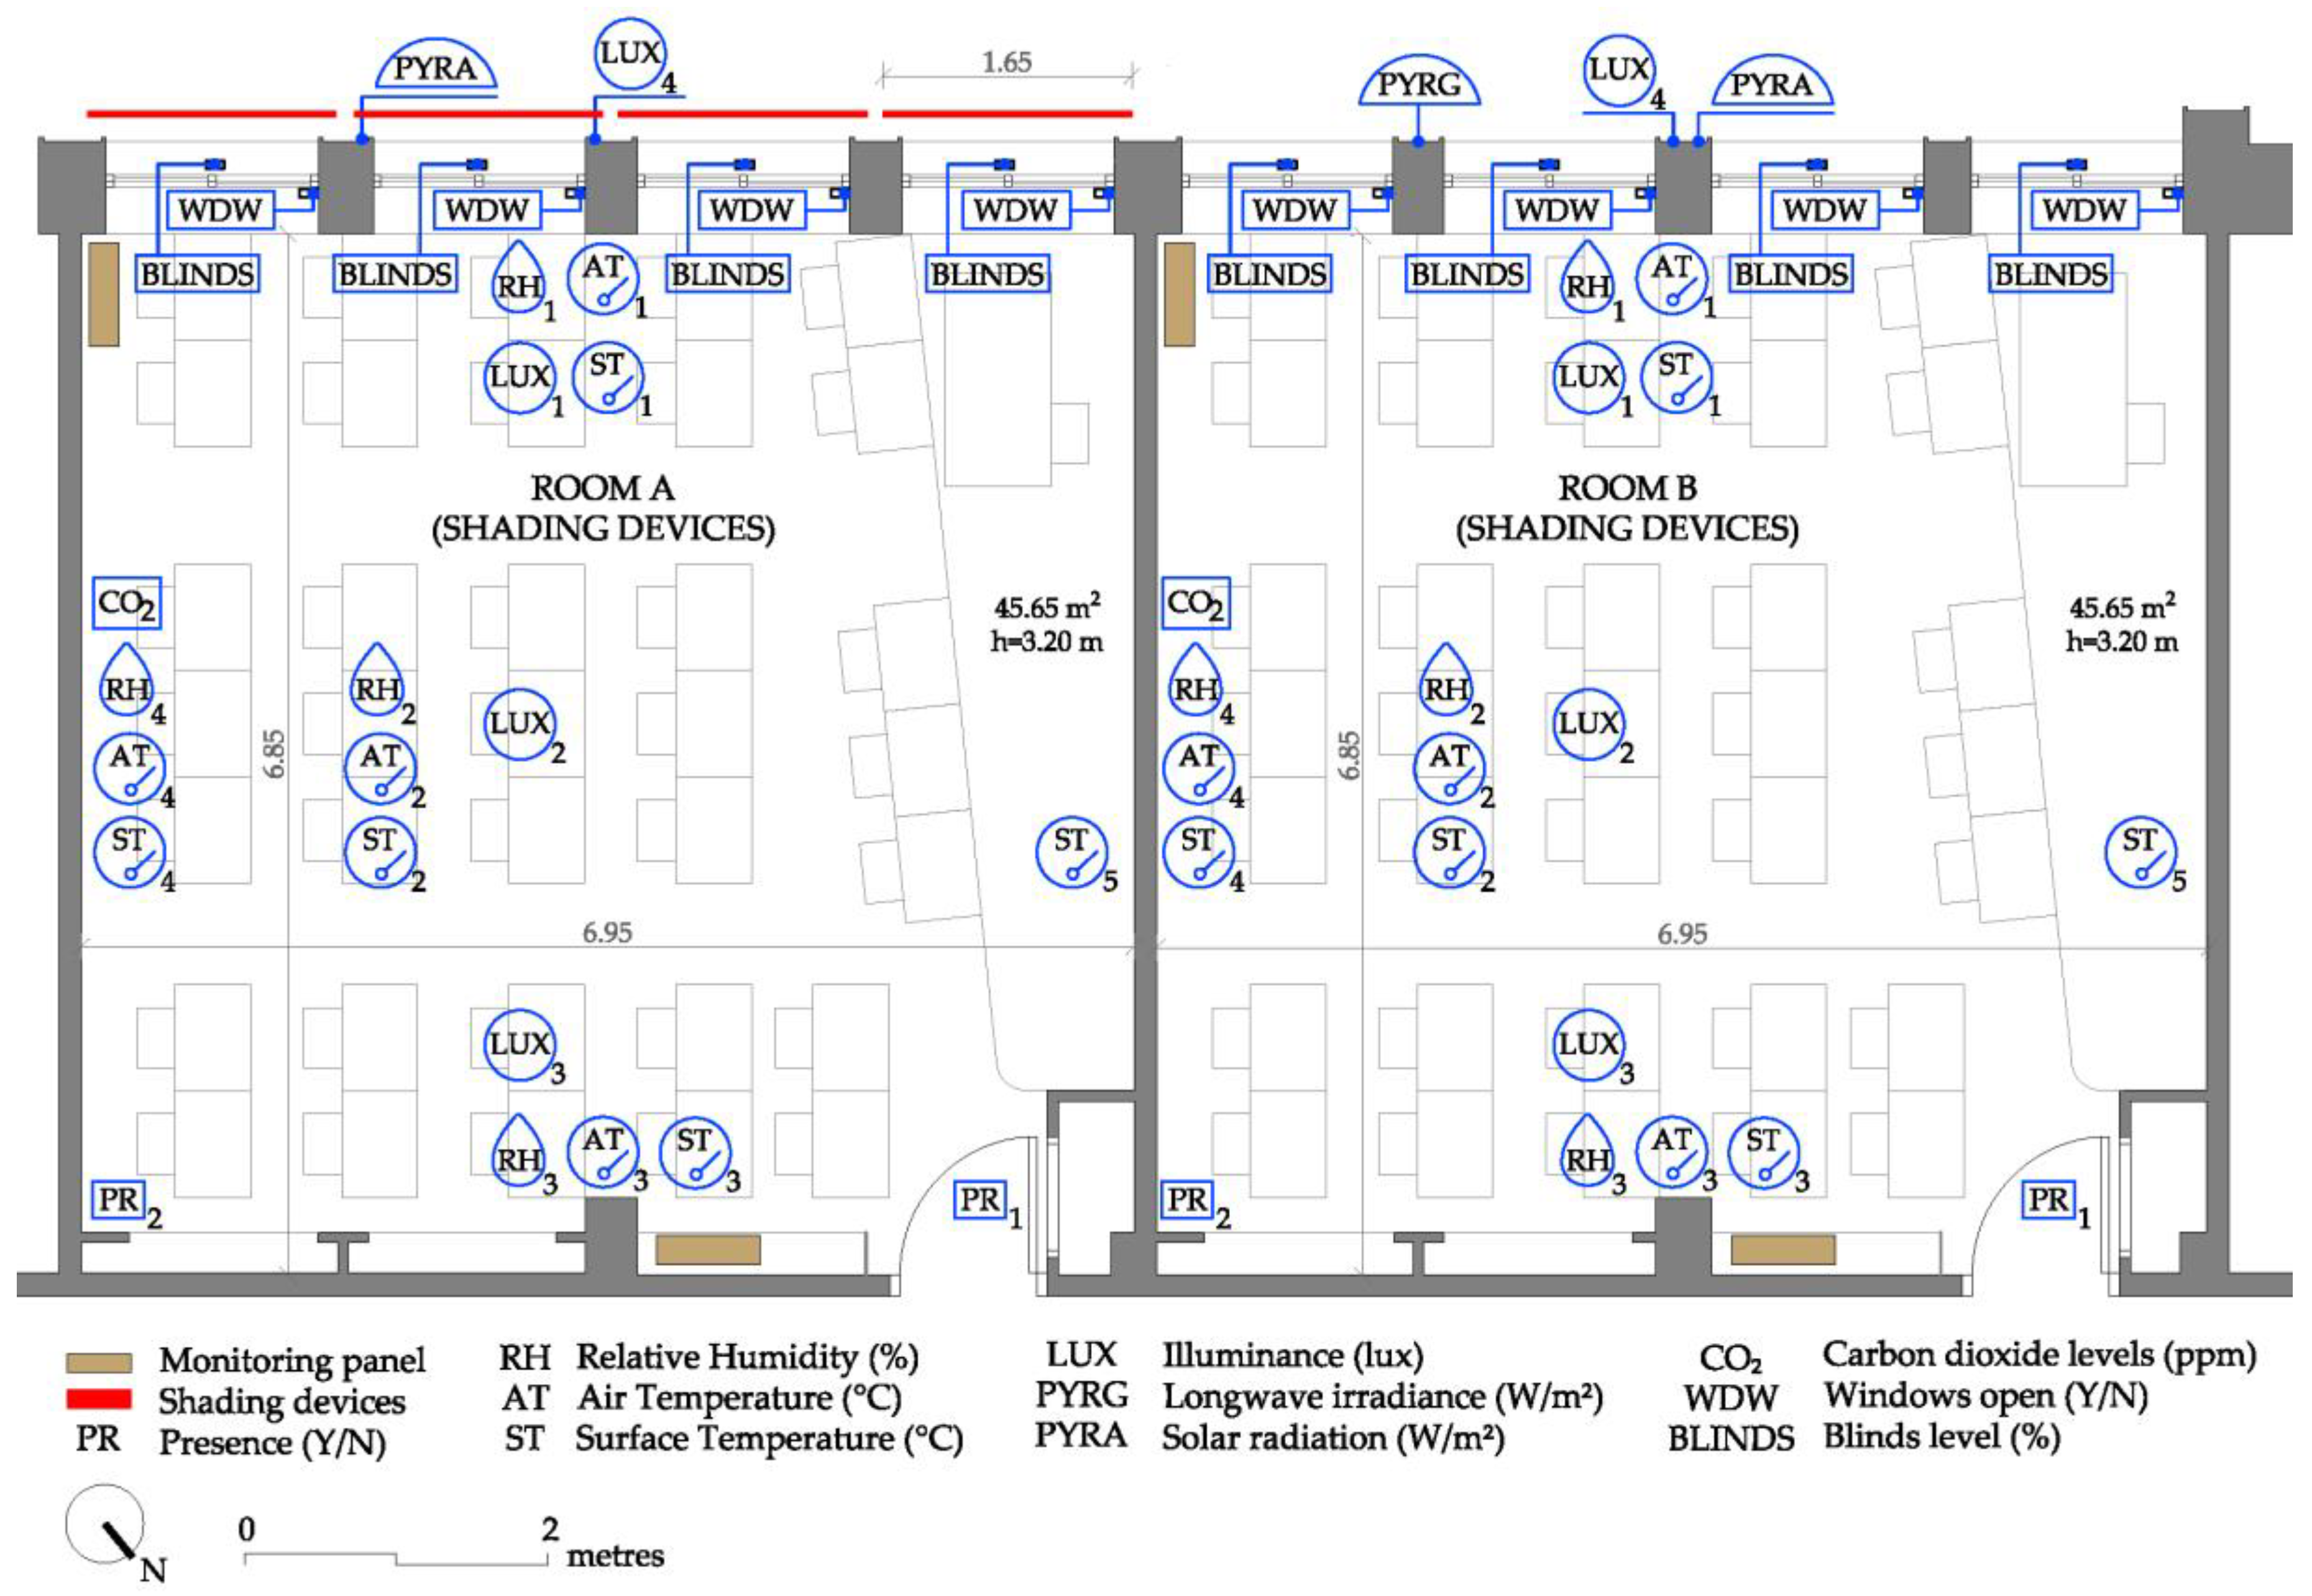
Two adjacent classrooms were monitored, both located in a south-facing module of the second floor of the building (
Figure 1b), and each with a maximum capacity for 35 students. These 6.95 m wide and 6.85 m deep classrooms each had a total useful area of 45.65 m
2 and a clearance height of 3.20 m (
Figure 2). Each classroom had four sliding window modules, with aluminium frames and 4 mm single glazing with no thermal bridge (U = 5.80 W/m
2·K). The 2.40 m high and 1.40 m wide window modules accounted for around 53% of the external façade surface of each classroom. Access doors from an indoor corridor were located opposite the predominantly south-facing windows.
The constructive composition of the façade is the same for both classrooms: 0.115 m perforated brick wall, 0.015 m interior mortar rendering, 0.05 m air chamber, 0.04 m partition brick wall, and 0.015 m gypsum plaster (U = 1.55 W/m
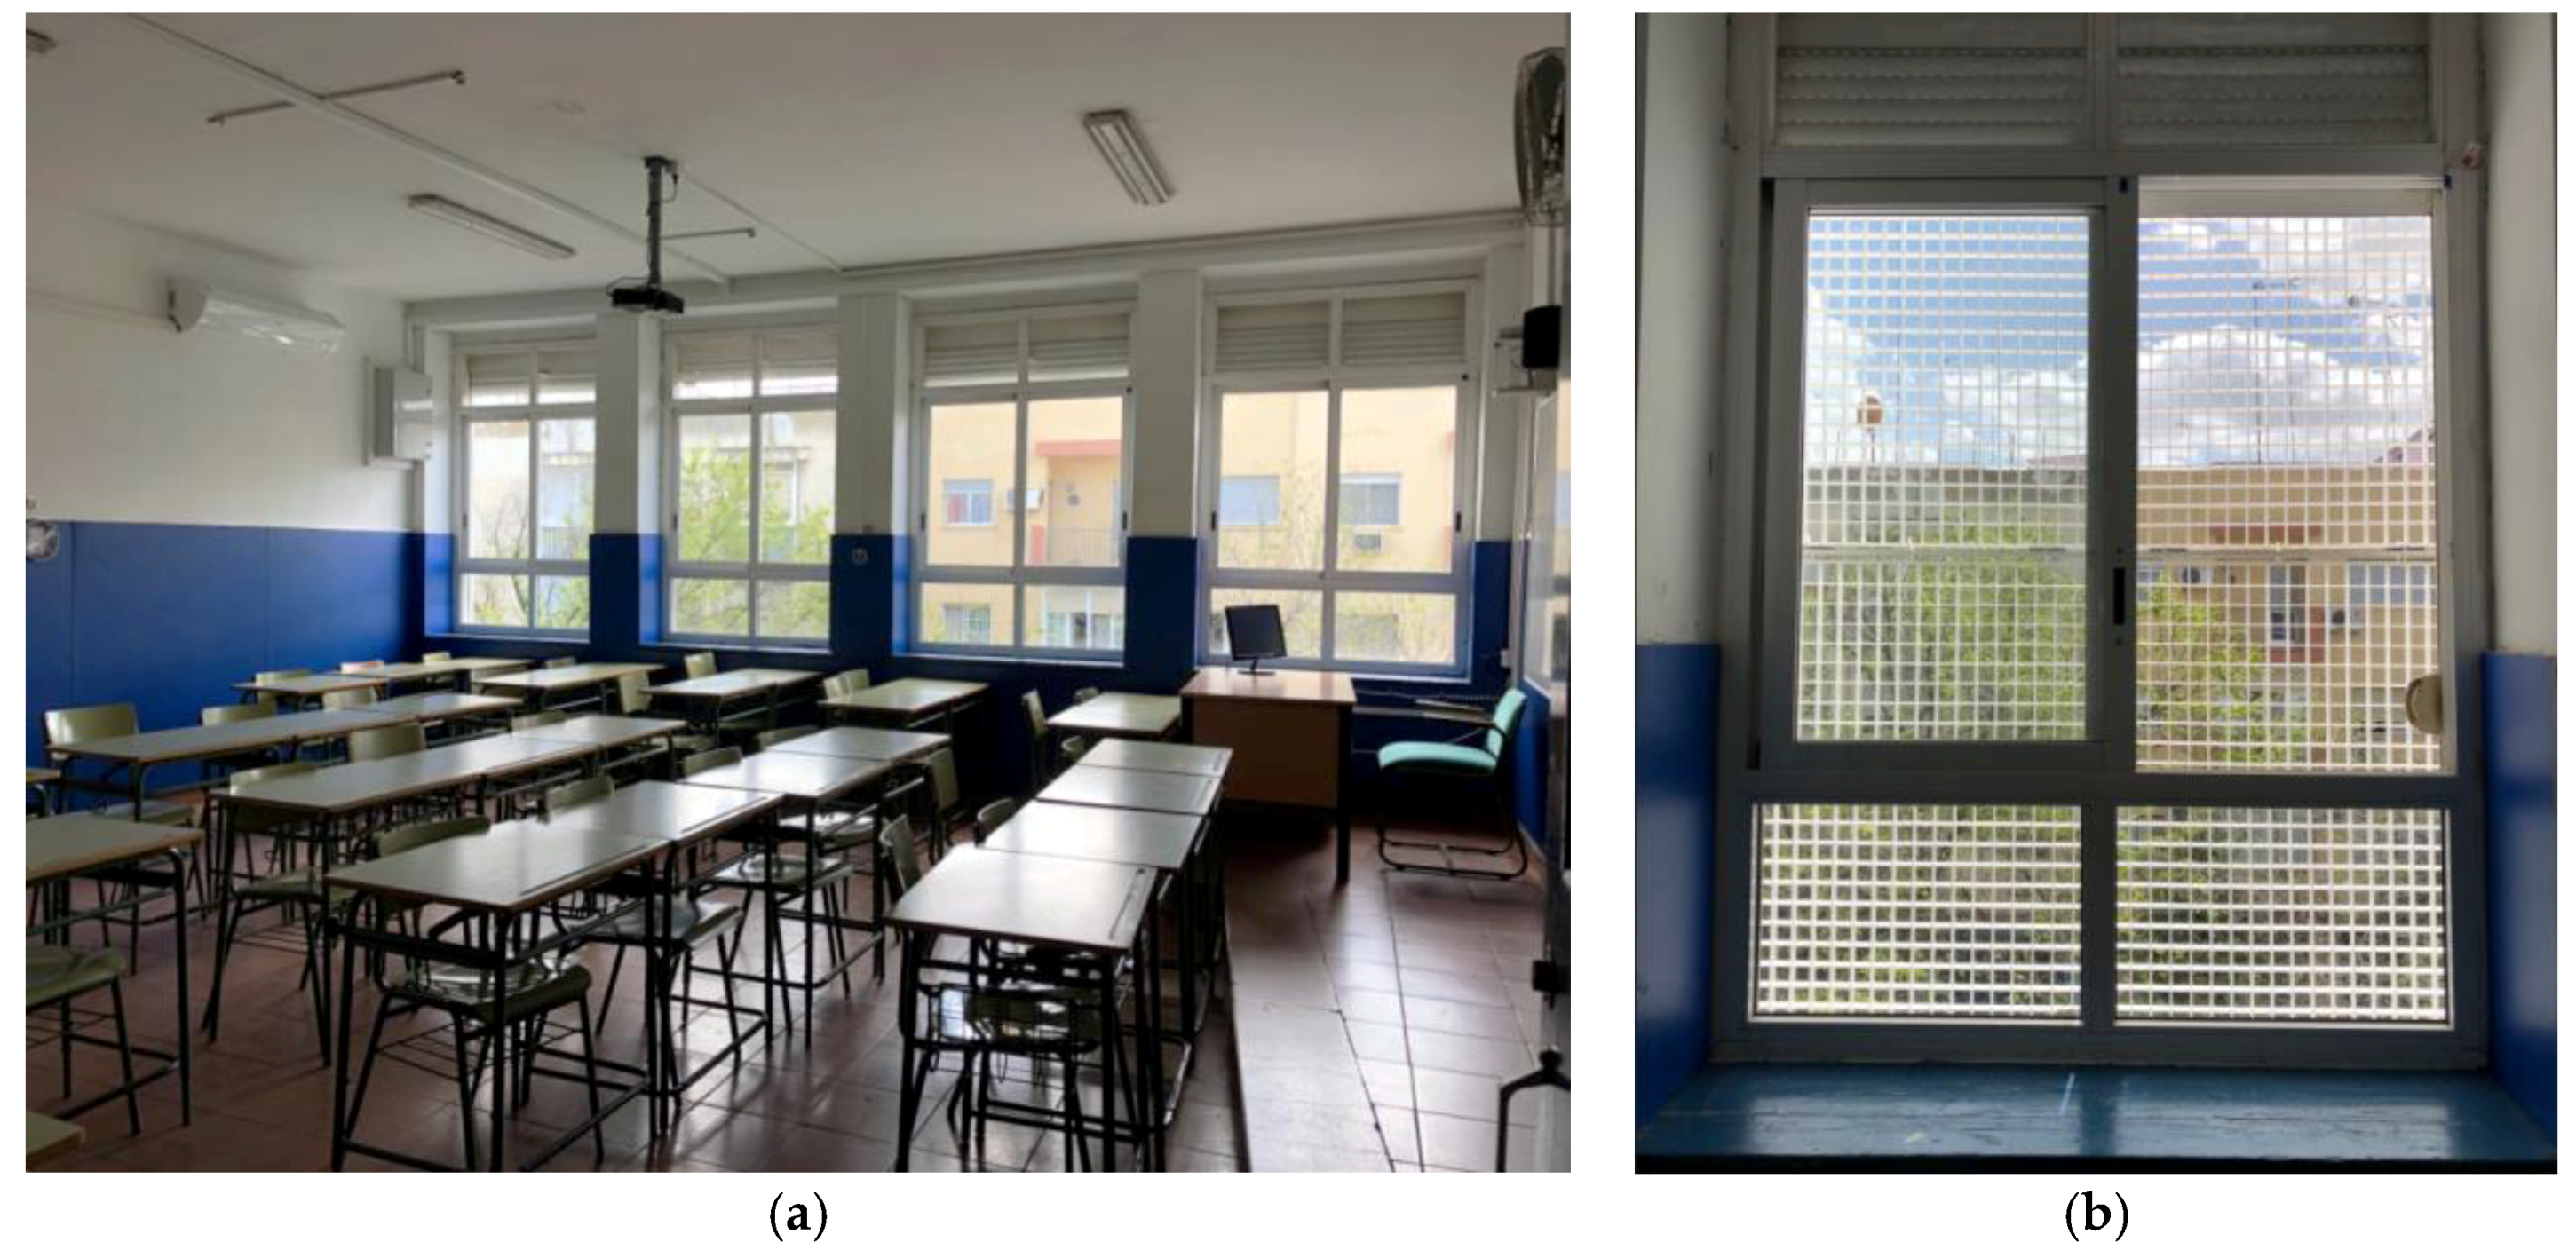
2·K). The solar protection system of Polyvinyl Chloride (PVC) horizontal slatted shutters in these rooms was part of the original building construction. An additional external solar protection device, described in detail in
Section 2.3, was installed in one of the classrooms (room A), while the other classroom (room B) maintained its original configuration with no external solar protection devices, and so was used as reference in the comparative analysis (
Figure 3a).
A direct expansion heat pump was installed for the air conditioning systems in both classrooms, connected to two wall indoor units and an exterior inverter unit. These systems had a cold/heat capacity of 6.8/7.8 kW, with an energy efficiency of SEER (Seasonal Energy Efficiency Ratio) 6.1 (A++) and SCOP (Seasonal Coefficient Of Performance) 3.8 (A).
Finally, it should be noted that both classrooms still preserved the original lighting system consisting of four luminaires, each with two 2 × 36 W fluorescent lamps.
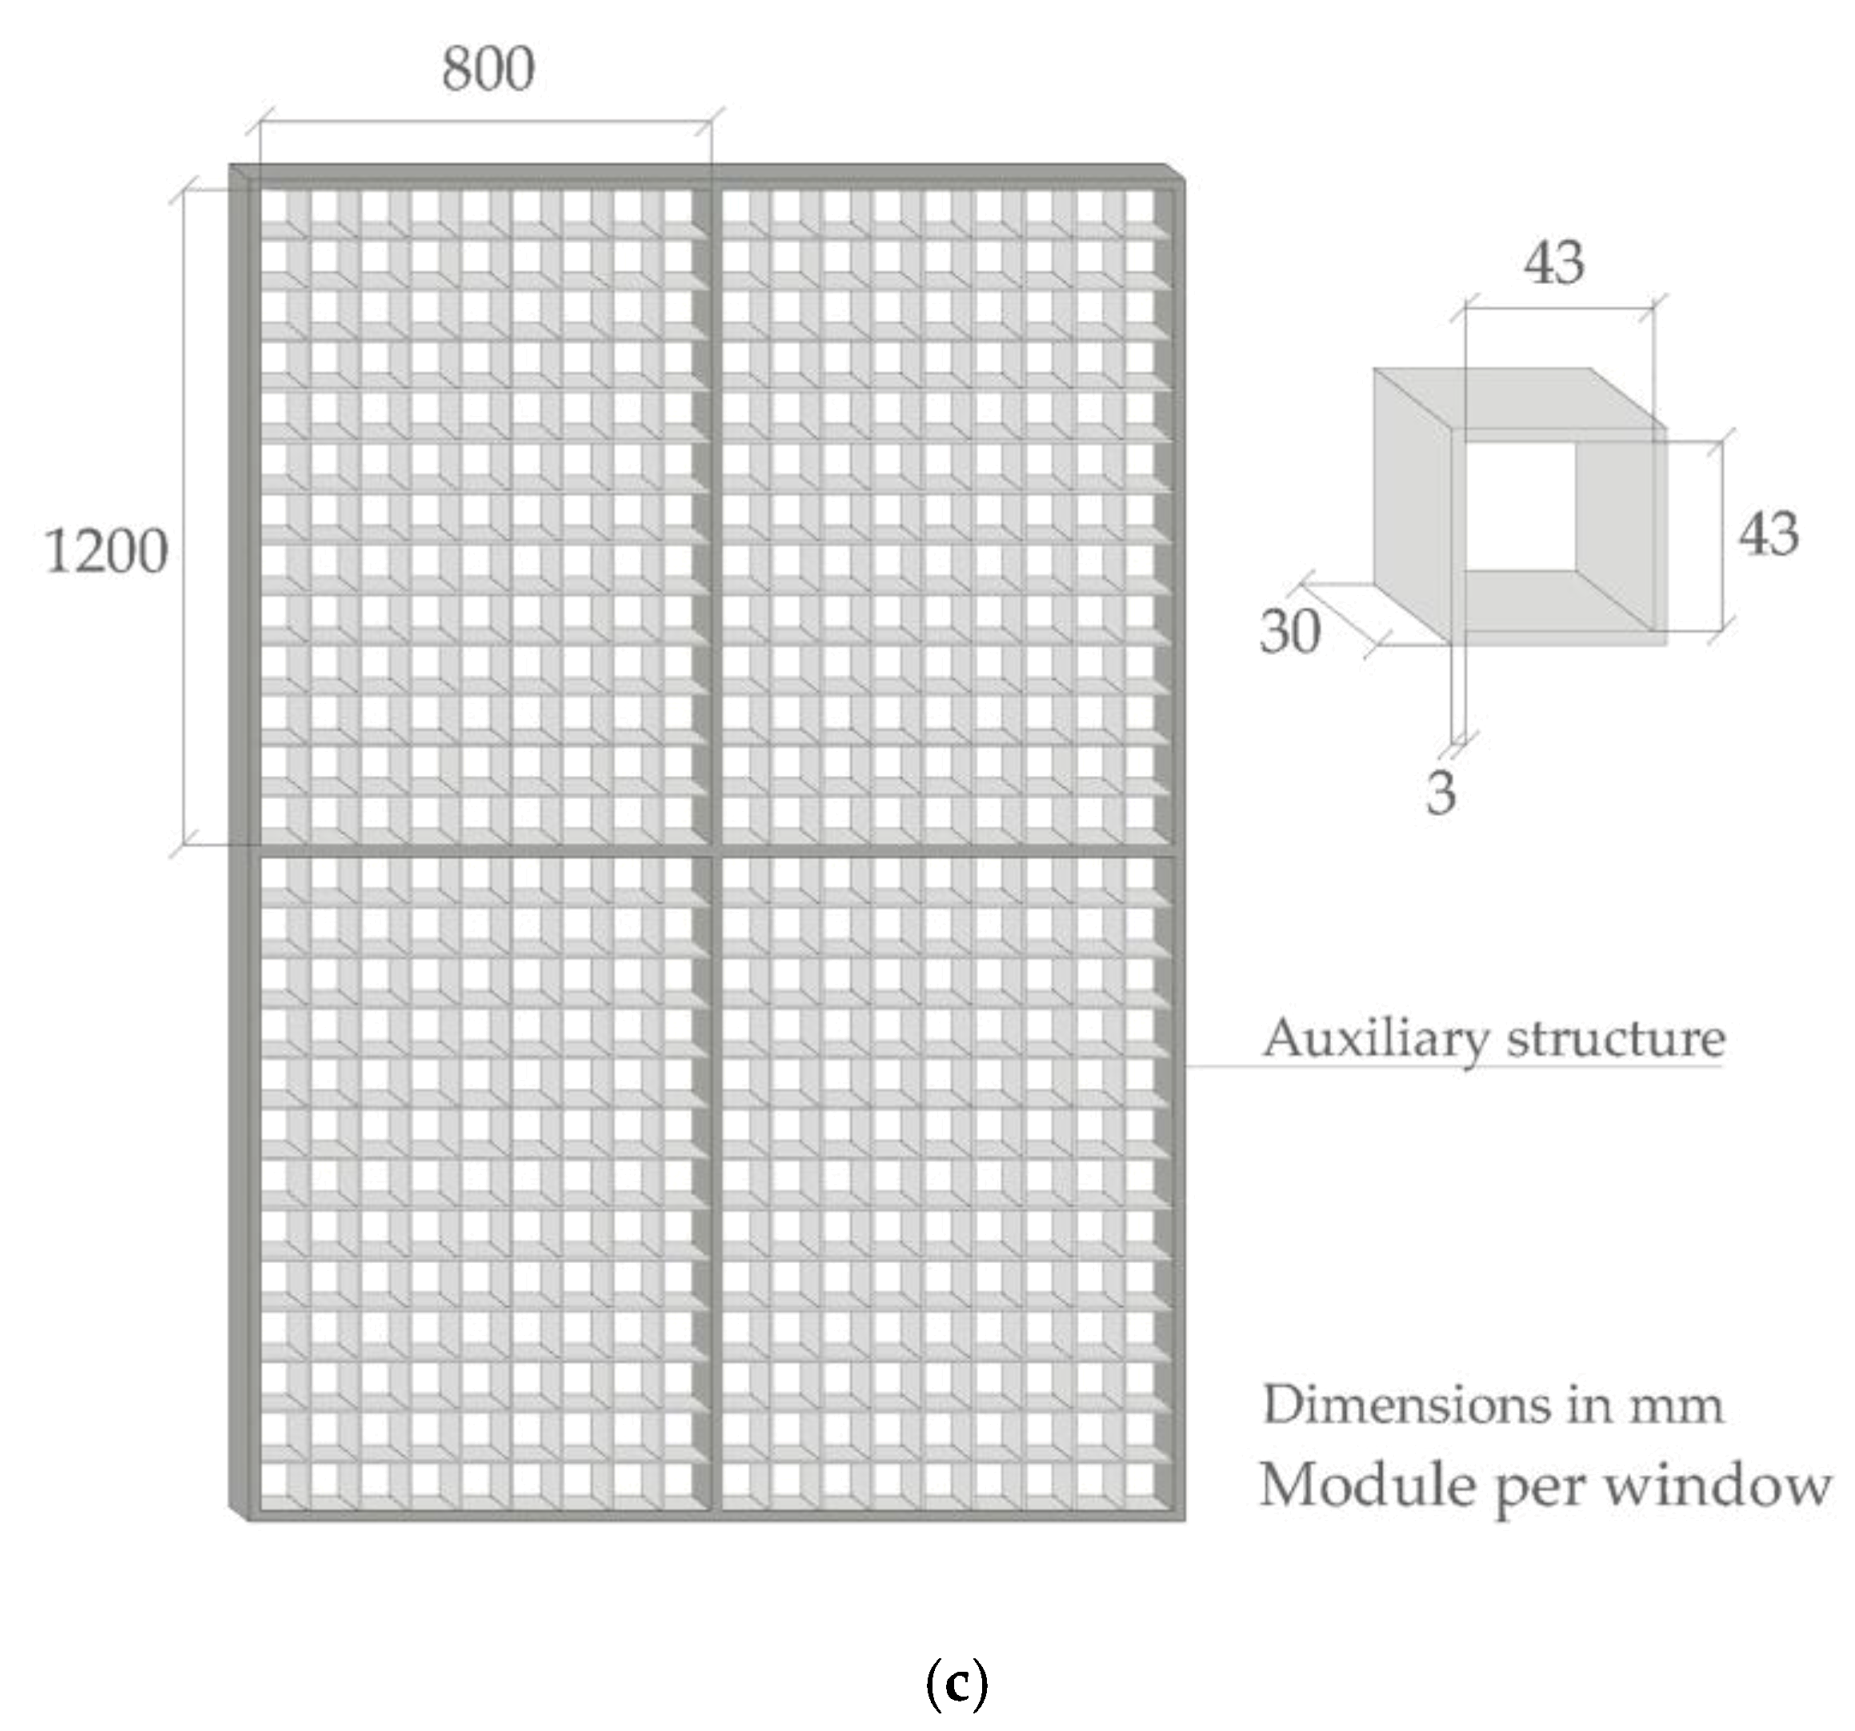
2.2. Shading Device Description
The solar protection designed is a grid consisting of white methacrylate tongue-and-groove slats (
Figure 3b,c) and manufactured using a laser cutting machine in the Digital Fabrication Laboratory (FabLab) of the Higher Technical School of Architecture of the University of Seville.
The 3-mm-thick and 30-mm-deep slats were assembled in a 43 × 43 mm rectangle, and an external auxiliary 1640 × 2440 mm structure in S275 JR corrosion-proof steel was incorporated into the solar protection prototype. This structure, made up of 45 × 10 mm metal pieces with an interior metal anchorage of 45 × 10 mm, left four empty 805 × 1205 mm slots where the lattices were placed. L.55.45.10 mm steel pieces were welded to each corner to separate the auxiliary structure from the building envelope, while the shading device and window glazing were 0.35 m apart and placed 0.20 m from the external façade line. The egg-crate device was made up of 16 1200 × 800 mm lattices in total.
2.3. Monitoring System
A monitoring system following EN ISO 7726: 2001 [
22] was set up, with nine nodes or data loggers to store the information monitored at 10-min intervals. Both classrooms had two monitoring panels, with two hubs in each.
The first hub was connected to the electric consumption of the classroom lighting system. The second recorded measurements for an indoor detection sensor, four illuminance sensors (three indoors and one outdoors), four sensors measuring blind aperture level, and four sensors controlling window openings, while the third hub included five indoor surface temperature sensors. Finally, the fourth hub was made up of four indoor humidity sensors, four indoor air temperature sensors, an indoor carbon dioxide detector, an outdoor pyranometer (vertical and parallel to the façade) and an outdoor pyrgeometer.
The pyranometer in room A was placed behind the egg-crate device to measure the efficiency of the shading device, while the pyranometer in room B recorded the global solar radiation reaching the façade in the absence of obstacles.
An additional monitoring panel with the ninth data logger was incorporated into the system. This data logger used several sensors measuring power consumption (W), voltage (V), and electricity intensity (A) to calculate the electric consumption of the air conditioning (AC) and lighting system in the classroom.
Table 1 shows the technical characteristics of the sensors used in the process for monitoring the ambient and energy variables of the classrooms.
The information regularly stored in the data loggers was uploaded every 30 min to a File Transfer Protocol (FTP) server by mobile card via a static IP address. Data recorded were processed and exported to the Microsoft Excel 2016
® [
23] format, before being analysed and interpreted using MATLAB matrix software (
R2017 a, The Mathworks Inc., Natick, MA, USA) [
19]. The data monitored was accessed remotely by downloading the files from the FTP server or through an html portal, which also allows the configuration to be easily monitored.
Outdoor variables were measured using a local weather station 450 m away located above test cells managed by the research group. As described in a previous paper by the authors [
17], this system measures outdoor ambient variables for air temperature, relative humidity, CO
2 levels, and wind speed and direction.
Table 2 includes technical information on the sensors from the local weather station.
2.4. Infiltration Tests
A Blower Door test was carried out to characterize the airtightness of the building envelope in both classrooms, following ISO 9972 [
24]. Once the natural air gates were sealed, the room was depressurised using a 50 Pa pressure fan and indoor air was extracted until the differential pressure was balanced with the outdoor air. Subsequently, the differential pressure decreased continuously through a gradual reduction in fan velocity. This test aimed to establish a curve showing the relation between differential pressure and extracted airflow. A Minneapolis Blower Door Model 4/230 V System (The Energy Conservatory, Minneapolis, MN, USA) which uses TECTITE Express software (The Energy Conservatory, Minneapolis, MN, USA) was used to obtain measurements with windows and doors closed.
Table 3 shows the infiltration test results. Airtightness of the envelope was similar in both classrooms, with values ranging between 0.13 and 0.20 Air Changes per Hour (ACH) for a pressure level of 50 Pa. Based on these values, both classrooms can therefore be considered comparable.
2.5. Monitoring Periods Used in Analysis of Results
Both classrooms were monitored over a 12-month period (from May 2017 to April 2018). As this experiment is still ongoing, the analysis presented in this paper is considered to be an initial approach to the results obtained regarding the electric consumption of air conditioning and lighting systems in the classrooms. The values for daily evolution in indoor operative temperatures, natural illuminance and solar radiation levels recorded during a typical and representative day are also shown. For the purposes of this analysis, the study has been divided into the following sections:
2.5.1. Seasonal Analysis of Electric Air Conditioning and Lighting Consumption
Three representative periods—winter, summer, and mid-season—were analysed from the total annual monitoring and classified by outdoor temperature range. The selection process for the summer period took into consideration the fact that the academic calendar finishes in mid-June and that the school remained closed during the rest of the summer, that is, the months of July and August. The characteristics of the periods analysed can be seen in
Table 4.
This section also shows the evolution of natural illuminance, solar radiation levels and indoor operative temperatures recorded simultaneously in both classrooms for the same day in mid-season, 18 April 2018. The analysis was carried out when the highest outdoor temperatures (the most unfavourable outdoor conditions) were reached, during an unoccupied period (without user influence), in free-running conditions (no air conditioning), and with a blind aperture level of 100% (blinds fully open). The mid-season period was selected for the striking similarity in the activation of air conditioning and lighting systems in both rooms.
2.5.2. Annual Analysis of Air Conditioning and Lighting Consumption
Finally, the influence of solar protection on the annual consumption of air conditioning and lighting systems was analysed from May 2017 to April 2018. Users had a great influence on indoor ambient through actions such as modifying blind level aperture or switching on the artificial lighting system depending on different activities to be carried out in the classroom. In addition, the difference between the percentages of occupied hours of the classrooms, shown in the previous table, inevitably resulted in uncertainties which must be kept to a minimum in order to ascertain the real influence of the solar protection designed. Data were filtered considering the hours in which both classrooms were occupied simultaneously, making it possible to calculate the real annual savings of the air conditioning and artificial lighting systems (kWh) due to the shading devices, as the annual occupied hours considered were the same for both classrooms.
3. Analysis of Consumption Results
This section analyses the influence of the egg-crate shading device on thermal and energy variables in the classroom. Air conditioning and lighting consumption monitoring results are presented, both for the classroom with shading devices (room A) and for that without egg-crate devices (room B), considering the same outdoor conditions. The impact of solar protection on indoor operative temperatures, natural illuminance and solar radiation levels were also analysed in both classrooms during an entire unoccupied day, following the criteria stated in
Section 2.5.
3.1. Seasonal Analysis of Electric Air Conditioning and Lighting Consumption
This section includes a general analysis of the hours when the air conditioning and lighting systems were active. A seasonal study was carried out to examine the use patterns in both classrooms, as
Table 5 shows.
This table shows the percentages of occupied hours (%) from the total of hours recorded (fifth column in
Table 4), which are similar in both classrooms, especially in winter and summer. Moreover, it also indicates the percentage of hours (%) in which the air conditioning and lighting systems were on, as determined from the percentage of hours of occupancy for each classroom. The percentage of hours in which the air conditioning system was ON was higher in room A, with shading devices, both for winter and mid-season. In contrast, the activity of the air conditioning system was 2.3% higher in summer in the room B, without shading devices. The artificial lighting system was active for similar percentages of hours in both classrooms in the winter and mid-season periods. In contrast, lights were on during 21.5% more hours in the classroom with no shading devices (room B) in the summer.
Table 6 shows the solar radiation levels (W/m
2) and the average blind aperture level (%) when the air conditioning system was ON for each period and classroom.
In the classroom with no shading device (room B), with solar radiation levels below 200 W/m2 and blind aperture levels up to 25%, air conditioning was in use during more than 50% of hours in winter, approximately 9% in mid-season, and approximately 64% of the hours in summer. In the case of the room with shading devices (room A), these values accounted for 25% of the hours in winter, 11% in mid-season, and almost 30% in summer. These results also reflect the significant influence of users in the control of some of the variables monitored, including the blind aperture level mentioned earlier.
Table 7 shows the percentage of hours when the artificial lighting system was on. Data obtained were classified by blind aperture level which was higher in the classroom with shading devices (room A) than in that of the classroom with no egg-crate devices (room B). This was especially important in summer and mid-season, with values above 50% of the hours.
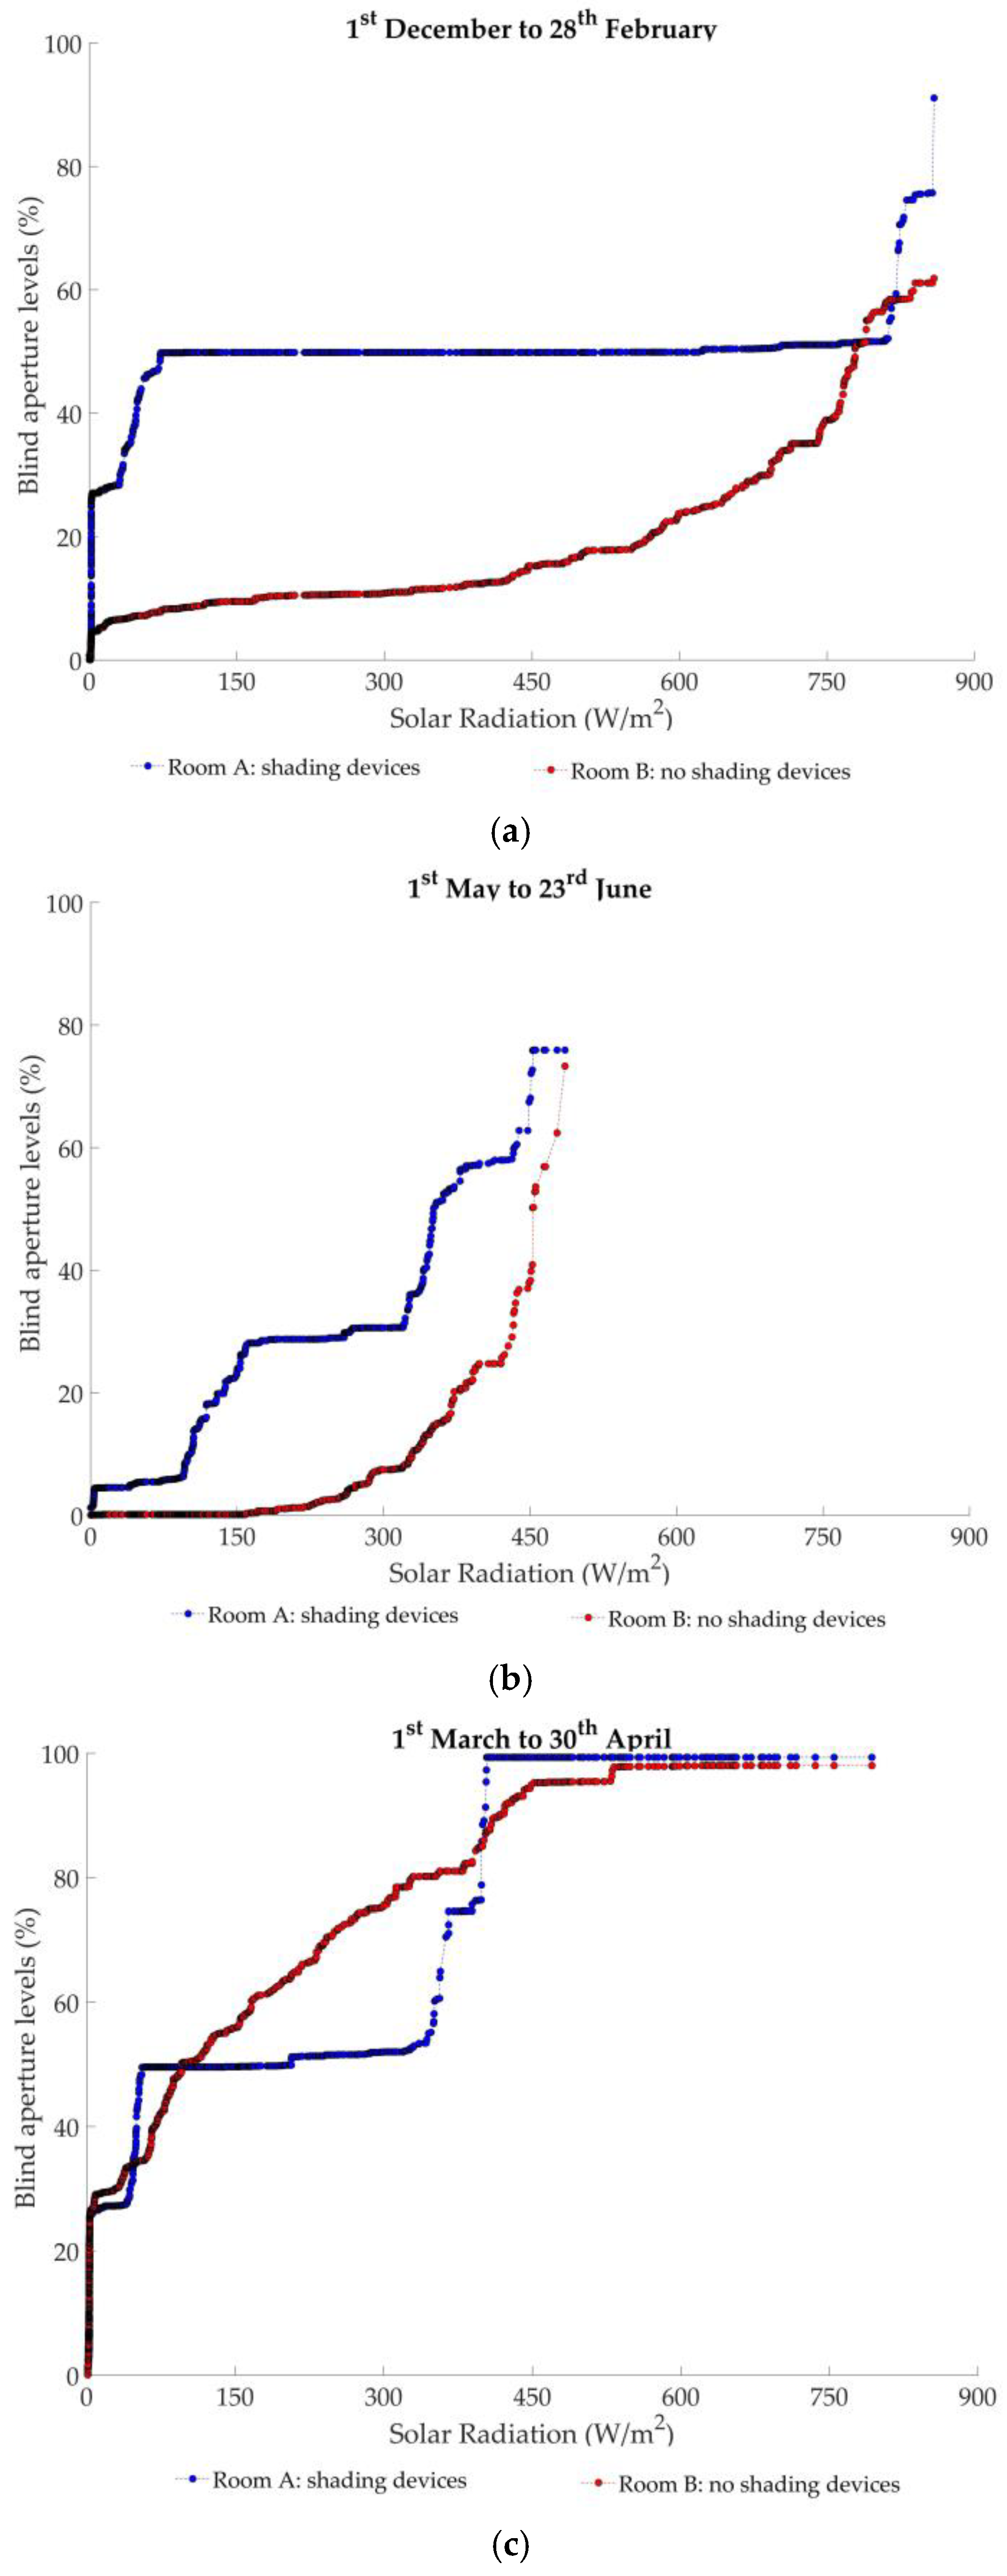
Figure 4 represents cumulative distributions of solar radiation levels (x-axis) considering the blind aperture levels (y-axis) in both rooms, reflecting the use of blinds when a specific solar radiation level was reached on the unobstructed façade. In winter (
Figure 4a), blind aperture levels were constantly set at 50% open in the room with egg-crate devices, regardless of solar radiation levels. As solar radiation levels increased, the blind aperture levels gradually increased in the room with no solar protection and lower blind aperture levels were registered for longer periods.
In summer (
Figure 4b), considering the same solar radiation levels, blind aperture levels tended to be lower in the room with no shading devices. With solar radiation of 150 to 300 W/m
2, blind levels were usually set at 30% open in the room with egg-crate shading devices.
Finally, at solar radiation levels of 100 to 300 W/m2, blind aperture levels were usually 50% open in the room with egg-crate devices in mid-season, while with cumulative values of 350 to 750 W/m2, blinds were normally fully open in this room. Therefore, blind aperture levels in the room with egg-crate shading devices remained more constant in time when compared with the other room. The increase in blind aperture levels of the room with no egg-crate devices was more gradual when solar radiation levels were higher. With solar radiation levels above 370 W/m2, blind aperture levels were usually higher in the room with egg-crate devices.
3.2. Seasonal Analysis of Electric Air Conditioning and Lighting Consumption during the First Hour of Class
This subsection analyses the hours for each seasonal period when both classrooms were simultaneously occupied. The analysis specifically focuses on the first morning class (scheduled between 9:00 and 10:00), the hour in which the most coincidences in user patterns were detected.
3.2.1. Analysis of Air conditioning Consumption
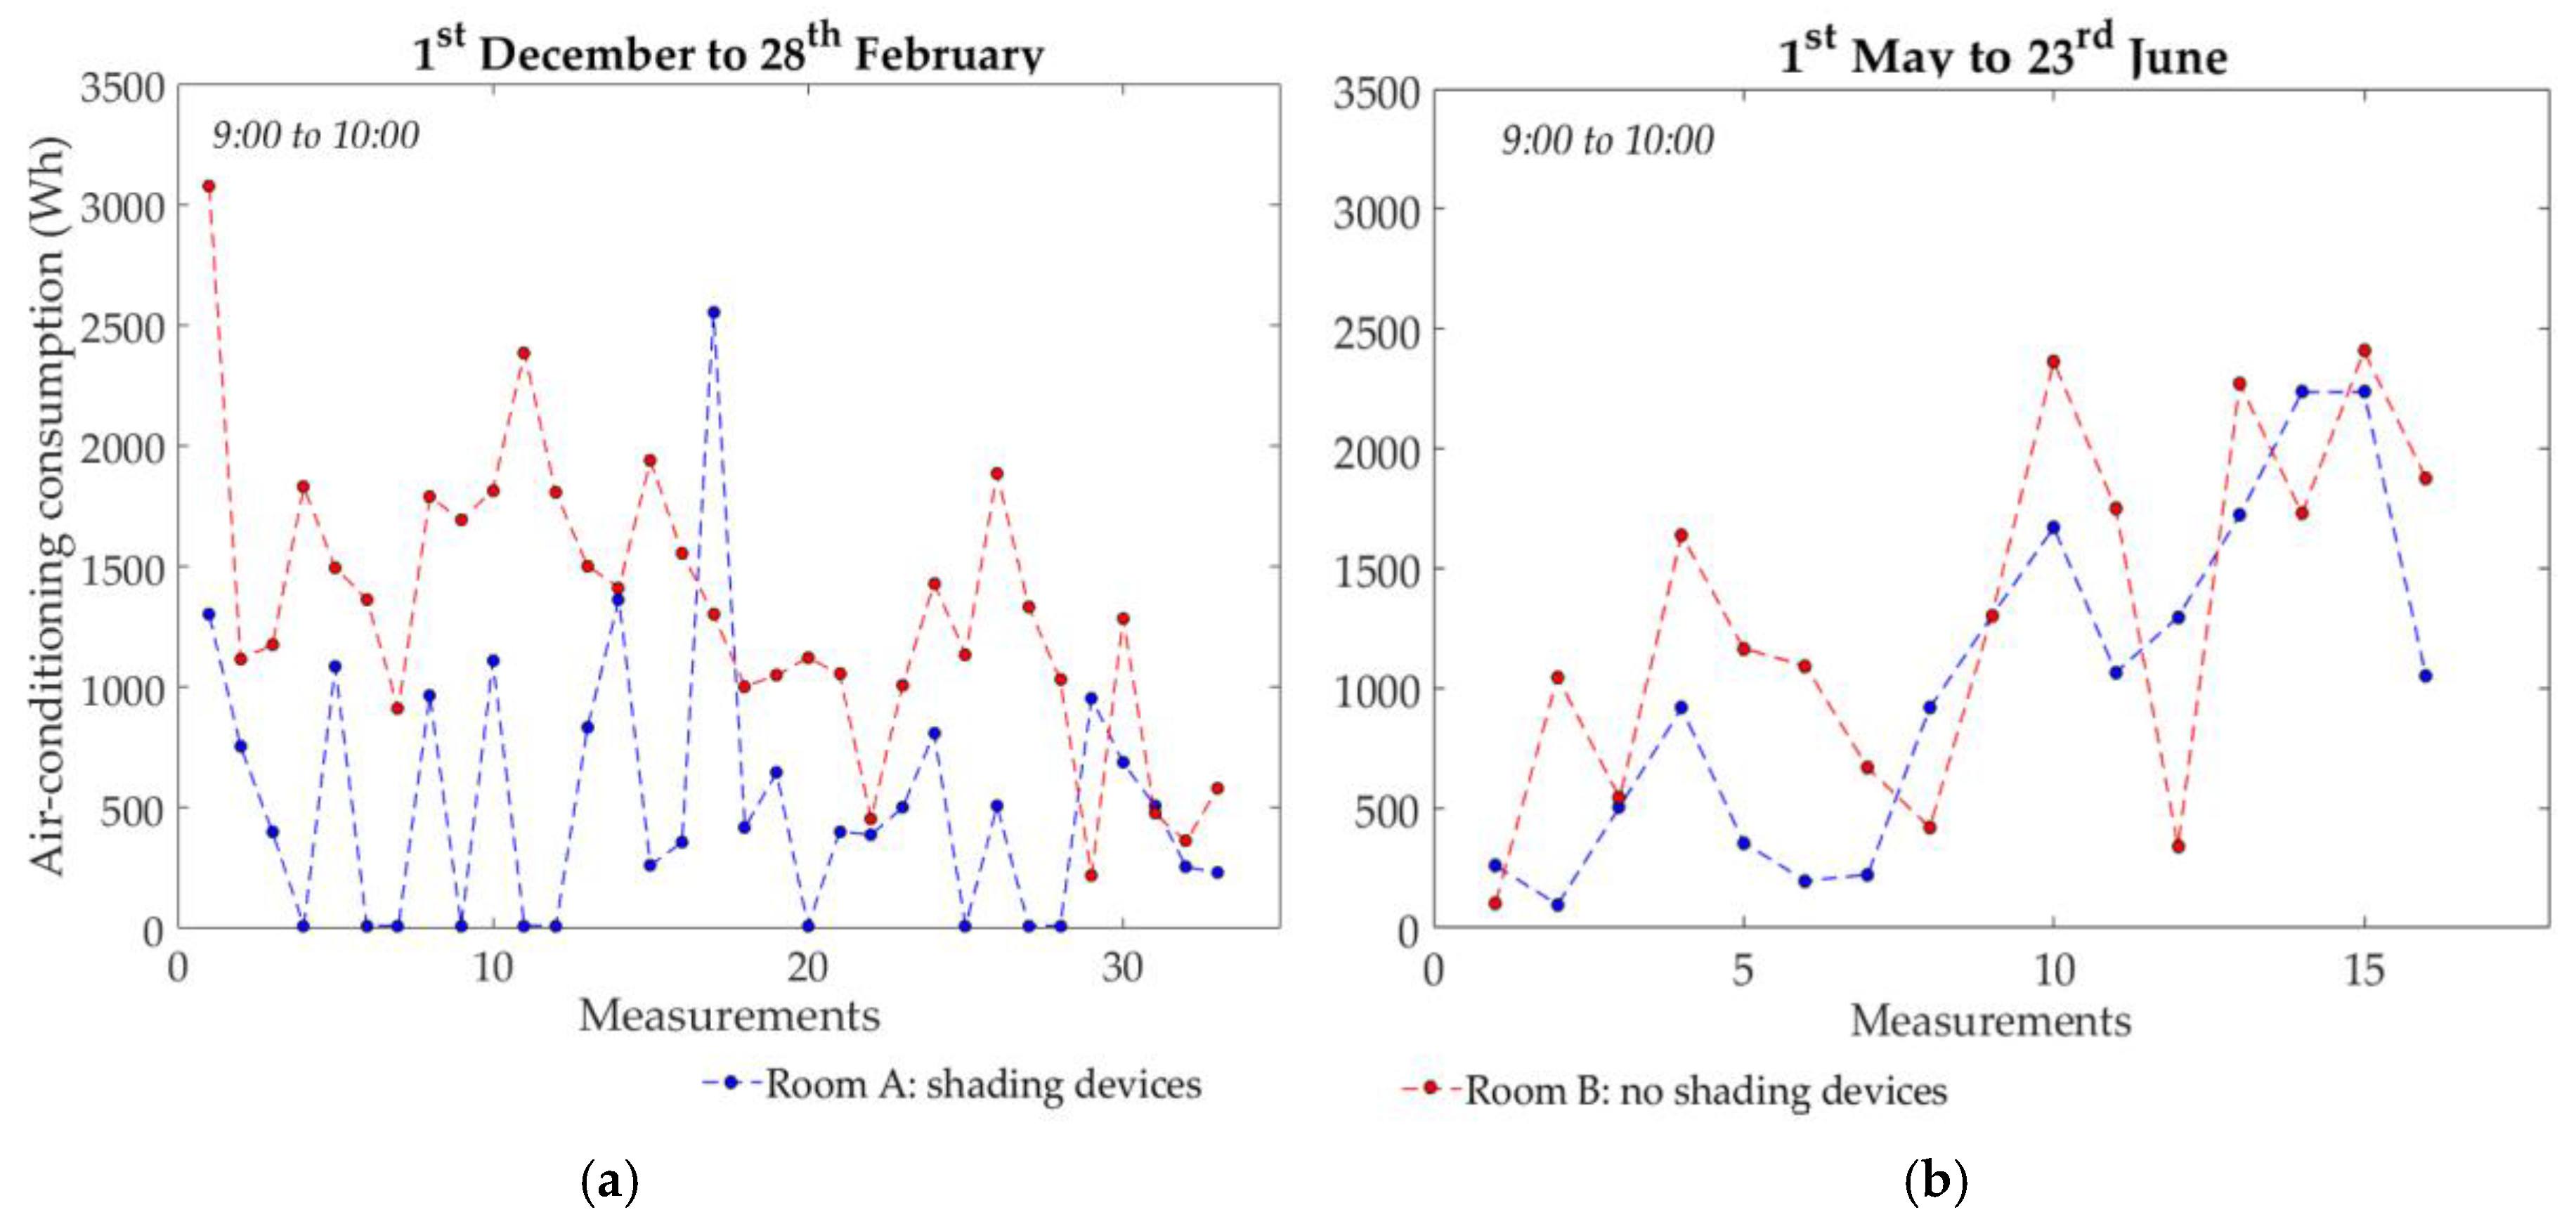
Figure 5 represents cumulative annual electric consumptions when this system was on simultaneously in both classrooms, in winter (
Figure 4a) and summer (
Figure 4b). The horizontal axis represents different measurements recorded in the 9:00 to 10:00 intervals on several nonconsecutive days; while values in the vertical axis correspond to cumulative air conditioning electric consumption recorded simultaneously in both rooms at this measurement time. Mid-season is not included in this figure as no air conditioning consumption was registered during this period.
Overall, these figures show that the average cumulative consumption was higher in the classroom with no shading devices (room B) than in the classroom with egg-crate devices (room A).
These mean cumulative consumption values of the air conditioning system for winter and summer are shown in
Table 8 along with other individual variables: average blind aperture levels and outdoor temperatures recorded during the hour analysed, as well as average indoor operative temperatures registered in the hour prior to the activation of the air conditioning system.
This table shows that cumulative electrical consumption was generally higher in the classroom with no egg-crate devices (room B): approximately 70% and 20% higher than in the classroom with shading devices (room A) in winter and summer, respectively. In winter, with average outdoor temperatures slightly below 8 °C, the operative temperature inside the classroom with no shading devices (room B) was 0.88 °C higher than in the classroom with solar protection (room A) in the hour prior to measurement (from 8:00 to 9:00, when the air conditioning system was off). In summer, with average outdoor temperatures close to 31 °C, indoor temperatures were 0.3 °C higher in the classroom with egg-crate devices (room A) than in room B. In contrast, average blind aperture level was clearly higher in the classroom with shading devices (room A) both in the winter and summer periods.
3.2.2. Analysis of Lighting Consumption
This section analyses on-site measurements when artificial lighting consumption was recorded simultaneously in both classrooms in winter (
Figure 6a), mid-season (
Figure 6b), and summer (
Figure 6c). Once again, the horizontal axis represents measurements that are nonconsecutive in time, while maintaining data recorded simultaneously in the vertical axis (lighting electric consumption).
As shown in the above figures, lighting cumulative consumption was lower in the classroom with solar protection (room A). This was probably due to the blind aperture levels, which were usually higher than in the classroom with no egg-crate devices (room B). However, when blind aperture levels in mid-season were similar in both classrooms, lighting consumption was significantly higher in the classroom with no shading devices (room B).
According to the data in
Table 9, in winter and mid-season, average cumulative lighting consumption in the classroom with egg-crate devices (room A) was approximately 43 to 48% lower than in the classroom with no solar protection (room B), with a difference of only 3% in lighting consumption in summer in both classrooms. When assessing the blinds, it should be taken into account that although the average aperture level was practically the same in both classrooms in mid-season, the average aperture level of the blinds was significantly higher in the classroom with shading devices (room A) in both winter and summer.
3.2.3. Analysis of Indoor Operative Temperatures, Illuminance, and Solar Radiation Levels
The figures below show the daily evolution of indoor operative temperatures (°C), natural illuminance (lux), and solar radiation levels (W/m2) for a representative unoccupied day in mid-season (18 April 2018). This day corresponds to a free-running (air conditioning OFF) period, with blinds fully open and a maximum outdoor temperature of 32.8 °C. The natural illuminance levels used in this analysis were recorded from a representative point at the centre of the classrooms.
Figure 7a shows very similar indoor operative temperatures in both classrooms between 0:00 and 9:00, with minimum values around 19 °C. The maximum temperature difference between classrooms was recorded at 16:00, when temperatures were 0.9 °C higher in classroom B (without shading devices). The maximum indoor temperature measured was 20.8 °C in the classroom with shading devices (room A) and 21.3 °C in the classroom with no solar protection (room B).
The maximum value for natural illuminance recorded (
Figure 7b) was 720 lux in the classroom with shading devices, 35 lux lower than the value simultaneously recorded in the classroom with no egg-crate protection (room B). The maximum difference in natural illuminance between the classrooms, recorded at 15:00, was 130 lux higher in the classroom with shading devices (room A). This is due to the fact that the materials used in the solar protection design acted as a visible radiation diffusor, promoting higher and more consistent indoor illuminance levels and enhancing reflections in the classroom.
Figure 7c shows solar radiation levels recorded behind the egg-crate device (room A) compared with the solar radiation that reached the façade with no obstacles (room B). Maximum solar radiation level was reached at 14:00, with 200 W/m
2 in the classroom with shading devices (room A), in contrast to the 540 W/m
2 value recorded in the classroom without shading devices. The daily reduction in solar radiation achieved with the egg-crate device designed was 58.6% and led to the difference in indoor temperatures observed in the classrooms.
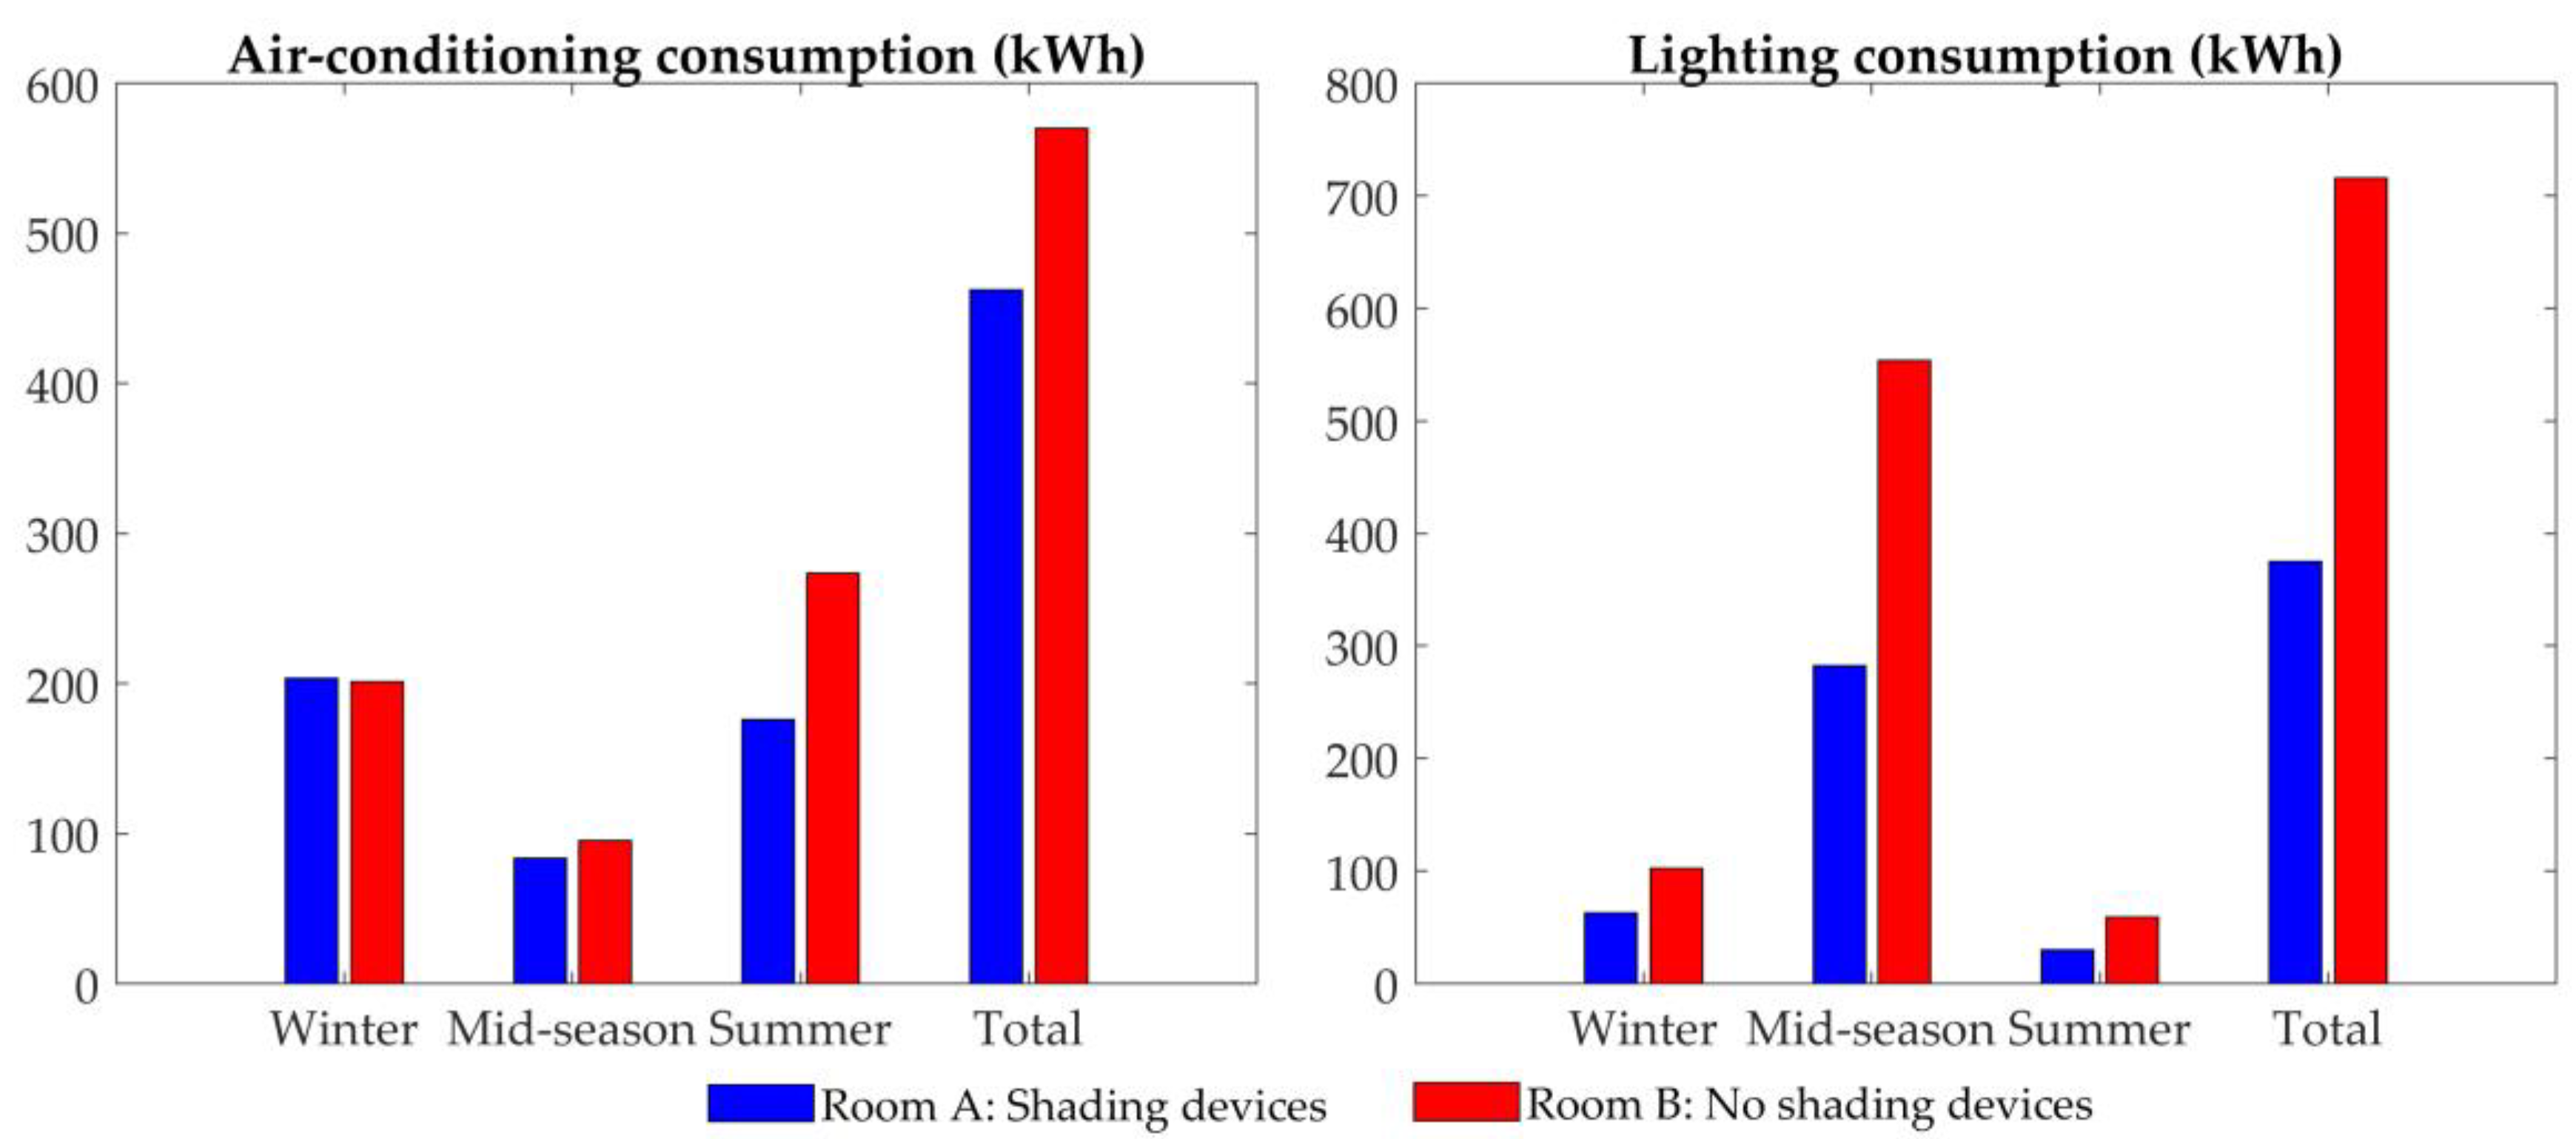
3.3. Analysis of Annual Air Conditioning and Lighting Consumption
As
Figure 8 and
Table 10 show, average annual cumulative consumption from the air conditioning system was around 19% higher in the classroom without egg-crate devices (room B), when equal conditions were considered (both classrooms simultaneously occupied and air-conditioned). This corresponds to an annual average difference of about 110 kWh when compared with the classroom with egg-crate devices (room A).
Similarly, average annual cumulative consumption from the lighting system was approximately 340 kWh lower in the classroom with shading devices (room A), meaning that consumption was around 47% higher in the classroom with no solar protection (room B). This was mostly due to the fact that the annual average blind aperture level was 27% in the classroom with shading devices (room A), compared with 8.3% recorded in the classroom with no solar protection (room B). Thus, total cumulative consumption (air conditioning and artificial lighting) was approximately 35% higher in the classroom with no egg-crate devices (room B). Electric consumption was therefore approximately 450 kWh/year higher in the classroom without shading devices (room B).
4. Conclusions
This paper evaluated an egg-crate shading device installed in a school in a Mediterranean area in southern Spain, analysing its impact on indoor operative temperatures (°C), natural illuminance (lux), and solar radiation levels (W/m2), as well as the electric consumption (kWh) of the air conditioning and lighting systems during a typical mid-season day. Two classrooms were monitored simultaneously in real use patterns to compare the real efficiency of the device under the same outdoor conditions. Three seasonal periods (winter, summer and mid-season) and total annual values were considered.
The main conclusions of this research can therefore be summarised as follows.
The egg-crate shading device reduced annual electric consumption of the air conditioning system by almost 20% compared with the classroom with no solar protection. The efficiency of the device was lower in winter, while heating consumption was fairly similar in both classrooms, given the low influence of solar radiation and the high internal loads (occupants).
Annual electric consumption of lighting in the classroom with solar protection devices was reduced by almost 50%, mostly through the intervention of users, who tended to close the blinds in the classroom without shading devices to avoid glare and direct solar radiation. This in turn gave rise to an increased use of lighting systems.
Due to the above, total annual electric savings (air conditioning and lighting systems) were close to 35% in comparison with the room with no solar protection.
The influence of users has proved to be a decisive factor which introduces uncertainties into the results. Accordingly, there is a need for further in-depth and selective analysis to limit and control these uncertainties in order to ensure the validity of the measurements.
In this regard, although egg-crate protection increased indoor illuminance by diffusing visible radiation and improving consistency in illuminance (without providing shade to the classroom), users generally ensured that blind aperture levels remained high.
Similarly, the air conditioning system (cool mode) was switched ON more frequently in the classroom with no solar protection in summer, at low blind aperture levels. In winter, in the classroom with solar protection devices, the air conditioning system (heat mode) was usually turned ON with low solar radiation levels and intermediate blind aperture levels.
Considering a typical mid-season day with clear sky conditions, no occupation, blinds fully open, and outdoor temperatures around 30 °C (with no user influence), there was a reduction of approximately 59% in solar radiation levels in the room with egg-crate devices. This resulted in indoor temperatures approximately 1 °C lower and indoor illuminance levels up to 130 lux higher than with no shading devices. While the reduction in solar radiation was especially significant from 10:00 to 17:00 h in the classroom with egg-crate devices, illuminance levels were noticeably higher from 12:00 to 16:00.
In conclusion, the egg-crate shading device installed outside the windows resulted in significant energy savings, with fair illuminance levels, and is a low-cost solution which can be quickly assembled, making it suitable for the energy retrofitting of educational buildings in a Mediterranean climate. However, further research is needed to properly analyse the influence of the egg-crate device over indoor environment quality and energy variables, especially as regards natural illuminance, operative temperatures and solar radiation levels.


