Abstract
Understanding the relationships among CO2 emissions, energy consumption, and economic growth helps nations to develop energy sources and formulate energy policies in order to enhance sustainable development. The present research is aimed at developing a novel efficient model for analyzing the relationships amongst the three aforementioned indicators in G20 countries using an adaptive neuro-fuzzy inference system (ANFIS) model in the period from 1962 to 2016. In this regard, the ANFIS model has been used with prediction models using real data to predict CO2 emissions based on two important input indicators, energy consumption and economic growth. This study made use of the fuzzy rules through ANFIS to generalize the relationships of the input and output indicators in order to make a prediction of CO2 emissions. The experimental findings on a real-world dataset of World Development Indicators (WDI) revealed that the proposed model efficiently predicted the CO2 emissions based on energy consumption and economic growth. The direction of the interrelationship is highly important from the economic and energy policy-making perspectives for this international forum, as G20 countries are primarily focused on the governance of the global economy.
1. Introduction
Over the past forty years, the world economy has more than tripled in size. Although economic growth has enhanced the living standards in most countries, it has led to a reduction in natural resources and an increase in greenhouse gas (GHG) emissions. Some forecasts suggest that by accelerating the growth of population and gross domestic product (GDP), by 2050, we will be faced with the major challenge of not having enough resources, which, in turn, will undermine further economic development, especially in poor regions. While the GDPs of leading economies continue to rise, economic growth in developing regions is even higher, with an average growth of 5.9% or 3.6% of per capita growth in low-income countries, and 1.3% total or 0.8% per capita growth in high-income countries such as G20 countries.
In addition, energy usage is expected to grow by 80% by 2050, while the reliance on fossil fuels is not expected to change from the current (approximately 85%) proportion. Serious environmental consequences are likely to occur; GHG emissions are expected to increase by 50%, and concentrations of GHGs of almost 695 parts per million are projected by 2050. The dependence on fossil fuels in energy production has led to discussions about the sustainability of the energy currently consumed in numerous countries. One subject that has been heavily discussed is how to use alternative energy sources to lessen the environmental impacts of CO2 emissions, and to improve the sustainability of energy consumption in countries with strong energy dependence, hence contributing to economic growth. Providing a deep insight into the relationships among energy consumption, CO2 emissions, and economic growth can help countries to develop the available energy sources and formulate the energy policies to enhance sustainable development and its sources. In recent years, various studies have attempted to determine the relationship between economic growth and energy consumption [1]. Despite the need for a new model for predicting CO2 emissions through the neural network and fuzzy sets theory, and to find the relationship between CO2 emissions, economic growth, and energy consumption, few researchers have focused on these relationships.
The adaptive neuro-fuzzy inference system (ANFIS) approach focuses on the integration of fuzzy logic and neural networks. This approach was proposed for the first time by [2]. The fundamental idea behind the ANFIS approach is the integration of the human-like reasoning style of fuzzy models through the connectionist and learning structures of neural network systems [3]. Due to the adaptability and fuzzy control interpolation, the ANFIS approach is one of the best trade-offs between neural networks and fuzzy logic systems which provides smoothness, flexibility, and power with approximations ability for exploring interpretable IF-THEN [3]. The ANFIS method provides the linguistic representation of the fuzzy logic through the ability of learning of Artificial Neural Network (ANN) method (Kurtulus and Razack, 2010). Another key advantage of the ANFIS model is that it can automatically produce fuzzy rules out of real-world data in a way whereby they may be used as input and output parameters with no human intervention. Fuzzy rules will help us to better interpret the results of the relationship of inputs and outputs. This has been recognized as a complex problem with non-linear relationships between the variables. In addition, the ANFIS model has enough flexibility to work on numerous input and output attributes in a way that makes it applicable to the estimation of CO2 emissions. ANFIS is a prediction model based on discovering the fuzzy rules through the dataset and created the links between input and output indicators. To construct the ANFIS models, three types of data are used in ANFIS: training, checking, and testing data sets. In the first step, ANFIS uses the training set to construct the model. In the next steps, it uses the testing and checking sets for the generalization and validation of the models. While ANFIS has been effectively used for choosing the significant practices/indicators from diverse input practices/indicators in various application domains, few previous studies have used this approach for predicting of CO2 emissions.
The literature has emphasized the significant role of ANFIS in predicting different application areas such as forecasting the risks in the stock market, Michell [4], predictions of solar radiation, Morshedizadeh, et al. [5], and wind speed prediction, Asghar and Liu [6]. But, there are few previous studies which have employed the ANFIS method for predicting CO2 emissions based on two important indicators including economic growth and energy consumption. Additionally, Khoshnevisan, et al. [7] claimed that the ANFIS model is a powerful technique for predicting the greenhouse effect. Khajeh, et al. [8] suggested that because of the capability of the ANFIS model for predicting greenhouse emissions, future studies would use this model for solving their problems. Entchev and Yang [9] indicated that the ANFIS model has the unique advantage for examining the relationship between input and output indicators, such as greenhouse emissions, and is capable of making an efficient estimation of CO2 emissions. However, this paper answers the question: can economic growth and energy consumption play the main role in promoting CO2 emissions? Although the relationships that exist between the three factors of energy consumption, CO2 emissions, and economic growth have been well studied, efforts to organize the application of an ANFIS model in predicting the CO2 emissions based on two indicators to contribute to the body of knowledge appear to be very limited. Particularly, there is no study in the current literature regarding the application an ANFIS model in the prediction of CO2 emissions using economic growth and energy consumption. Therefore, for the first time, this study takes advantages of the ANFIS model, proposing a method to evaluate the interrelationships and influence level of economic growth and energy consumption in the prediction of the CO2 emissions in G20 countries. The present research aims at using the ANFIS model for the following objectives:
- To investigate the interrelationship of energy consumption, CO2, and economic growth using real data between 1962 and 2016 in G20 countries;
- To employ the fuzzy rule-base to generalize the relationships of the input indicators and output indicators to make the prediction of the CO2 emissions.
- To develop a model for analyzing the interrelationship between energy consumption, CO2 emissions, and economic growth in G20 countries.
- To predict the CO2 emissions based on energy consumption and economic growth using real data between 1962 and 2016 in G20 countries.
According to the above objectives, this technique will help users to effectively predict the CO2 emissions from real-world datasets that have the non-linear data structures. This paper would be efficiently extended and implemented to consider for other indicators affecting CO2 emissions.
The remainder of this study is organized as follows. Section 2 provides details of the related work regarding the application of the ANFIS model. Section 3 presents the research method. Section 4 presents the results and a discussion of this study. Finally, the conclusion, limitations, and recommendations for future studies are presented in Section 5.
2. Related Works
Several studies conducted recently in this field are mainly centered on finding the link between energy consumption, CO2, and economic growth [10,11,12,13,14]. Using parametric specifications, Holtz-Eakin and Selden [15] attempted to explore the relationships between GDP per capita and per capita CO2 in case of totally 130 countries between 1951 and 1986. They reported the presence of inverted U-shaped and N-shaped curves between the two factors, economic growth and CO2. Glasure and Lee [16] attempted to find how energy consumption and economic growth affect each other in South Korea and Singapore. They made use of error-correction models, and their findings showed a bi-directional causality between economic growth and energy consumption. De Bruyn, et al. [17] applied a variety of approaches to a commonly-referred polynomial specification of an Environmental Kuznets Curve (EKC) by constructing a dynamic model that incorporated three factors: energy intensity, structural and technological change, and the GDP level. They used three emission indicators, i.e., CO2, SO2, and NOx, in four Organization for Economic Co-operation and Development (OECD) countries, namely West Germany, USA, Netherlands, and Britain, together with the annual data collected from a period of 34 years (1960–1993). Their empirical results confirmed that there was a direct positive effect between economic growth and emissions in all cases excluding the SO2 emissions. On the other hand, a negative influence was found from technological and structural changes in emissions. Taskin and Zaim [18] took the advantage of nonparametric production frontier techniques in order to examine the EKC hypothesis. In their study, the environmental efficiency index was employed as a dependent variable according to the cross-sectional data for CO2, while the GDP per capita was taken into consideration as an independent variable for the time horizon from 1975 to 1990. Their analysis was carried out in the case of 52 countries and an inverted U-shaped was found in the countries have more than $5000 GDP per capita. The relationships between economic growth and CO2 were also studied by Bengochea-Morancho, et al. [19]; results indicated that CO2 in countries with above-average incomes was more than that of those with below-average income. Friedl and Getzner [20] examined the relationship between economic development (using GDP growth as a proxy) and CO2 in Austria from 1960 to 1999, and showed that the link between economic growth and CO2 was in an “N”-shaped form. Yoo [21] also studied the relationships between economic growth and energy consumption; however, he reported the bidirectional causality between the variables for the Korean economy. Azomahou, et al. [22] also attempted to examine the relationships between CO2 emissions and GDP (as a proxy for economic development) for the period of 1960 to 1996 using data gathered from 100 countries using the pool-ability test developed by Baltagi, et al. [23]. Findings of their study confirmed an upward sloping relationship between CO2 emissions and per capita GDP, which indicated a positive relationship between CO2 emissions and economic development. Lee, et al. [24] used a panel of 22 OECD countries corresponding to the years between 1960 and 2001, for the purpose of examining how factors such as energy consumption, economic growth, and capital stock were related to each other. They applied an aggregate production function. Their empirical results revealed a bidirectional causal relationship between energy consumption and economic growth. Apergis and Payne [25] focused on the relationships between economic growth and coal consumption between 1980 and 2005. They selected a panel of 25 OECD countries applied with a dynamic error correction model. They confirmed the presence of a bidirectional causality relationship among all indicators. In South Africa, Menyah and Wolde-Rufael [26] carried out a research to explore the long-run and causal relationships that existed amongst energy consumption, pollutant emissions, and economic growth; they applied the bounds testing approach to the cointegration process. Their results demonstrated the unidirectional causality that was running from CO2 emissions towards the economic growth, from the energy consumption towards the CO2 emissions, and from the energy consumption towards the economic growth, all with no feedback. Kahsai, et al. [27] studied the relationship between energy consumption and economic growth in African countries. They used a panel of 18 COMESA countries and reported the long-term bidirectional causality between the variables. Akpan and Akpan [28] investigated the long-term and the causal connections among electricity consumption, CO2 emissions, and economic growth in Nigeria. They found the presence of a long-term positive relationship between economic growth and CO2 emissions. Saboori and Sulaiman [29] attempted to find out both long- and short-term relationships among the amount of energy consumption, CO2 emissions, and economic growth between 1980 and 2009. Between economic growth and energy consumption in the short-term, they reported a neutral relationship, while in the long-term, not only the energy consumption was shown to be effective on CO2 emissions, but also the economic growth Granger was found to be effective on the amount of energy consumption. Shahbaz, et al. [30] examined the relationship between CO2 emissions, industrialization, and electricity consumption between 1975 and 2010. Their results reported that the presence of cointegration and electricity consumption contributed to CO2 emissions. Shahbaz, et al. [31] tested the possible relationships amongst energy intensity, CO2 emissions, and economic growth from 1980 to 2012. As indicated by their findings, the energy intensity augmented the volume of CO2 emissions. In addition, a bi-directional causality relationship was explored between economic growth and CO2 emissions. Collecting data related to the years between 1971 and 2010, Esso and Keho [32] investigated the causal and long-term relationship that could exist among the amount of energy consumption, CO2 emissions, and GDP. In Nigeria, they found a feedback effect between economic growth and the volume of CO2 emissions. Chen, et al. [33] investigated the interregional differences in China in terms of the CO2 emissions, and found that because of the governmental policies, the interregional economic and emissions differed. Alam, et al. [34] carried out a research to examine the impacts of three factors (population growth, energy consumption, and income) on the CO2 emissions. They reported a rise in the volume of CO2 emissions due to a rise in income and energy consumption. Chiu [35] explored a relationship among energy, CO2 emissions, real income, and investment all corresponding to years between 1971 and 2010. The results indicated that a reduction in energy usage enhanced the energy efficiency and improved the clean energy usage, which could successfully reduce CO2 emissions. Chang and Shieh [11] analyzed the relationship between energy efficiency and GDP growth of Baltic Sea Region countries and defined the positive impact of energy efficiency enhancement on the GDP growth. Chen, et al. [36] investigated the economic growth of the most important countries playing a key role in global coal consumption. They also evaluated the influence of economic growth on the emission of GHG.
A survey of previous literature showed that the relationship between energy consumption, economic growth, and CO2 emissions is extensive; therefore, based on these relationships, it was concluded that the previously-published papers are grouped into three categories, i.e., those describing the relationship between CO2 emission and economic growth, the relationship between energy consumption and economic growth and, the relationship between CO2 emission, economic growth, energy consumption. Several previous studies have demonstrated that the relationships between these indicators involving several geographic places employ a broad range of techniques and tools. Some studies have focused on a particular country while others relied on a specific region with a group of countries. In addition, results of this section found that these three indicators used different measurements; for example, economic growth has been measured based on GDP growth rate or GDP per capita through different methods, regions and countries, time periods. The results of this section found that energy consumption contributed to CO2 emission in different regions and countries. In addition, some of the previous studies confirmed that energy consumption is a key indicator of CO2 emissions. Moreover, the overall results indicated that there were the strong links between energy consumption and economic growth. Furthermore, some studies claimed that CO2 emissions are a cause of economic growth. However, based on the above discussions, it was found that the previous studies have found different results through the study different countries and regions, and the use of techniques, tools, and indicators; consequently, the current study for analyzing the relationships between CO2 emissions, economic growth, and energy consumption has been used the soft computing model which called ANFIS in the G20 countries.
3. Research Method
Focusing on the prediction of CO2 emissions, this study uses ANFIS, which is a robust technique used widely to model complex problems Chong, et al. [37]. The most important disadvantage of adopting solely using the fuzzy logic method is the absence of the facilities required to learn from the data. As a result, if the fuzzy logic and neural network are combined together (which makes Neuro-Fuzzy), the advantages of both approaches can be fully exploited. Therefore, the present study makes use of ANFIS and forms the prediction models using the data gathered for the prediction of CO2 emissions. The adoption of such technique helped us to apply Least-Squares Estimate (LSE) to the hybrid learning algorithm in order that the consequential parameters could be identified. The five layers of ANFIS have been completely described in the literature.
ANFIS is a model for predictions based on discovering the fuzzy rules through the dataset and created the links between input and output indicators. To construct ANFIS models, three types of data are used: training, checking, and testing. In the first step, ANFIS uses the training set to construct the model. In the next steps, it uses the test and checking sets for the generalization and validation of the models. Jang [2] introduced the ANFIS model for the first time for building prediction models based on real data. There are five main layers for building the prediction of the model. Figure 1 shows these five main layers. ANFIS works like a Takagi-Sugeno-Kang fuzzy-rule-based system. This method learns its parameters by learning from the input and output data. The general framework of ANFIS is presented in Figure 1. For example, in Figure 1, ANFIS uses several layers to train the data to predict the output. A Takagi-Sugeno-Kang fuzzy inferences’ system with one output f, two inputs x and y and, two fuzzy “IF-THEN” rules is shown in Equation (1). In this equation, the fuzzy sets for input premise variables x and y are defined, respectively, by A1, A2 and B1, B2. Also, the output (consequent) variables are defined by the p1, q1, r1 and p2, q2, r2 parameters.
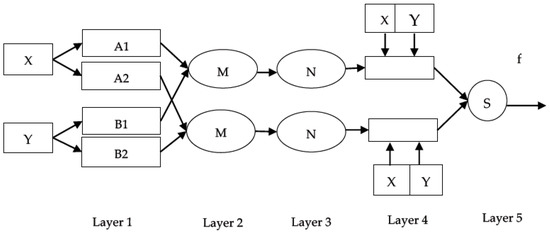
Figure 1.
General framework of adaptive neuro-fuzzy inference system (ANFIS).
In the first hidden layer, the fuzzification of inputs is performed. In this layer, we can use any type of membership function (MF) for the fuzzification task. There are several types of MFs such as z-shape, Gaussian, triangular, sigmoid, trapezoidal, and s-shape. The outputs of this layer are fuzzy membership grades of inputs; of two inputs, for example x and y, are given by as:
where , indicate MFs.
In the second layer, which is the IF part of the fuzzy rules, a fixed number of nodes, labelled with M, are considered to calculate the outputs of this layer. The outputs are obtained by multiplying the input signals. In this layer, the outputs are defined as:
Where s of each type indicates the firing strength of the fuzzy rules.
In the third layer, by considering N nodes, the strengths of the fuzzy rules (normalized firing strengths) in the second layer are normalized by Equation (3).
In the fourth layer, we have adaptive nodes (consequent parameters) to output, with a node function defined as:
where is the parameter of this node and is the output of Layer 3.
In the fifth layer, the overall output is calculated by the summation of all incoming signals. This layer includes a non-adaptive node, and the overall output is calculated by Equation (5).
The fundamental section of the system contains the inference engine and the fuzzy rule-base. The system of the fuzzy rule base covers the know-how and knowledge regarding the particular area problems, provided as a set of rules in fuzzy IF-THEN. This section is the inference engine that interprets the rule base by employing the MFs of outputs and inputs fuzzy operators, defuzzification models, and implication operators. The rule-based inference system determines the mapping from the input to output of the fuzzy sets. The defuzzification and fuzzification procedures are employed for offering the possibility of managing a system based on two kinds of crisp inputs and outputs. In the Fuzzification step, MFs are applied to obtain the fuzzy inputs and outputs from crisp inputs/outputs. In the defuzzification, MFs are used for achieving the crisp outputs from fuzzy inputs. For logical relationships among fuzzy inputs and fuzzy output, this study used the rule base through interpreting the rules using fuzzy operators and implication. In this study, the fuzzy rule-based system was also developed in four subsequent steps: input fuzzification, generation of the MFs, extraction of the output defuzzification, and fuzzy rules. Through the fuzzification stage, Gaussian MFs were applied to determine the degree of inputs belonging to each proper fuzzy set. On the other hand, through the defuzzification stage, we employed the Centroid of Area (COA) (Hellendoorn and Thomas [38], which returns the center of the area under the curve. The architecture of ANFIS is presented in Figure 2.
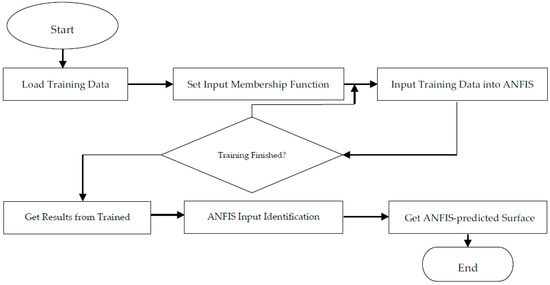
Figure 2.
The ANFIS architecture.
In ANFIS for predicting outputs, there is some measure such as mean absolute error (MAE) measure. Equation (6) is used for calculating of MAE of the errors of prediction models.
In this equation, actual (o) is actual output, prediction (o) is the predicted outputs and is the number of observations.
The present research is mainly aimed at forecasting the CO2 emissions by means of two input parameters, i.e., energy consumption and economic growth in G20 countries based on the data recorded from 1962 to 2016. For this purpose, we made the prediction models through the fuzzy rules discovered by means of ANFIS approach from the real dataset. Also, we made the link between output and input indicators (Y = f (X1, X2)) in a way to have a prediction with a high accuracy regarding the CO2 emissions. Here, X1, X2 signify the input parameters; more specifically, (X1) denotes GDP and (X2) denotes the energy consumption, whereas Y represents the output parameter, that is, CO2 emissions. Three sets of data (i.e., training, checking, and testing) were applied to ANFIS in order to construct the prediction models.
Data
Sources Historical data from the period from 1962 to 2016 are used to generate the prediction models for CO2 emissions based on two important indicators, i.e., energy consumption and economic growth for G20 countries. The data for CO2 emissions, as well as economic growth and energy consumption, were collected from the World Development Indicators (WDI) online database. In this study, data for CO2 emissions is calculated based on metric tons per capita and produced during consumption of liquid, solid, gas flaring, and gas fuels. The economic data is calculated based on annual GDP per capita growth and extracted based on the constant of local currency based on U.S dollars. The data for energy consumption were collected from WDI online database. Energy consumption data is calculated based on kg of oil equivalent per capita. Energy consumption is determined based on the use of main energy before transformation to other end-use fuels, which is equal to indigenous production plus imports and stock changes, minus exports and fuels supplied to ships and aircraft engaged in international transport.
4. Results and Discussion
In Table 1, we show the ranges of Gaussian Membership Functions (MFs) made through the ANFIS approach in the United States context. For the fuzzification step, we took into consideration three kinds of the linguistic characteristics for inputs, namely “{Low}”, “{Moderate}”, and “{High}”. Table 1 presents the generated Gaussian MF of ANFIS for “GDP (X1)” and “energy consumption (X2)”. For “{Low}”, “{Moderate}” and “{High}”, the ranges of X1 are measured as [1.156 × 10⁴, 3007], [1.156 × 10⁴, 3.024 × 10⁴], and [1.156 × 10⁴, 5.747 × 10⁴], respectively. In addition, for {Low}, {Moderate}, and {High}, the ranges of X2 are measured [1792, 0.1056], [1791, 4219], and [1792, 8438], respectively.

Table 1.
Membership functions (MFs) information for the first cluster in predicting CO2 for the United States. GDP: gross domestic product.
For analysis in this study, the relationship of the input indicators and output indicator are provided based on surface plots for each country of G20 countries. The results of ANFIS regarding the surface plots are shown in Figure 3. The surface plots were determined through a continuous function of the economic growth and energy consumption versus CO2 emissions. The surface plots are produced by means of the fuzzy rules extracted from numeric values of CO2 emissions and economic growth and energy consumption of the experimental dataset. Furthermore, the surface plots explain how the two indicators, energy consumption and economic growth, affected the CO2 emissions.
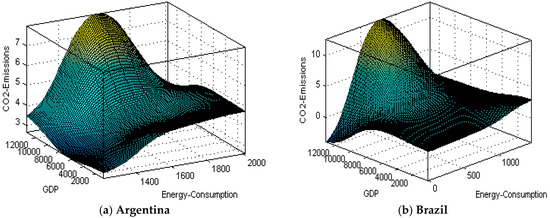
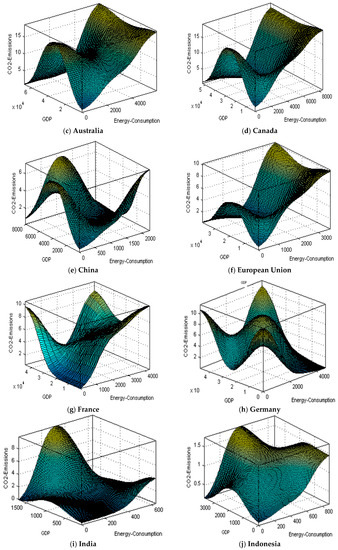
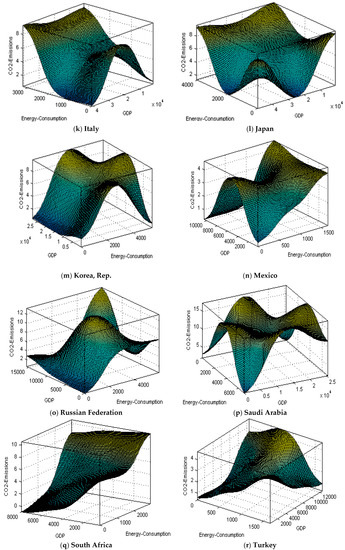
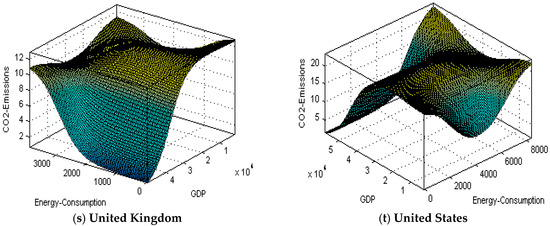
Figure 3.
CO2 Emissions Prediction based on Economic growth and Energy Consumption for G20 Countries.
For instance, Figure 3a presented a CO2 emissions prediction based on fuzzy rules system in Argentina based on two indicators. According to the result of Figure 3, it can be concluded that CO2 emissions increased from 2.5 tons per capita to 6 tones per capita by increasing economic growth from 8000 per capita growth based on U.S dollars to 12,000 U.S dollars, and, at the same time, energy consumption increased from 1400 kg of oil equivalent per capita to 1800 kg per capita. Remember that in the plots, the colors illustrate the fuzzy inference system (FIS) behaviors based on the fuzzy rules, and input and output indicators. The results of the fuzzy rules system for CO2 emissions prediction of other countries are shown in Figure 3a–t.
This study used the fuzzy rule viewer to generate the CO2 emissions prediction models. The fuzzy rule viewer has a capability of showing CO2 emissions throughout the deviations that may occur to the values of economic growth and energy consumption. The rule viewer is an environment-based display of the FIS. It is used as a diagnostic test to find which rules are active and how individual MF shapes influence the results. The rule viewer is a roadmap for the whole fuzzy inference process. The three plots across the top of the Figure 4 represents the antecedent and consequent of the first rule for the United States. Each rule is a row of plots, and each column is a variable. The rule numbers are displayed on the left of each row. From the fuzzy rule viewer screenshot in Figure 4, it is inferred that if energy consumption is 6.81 × 10³, and GDP is 4.34 × 10³, then CO2 emissions are 17.6. The rule viewer also shows how the shape of certain MFs influences the overall result. After rules are evaluated, crisp values are produced by defuzzification of the corresponding MF. From the results of Figure 4, it can be determined how the ANFIS can effectively predict CO2 emissions based on inputs values using nine fuzzy rules.
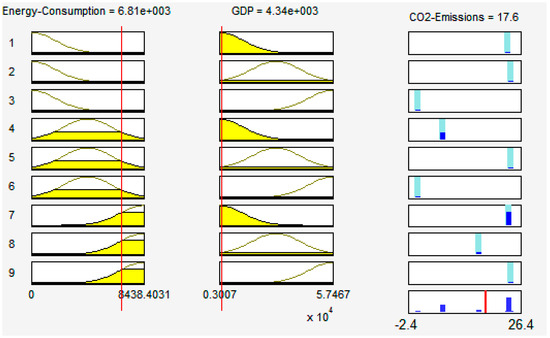
Figure 4.
CO2 Prediction based on Economic growth and energy consumption for the United States.
To evaluate the proposed model and examine the competency of the prediction models of ANFIS, the MAE measure was applied to the prediction of the outputs, i.e., CO2 emissions. The MAE measures the average magnitude of the errors in a set of predicts, without considering their direction. It measures the accuracy for continuous variables. The MAE is the average over the verification sample of the absolute values of the differences between the forecast and corresponding observation. The MAE is a linear score, which means that all the individual differences are weighted equally in the average. Accordingly, errors of the prediction models were computed using MAE, as shown in Equation (6). In addition, the results of MAE for all countries are presented in Figure 5.
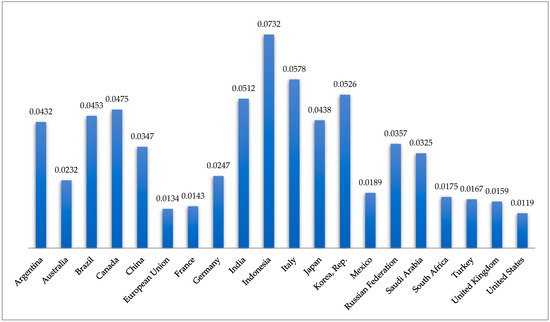
Figure 5.
Mean absolute error (MAE) results for ANFIS models.
5. Conclusions
This study developed an efficient approach to analyze the interrelationships between energy consumption, CO2 emissions, and economic growth of G20 countries using ANFIS model from 1962 to 2016. The ANFIS model was successfully developed to correlate two indicators using the available data for the purpose of predicting the CO2 emissions. For predicting of CO2 emissions, this study used two important indicators, i.e., energy consumption and economic growth.
The experimental results of this study found that the proposed model is capable of predicting CO2 emissions based on energy consumption and economic growth. The prediction models are established in MATLAB and results are attained. To formulate the prediction models, this study first used the fuzzy rules by means of the ANFIS from WDI online database. The next stage after formulating the prediction models generalized the interrelationships of inputs and output indicators to make an accurate prediction of CO2 emissions. To evaluate the proposed model and examine the competency of the prediction models of ANFIS, the MAE measure is used to predict the CO2 emissions as an output. The result of the fuzzy rules system revealed that by increasing economic growth and energy consumption in some countries, CO2 emissions increased. For example, in the case of Argentina, by increasing economic growth from 8000 per capita growth based on U.S dollars to 12,000 U.S dollars, CO2 emissions increased from 2.5 tons per capita to 6 tones per capita, and energy consumption increased from 1400 to 1800 per capita. The results of MEA showed that the average magnitude of the errors in a set of predicts in G20 countries was between 0.0119% and 0.0732%. However, the findings of MEA and fuzzy rules systems showed that ANFIS can be used efficiently for modeling and predicting CO2 emissions. It is believed that this model can be used to find many other indicators in environmental and energy areas. It is concluded that the ANFIS model is computationally intelligent and suitable to predict CO2 emissions based on various indicators.
This paper could be efficiently extended to consider for other indicators affecting CO2 emissions. In this study, to predict the CO2 emissions, we used two important indicators: energy consumption and economic growth. However, in the future studies, other indicators such as electricity consumption, renewable energy, population, financial investment, tourism economic, international tourism, energy intensity, household CO2 emissions, health expenditures, economic activity, road transport, income, oil consumption, coal consumption, trade openness, structural change, fuel mix, exports and institutional quality, technical efficiency, industrial structure, transportation infrastructure, internet usage, fossil fuels consumption, foreign trade, information communications technology, international trade, foreign trade ratio, fuel consumption, ecological variables, carbon taxation, employment ratio, urbanization, hydroelectricity consumption, environmental regulation, nuclear energy, urbanization, FDI, financial instability, internationalization, financial development, waste consumption and combustible, technological innovation, globalization, affluence, population, technology, population density, urban population, and carbon intensity could be also taken into consideration.
Moreover, the approach developed in this paper could be used to find a solution for different prediction problems in the renewable and non-renewable energy domains. The findings of this research were obtained using the classical ANFIS model, and for the prediction models, were established in the off-line setting. Additionally, the competency of the proposed model by a classical ANFIS model is limited by fixing the number of training cases. Therefore, there is a need to develop appropriate approaches to incremental learning in a way that takes newly-arriving data into account. As a result, we can say that, in future, researchers need to be more centered on proposing methods for ANFIS models with incremental learning in a way that minimizes the time of computation in large datasets.
Author Contributions
Conceptualization, A.M., Methodology, D.S. and M.N.; Writing-Original Draft Preparation, N.L., Writing-Review & Editing, D.A.A. and A.J.
Funding
This research was funded by Universiti Teknologi Malaysia (UTM), Flagship UTMSHINE grant PY/2017/02187.
Acknowledgments
The authors would like to thank the Universiti Teknologi Malaysia (UTM) for supporting and funding this research under the Flagship UTMSHINE grant (Ref. No: PY/2017/02187).
Conflicts of Interest
The authors declare no conflict of interest.
References
- Tian, G.; Chu, X.; Liu, Q. Saving forests through development? fuelwood consumption and the energy-ladder hypothesis in rural southern China. Transform. Bus. Econ. 2017, 16, 199–219. [Google Scholar]
- Jang, J.-S. ANFIS: Adaptive-network-based fuzzy inference system. IEEE Trans. Syst. Man Cybern. 1993, 23, 665–685. [Google Scholar] [CrossRef]
- Kar, S.; Das, S.; Ghosh, P.K. Applications of neuro fuzzy systems: A brief review and future outline. Appl. Soft Comput. 2014, 15, 243–259. [Google Scholar] [CrossRef]
- Michell, K. A stock market risk forecasting model through integration of switching regime, ANFIS and GARCH techniques. Appl. Soft Comput. 2018, 67, 106–116. [Google Scholar]
- Morshedizadeh, M.; Kordestani, M.; Carriveau, R.; Ting, D.S.K.; Saif, M. Application of imputation techniques and Adaptive Neuro-Fuzzy Inference System to predict wind turbine power production. Energy 2017, 138, 394–404. [Google Scholar] [CrossRef]
- Asghar, A.B.; Liu, X. Estimation of wind speed probability distribution and wind energy potential using adaptive neuro-fuzzy methodology. Neurocomputing 2018, 287, 58–67. [Google Scholar] [CrossRef]
- Khoshnevisan, B.; Rafiee, S.; Mousazadeh, H. Application of multi-layer adaptive neuro-fuzzy inference system for estimation of greenhouse strawberry yield. Measurement 2014, 47, 903–910. [Google Scholar] [CrossRef]
- Khajeh, A.; Modarress, H.; Rezaee, B. Application of adaptive neuro-fuzzy inference system for solubility prediction of carbon dioxide in polymers. Expert Syst. Appl. 2009, 36, 5728–5732. [Google Scholar] [CrossRef]
- Entchev, E.; Yang, L. Application of adaptive neuro-fuzzy inference system techniques and artificial neural networks to predict solid oxide fuel cell performance in residential microgeneration installation. J. Power Sour. 2007, 170, 122–129. [Google Scholar] [CrossRef]
- Balezentis, T.; Novickyte, L. Are Lithuanian family farms profitable and financially spalatino linotypeustainable? Evidence using dupont model, sustainable growth paradigm and index decomposition analysis. Transform. Bus. Econ. 2018, 17, 237–254. [Google Scholar]
- Chang, M.-C.; Shieh, H.-S. The relations between energy efficiency and GDP in the baltic sea region and non-baltic Sea region. Transform. Bus. Econ. 2017, 16, 235–247. [Google Scholar]
- Dirzyte, A.; Rakauskiene, O.G. Green consumption: The gap between attitudes and behaviours. Transform. Bus. Econ. 2016, 15, 523–538. [Google Scholar]
- Stjepcevic, J.; Siksnelyte, I. Corporate social responsibility in energy sector. Transform. Bus. Econ. 2017, 16, 21–33. [Google Scholar]
- Ma, D.; Ye, J.-M.; Zhang, Y.-R. Can firm exploit economic gainsfrom eco-innovation? An empirical investigationof listed companiesin China. Transform. Bus. Econ. 2018, 17, 33–53. [Google Scholar]
- Holtz-Eakin, D.; Selden, T.M. Stoking the fires? CO2 emissions and economic growth. J. Public Econ. 1995, 57, 85–101. [Google Scholar] [CrossRef]
- Glasure, Y.U.; Lee, A.-R. Cointegration, error-correction, and the relationship between GDP and energy: The case of South Korea and Singapore. Resour. Energy Econ 1998, 20, 17–25. [Google Scholar] [CrossRef]
- De Bruyn, S.M.; van den Bergh, J.C.; Opschoor, J.B. Economic growth and emissions: Reconsidering the empirical basis of environmental Kuznets curves. Ecol. Econ. 1998, 25, 161–175. [Google Scholar] [CrossRef]
- Taskin, F.; Zaim, O. Searching for a Kuznets curve in environmental efficiency using kernel estimation. Econ. Lett. 2000, 68, 217–223. [Google Scholar] [CrossRef]
- Bengochea-Morancho, A.; Higón-Tamarit, F.; Martínez-Zarzoso, I. Economic Growth and CO2 Emissions in the European Union. Environ. Resour. Econ. 2001, 19, 165–172. [Google Scholar] [CrossRef]
- Friedl, B.; Getzner, M. Determinants of CO2 emissions in a small open economy. Ecol. Econ. 2003, 45, 133–148. [Google Scholar] [CrossRef]
- Yoo, S.-H. Electricity consumption and economic growth: Evidence from Korea. Energy Policy 2005, 33, 1627–1632. [Google Scholar] [CrossRef]
- Azomahou, T.; Laisney, F.; Van, P.N. Economic development and CO2 emissions: A nonparametric panel approach. J. Public Econ. 2006, 90, 1347–1363. [Google Scholar] [CrossRef]
- Baltagi, B.H.; Hidalgo, J.; Li, Q. A nonparametric test for poolability using panel data. J. Econom. 1996, 75, 345–367. [Google Scholar] [CrossRef]
- Lee, C.-C.; Chang, C.-P.; Chen, P.-F. Energy-income causality in OECD countries revisited: The key role of capital stock. Energy Econ. 2008, 30, 2359–2373. [Google Scholar] [CrossRef]
- Apergis, N.; Payne, J.E. Renewable energy consumption and economic growth: Evidence from a panel of OECD countries. Energy Policy 2010, 38, 656–660. [Google Scholar] [CrossRef]
- Menyah, K.; Wolde-Rufael, Y. Energy consumption, pollutant emissions and economic growth in South Africa. Energy Econ. 2010, 32, 1374–1382. [Google Scholar] [CrossRef]
- Kahsai, M.S.; Nondo, C.; Schaeffer, P.V.; Gebremedhin, T.G. Income level and the energy consumption–GDP nexus: Evidence from Sub-Saharan Africa. Energy Econ. 2012, 34, 739–746. [Google Scholar] [CrossRef]
- Akpan, G.E.; Akpan, U.F. Electricity consumption, carbon emissions and economic growth in Nigeria. Int. J. Energy Econ. Policy 2012, 2, 292. [Google Scholar]
- Saboori, B.; Sulaiman, J. Environmental degradation, economic growth and energy consumption: Evidence of the environmental Kuznets curve in Malaysia. Energy Policy 2013, 60, 892–905. [Google Scholar] [CrossRef]
- Shahbaz, M.; Salah Uddin, G.; Ur Rehman, I.; Imran, K. Industrialization, electricity consumption and CO2 emissions in Bangladesh. Renew. Sustain. Energy Rev. 2014, 31, 575–586. [Google Scholar] [CrossRef]
- Shahbaz, M.; Solarin, S.A.; Sbia, R.; Bibi, S. Does energy intensity contribute to CO2 emissions? A trivariate analysis in selected African countries. Ecol. Indic. 2015, 50, 215–224. [Google Scholar] [CrossRef]
- Esso, L.J.; Keho, Y. Energy consumption, economic growth and carbon emissions: Cointegration and causality evidence from selected African countries. Energy 2016, 114, 492–497. [Google Scholar] [CrossRef]
- Chen, J.; Cheng, S.; Song, M.; Wang, J. Interregional differences of coal carbon dioxide emissions in China. Energy Policy 2016, 96, 1–13. [Google Scholar] [CrossRef]
- Alam, M.M.; Murad, M.W.; Noman, A.H.M.; Ozturk, I. Relationships among carbon emissions, economic growth, energy consumption and population growth: Testing Environmental Kuznets Curve hypothesis for Brazil, China, India and Indonesia. Ecol. Indic. 2016, 70, 466–479. [Google Scholar] [CrossRef]
- Chiu, Y.-B. Carbon dioxide, income and energy: Evidence from a non-linear model. Energy Econ. 2017, 61, 279–288. [Google Scholar] [CrossRef]
- Chen, J.; Cheng, S.; Nikic, V.; Song, M. Quo vadis? Major players in global coal consumption and emissions reduction. Transform. Bus. Econ. 2018, 17, 112–132. [Google Scholar]
- Chong, S.S.; Aziz, A.A.; Harun, S.W.; Arof, H.; Shamshirband, S. Application of multiple linear regression, central composite design, and ANFIS models in dye concentration measurement and prediction using plastic optical fiber sensor. Measurement 2015, 74, 78–86. [Google Scholar] [CrossRef]
- Hellendoorn, H.; Thomas, C. Defuzzification in fuzzy controllers. J. Intell. Fuzzy Syst. 1993, 1, 109–123. [Google Scholar]
© 2018 by the authors. Licensee MDPI, Basel, Switzerland. This article is an open access article distributed under the terms and conditions of the Creative Commons Attribution (CC BY) license (http://creativecommons.org/licenses/by/4.0/).
