Comparative Study of AC and Positive and Negative DC Visual Corona for Sphere-Plane Gaps in Atmospheric Air


Abstract
1. Introduction
2. Alternating Current (ac) and Direct Current (dc) Coronas in Atmospheric Air
2.1 Dc Coronas in Atmospheric Air
2.1.1. Negative Dc Coronas in Atmospheric Air
2.1.2. Positive Dc Coronas in Atmospheric Air
2.2. Power Frequency Ac Coronas in Atmospheric Air
2.3. The Polarity Effect
2.4. Peek’s Law for Sphere-Plane Gap
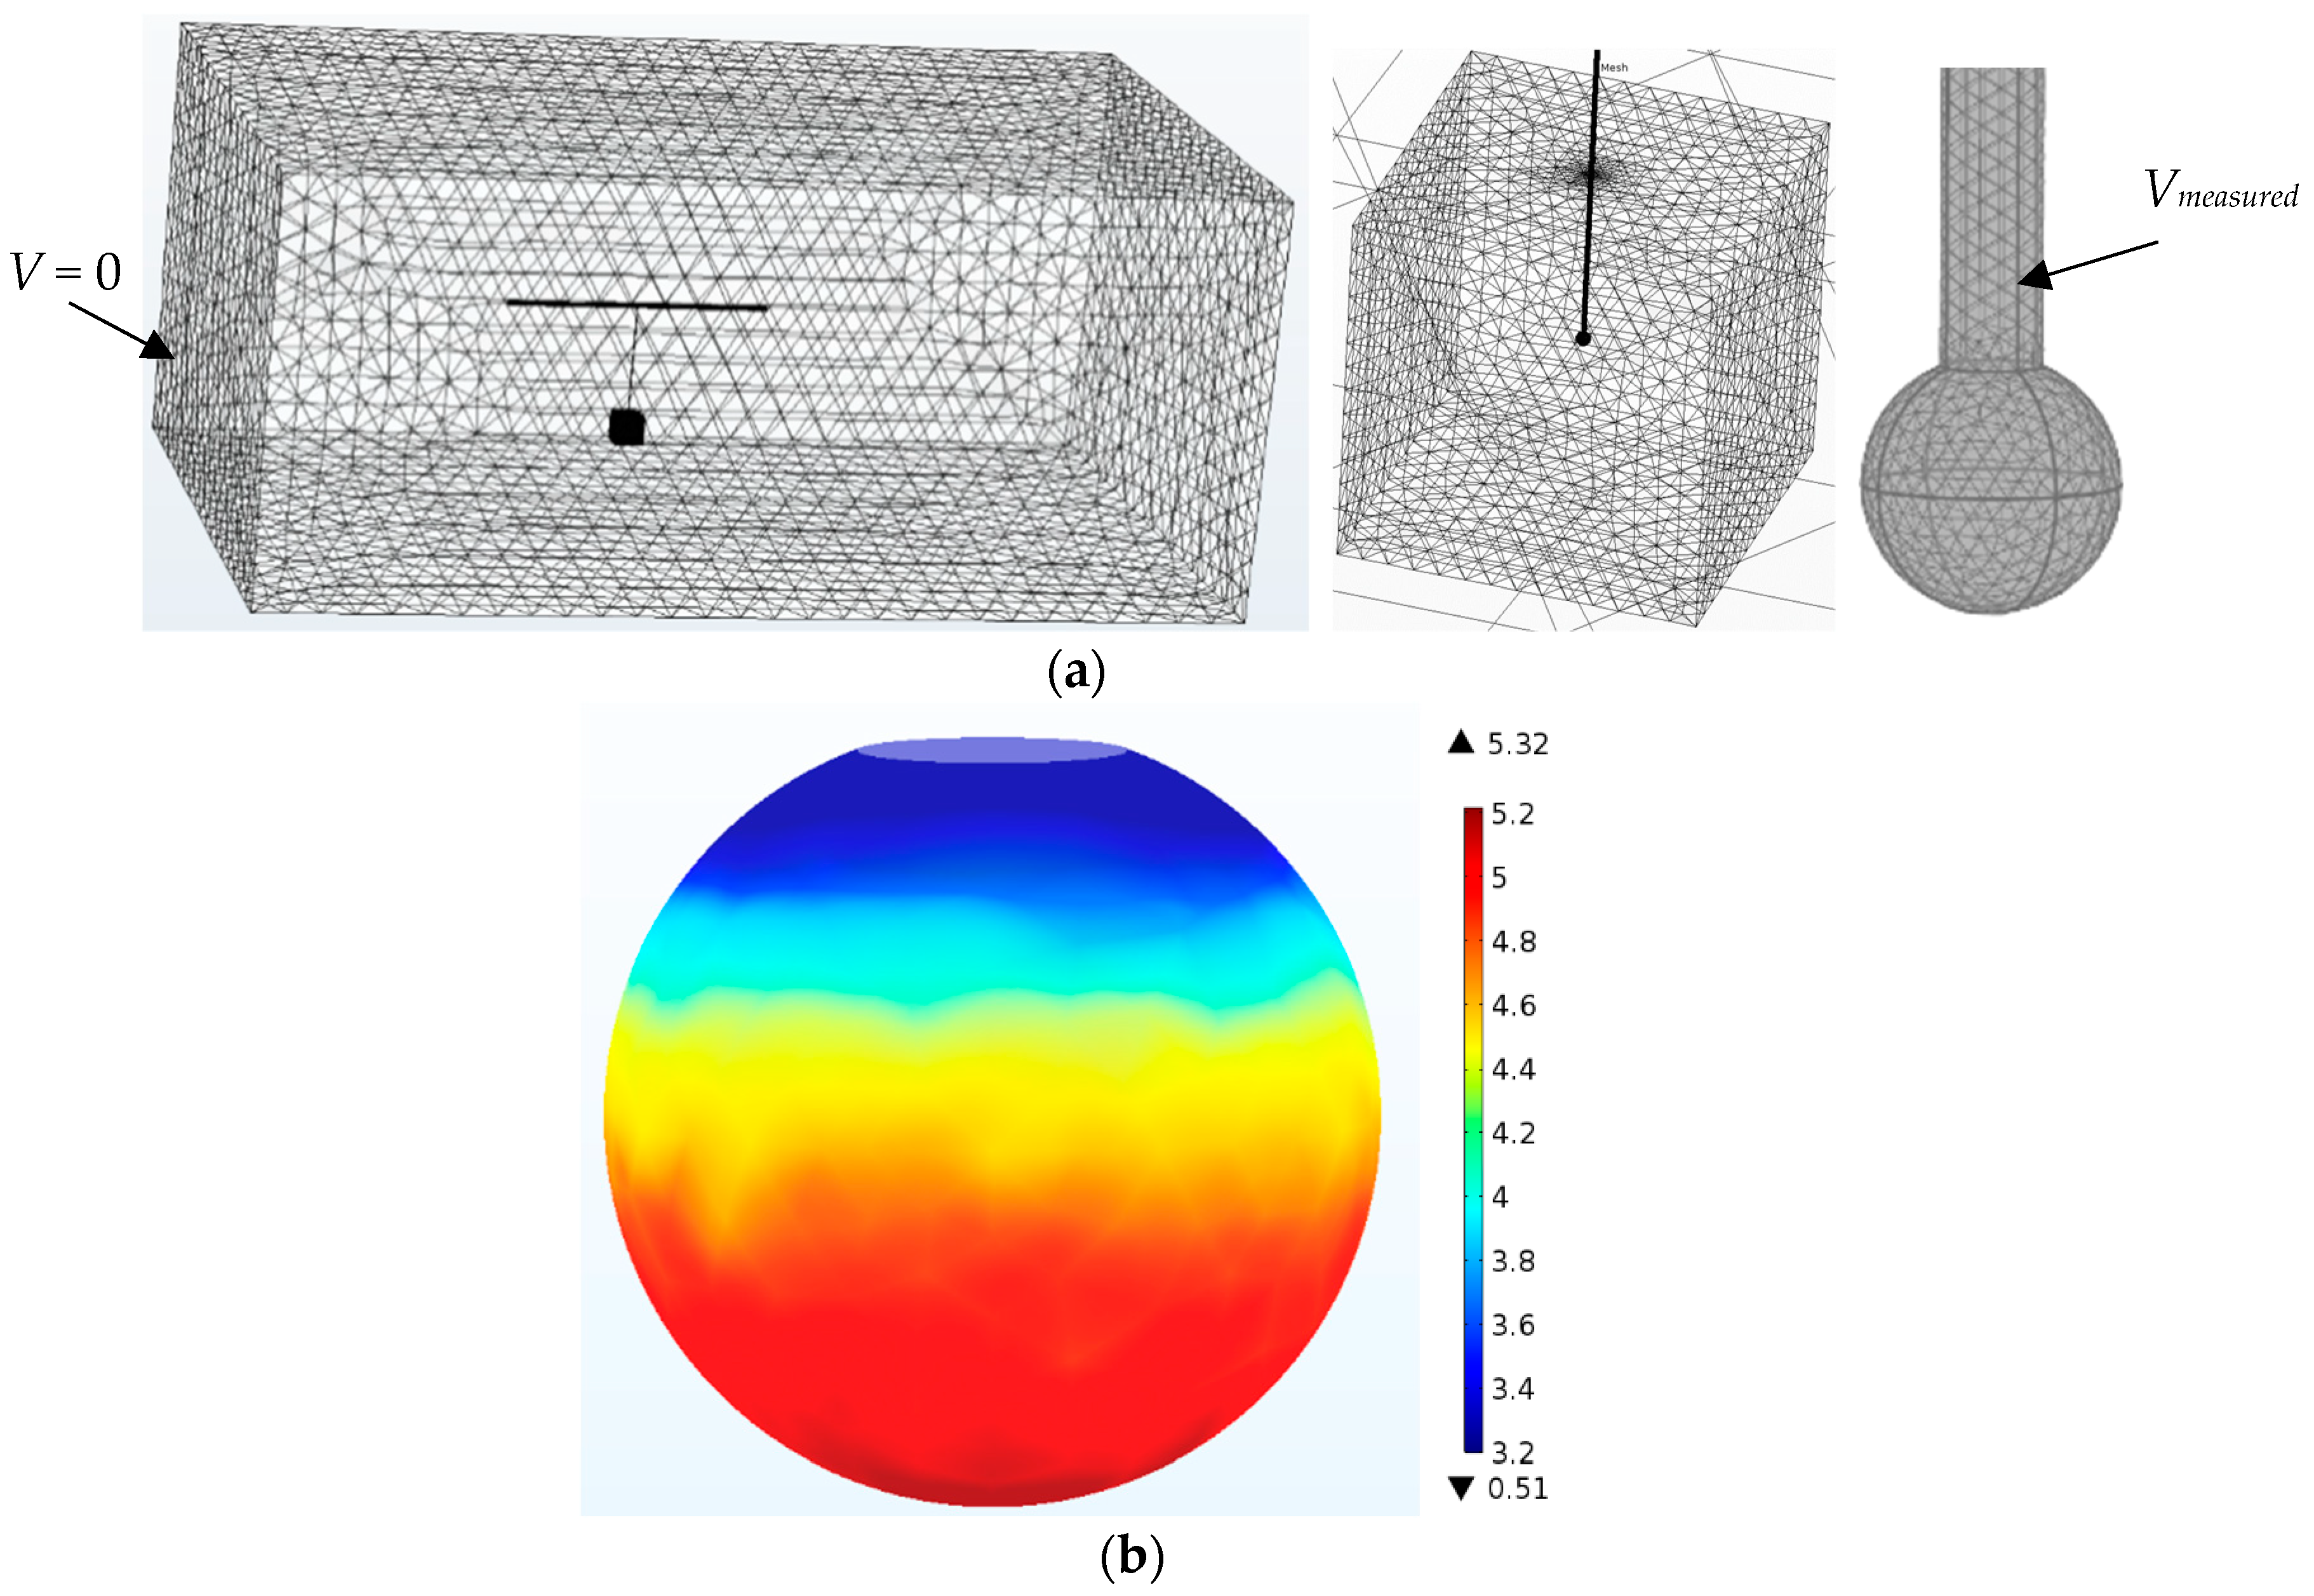
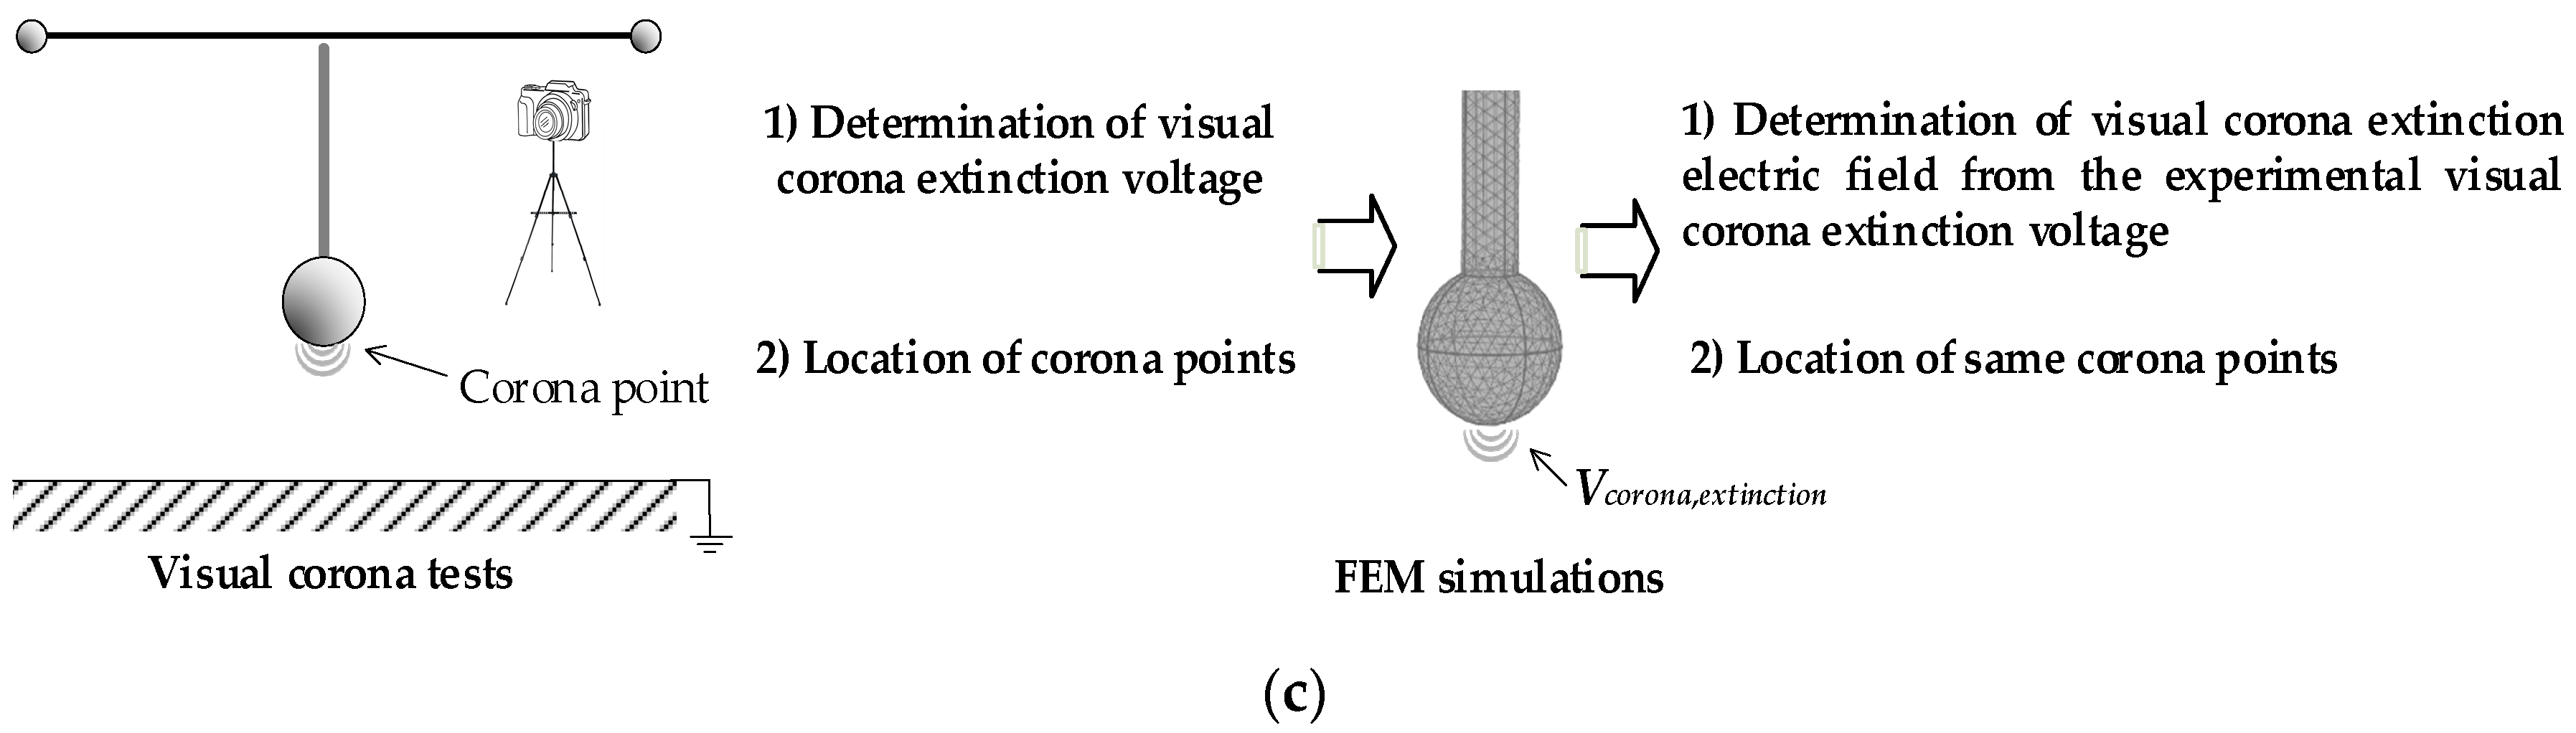
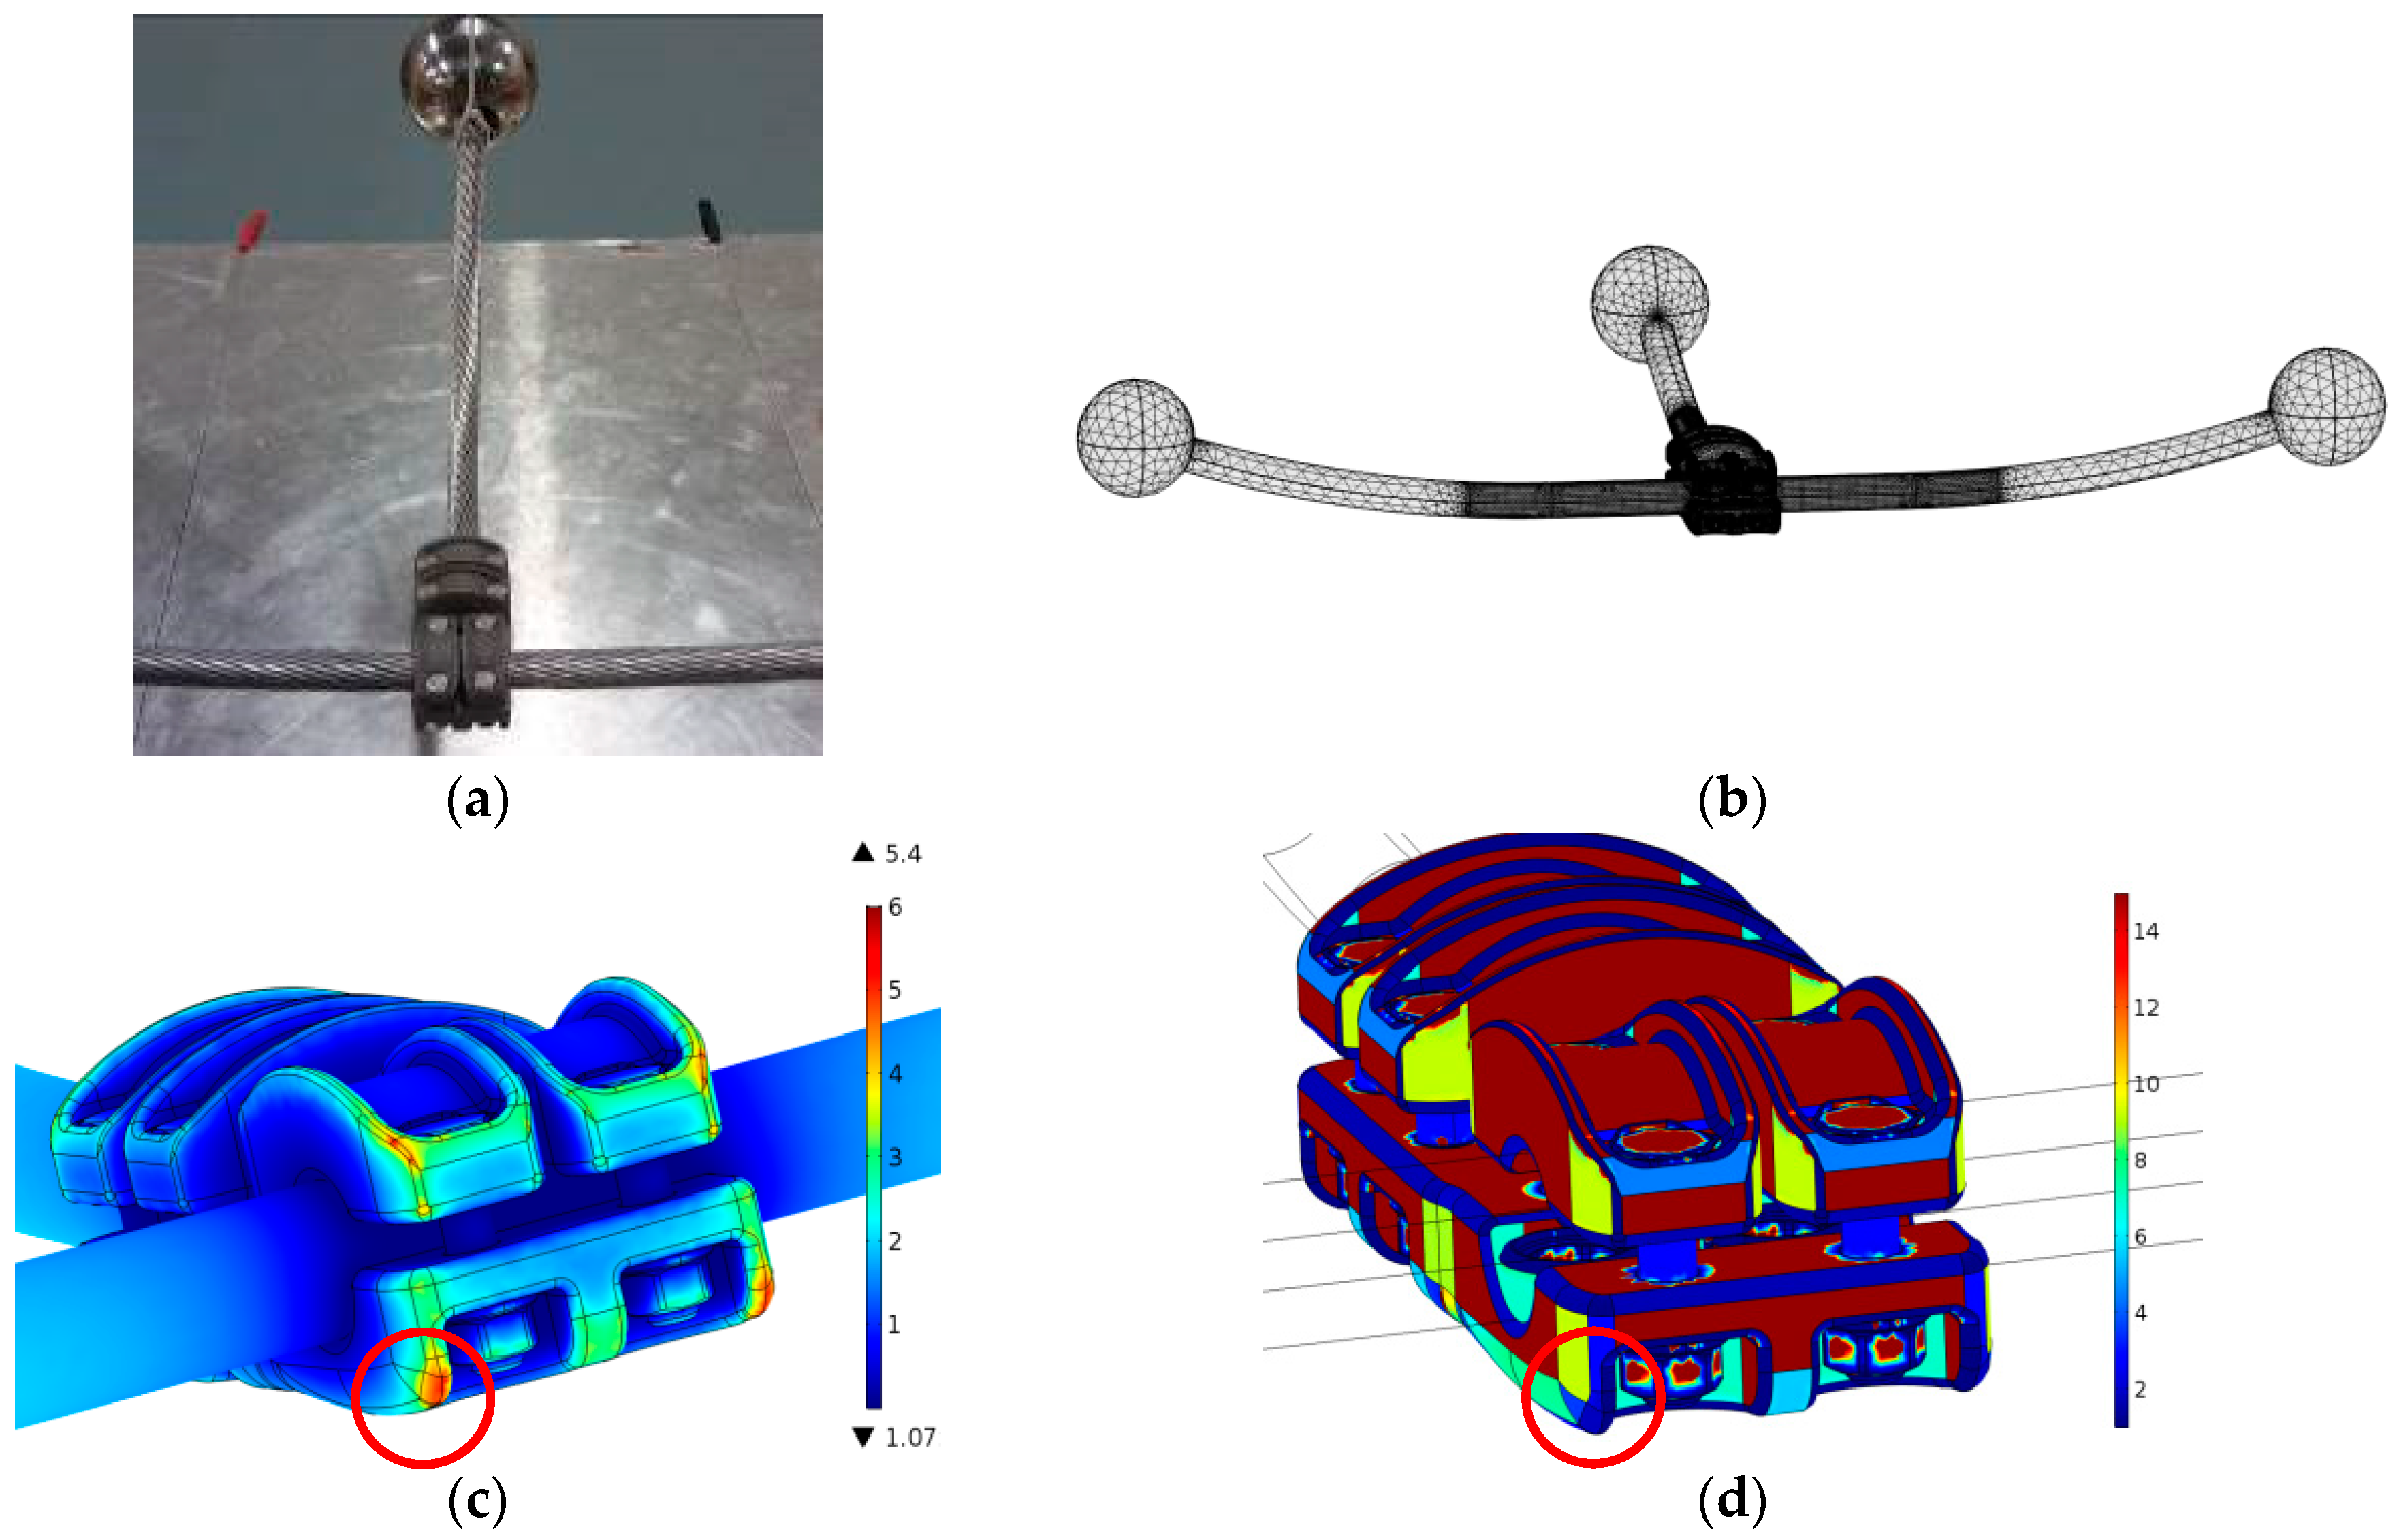
3. FEM Simulations
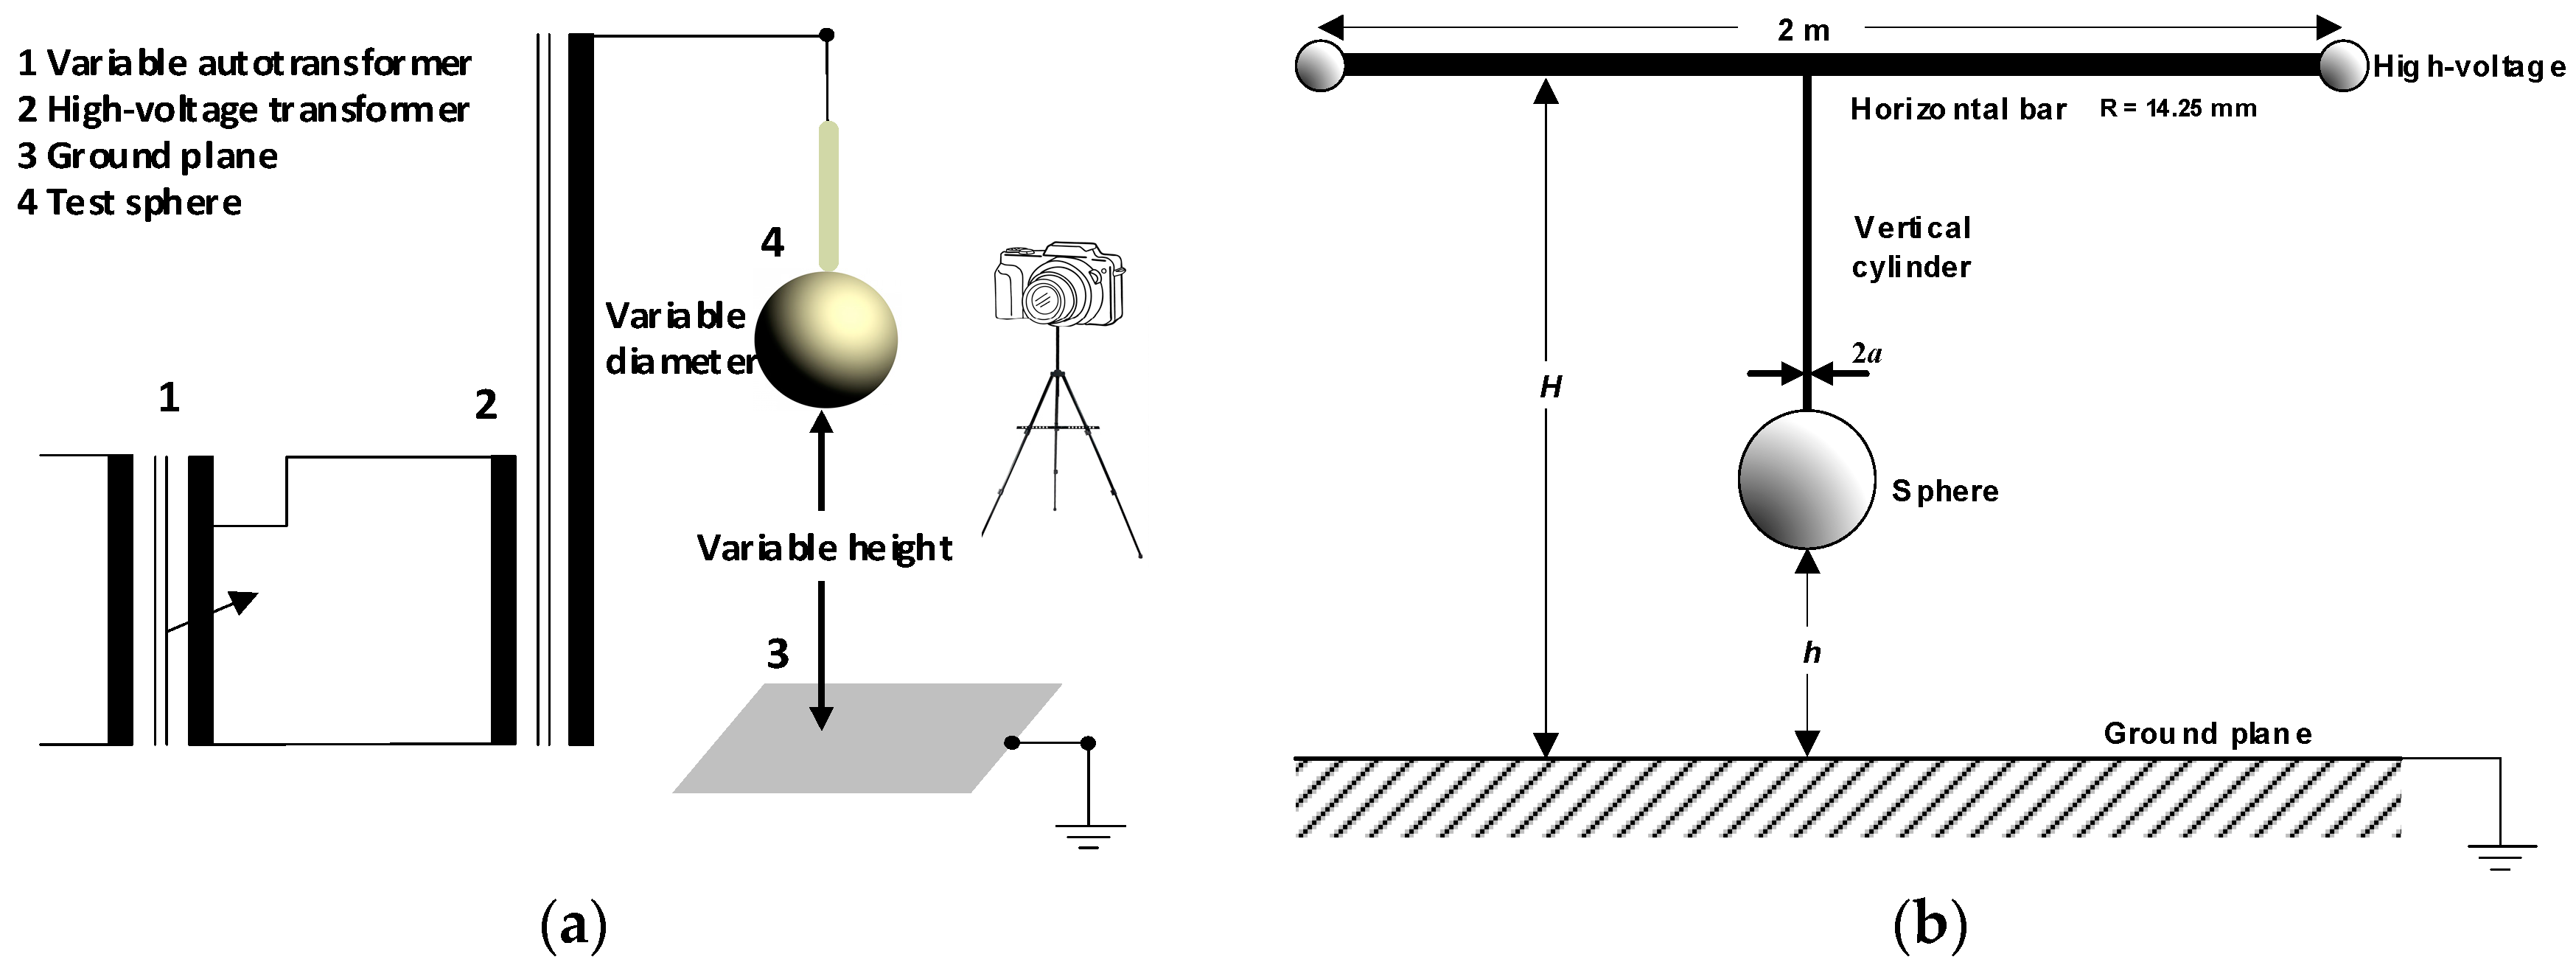
4. Experimental
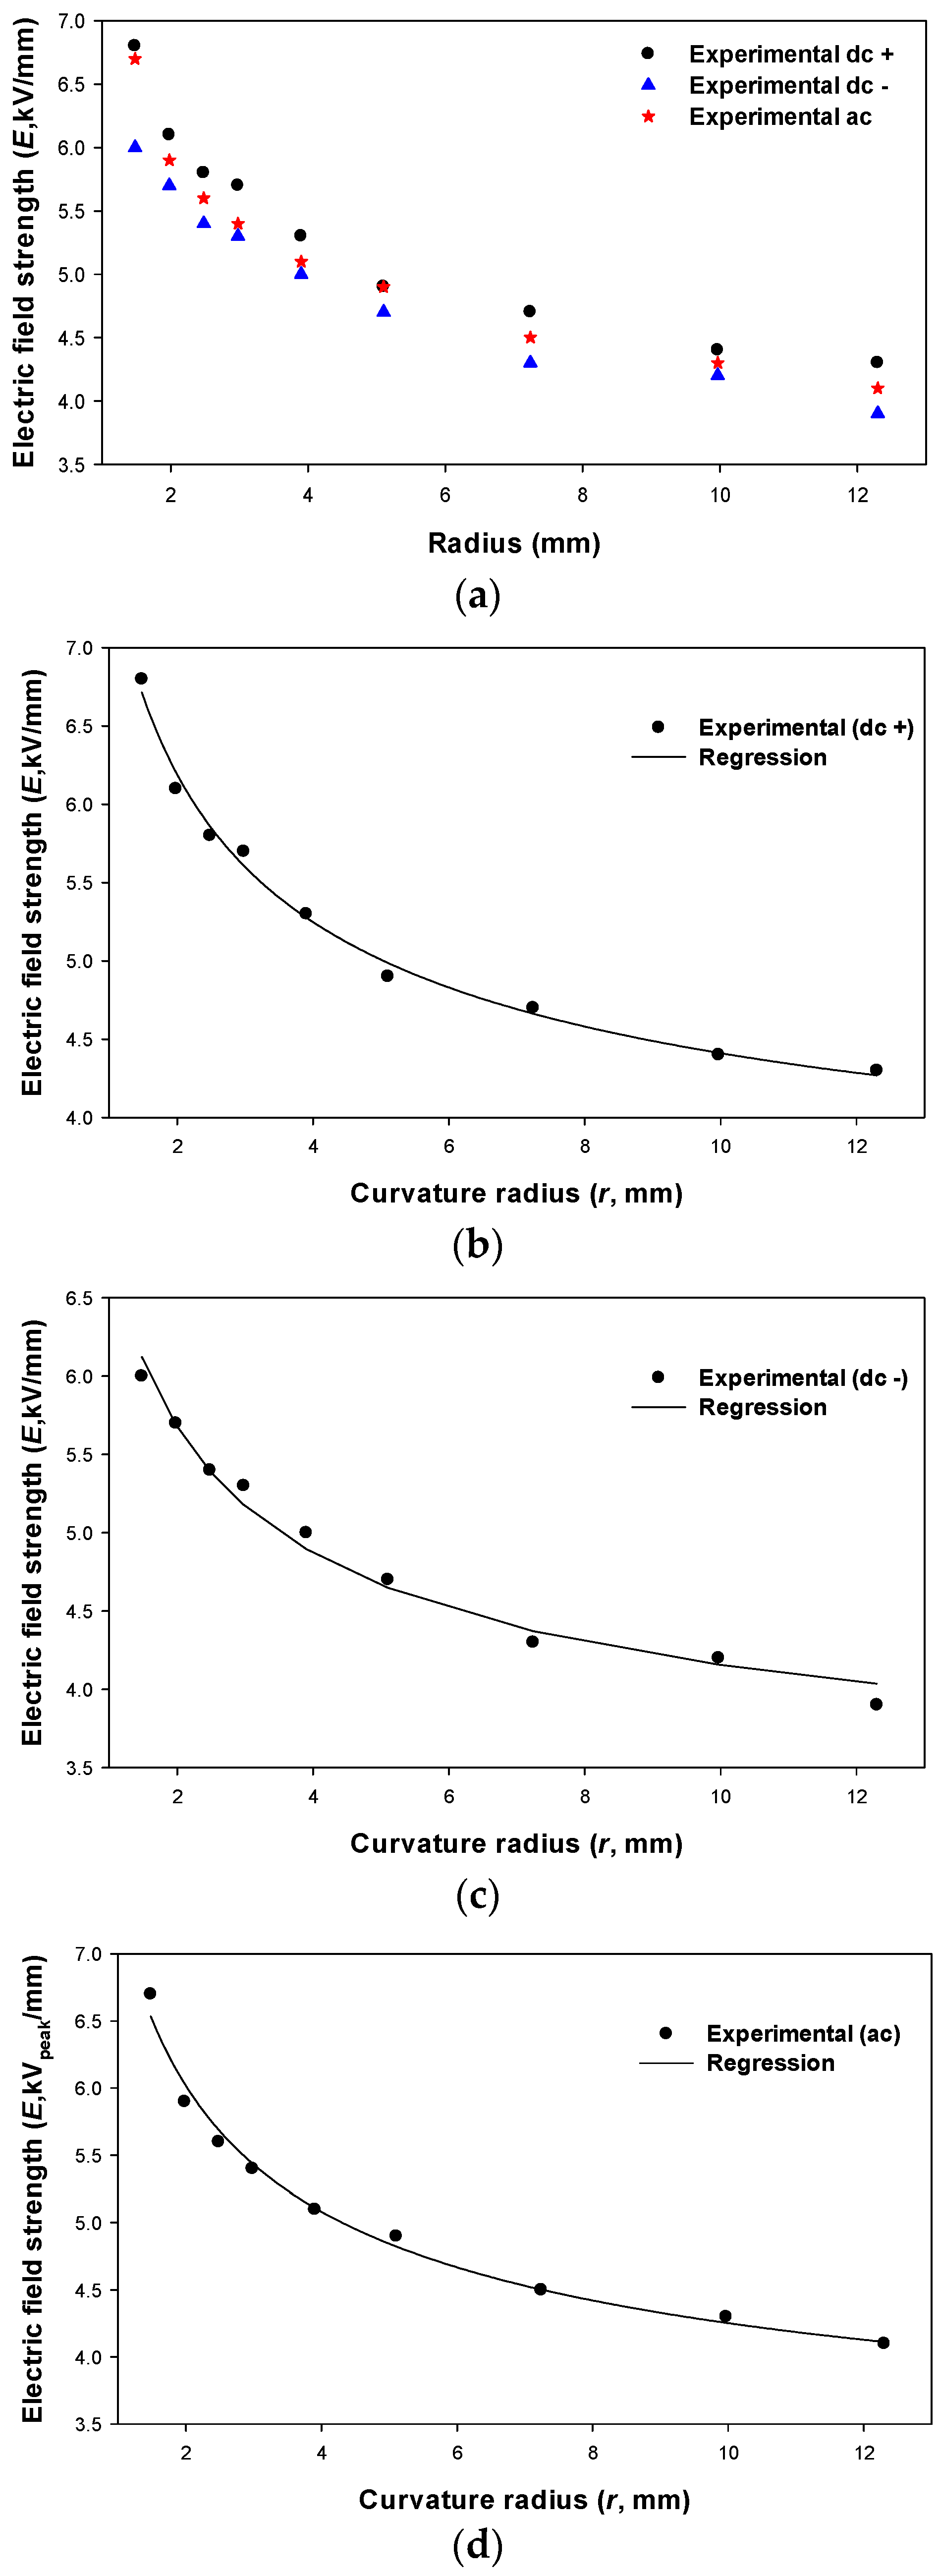
5. Sphere-Plane Gap Results
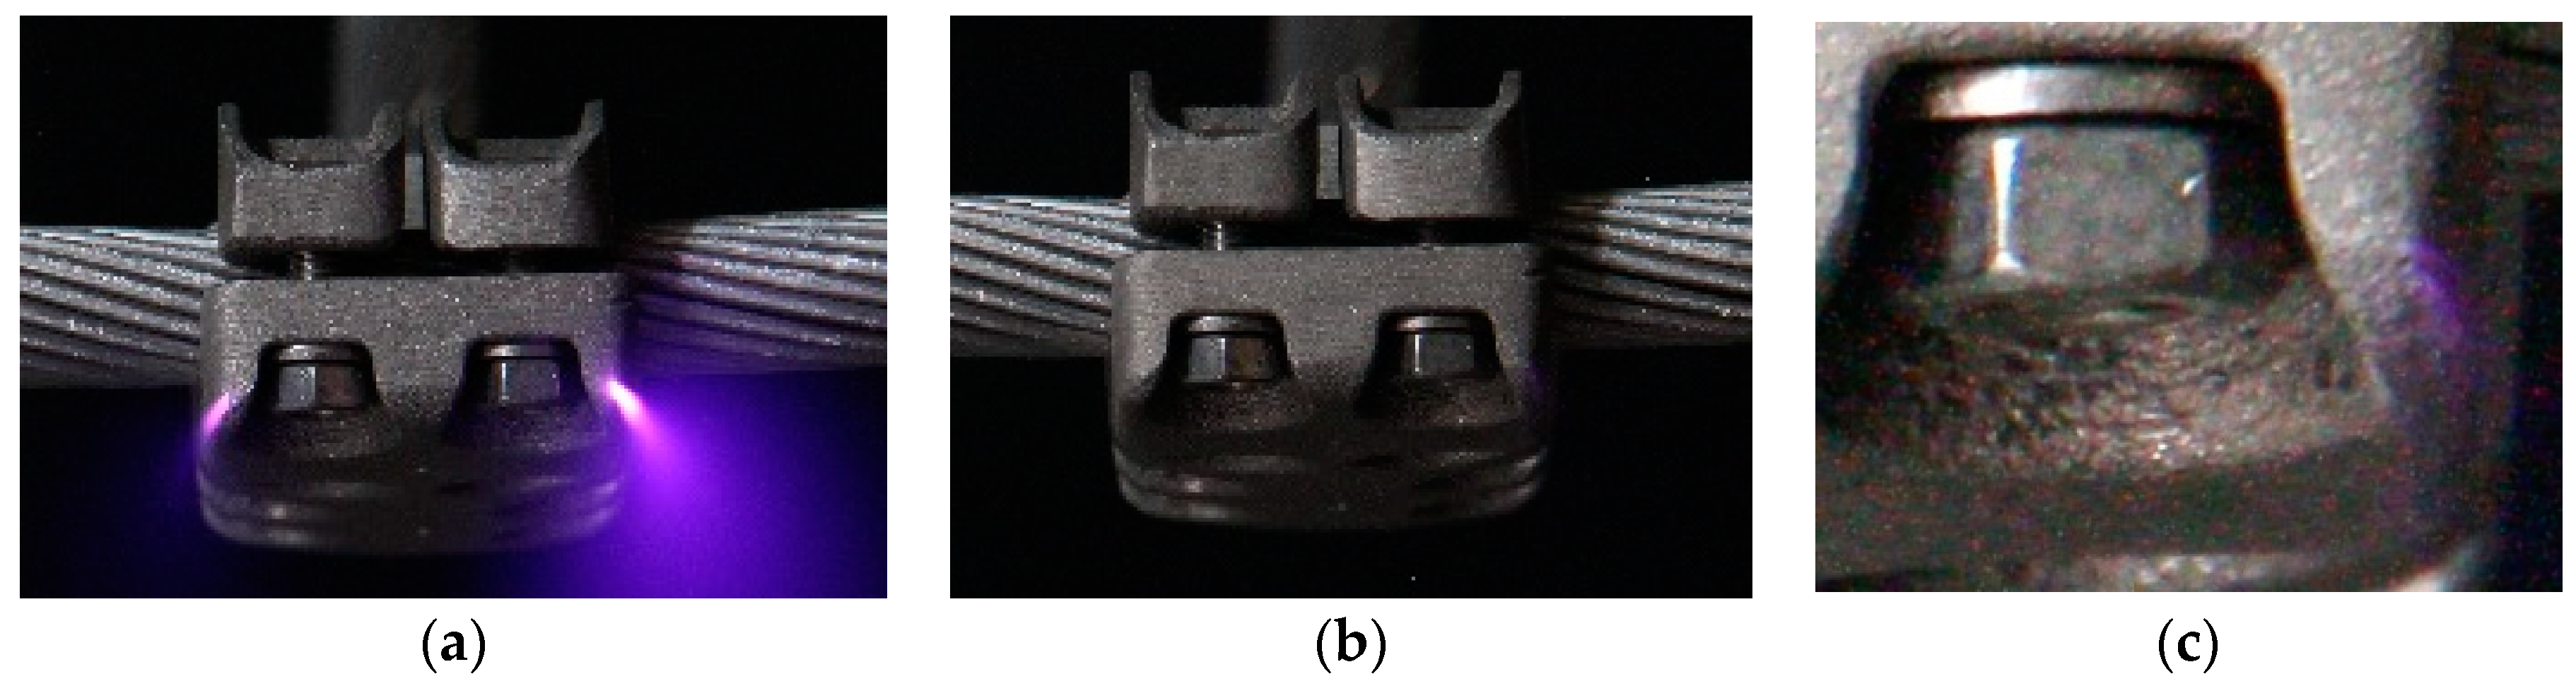
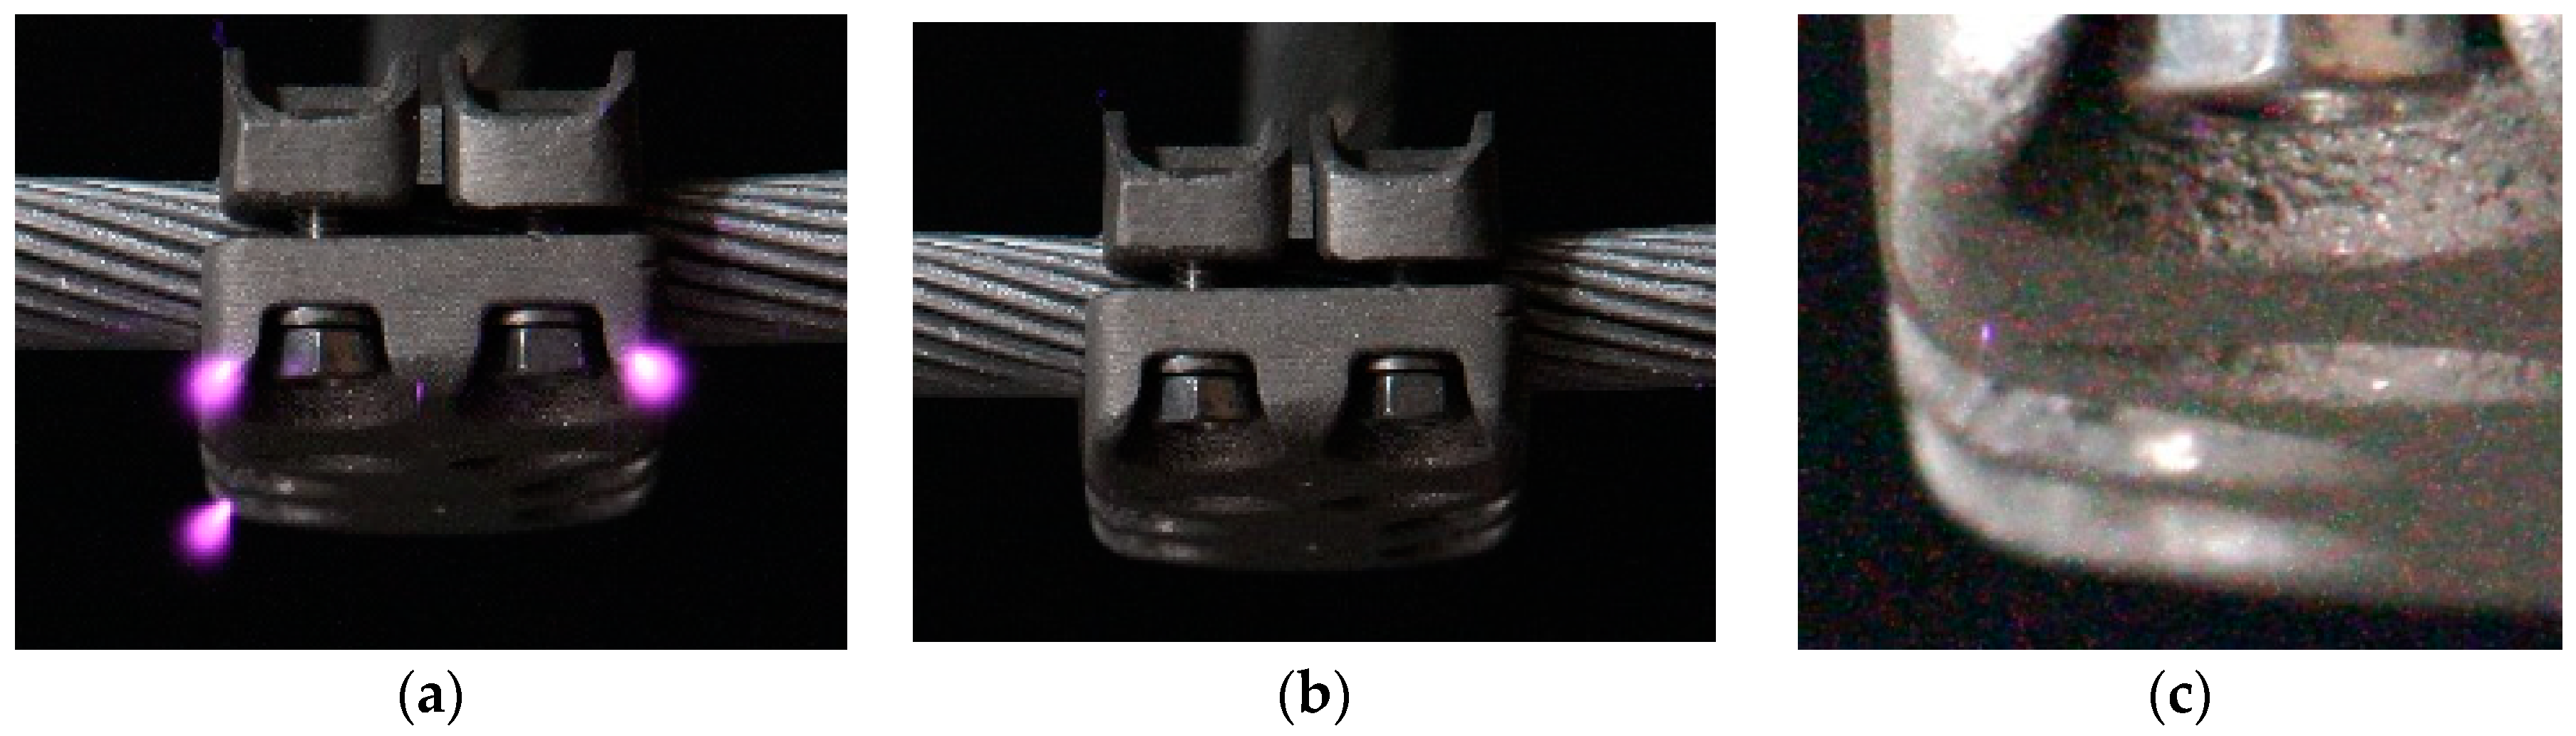
6. Substation Connector Results
7. Conclusions
Author Contributions
Funding
Acknowledgments
Conflicts of Interest
References
- Chan, J.K.; Kuffel, J.; Sibilant, G.C.; Bell, J.; Chan, J.K.; Bell, J.; Sibilant, G.C.; Chan, J.K.; Kuffel, J.; Sibilant, G.C.; et al. Methodology for HVDC corona tests. In Proceedings of the 2016 CIGRE-IEC Colloquium, Montréal, QC, Canada, 9–11 May 2016; pp. 1–10. [Google Scholar]
- Zhang, C.; Yi, Y.; Wang, L. Positive DC corona inception on dielectric-coated stranded conductors in air. IET Sci. Meas. Technol. 2016, 10, 557–563. [Google Scholar]
- Du, Z.; Huang, D.; Qiu, Z.; Shu, S.; Ruan, J.; Huang, D.; Shu, S.; Du, Z. Prediction study on positive DC corona onset voltage of rod-plane air gaps and its application to the design of valve hall fittings. IET Gener. Transm. Distrib. 2016, 10, 1519–1526. [Google Scholar]
- Ijumba, N.M.; Lekganyane, M.J.; Britten, A.C. Comparative studies of DC corona losses in a corona cage and a point-plane gap. In Proceedings of the AFRICON 2007, Windhoek, South Africa, 26–28 September 2007; pp. 1–7. [Google Scholar]
- Pedersen, A.; Lebeda, J.; Vibholm, S. Analysis of Spark Breakdown Characteristics for Sphere Gaps. IEEE Trans. Power Appar. Syst. 1967, 975–978. [Google Scholar] [CrossRef]
- Li, Z.X.; Li, G.F.; Fan, J.B.; Yin, Y. Numerical calculation of the corona onset voltage for bundle conductors for HVDC transmission line. Eur. Trans. Electr. Power 2011, 21, 11–17. [Google Scholar] [CrossRef]
- Lu, T.; Xiong, G.; Cui, X.; Rao, H.; Wang, Q. Analysis of Corona Onset Electric Field Considering the Effect of Space Charges. IEEE Trans. Magn. 2011, 47, 1390–1393. [Google Scholar] [CrossRef]
- Chen, J.; Davidson, J.H. Model of the Negative DC Corona Plasma: Comparison to the Positive DC Corona Plasma. Plasma Chem. Plasma Process. 2003, 23, 83–102. [Google Scholar] [CrossRef]
- El-Bahy, M.M. Onset voltage of negative corona in point-cup gaps. In Proceedings of the Annual Report Conference on Electrical Insulation and Dielectric Phenomena, Cancun, Quintana Roo, Mexico, 20–24 October 2002; pp. 159–163. [Google Scholar]
- Wang, Z.; Lu, T.; Cui, X.; Li, X.; Hiziroglu, H. Influence of AC voltage on the positive DC corona current pulses in a wire-cylinder gap View Documen. CSEE J. Power Energy Syst. 2016, 2, 58–65. [Google Scholar] [CrossRef]
- Bian, X.; Yu, D.; Meng, X.; Macalpine, M.; Wang, L.; Guan, Z.; Yao, W.; Zhao, S. Corona-generated space charge effects on electric field distribution for an indoor corona cage and a monopolar test line. IEEE Trans. Dielectr. Electr. Insul. 2011, 18, 1767–1778. [Google Scholar] [CrossRef]
- Hernández-Guiteras, J.; Riba, J.-R.; Casals-Torrens, P. Determination of the corona inception voltage in an extra high voltage substation connector. IEEE Trans. Dielectr. Electr. Insul. 2013, 20, 82–88. [Google Scholar] [CrossRef]
- Goldman, M.; Sigmond, R. Corona and Insulation. IEEE Trans. Electr. Insul. 1982, 90–105. [Google Scholar] [CrossRef]
- Janischewschkyj, W.; Maruvada, P.S.; Gela, G. Corona losses and ionized fields of HVDC transmission lines. In Proceedings of the International Conference on Large High Voltage Electric Systems, Paris, France, 1–9 September 1982. [Google Scholar]
- Wadhwa, C.L. High Voltage Engineering; Butterworth-Heinemann: Oxford, UK, 2010. [Google Scholar]
- Chang, J.-S.; Lawless, P.A.; Yamamoto, T. Corona discharge processes. IEEE Trans. Plasma Sci. 1991, 19, 1152–1166. [Google Scholar] [CrossRef]
- Hwang, S.; Lee, J.; Jang, G.; Hwang, S.; Lee, J.; Jang, G. HVDC-System-Interaction Assessment through Line-Flow Change-Distribution Factor and Transient-Stability Analysis at Planning Stage. Energies 2016, 9, 1068. [Google Scholar] [CrossRef]
- Parisot, A.; Boden, M.; Sommantico, G.; Abildgaard, E. Recommended Voltages for HVDC Grids; Technical Brochure; e-cigré: Paris, France, June 2017; Volume 292. [Google Scholar]
- Liu, M.; Tang, J.; Yao, Q.; Miao, Y. Development processes of positive and negative DC corona under needle-plate electrode in air. In Proceedings of the 2016 IEEE International Conference on High Voltage Engineering and Application (ICHVE), Chengdu, China, 19–22 September 2016; pp. 1–4. [Google Scholar]
- Wais, S.I.; Giliyana, D.D. Sphere-to-Plane Electrodes Configuration of Positive and Negative Plasma Corona Discharge. Am. J. Mod. Phys. 2013, 2, 46–52. [Google Scholar] [CrossRef]
- Zhang, Y.; Liu, L.; Chen, Y.; Ouyang, J. Characteristics of ionic wind in needle-to-ring corona discharge. J. Electrostat. 2015, 74, 15–20. [Google Scholar] [CrossRef]
- Fromm, U. Partial Discharge and Breakdown Testing at High DC Voltage. Ph.D. Thesis, Delft University Press, Delft, The Netherlands, 19 September 1995. [Google Scholar]
- Fuangpian, P.; Zafar, T.; Ruankorn, S.; Suwanasri, T. Experimental Investigation of the Corona Discharge in Electrical Transmission due to AC/DC Electric Fields. In Proceedings of the 2016 4th International Conference on Electrical Energy and Networks (ICEEN 2016), Nice, France, 18–19 February 2016. [Google Scholar]
- Riba, J.-R.; Abomailek, C.; Casals-Torrens, P.; Capelli, F. Simplification and cost reduction of visual corona tests. IET Gener. Transm. Distrib. 2018, 12, 834–841. [Google Scholar] [CrossRef]
- Becan, M.; Babuder, M.; Vizintin, S.; Kobal, I. Corona Performance of 400 kV Bundle Conductors and Insulator Strings; Report B2-112; CIGRE: Paris, France, 2014; pp. 1–9. [Google Scholar]
- Chen, L.; MacAlpine, J.M.K.; Bian, X.; Wang, L.; Guan, Z. Comparison of methods for determining corona inception voltages of transmission line conductors. J. Electrostat. 2013, 71, 269–275. [Google Scholar] [CrossRef]
- Souza, A.L.; Lopes, I.J.S. Experimental investigation of corona onset in contaminated polymer surfaces. IEEE Trans. Dielectr. Electr. Insul. 2015, 22, 1321–1331. [Google Scholar] [CrossRef]
- Dong, M.; Wang, B.; Ren, M.; Zhang, C.; Zhao, W.; Albarracin, R. Joint Visualization Diagnosis of Outdoor Insulation Status with Optical and Acoustical Detections. IEEE Trans. Power Deliv. 2018. [Google Scholar] [CrossRef]
- Robles, G.; Fresno, J.; Sánchez-Fernández, M.; Martínez-Tarifa, J.; Robles, G.; Fresno, J.M.; Sánchez-Fernández, M.; Martínez-Tarifa, J.M. Antenna Deployment for the Localization of Partial Discharges in Open-Air Substations. Sensors 2016, 16, 541. [Google Scholar] [CrossRef] [PubMed]
- Pihera, J.; Trnka, P.; Kozak, O.; Hornak, J. Pulse sequence analysis of corona discharge at DC voltage. In Proceedings of the 2016 Diagnostic of Electrical Machines and Insulating Systems in Electrical Engineering (DEMISEE), Papradno, Slovakia, 20–22 June 2016; pp. 71–76. [Google Scholar]
- Mikropoulos, P.; Zagkanas, V. Threshold inception conditions for positive DC corona in the coaxial cylindrical electrode arrangement under variable atmospheric conditions. IEEE Trans. Dielectr. Electr. Insul. 2015, 22, 278–286. [Google Scholar] [CrossRef]
- Waters, R.T.; Rickard, T.E.S.; Stark, W.B. Direct measurement of electric field at line conductors during a.c. corona. Proc. Inst. Electr. Eng. 1972, 119, 717. [Google Scholar] [CrossRef]
- Maglaras, A.L.; Maglaras, L.A. The polarity effect and the corona current in small air gaps. In Proceedings of the 2nd International Conference on Experiments/Process/System Modelling/Simulation and Optimization, Athens, Greece, 4–7 July 2007; pp. 1–9. [Google Scholar]
- Plank, T. Positive Corona at Combined DC and AC Voltage; University of Tartu: Tartu, Estonia, 2002. [Google Scholar]
- Zhang, Y.; Xia, Q.; Jiang, Z.; Ouyang, J. Trichel pulse in various gases and the key factor for its formation. Sci. Rep. 2017, 7. [Google Scholar] [CrossRef] [PubMed]
- Chen, J.; Davidson, J.H. Ozone Production in the Negative DC Corona: The Dependence of Discharge Polarity. Plasma Chem. Plasma Process. 2003, 23, 501–518. [Google Scholar] [CrossRef]
- Pekárek, S. Effect of polarity on ozone production of DC corona discharge with and without photocatalyst. Int. Symposium Plasma Chem. 2009, 19, 1–4. [Google Scholar]
- Briels, T.M.P.; Kos, J.; Winands, G.J.J.; van Veldhuizen, E.M.; Ebert, U. Positive and negative streamers in ambient air: Measuring diameter, velocity and dissipated energy. J. Phys. D Appl. Phys. 2008, 41. [Google Scholar] [CrossRef]
- Mikropoulos, P.N.; Zagkanas, V.N. Negative DC corona inception in coaxial cylinders under variable atmospheric conditions: A comparison with positive corona. IEEE Trans. Dielectr. Electr. Insul. 2016, 23, 1322–1330. [Google Scholar] [CrossRef]
- International Electrotechnical Commission. IEC 61284: 1997 Overhead Lines-Requirements and Tests for Fittings; International Electrotechnical Commission: Geneva, Switzerland, 17 September 1997. [Google Scholar]
- IEEE PES Transmission & Distribution Committee. IEEE Std 1829-2017-IEEE Guide for Conducting Corona Tests on Hardware for Overhead Transmission Lines and Substations; IEEE Power and Energy Society: Piscataway, NJ, USA, 14 February 2017. [Google Scholar]
- Kuffel, J.; Zaengl, W.S.; Kuffel, P. High Voltage Engineering Fundamentals, 2nd ed.; Newnes: Oxford, UK, 2000. [Google Scholar]
- Electric Research Council. Transmission Line Reference Book 345 kV and Above; Electric Power Research Institute (EPRI): Palo Alto, CA, USA, 2014. [Google Scholar]
- Abdel-Salam, M.; Nakano, M.; Mizuno, A. Electric fields and corona currents in needle-to-meshed plate gaps. J. Phys. D Appl. Phys. 2007, 40, 3363–3370. [Google Scholar] [CrossRef]
- Peek, F.W. The Law of Corona and the Dielectric Strength of Air-II. Proc. Am. Inst. Electr. Eng. 1912, 1051–1092. [Google Scholar] [CrossRef]
- IEEE. IEEE Std 4-2013 (Revision of IEEE Std 4-1995) IEEE Standard for High-Voltage Testing Techniques; IEEE: Piscataway, NJ, USA, 2013; pp. 1–213. [Google Scholar]


| Approximate Diameter (mm) | Actual Sphere Radius (r, mm) | Vertical Cylinder Radius (a, mm) |
|---|---|---|
| 25 | 12.3 | 2.9 |
| 20 | 9.97 | 2.9 |
| 15 | 7.24 | 2.9 |
| 10 | 5.10 | 1.355 |
| 8 | 3.90 | 1.355 |
| 6 | 2.98 | 0.75 |
| 5 | 2.48 | 0.75 |
| 4 | 1.98 | 0.75 |
| 3 | 1.48 | 0.75 |
| Test Height (h, cm) | H (cm) |
|---|---|
| 10 cm | 79.5 |
| 15 cm | 79.5 |
| 25 cm | 79.5 |
| 50 cm | 145 |
| 75 cm | 166 |
| Diameter (mm) | Sphere Height h (m) | Voltage Applied (kV) | Ec (Corona Extinction Electric Field) (kV/mm) | Average Ec (kV/mm) | ||||||
|---|---|---|---|---|---|---|---|---|---|---|
| dc+ | dc− | ac | dc+ | dc− | ac | dc+ | dc− | ac | ||
| 25 mm | 0.10 | NO | −56.4 | 56.6 | NO | −4.2 | 4.2 | 4.3 | −3.9 | 4.1 |
| 0.15 | 64.5 | −57.0 | 58.8 | 4.5 | −4.0 | 4.1 | ||||
| 0.25 | 67.5 | −60.5 | 63.8 | 4.2 | −3.8 | 4.0 | ||||
| 0.50 | 70.3 | −62.2 | 67.2 | 4.3 | −3.8 | 4.1 | ||||
| 0.75 | 73.8 | −62.4 | 67.9 | 4.3 | −3.7 | 4.0 | ||||
| 20 mm | 0.10 | 50.8 | −46.7 | 50.3 | 4.3 | −4.0 | 4.3 | 4.4 | −4.2 | 4.3 |
| 0.15 | 54.7 | −52.5 | 53.3 | 4.5 | −4.3 | 4.4 | ||||
| 0.25 | 58.2 | −57.5 | 57.1 | 4.4 | −4.3 | 4.3 | ||||
| 0.50 | 59.7 | −59.0 | 59.4 | 4.3 | −4.3 | 4.3 | ||||
| 0.75 | 61.4 | −61.3 | 61.3 | 4.3 | −4.3 | 4.3 | ||||
| 15 mm | 0.10 | 43.2 | −37.7 | 42.0 | 4.6 | −4.0 | 4.5 | 4.7 | −4.3 | 4.5 |
| 0.15 | 45.0 | −41.7 | 40.6 | 4.9 | −4.5 | 4.4 | ||||
| 0.25 | 48.5 | −42.4 | 46.1 | 4.8 | −4.2 | 4.6 | ||||
| 0.50 | 48.2 | −45.0 | 46.7 | 4.6 | −4.3 | 4.5 | ||||
| 0.75 | 50.0 | −45.4 | 48.9 | 4.6 | −4.2 | 4.5 | ||||
| 10 mm | 0.10 | 32.3 | −31.0 | 32.5 | 5.0 | −4.8 | 5.0 | 4.9 | −4.7 | 4.9 |
| 0.15 | 34.8 | −31.9 | 34.5 | 5.0 | −4.6 | 5.0 | ||||
| 0.25 | 37.0 | −34.7 | 37.6 | 4.8 | −4.5 | 4.9 | ||||
| 0.50 | 36.5 | −35.4 | 37.5 | 4.8 | −4.6 | 4.9 | ||||
| 0.75 | 38.7 | −37.2 | 37.9 | 5.0 | −4.8 | 4.9 | ||||
| 8 mm | 0.10 | 25.8 | −23.0 | 23.6 | 5.5 | −4.9 | 5.0 | 5.3 | −5.0 | 5.1 |
| 0.15 | 26.9 | −24.7 | 25.6 | 5.3 | −4.8 | 5.0 | ||||
| 0.25 | 29.2 | −27.1 | 27.1 | 5.3 | −4.9 | 4.9 | ||||
| 0.50 | 29.4 | −28.4 | 29.0 | 5.2 | −5.0 | 5.1 | ||||
| 0.75 | 30.8 | −31.0 | 31.1 | 5.2 | −5.3 | 5.3 | ||||
| 6 mm | 0.10 | 22.6 | −20.5 | 20.6 | 5.8 | −5.3 | 5.3 | 5.7 | −5.3 | 5.4 |
| 0.15 | 24.3 | −22.5 | 23.1 | 5.6 | −5.2 | 5.3 | ||||
| 0.25 | 25.7 | −24.3 | 24.7 | 5.6 | −5.3 | 5.4 | ||||
| 0.50 | 26.1 | −24.4 | 24.9 | 5.7 | −5.3 | 5.4 | ||||
| 0.75 | 27.0 | −25.2 | 25.6 | 5.8 | −5.4 | 5.5 | ||||
| 5 mm | 0.10 | 19.4 | −18.1 | 18.5 | 5.9 | −5.5 | 5.6 | 5.8 | −5.4 | 5.6 |
| 0.15 | 20.2 | −18.8 | 19.8 | 5.8 | −5.4 | 5.7 | ||||
| 0.25 | 21.6 | −19.9 | 20.5 | 5.8 | −5.3 | 5.5 | ||||
| 0.50 | 22.1 | −21.0 | 21.9 | 5.8 | −5.5 | 5.7 | ||||
| 0.75 | 22.8 | −21.4 | 22.1 | 5.7 | −5.3 | 5.5 | ||||
| 4 mm | 0.10 | 16.7 | −15.9 | 15.0 | 6.1 | −5.8 | 5.5 | 6.1 | −5.7 | 5.9 |
| 0.15 | 17.5 | −17.0 | 16.4 | 6.1 | −5.9 | 5.7 | ||||
| 0.25 | 18.6 | −17.6 | 18.0 | 6.1 | −5.8 | 5.9 | ||||
| 0.50 | 19.3 | −17.8 | 19.0 | 6.2 | −5.7 | 6.1 | ||||
| 0.75 | 20.3 | −18.1 | 20.6 | 6.1 | −5.4 | 6.2 | ||||
| 3 mm | 0.10 | 14.9 | −12.4 | 14.2 | 6.8 | −5.7 | 6.5 | 6.8 | −6.0 | 6.7 |
| 0.15 | 15.4 | −13.5 | 14.7 | 6.8 | −6.0 | 6.5 | ||||
| 0.25 | 16.6 | −15.0 | 16.8 | 6.8 | −6.2 | 6.9 | ||||
| 0.50 | 17.2 | −15.5 | 17.4 | 6.8 | −6.1 | 6.9 | ||||
| 0.75 | 17.6 | −15.9 | 17.7 | 6.8 | −6.1 | 6.8 | ||||
| Parameter | dc+ | dc− | ac |
|---|---|---|---|
| b (kVpeak/cm) | 29.73 (27.78,31.63) 1 | 29.25 (26.78,31.72) 1 | 28.25 (25.89,30.61) 1 |
| c (cm1/2) | 0.485 (0.417, 0.553) 1 | 0.421 (0.338, 0.504) 1 | 0.505 (0.416,0.595) 1 |
| R-square 2 | 0.9926 | 0.9834 | 0.9887 |
| Adjusted R-square 2 | 0.9915 | 0.9811 | 0.9870 |
| SSE 2 | 4.171 | 6.860 | 6.282 |
| RMSE 2 | 0.772 | 0.990 | 0.947 |
| Parameter | dc+ | dc− | ac |
|---|---|---|---|
| Extinction voltage (kV dc or peak) | +84.9 | −77.0 | 81.3 |
| Electric field strength (kV/mm dc or peak) | 5.4 | −4.9 | 5.2 |
© 2018 by the authors. Licensee MDPI, Basel, Switzerland. This article is an open access article distributed under the terms and conditions of the Creative Commons Attribution (CC BY) license (http://creativecommons.org/licenses/by/4.0/).
Share and Cite
Riba, J.-R.; Morosini, A.; Capelli, F. Comparative Study of AC and Positive and Negative DC Visual Corona for Sphere-Plane Gaps in Atmospheric Air. Energies 2018, 11, 2671. https://doi.org/10.3390/en11102671
Riba J-R, Morosini A, Capelli F. Comparative Study of AC and Positive and Negative DC Visual Corona for Sphere-Plane Gaps in Atmospheric Air. Energies. 2018; 11(10):2671. https://doi.org/10.3390/en11102671
Chicago/Turabian StyleRiba, Jordi-Roger, Andrea Morosini, and Francesca Capelli. 2018. "Comparative Study of AC and Positive and Negative DC Visual Corona for Sphere-Plane Gaps in Atmospheric Air" Energies 11, no. 10: 2671. https://doi.org/10.3390/en11102671
APA StyleRiba, J.-R., Morosini, A., & Capelli, F. (2018). Comparative Study of AC and Positive and Negative DC Visual Corona for Sphere-Plane Gaps in Atmospheric Air. Energies, 11(10), 2671. https://doi.org/10.3390/en11102671