A Shape Optimization Method of a Specified Point Absorber Wave Energy Converter for the South China Sea


Abstract
1. Introduction
2. Theoretical Analysis
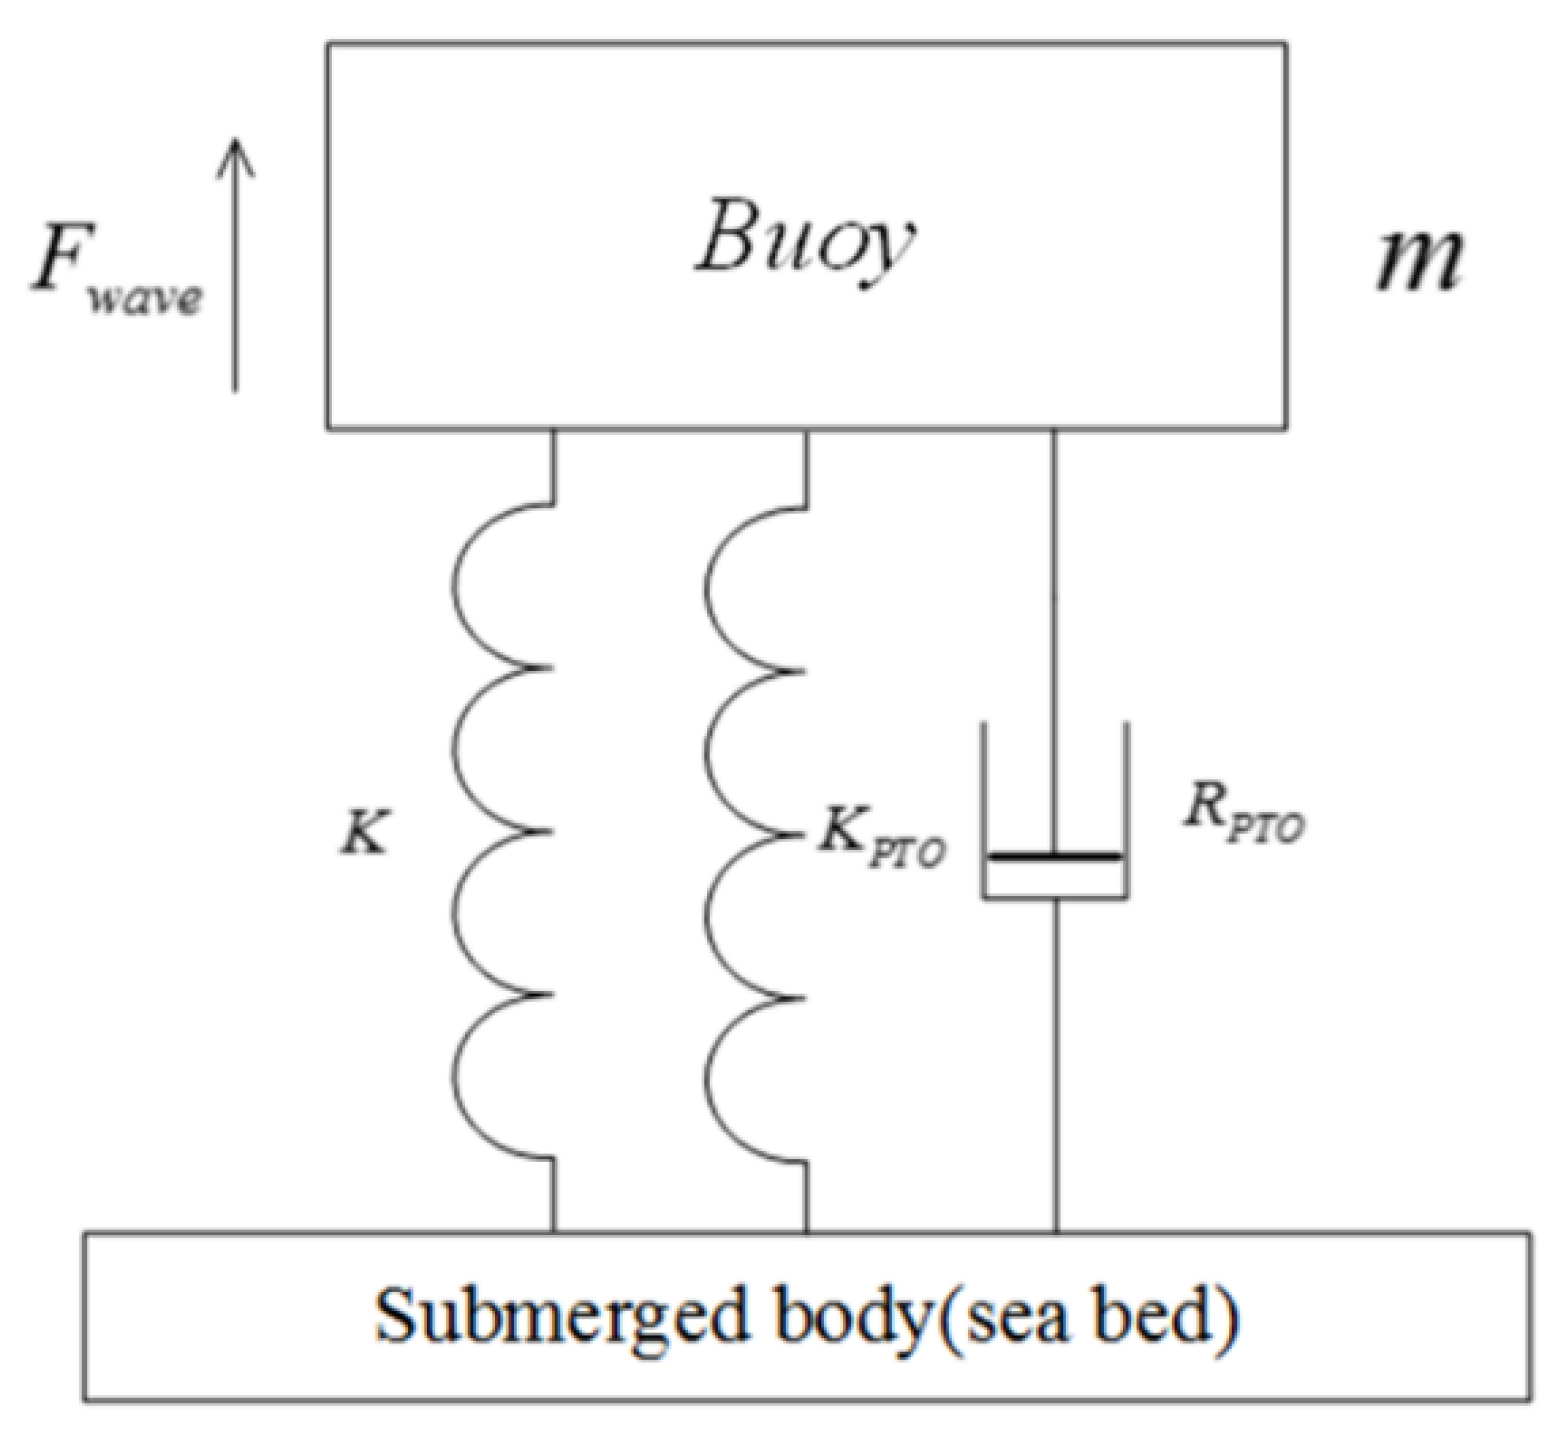
2.1. Mathematical Model
2.2. Objective Function
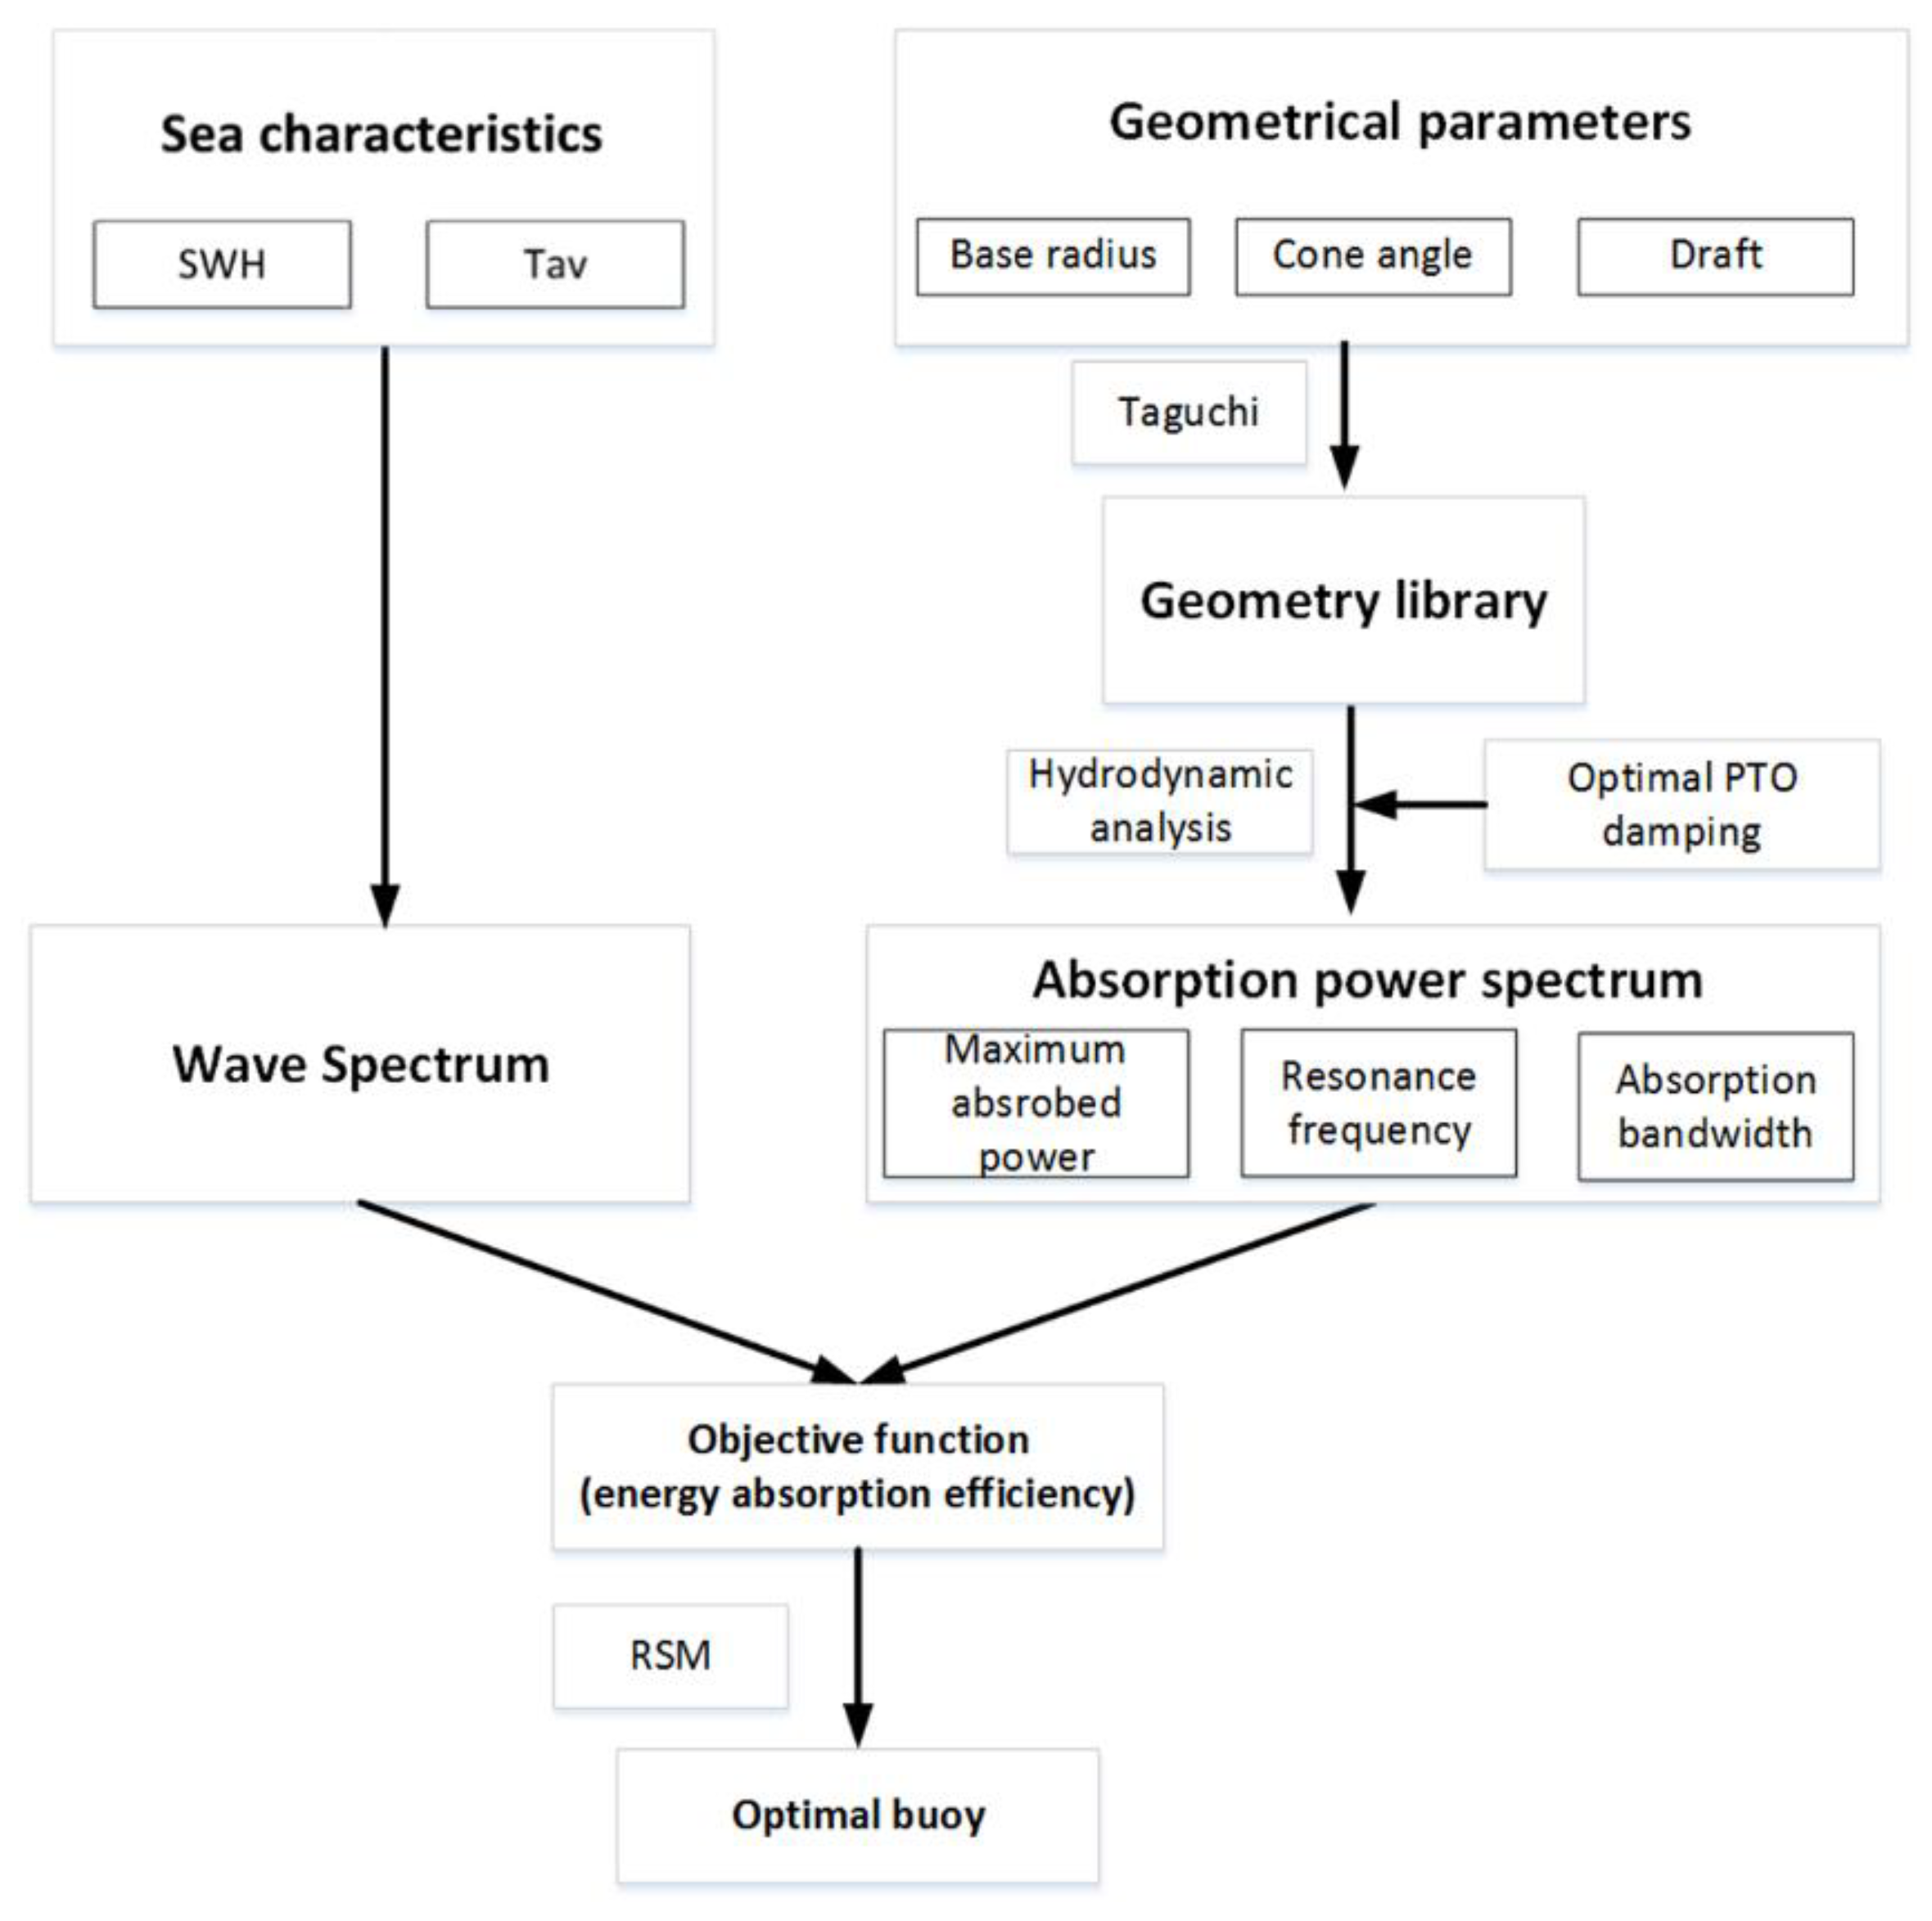
3. Geometry Optimization Methodology
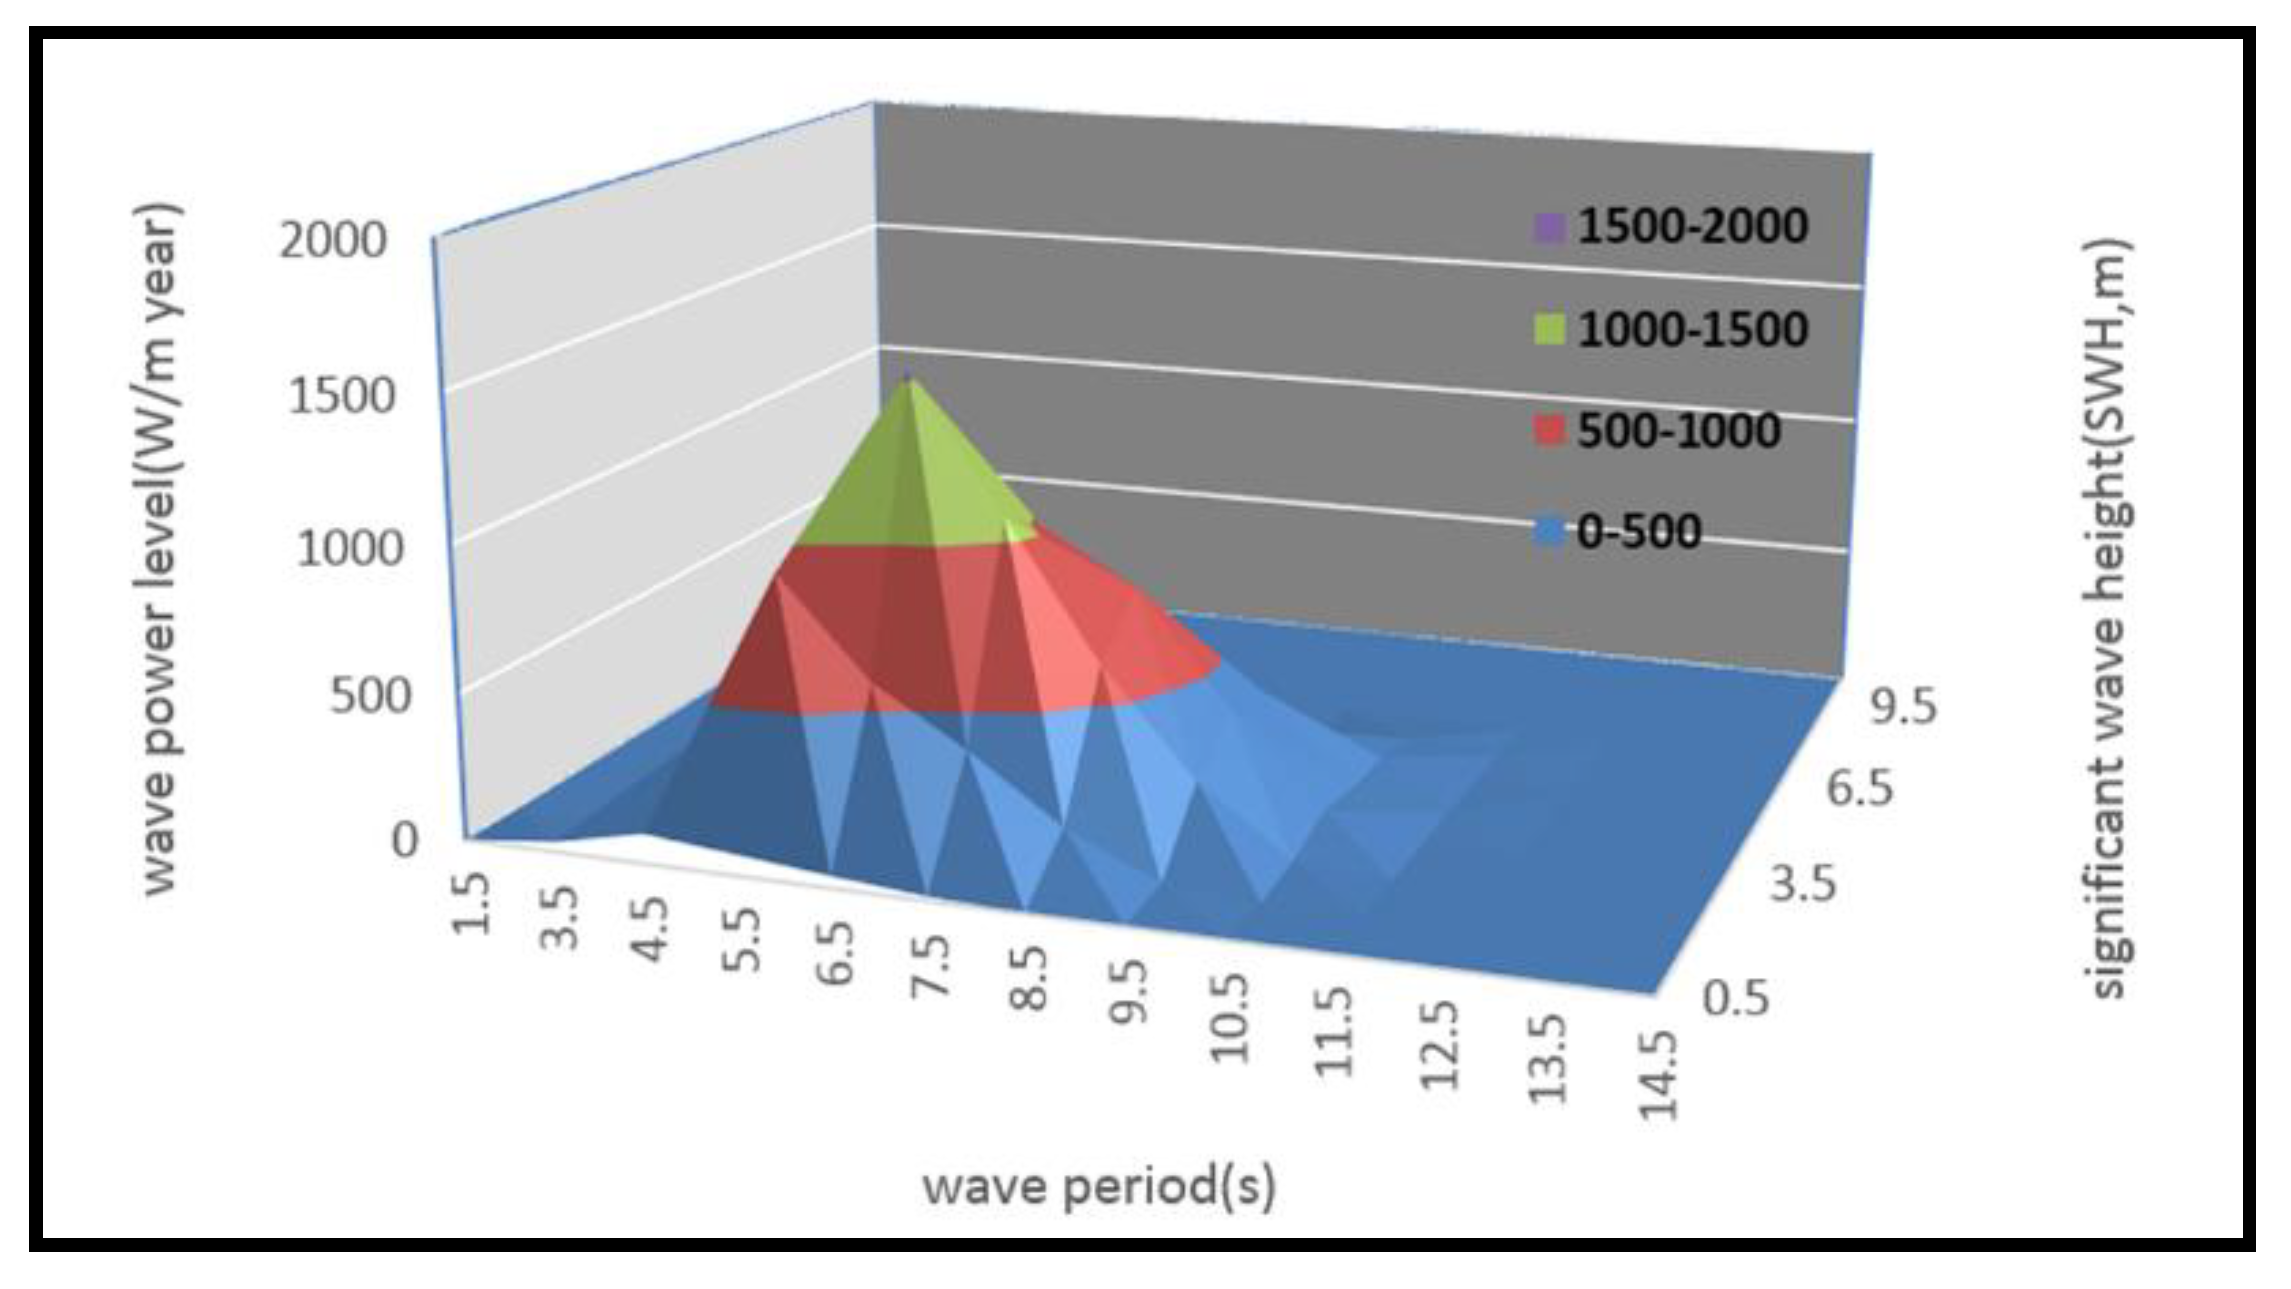
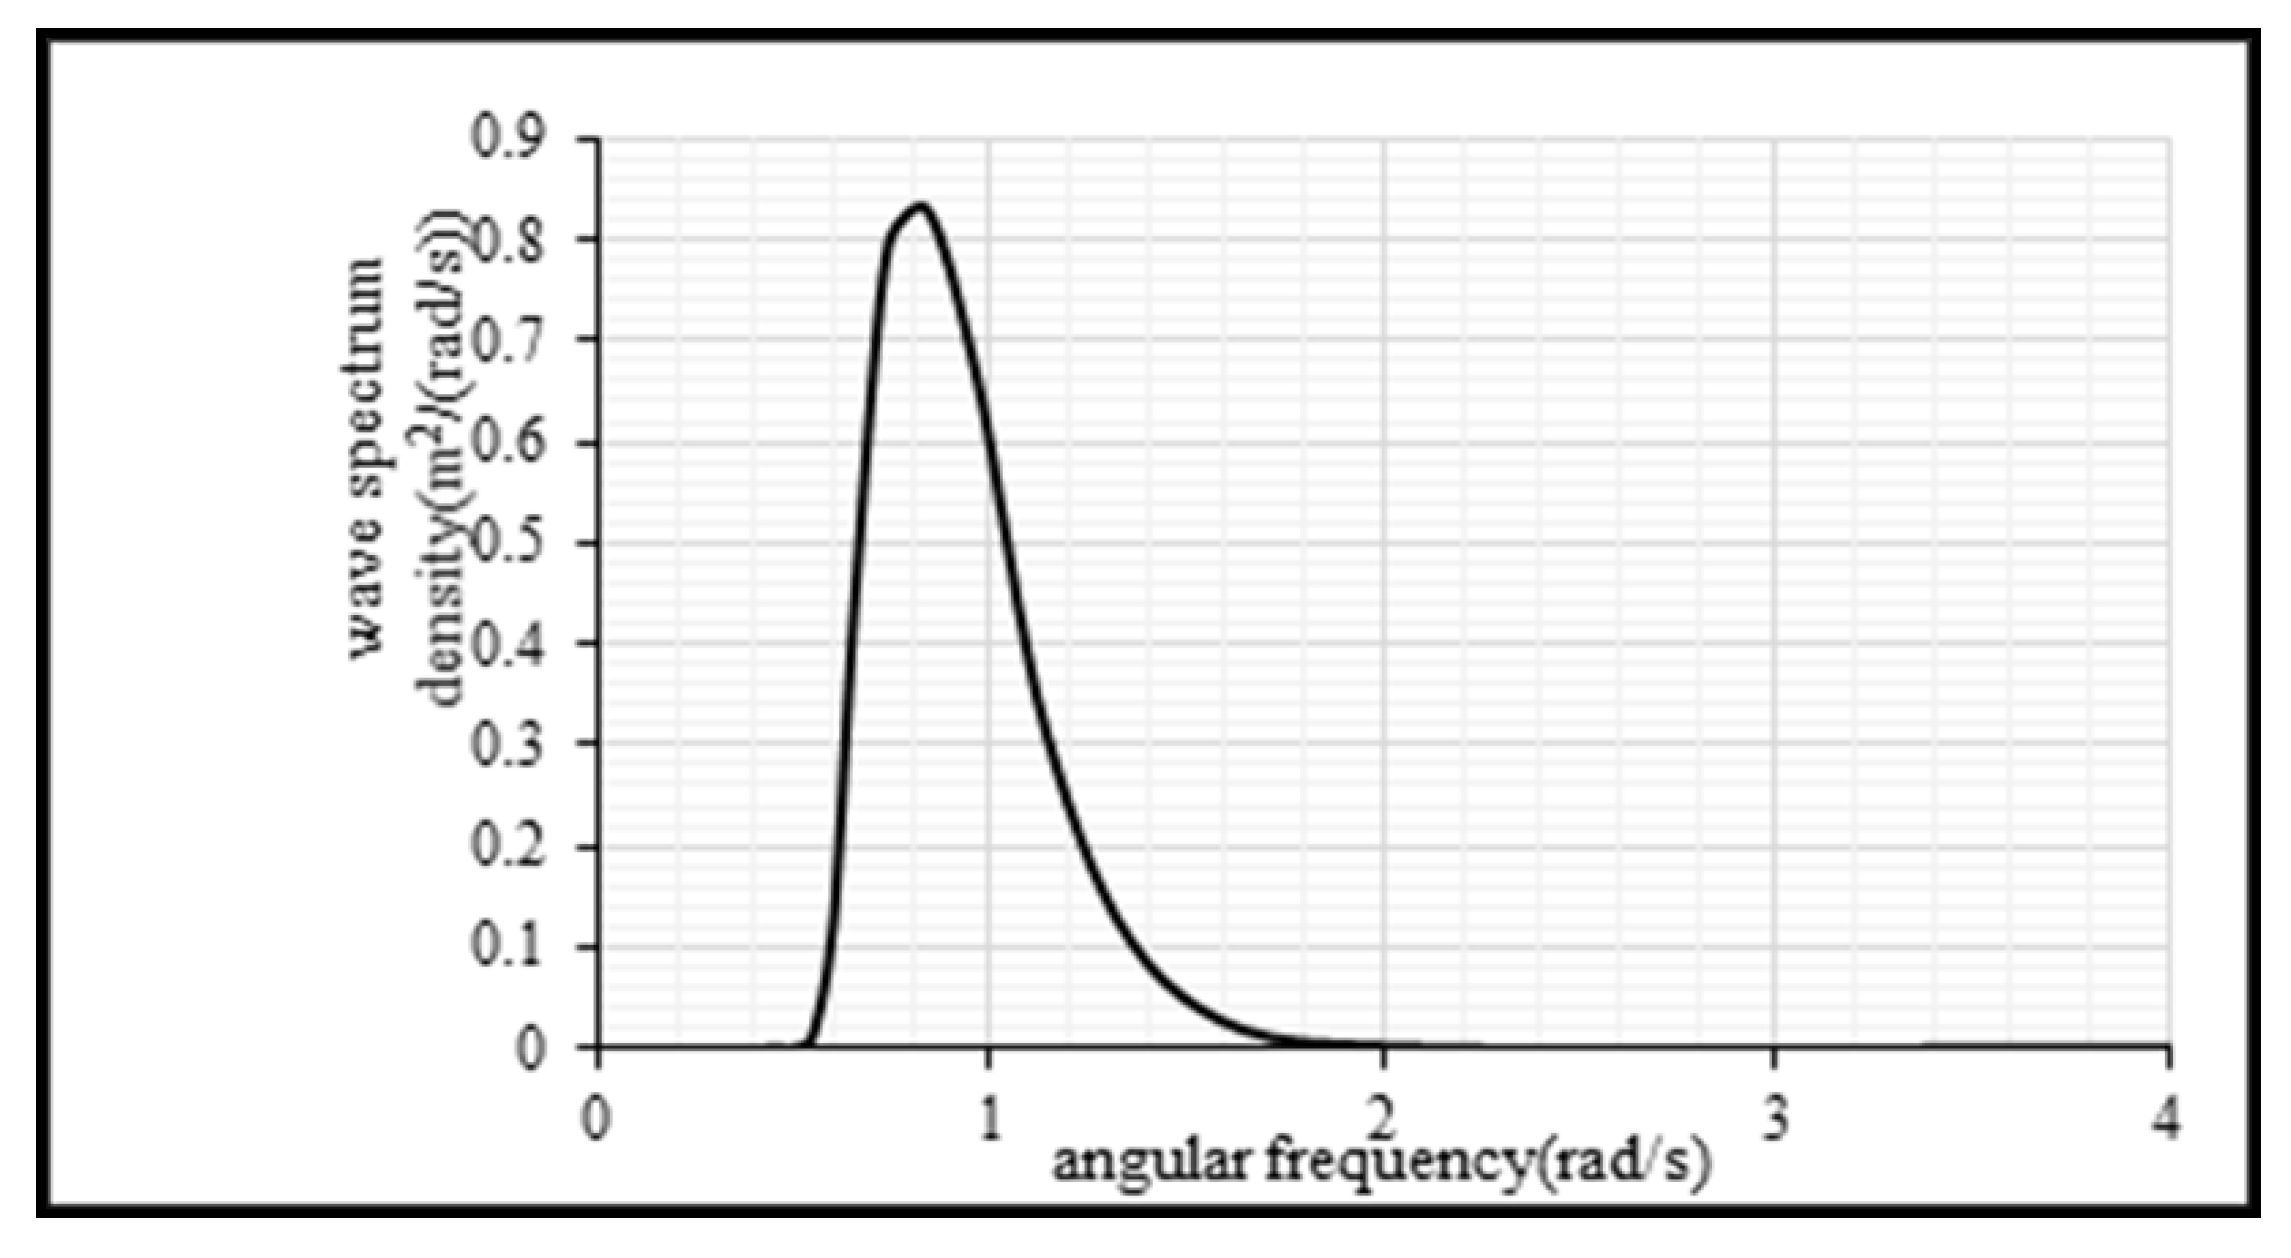
4. Wave Spectrum
5. Absorption Power Spectrum
5.1. Geometry Library Generation Based on Taguchi Design
5.2. Absorption Power Spectrum Calculation
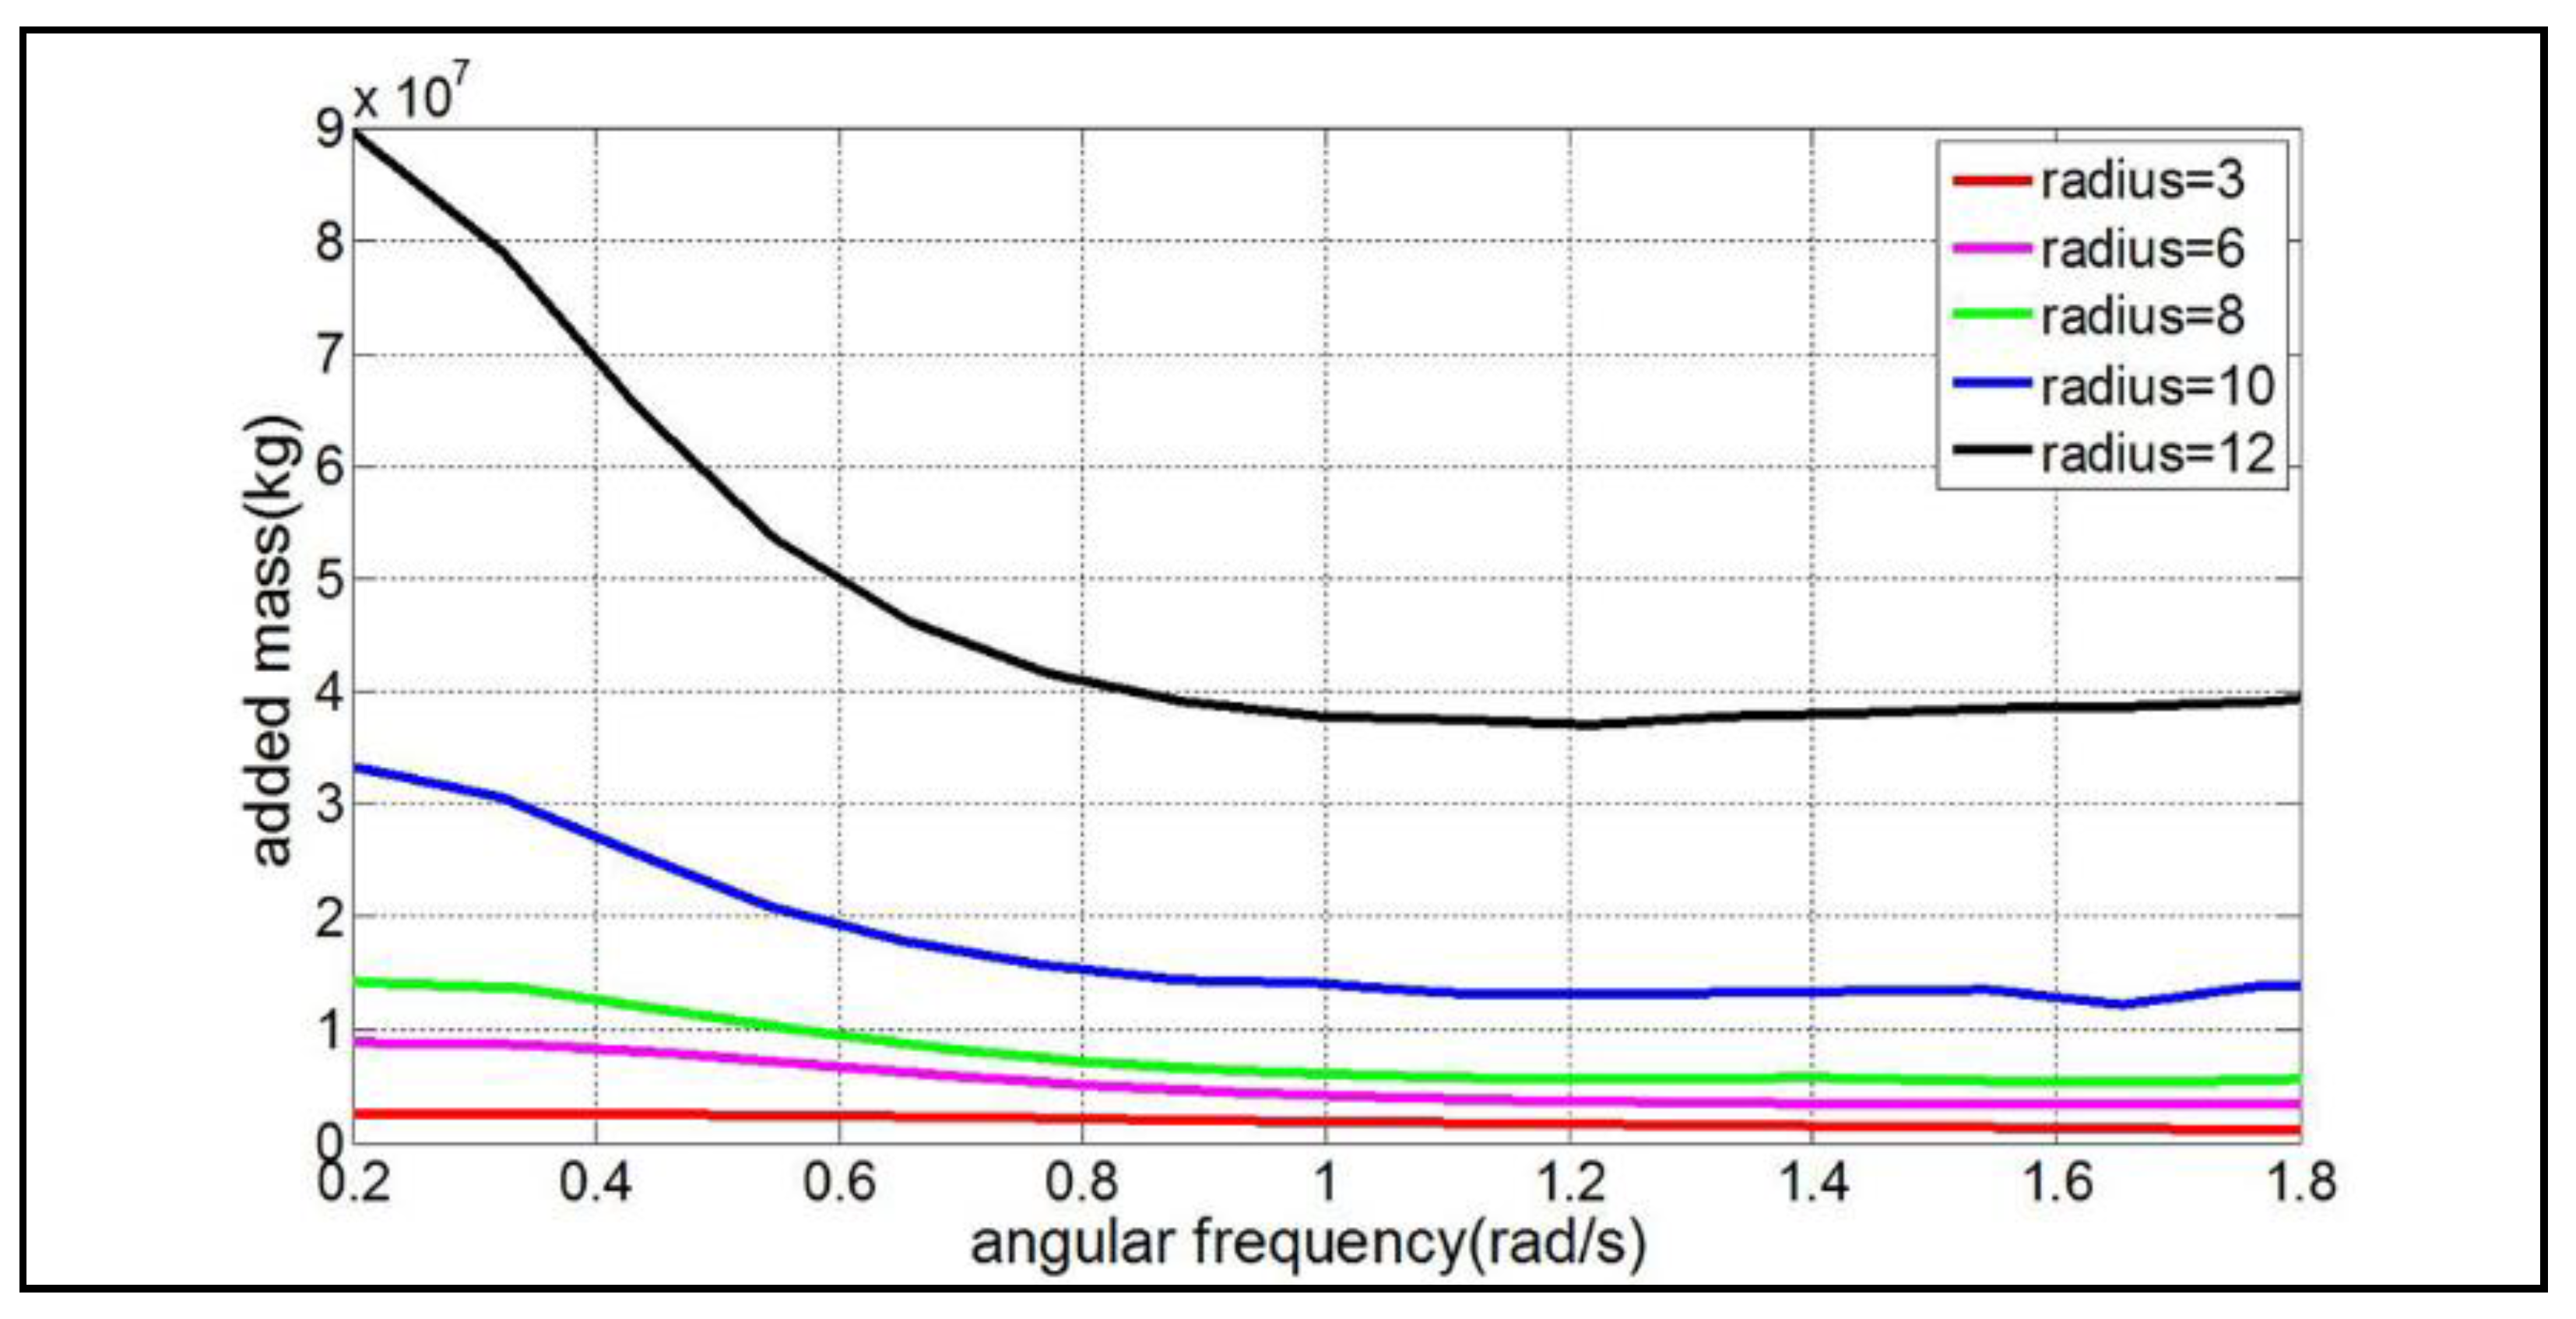
5.2.1. Hydrodynamic Parameters Calculation
5.2.2. Optimal PTO Damping Determination
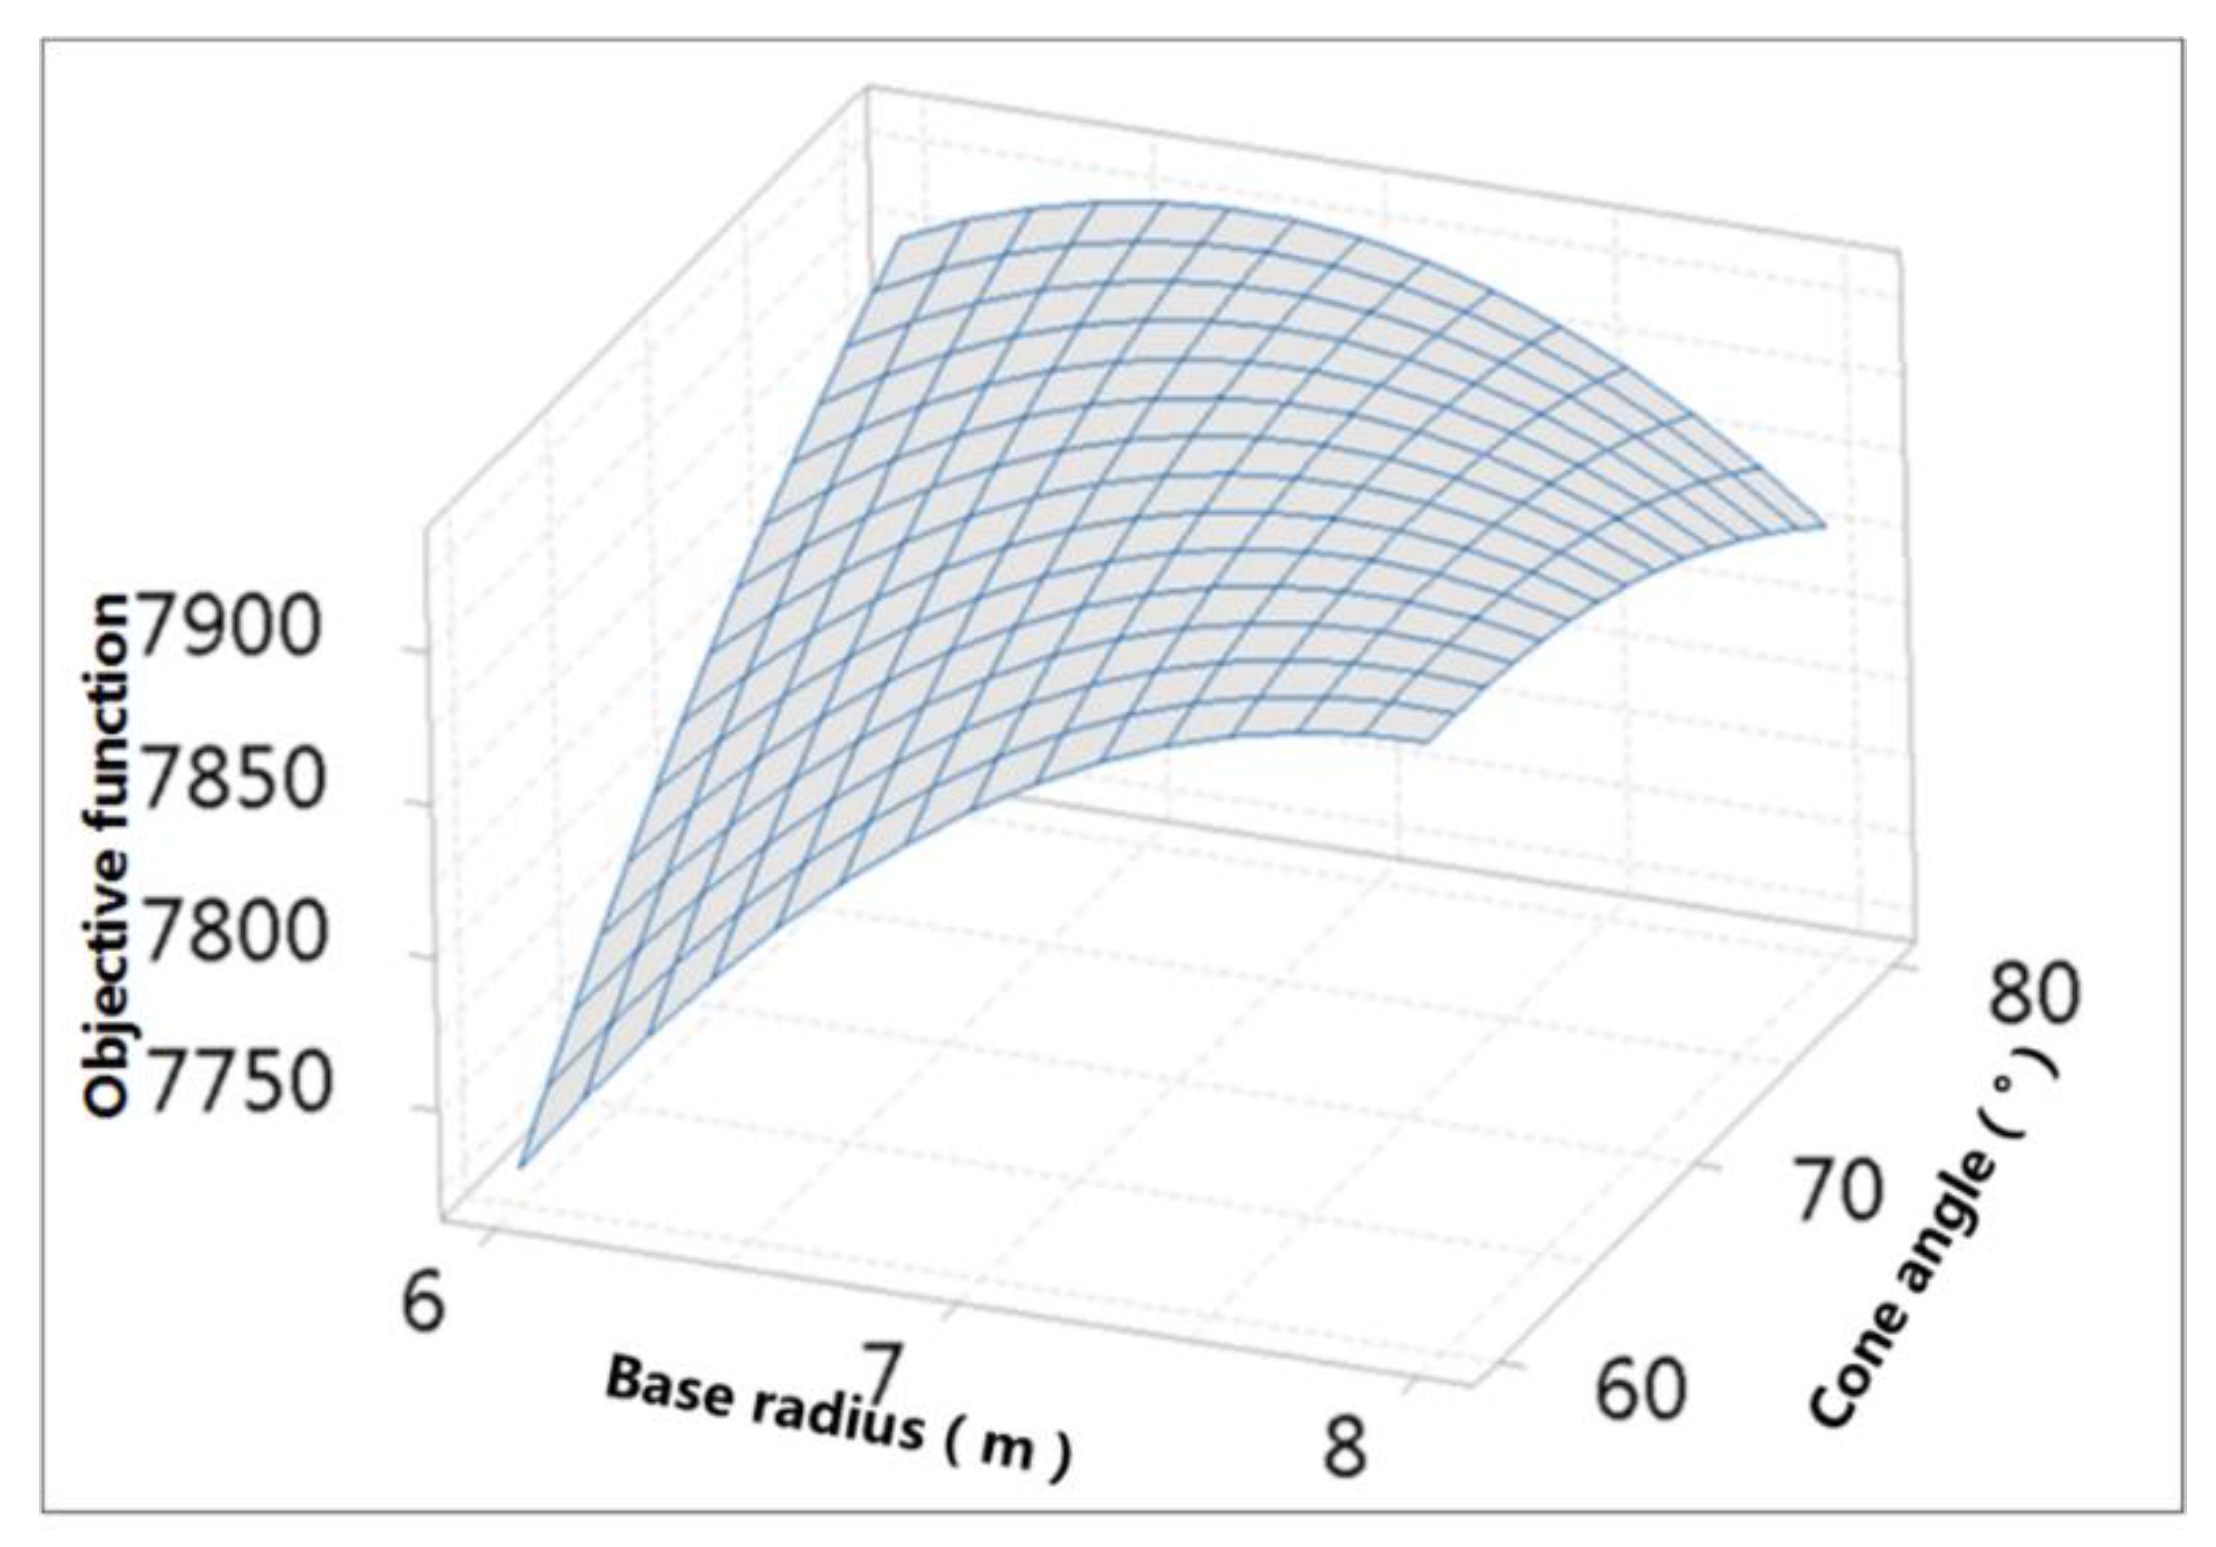
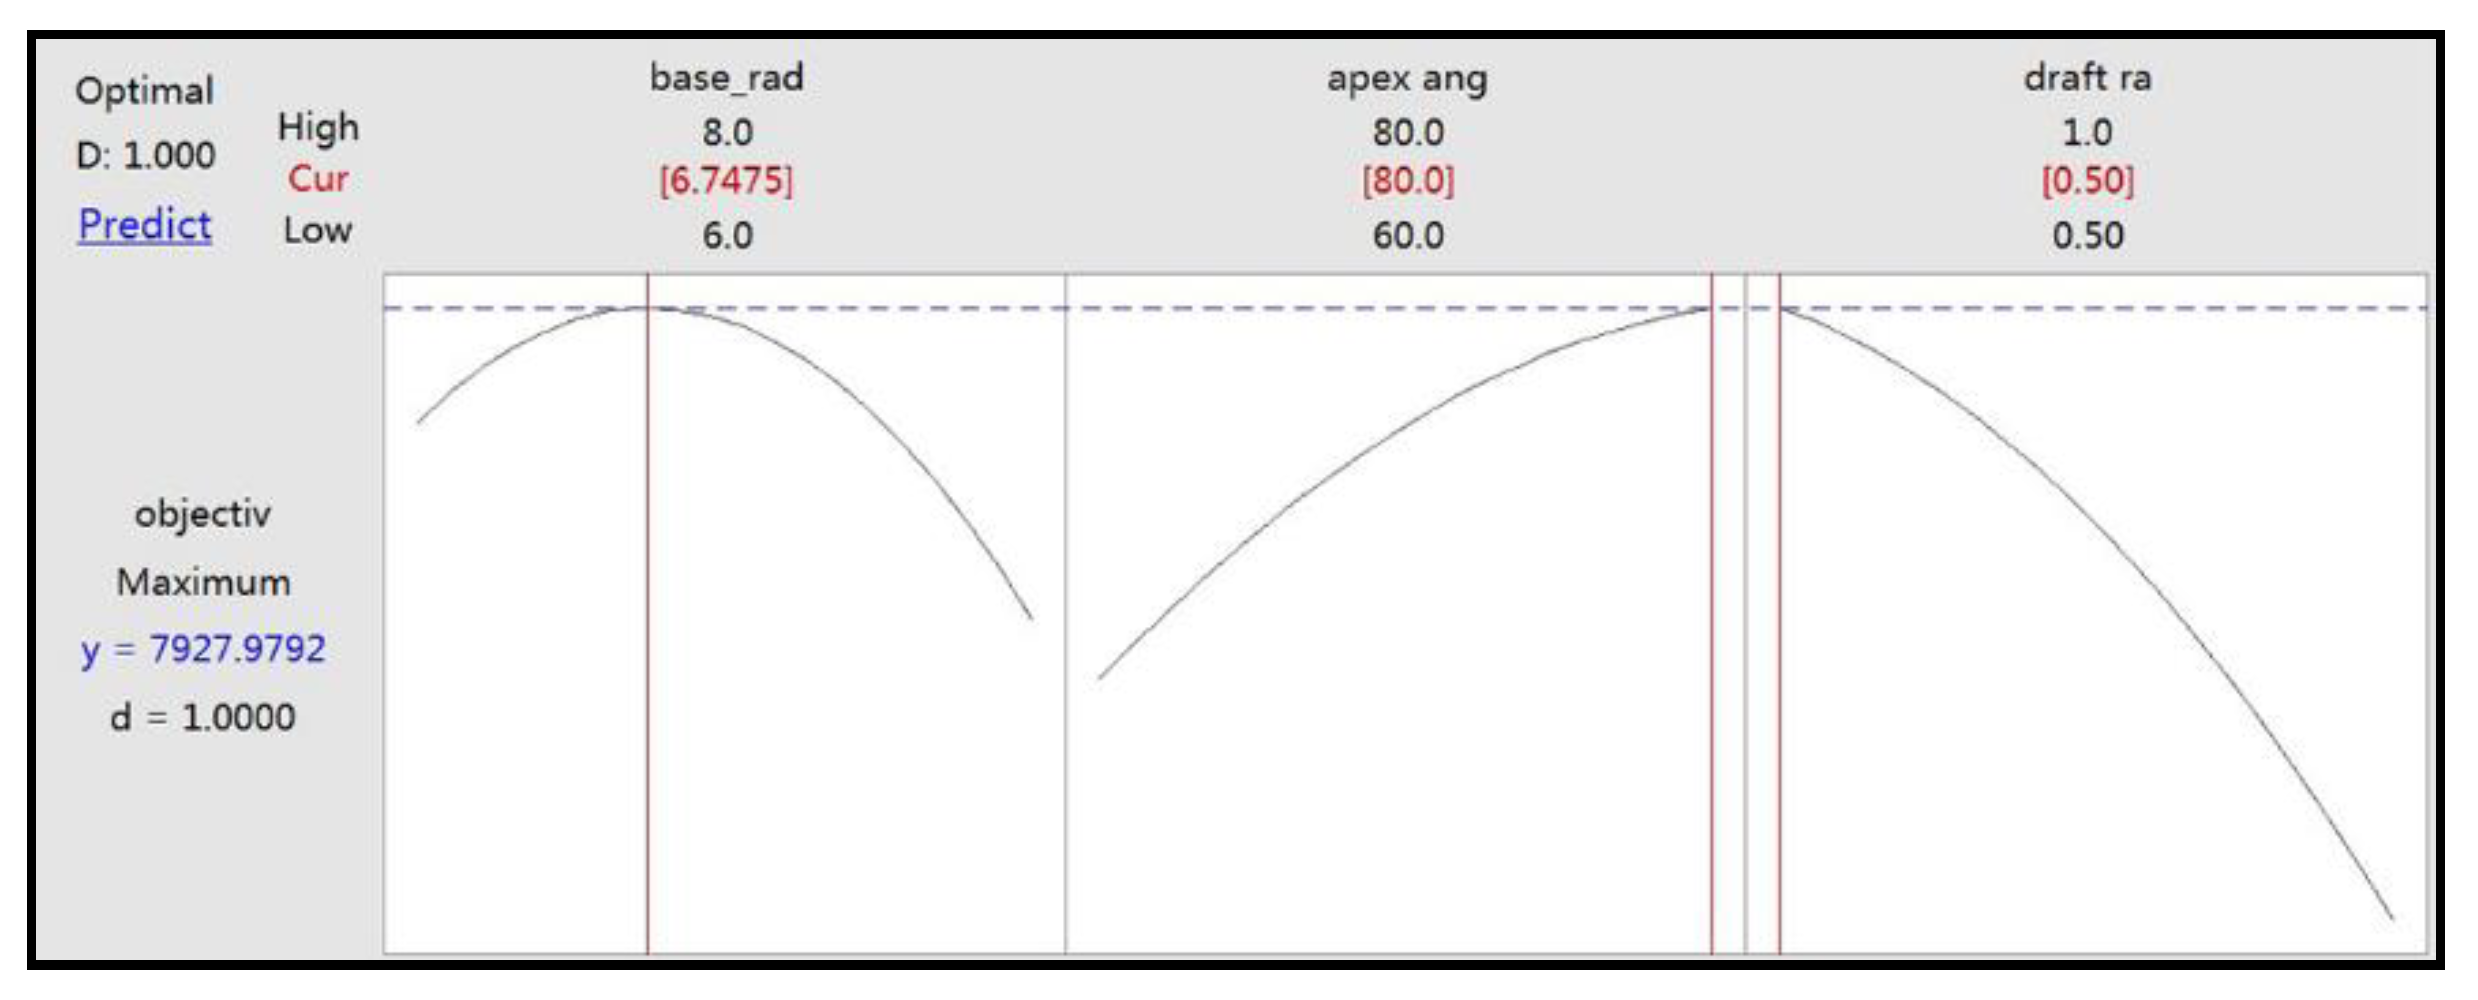
6. Parameter Optimization Based on RSM
7. Results and Discussion
7.1. Optimal Geometry Configuration Analysis
7.2. Performance Characteristic Analysis
7.2.1. Energy Absorption Efficiency
7.2.2. Resonance Frequency
7.2.3. Absorption Bandwidth
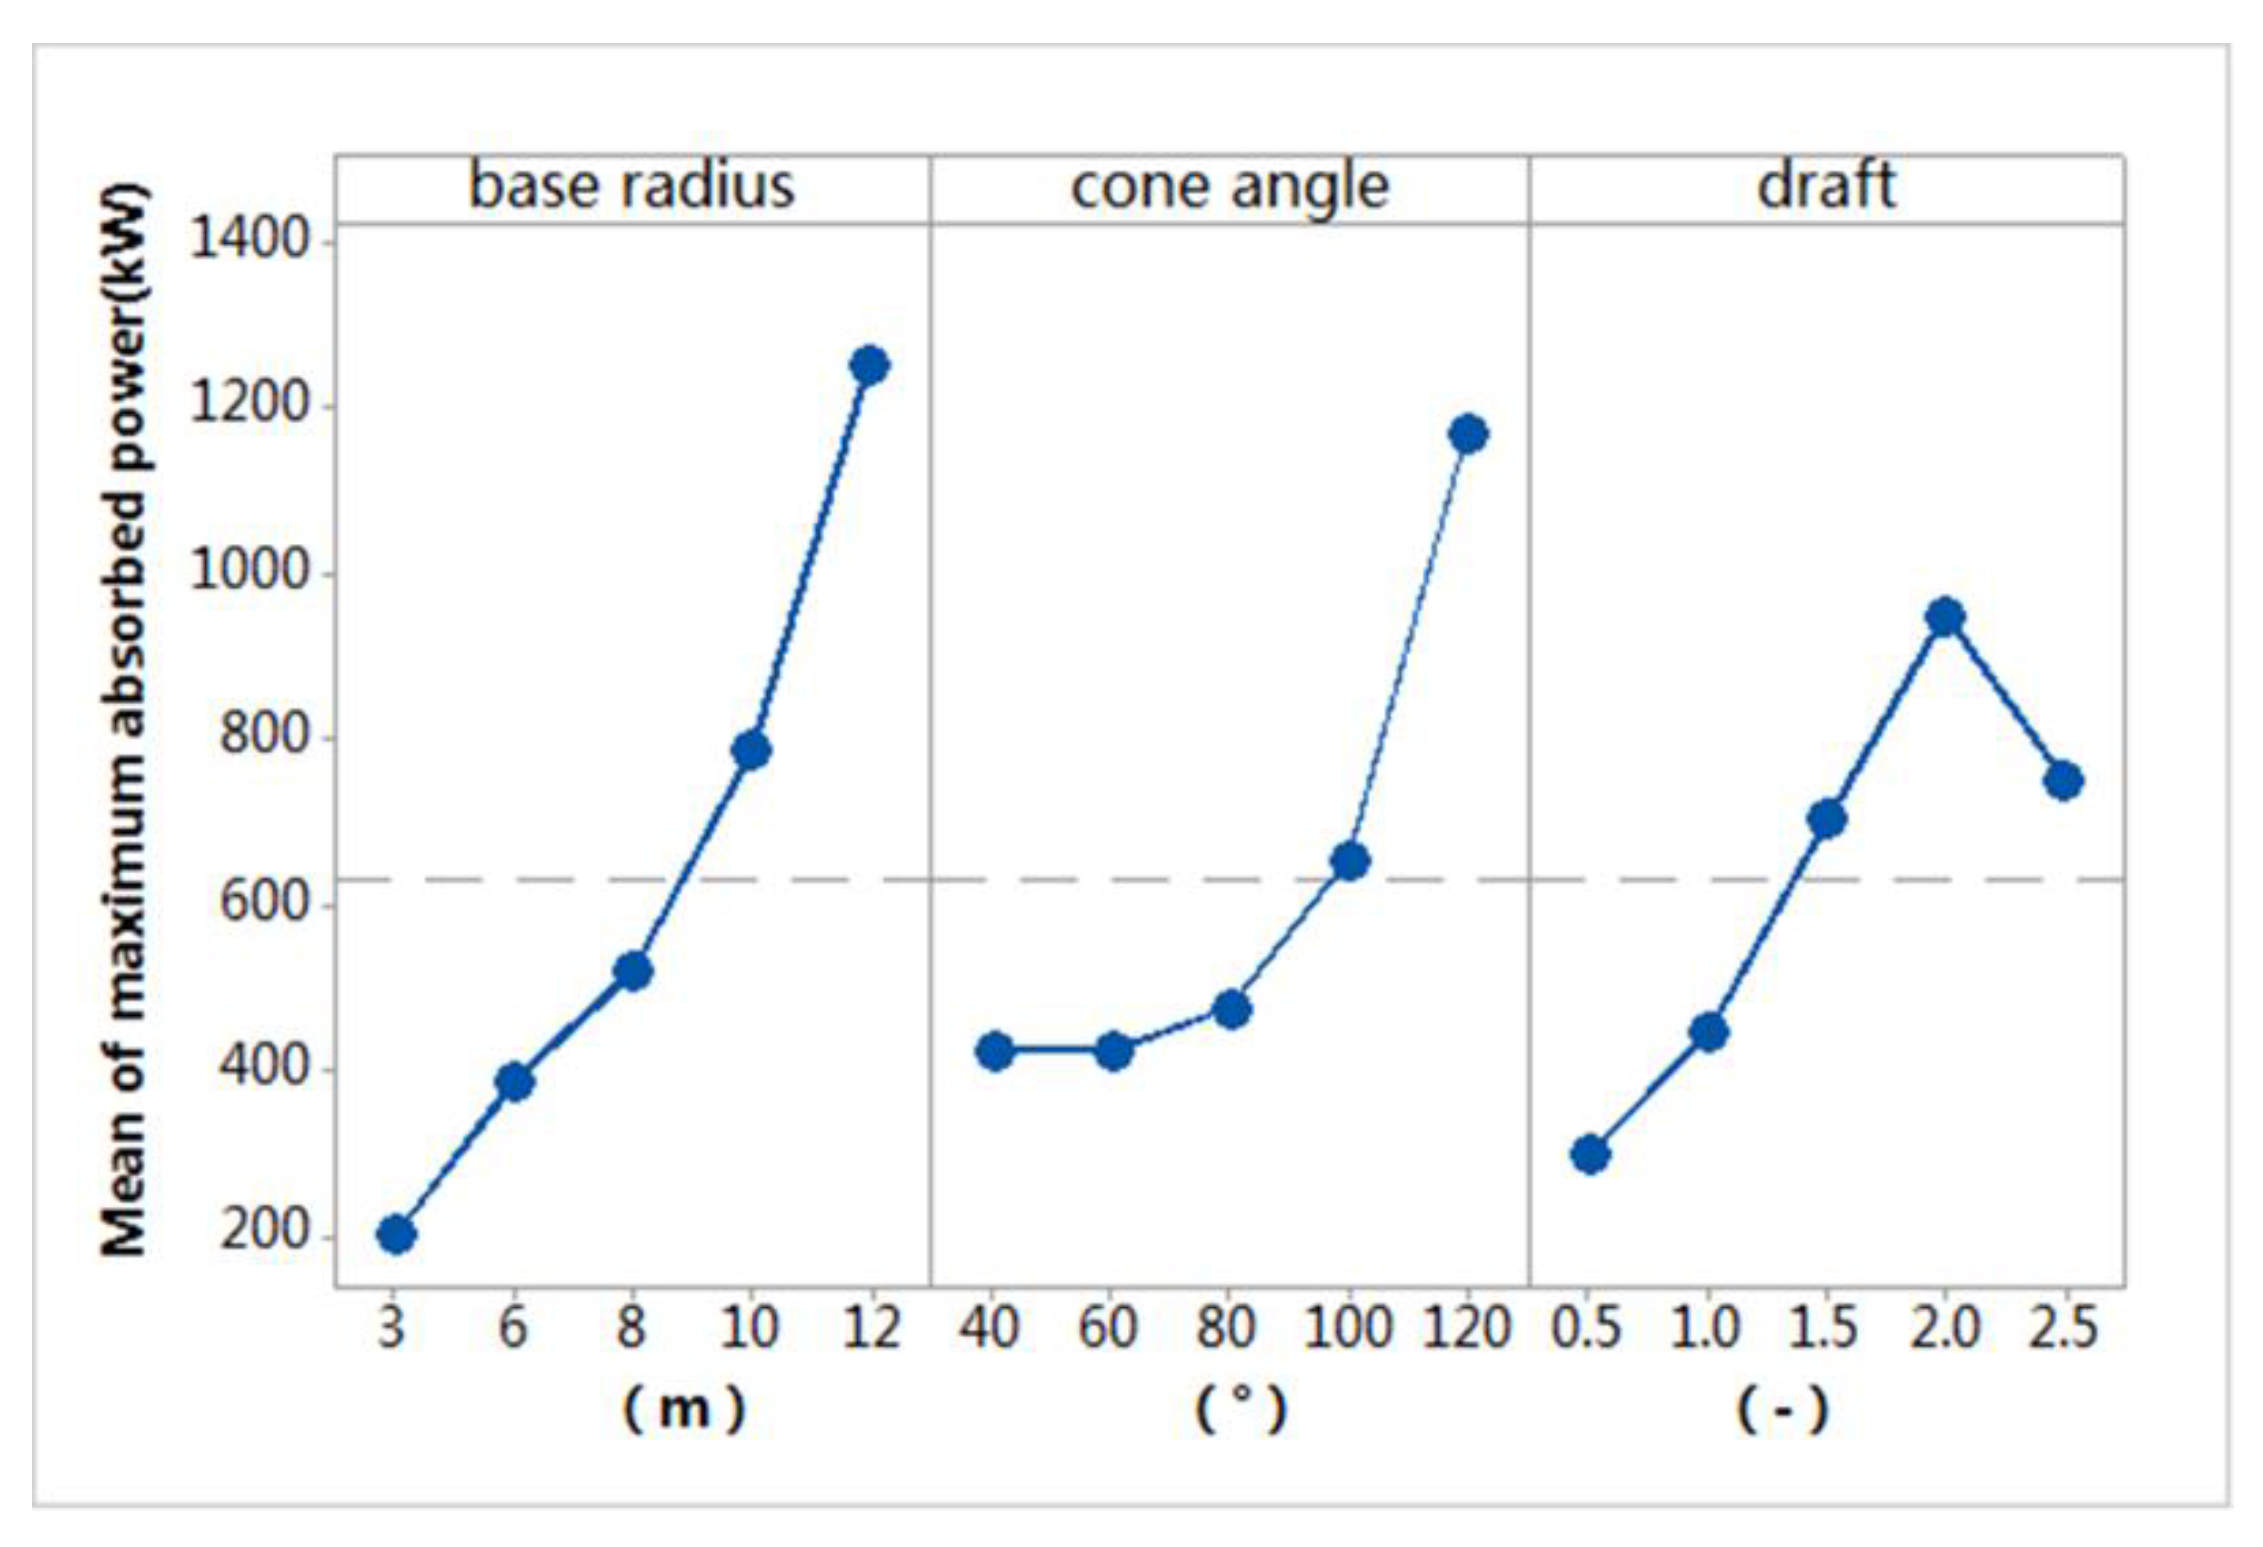
7.2.4. Maximum Absorbed Power
7.2.5. Effects of Adjusting Geometrical Parameters
7.2.6. Effects of Adjusting PTO Damping
8. Conclusions
Author Contributions
Funding
Acknowledgments
Conflicts of Interest
References
- Clément, A.; Mccullen, P.; Falcão, A. Wave energy in Europe: Current status and perspectives. Renew. Sustain. Energy Rev. 2002, 6, 405–431. [Google Scholar] [CrossRef]
- Falcão, F.D.O. Wave energy utilization: A review of the technologies. Renew. Sustain. Energy Rev. 2010, 14, 899–918. [Google Scholar] [CrossRef]
- Viviano, A.; Naty, S.; Foti, E. Scale effects in physical modelling of a generalized OWC. Ocean Eng. 2018, 162, 248–258. [Google Scholar] [CrossRef]
- Naty, S.; Viviano, A.; Foti, E. Feaseability study of a WEC integrated in the port of Giardini Naxos, Italy. Coast. Eng. Proc. 2017, 1, 22. [Google Scholar] [CrossRef]
- Falcão, A.F.O.; Henriques, J.C.C.; Cândido, J.J. Dynamics and optimization of the OWC spar buoy wave energy converter. Renew. Energy 2012, 48, 369–381. [Google Scholar] [CrossRef]
- Gomes, R.P.F.; Henriques, J.C.C.; Gato, L.M.C. IPS 2Body Wave Energy Converter: Acceleration Tube Optimization. Int. J. Offshore Polar Eng. 2010, 20, 247–255. [Google Scholar]
- Martins, J.C.; Goulart, M.M.; Gomes, M.D.N. Geometric evaluation of the main operational principle of an overtopping wave energy converter by means of Constructal Design. Renew. Energy 2018, 118, 727–741. [Google Scholar] [CrossRef]
- Han, Z.; Liu, Z.; Shi, H. Numerical study on overtopping performance of a multi-level breakwater for wave energy conversion. Ocean Eng. 2018, 150, 94–101. [Google Scholar] [CrossRef]
- Penalba, M.; Ringwood, J.V. A Review of Wave-to-Wire Models for Wave Energy Converters. Energies 2016, 9, 506. [Google Scholar] [CrossRef]
- Mccabe, A.P.; Aggidis, G.A.; Widden, M.B. Optimizing the shape of a surge-and-pitch wave energy collector using a genetic algorithm. Renew. Energy 2010, 35, 2767–2775. [Google Scholar] [CrossRef]
- Mccabe, A.P. Constrained optimization of the shape of a wave energy collector by genetic algorithm. Renew. Energy 2013, 51, 274–284. [Google Scholar] [CrossRef]
- Koh, H.J.; Ruy, W.S.; Cho, I.H. Multi-objective optimum design of a buoy for the resonant-type wave energy converter. J. Mar. Sci. Technol. 2015, 20, 53–63. [Google Scholar] [CrossRef]
- Kurniawan, A.; Moan, T. Optimal Geometries for Wave Absorbers Oscillating About a Fixed Axis. IEEE J. Ocean. Eng. 2013, 38, 117–130. [Google Scholar] [CrossRef]
- Khojasteh, D.; Kamali, R. Evaluation of wave energy absorption by heaving point absorbers at various hot spots in Iran seas. Energy 2016, 109, 629–640. [Google Scholar] [CrossRef]
- Liu, Y.; Pastor, J. Power Absorption Modeling and Optimization of a Point Absorbing Wave Energy Converter Using Numerical Method. J. Energy Resour. Technol. 2014, 136, 119–129. [Google Scholar]
- Goggins, J.; Finnegan, W. Shape optimisation of floating wave energy converters for a specified wave energy spectrum. Renew. Energy 2014, 71, 208–220. [Google Scholar] [CrossRef]
- Shami, E.A.; Wang, X.; Zhang, R. A parameter study and optimization of two body wave energy converters. Renew. Energy 2019, 131, 1–13. [Google Scholar] [CrossRef]
- Shadman, M.; Estefen, S.F.; Rodriguez, C.A. A geometrical optimization method applied to a heaving point absorber wave energy converter. Renew. Energy 2018, 115, 533–546. [Google Scholar] [CrossRef]
- López, M.; Taveira-Pinto, F.; Rosa-Santos, P. Influence of the power take-off characteristics on the performance of CECO wave energy converter. Energy 2017, 120, 686–697. [Google Scholar] [CrossRef]
- Kim, B.H.; Wata, J.; Zullah, M.A. Numerical and experimental studies on the PTO system of a novel floating wave energy converter. Renew. Energy 2015, 79, 111–121. [Google Scholar] [CrossRef]
- Gaspar, J.F.; Calvário, M.; Kamarlouei, M.; Soares, C.G. Design tradeoffs of an oil-hydraulic Power Take-Off for Wave Energy Converters. Renew. Energy 2018, 129, 245–259. [Google Scholar] [CrossRef]
- Zhang, X.; Yang, J. Power capture performance of an oscillating-body WEC with nonlinear snap through PTO systems in irregular waves. Appl. Ocean Res. 2015, 52, 261–273. [Google Scholar] [CrossRef]
- Zhang, X.; Tian, X.; Xiao, L.; Li, X.; Chen, L. Application of an adaptive bistable power capture mechanism to a point absorber wave energy converter. Appl. Energy 2018, 228, 450–467. [Google Scholar] [CrossRef]
- Philena, M.; Squibb, C.; Groo, L.; Hagerman, G. Wave energy conversion using fluidic flexible matrix composite power take-off pumps. Energy Convers. Manag. 2018, 171, 1773–1786. [Google Scholar] [CrossRef]
- Zhang, Z.; Chen, B.; Nielsen, S.R.K.; Olsen, J. Gyroscopic power take-off wave energy point absorber in irregular sea states. Ocean Eng. 2017, 143, 113–124. [Google Scholar] [CrossRef]
- Hong, Y.; Waters, R.; Boström, C. Review on electrical control strategies for wave energy converting systems. Renew. Sustain. Energy Rev. 2014, 31, 329–342. [Google Scholar] [CrossRef]
- Ahmed, T.; Nishida, K.; Nakaoka, M. Grid power integration technologies for offshore ocean wave energy. In Proceedings of the Energy Conversion Congress and Exposition, Atlanta, GA, USA, 12–16 September 2010; pp. 2378–2385. [Google Scholar]
- Wang, L.; Isberg, J.; Tedeschi, E. Review of control strategies for wave energy conversion systems and their validation: The wave-to-wire approach. Renew. Sustain. Energy Rev. 2018, 81, 366–379. [Google Scholar] [CrossRef]
- Wu, J.; Yao, Y.; Zhou, L.; Göteman, M. Real-time latching control strategies for the solo Duck wave energy converter in irregular waves. Appl. Energy 2018, 222, 717–728. [Google Scholar] [CrossRef]
- Zhang, X.T.; Yang, J.M.; Xiao, L.F. Declutching control of a point absorber with direct linear electric PTO systems. Ocean Syst. Eng. 2014, 4, 63–82. [Google Scholar] [CrossRef]
- Li, G.; Belmont, M.R. Model predictive control of sea wave energy converters—Part I: A convex approach for the case of a single device. Renew. Energy 2014, 69, 453–463. [Google Scholar] [CrossRef]
- Jama, M.; Wahyudie, A.; Noura, H. Robust predictive control for heaving wave energy converters. Control Eng. Pract. 2018, 77, 138–149. [Google Scholar] [CrossRef]
- Retes, M.P.; Giorgi, G.; Ringwood, J.V. A Review of Non-Linear Approaches for Wave Energy Converter Modelling. In Proceedings of the 11th European Wave and Tidal Energy Conference, Nantes, France, 6–11 September 2015. [Google Scholar]
- Bhinder, M.; Babarit, A.; Gentaz, L. Assessment of viscous damping via 3D-CFD modelling of a Floating Wave Energy Device. In Proceedings of the 9th European Wave and Tidal Energy Conference (EWTEC), Southampton, UK, 5–9 September 2011. [Google Scholar]
- Bailey, H.; Robertson, B.R.D.; Buckham, B.J. Wave-to-wire simulation of a floating oscillating water column wave energy converter. Ocean Eng. 2016, 125, 248–260. [Google Scholar] [CrossRef]
- Birk, L. Application of Constraint Multi-Objective Optimization to the Design of Offshore Structure Hulls. J. Offshore Mech. Arct. Eng. 2009, 131, 403–410. [Google Scholar] [CrossRef]
- Clauss, G.F.; Birk, L. Hydrodynamic shape optimization of large offshore structures. Appl. Ocean Res. 1996, 18, 157–171. [Google Scholar] [CrossRef]
- Li, H. Ocean Wave Energy Converters: Status and Challenges. Energies 2018, 11, 1250. [Google Scholar]
- Devolder, B.; Stratigaki, V.; Troch, P. CFD Simulations of Floating Point Absorber Wave Energy Converter Arrays Subjected to Regular Waves. Energies 2018, 11, 641. [Google Scholar] [CrossRef]
- Zurkinden, A.S.; Ferri, F.; Beatty, S. Non-linear numerical modeling and experimental testing of a point absorber wave energy converter. Ocean Eng. 2014, 78, 11–21. [Google Scholar] [CrossRef]
- Piscopo, V.; Benassai, G.; Cozzolino, L. A new optimization procedure of heaving point absorber hydrodynamic performances. Ocean Eng. 2016, 116, 242–259. [Google Scholar] [CrossRef]
- Price, A.A.E.; Dent, C.J.; Wallace, A.R. On the capture width of wave energy converters. Appl. Ocean Res. 2009, 31, 251–259. [Google Scholar] [CrossRef]
- Cheng, Z.S.; Yang, J.M.; Hu, Z.Q. Frequency/time domain modeling of a direct drive point absorber wave energy converter. Sci. China Phys. Mech. 2014, 57, 311–320. [Google Scholar] [CrossRef]
- Zheng, C.W.; Zhuang, H.; Li, X. Wind energy and wave energy resources assessment in the East China Sea and South China Sea. Sci. China Technol. Sci. 2012, 55, 163–173. [Google Scholar] [CrossRef]
- Zheng, C.W.; Pan, J.; Li, J.X. Assessing the China Sea wind energy and wave energy resources from 1988 to 2009. Ocean Eng. 2013, 65, 39–48. [Google Scholar] [CrossRef]
- Falnes, J. A review of wave-energy extraction. Mar. Struct. 2007, 20, 185–201. [Google Scholar] [CrossRef]
- Shi, H.; Cao, F.; Liu, Z. Theoretical study on the power take-off estimation of heaving buoy wave energy converter. Renew. Energy 2016, 86, 441–448. [Google Scholar] [CrossRef]
- Taguchi, G.; Cariapa, V. Taguchi on Robust Technology Development: Bringing. J. Press. Vess.-Technol. Asme 1993, 115, 161–171. [Google Scholar] [CrossRef]
- Hansen, A.H.; Asmussen, M.F.; Bech, M. Model Predictive Control of a Wave Energy Converter with Discrete Fluid Power Power Take-Off System. Energies 2018, 11, 635. [Google Scholar]
- Beatty, S.; Ferri, F.; Bocking, B. Power Take-Off Simulation for Scale Model Testing of Wave Energy Converters. Energies 2017, 10, 973. [Google Scholar] [CrossRef]
- Falnes, J. Ocean Waves and Oscillating Systems: Linear Interactions Including Wave-Energy Extraction; Cambridge University: Cambridge, UK, 2002. [Google Scholar]
- Verma, P.; Sharma, M.P.; Dwivedi, G. Prospects of bio-based alcohols for Karanja biodiesel production: An optimisation study by Response Surface Methodology. Fuel 2016, 183, 185–194. [Google Scholar] [CrossRef]
- Babarit, A. A database of capture width ratio of wave energy converters. Renew. Energy 2015, 80, 610–628. [Google Scholar] [CrossRef]


| Wave Average Period (s) | ||||||||||||||
|---|---|---|---|---|---|---|---|---|---|---|---|---|---|---|
| 1.5 | 3.5 | 4.5 | 5.5 | 6.5 | 7.5 | 8.5 | 9.5 | 10.5 | 11.5 | 12.5 | 13.5 | 14.5 | ||
| significant wave height (SWH, m) | 10.5 | 0 | 0 | 0 | 0 | 0 | 0 | 0 | 0 | 0 | 0 | 0 | 0 | 0 |
| 9.5 | 0 | 0 | 0 | 0 | 0 | 0 | 0 | 0 | 0 | 0 | 0 | 0 | 0 | |
| 8.5 | 0 | 0 | 0 | 0 | 0 | 0 | 0 | 0 | 0 | 0 | 0 | 0 | 0 | |
| 7.5 | 0 | 0 | 0 | 0 | 0 | 0 | 0 | 0 | 0 | 0 | 0 | 0 | 0 | |
| 6.5 | 0 | 0 | 0 | 0 | 0 | 0 | 0 | 1 | 9 | 2 | 0 | 0 | 0 | |
| 5.5 | 0 | 0 | 0 | 0 | 0 | 0 | 28 | 54 | 24 | 1 | 0 | 0 | 0 | |
| 4.5 | 0 | 0 | 0 | 0 | 0 | 50 | 373 | 240 | 37 | 7 | 0 | 0 | 0 | |
| 3.5 | 0 | 0 | 0 | 0 | 163 | 1317 | 950 | 436 | 86 | 0 | 0 | 0 | 0 | |
| 2.5 | 0 | 0 | 0 | 874 | 4743 | 2891 | 1459 | 546 | 54 | 0 | 0 | 0 | 0 | |
| 1.5 | 0 | 19 | 3720 | 9300 | 5011 | 2925 | 1131 | 149 | 7 | 1 | 0 | 0 | 0 | |
| 0.5 | 531 | 4859 | 11,299 | 6525 | 3159 | 997 | 189 | 38 | 3 | 2 | 0 | 0 | 0 | |
| Wave Average Period (s) | ||||||||||||||
|---|---|---|---|---|---|---|---|---|---|---|---|---|---|---|
| 1.5 | 3.5 | 4.5 | 5.5 | 6.5 | 7.5 | 8.5 | 9.5 | 10.5 | 11.5 | 12.5 | 13.5 | 14.5 | ||
| significant wave height (SWH, m) | 10.5 | 0 | 0 | 0 | 0 | 0 | 0 | 0 | 0 | 0 | 0 | 0 | 0 | 0 |
| 9.5 | 0 | 0 | 0 | 0 | 0 | 0 | 0 | 0 | 0 | 0 | 0 | 0 | 0 | |
| 8.5 | 0 | 0 | 0 | 0 | 0 | 0 | 0 | 0 | 0 | 0 | 0 | 0 | 0 | |
| 7.5 | 0 | 0 | 0 | 0 | 0 | 0 | 0 | 0 | 0 | 0 | 0 | 0 | 0 | |
| 6.5 | 0 | 0 | 0 | 0 | 0 | 0 | 0 | 196 0.0% | 1959 0.3% | 476 0.1% | 0 | 0 | 0 | |
| 5.5 | 0 | 0 | 0 | 0 | 0 | 0 | 3533 0.6% | 7616 1.2% | 3741 0.6% | 170 0.0% | 0 | 0 | 0 | |
| 4.5 | 0 | 0 | 0 | 0 | 0 | 3727 0.6% | 31,510 5.1% | 22,660 3.7% | 3861 0.6% | 800 0.1% | 0 | 0 | 0 | |
| 3.5 | 0 | 0 | 0 | 0 | 6370 1% | 59,386 9.6% | 48,549 7.8% | 24,902 4% | 5429 0.9% | 0 | 0 | 0 | 0 | |
| 2.5 | 0 | 0 | 0 | 14,745 2.4% | 94,569 15.2% | 66,511 10.7% | 38,042 6.1% | 15,911 2.6% | 1739 0.6% | 0 | 0 | 0 | 0 | |
| 1.5 | 0 | 74 0.0% | 18,486 3% | 56,485 9.1% | 35,969 5.8% | 24,226 3.9% | 10,616 1.7% | 1563 0.3% | 81 0.0% | 12 0.0% | 0 | 0 | 0 | |
| 0.5 | 98 0.0% | 2087 0.3% | 6239 1% | 4403 0.7% | 2519 0.4% | 917 0.1% | 197 0.0% | 44 0.0% | 3 0.0% | 2 0.0% | 0 | 0 | 0 | |
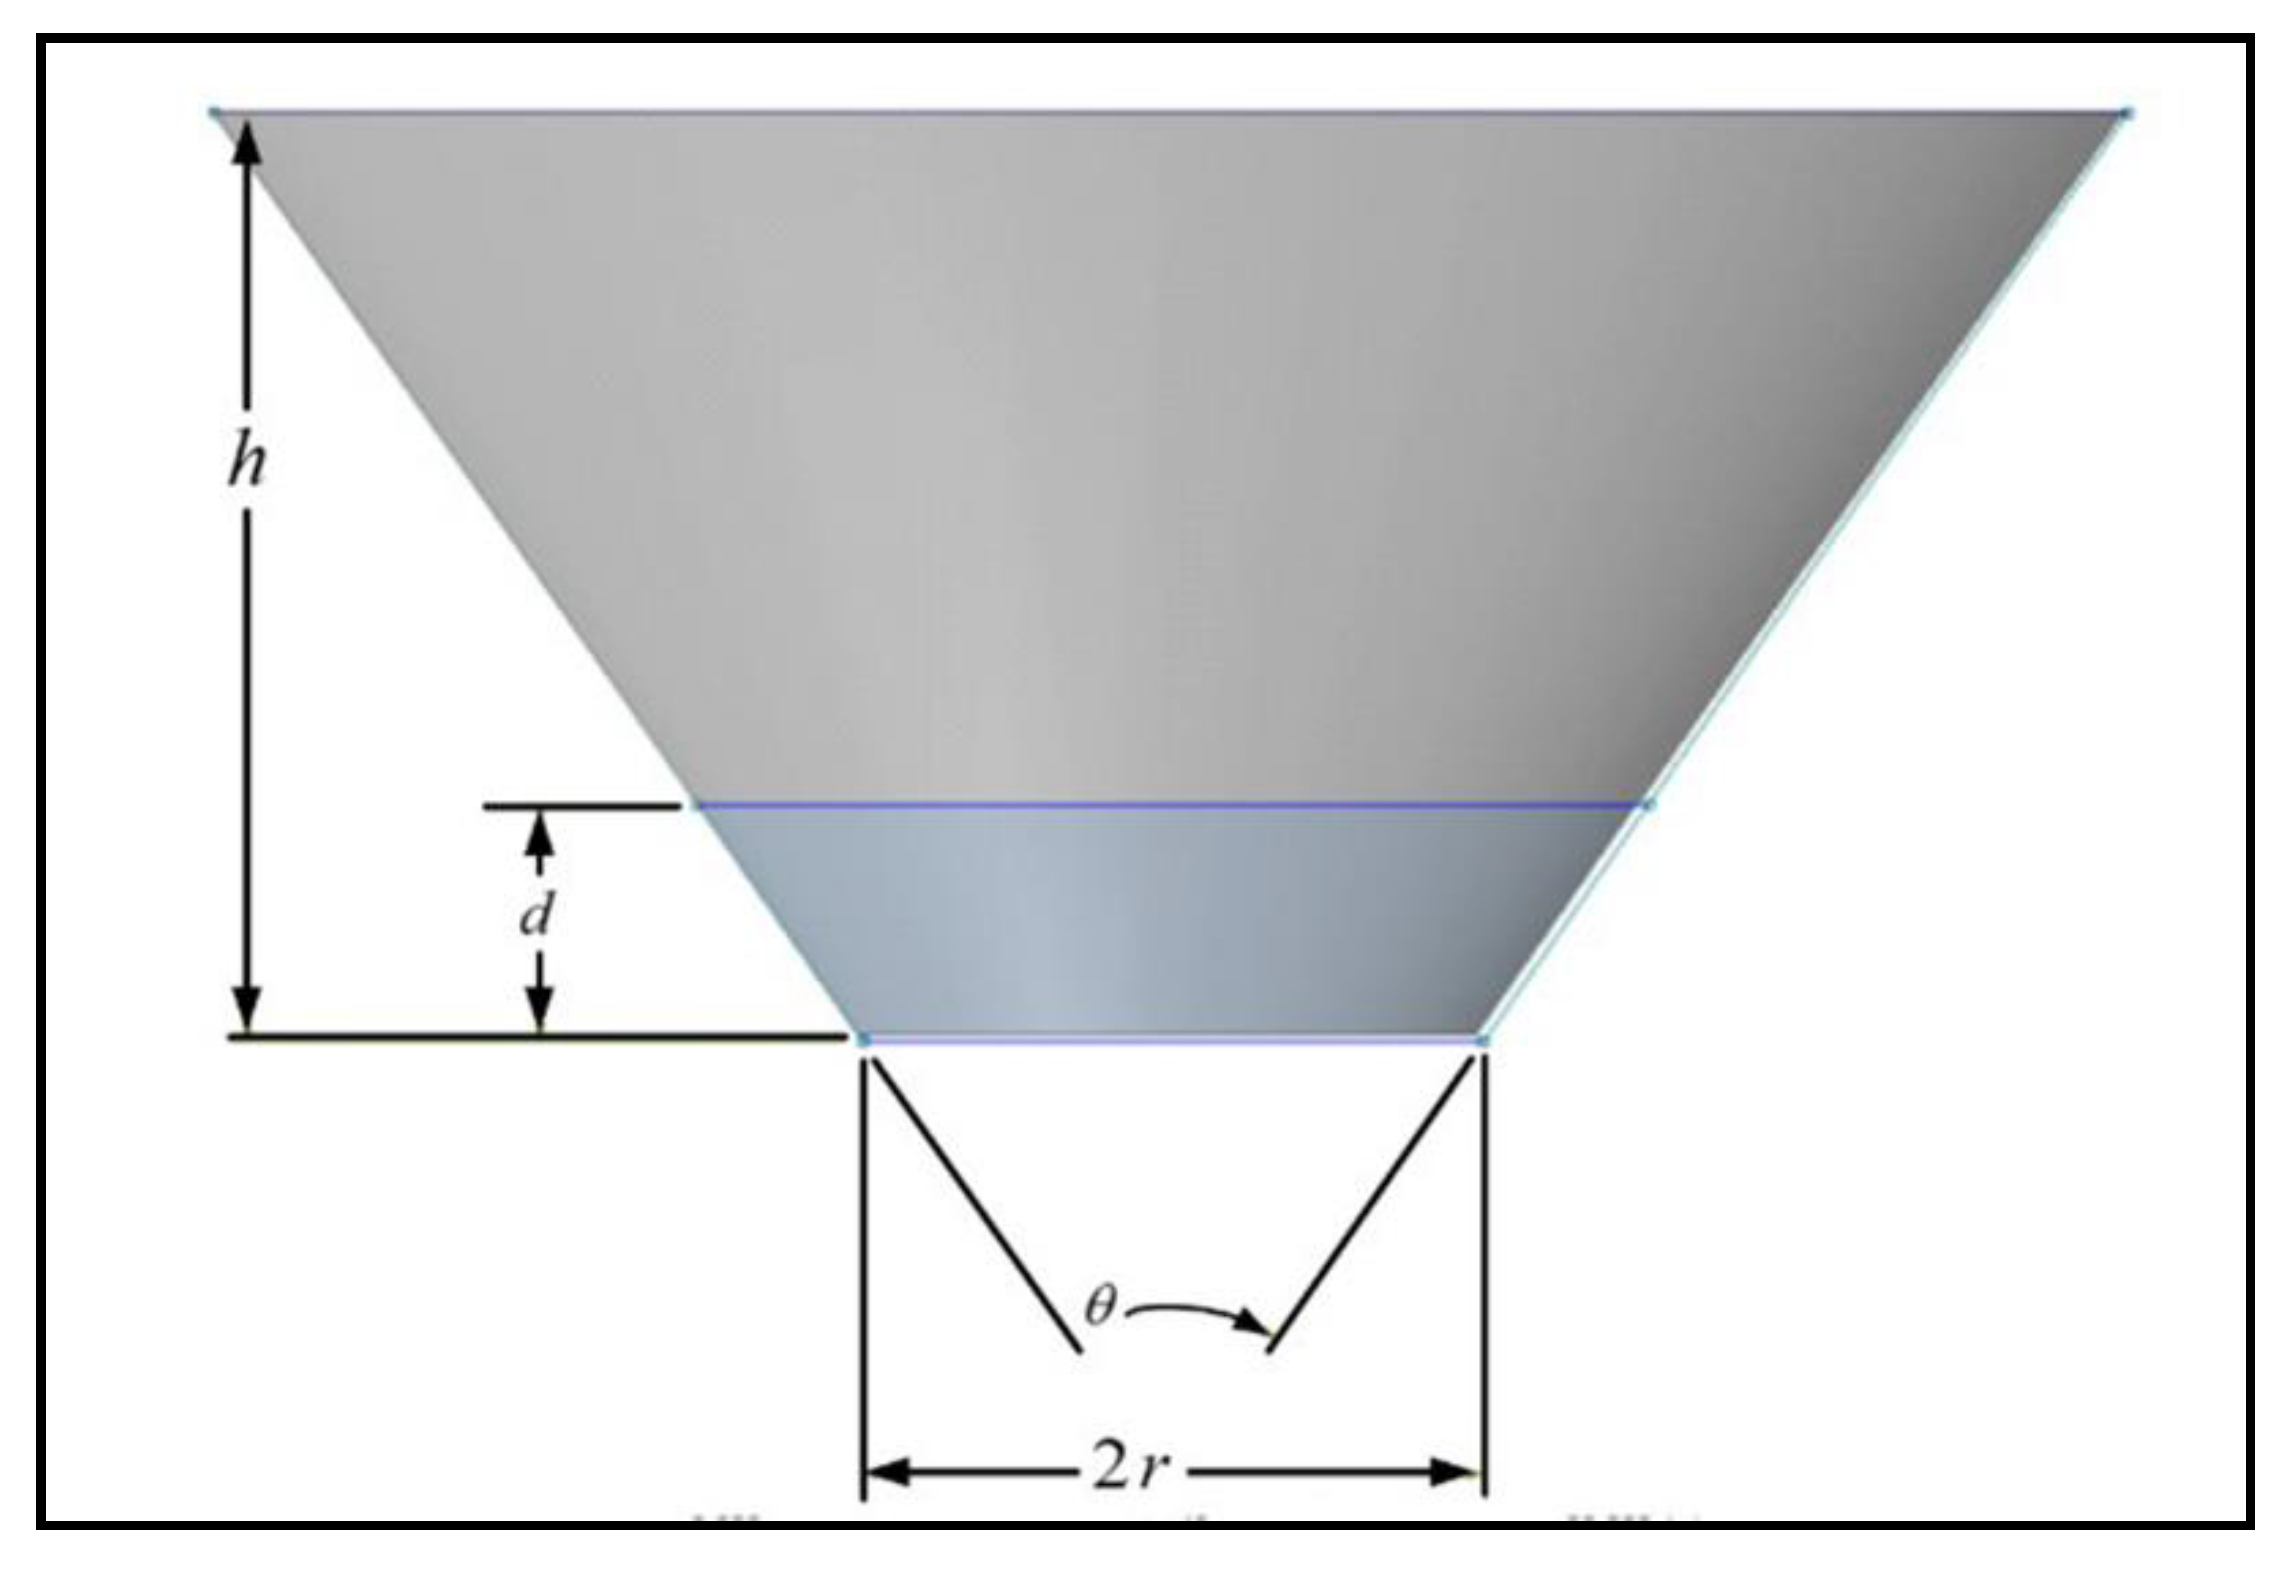
| Geometrical Parameter | Minimum | Maximum |
|---|---|---|
| Base radius (r) | 3 (m) | 12 (m) |
| Cone angle () | 40° | 120° |
| Draft () | 0.5r | 2.5r |
| Buoy ID | Base Radius (m) | Cone Angle (°) | Draft Ratio (d/r) | CoG (m) | CoB (m) |
|---|---|---|---|---|---|
| 1 | 3 | 40 | 0.5 | −0.9 | −0.7 |
| 2 | 3 | 60 | 1 | −1.8 | −1.28 |
| 3 | 3 | 80 | 1.5 | −2.7 | −1.7 |
| 4 | 3 | 100 | 2 | −3.6 | −2 |
| 5 | 3 | 120 | 2.5 | −4.5 | −2.26 |
| 6 | 6 | 40 | 1 | −3.6 | −2.7 |
| 7 | 6 | 60 | 1.5 | −5.4 | −3.62 |
| 8 | 6 | 80 | 2 | −7.2 | −4.3 |
| 9 | 6 | 100 | 2.5 | −9 | −4.8 |
| 10 | 6 | 120 | 0.5 | −1.8 | −1.2 |
| 11 | 8 | 40 | 1.5 | −7.2 | −5.2 |
| 12 | 8 | 60 | 2 | −9.6 | −6.1 |
| 13 | 8 | 80 | 2.5 | −12 | −6.9 |
| 14 | 8 | 100 | 0.5 | −2.4 | −1.7 |
| 15 | 8 | 120 | 1 | −4.8 | −2.8 |
| 16 | 10 | 40 | 2 | −12 | −8.3 |
| 17 | 10 | 60 | 2.5 | −15 | −9.2 |
| 18 | 10 | 80 | 0.5 | −3 | −2.2 |
| 19 | 10 | 100 | 1 | −6 | −3.8 |
| 20 | 10 | 120 | 1.5 | −9 | −4.9 |
| 21 | 12 | 40 | 2.5 | −18 | −12 |
| 22 | 12 | 60 | 0.5 | −3.6 | −2.8 |
| 23 | 12 | 80 | 1 | −7.2 | −4.9 |
| 24 | 12 | 100 | 1.5 | −10.8 | −6.4 |
| 25 | 12 | 120 | 2 | −14.4 | −7.5 |
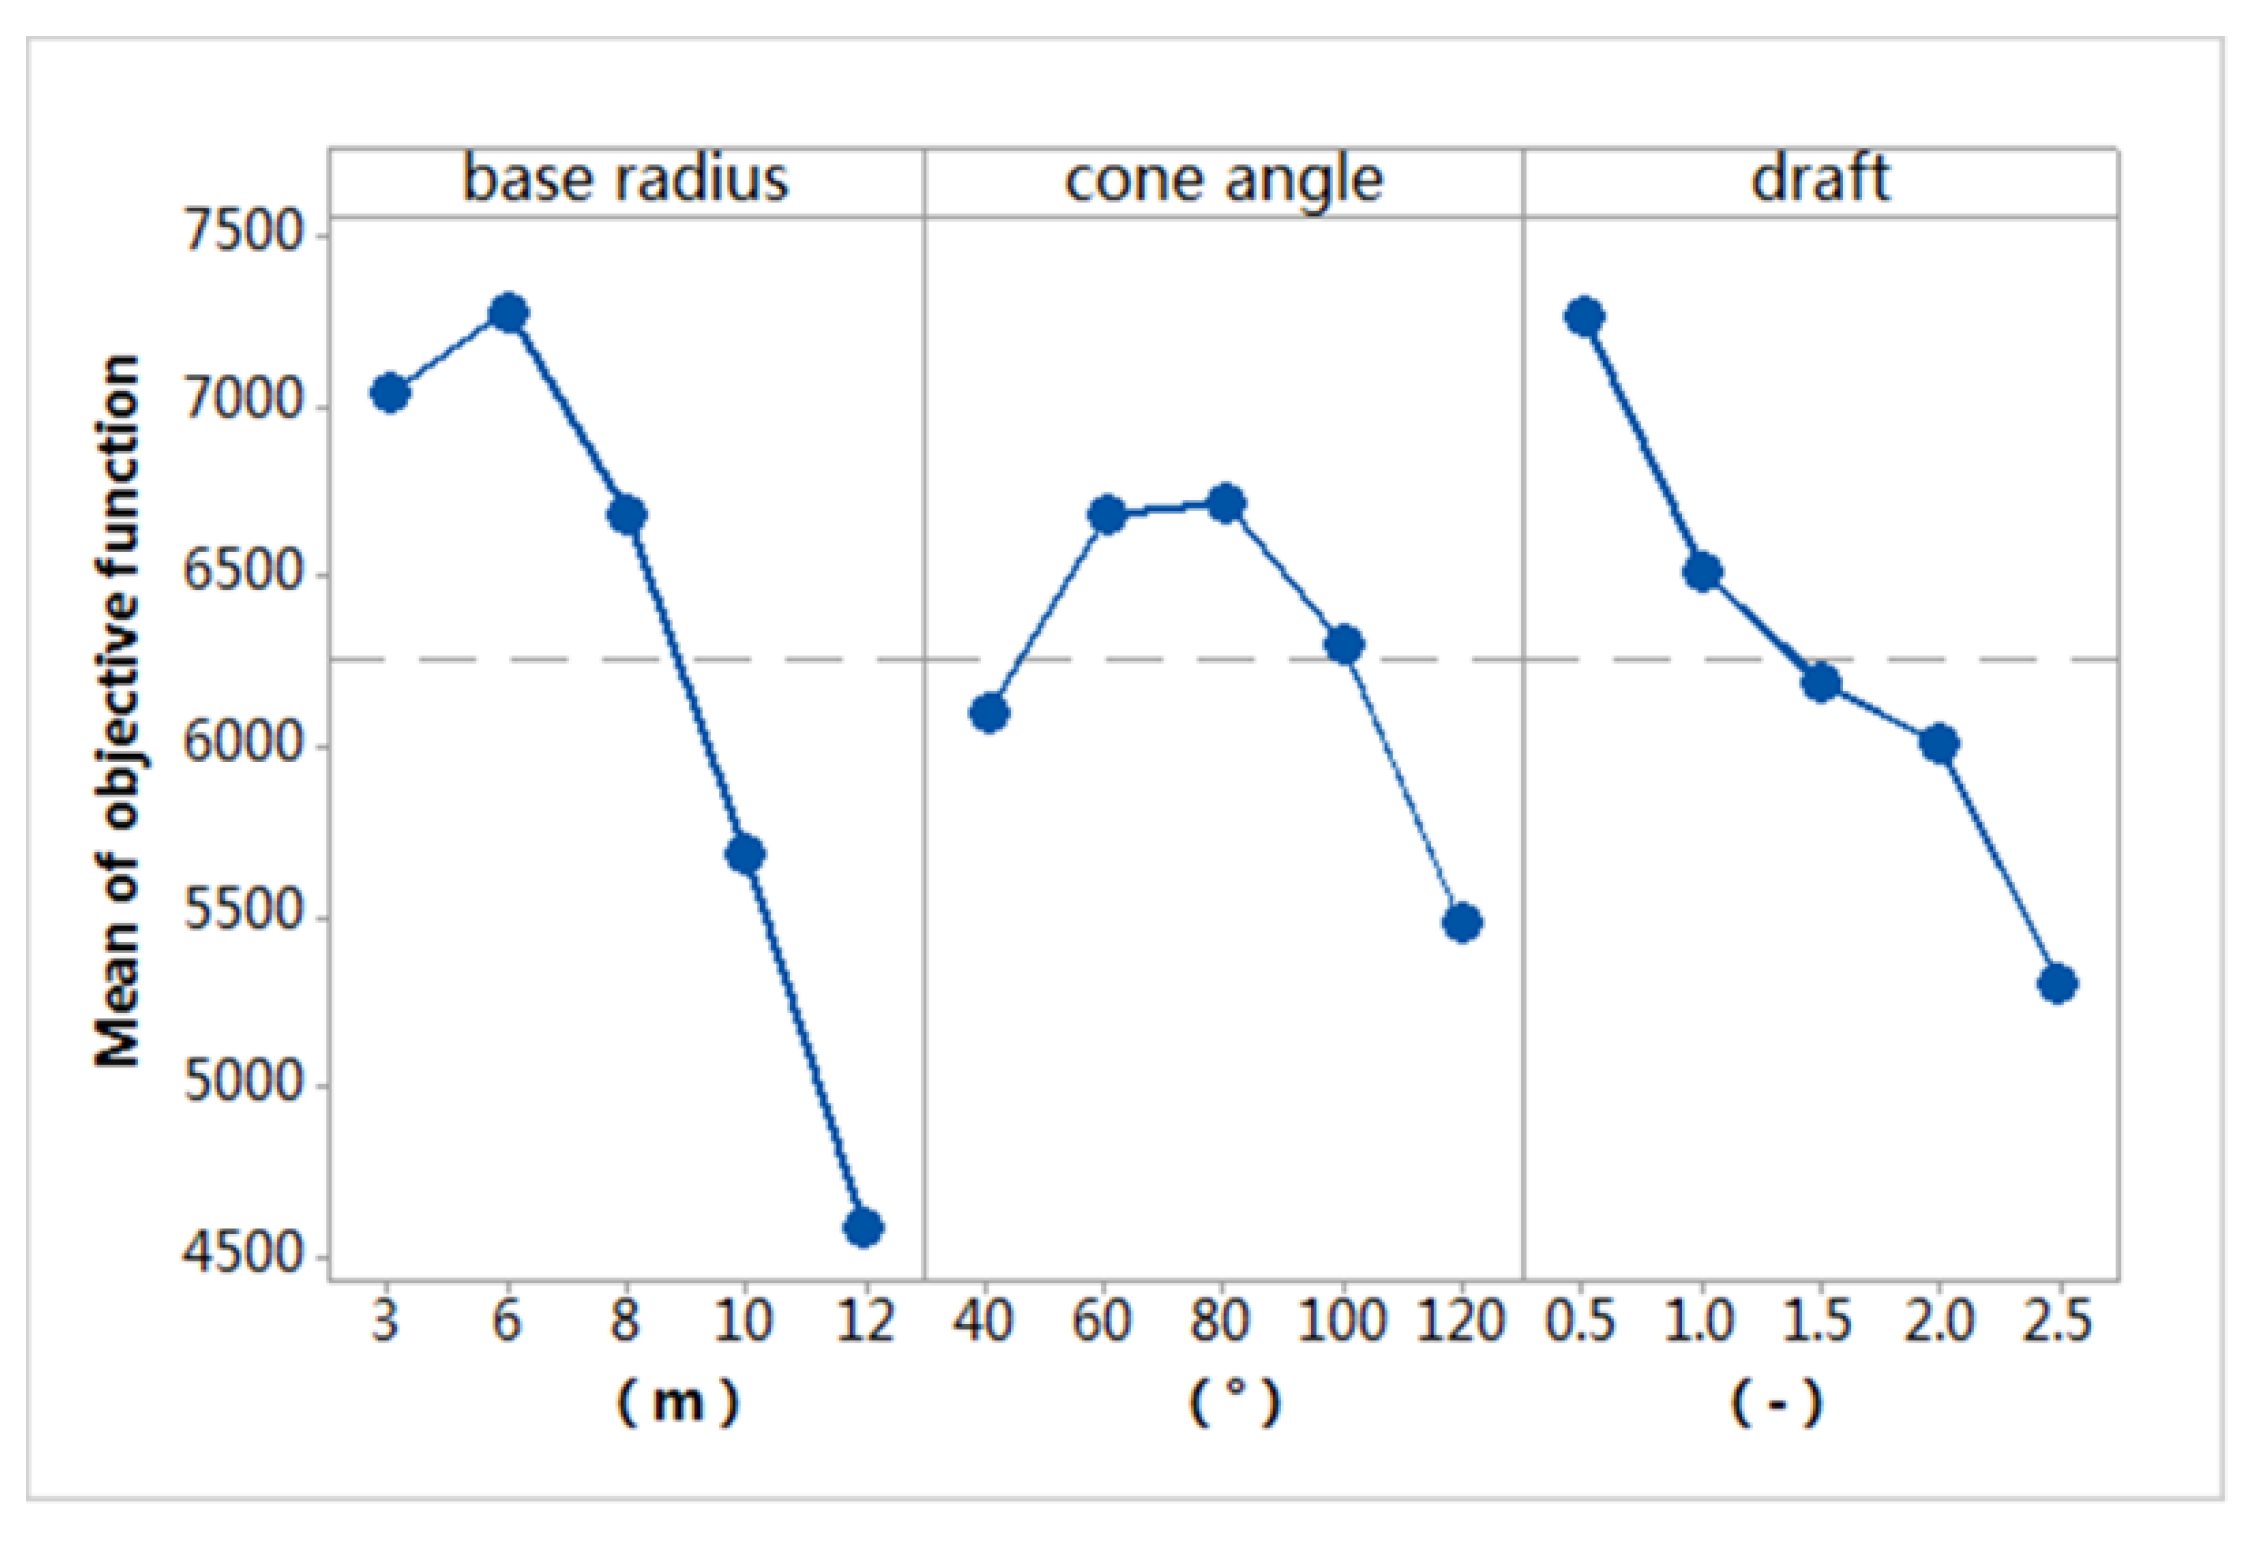
| Base Radius | Cone Angle | Draft | |
|---|---|---|---|
| Maximum | 7282 | 6683 | 7264 |
| Minimum | 4591 | 5484 | 5310 |
| Range | 2691 | 1237 | 1954 |
| Percentage | 46% | 21% | 33% |
| Rank | 1 | 3 | 2 |
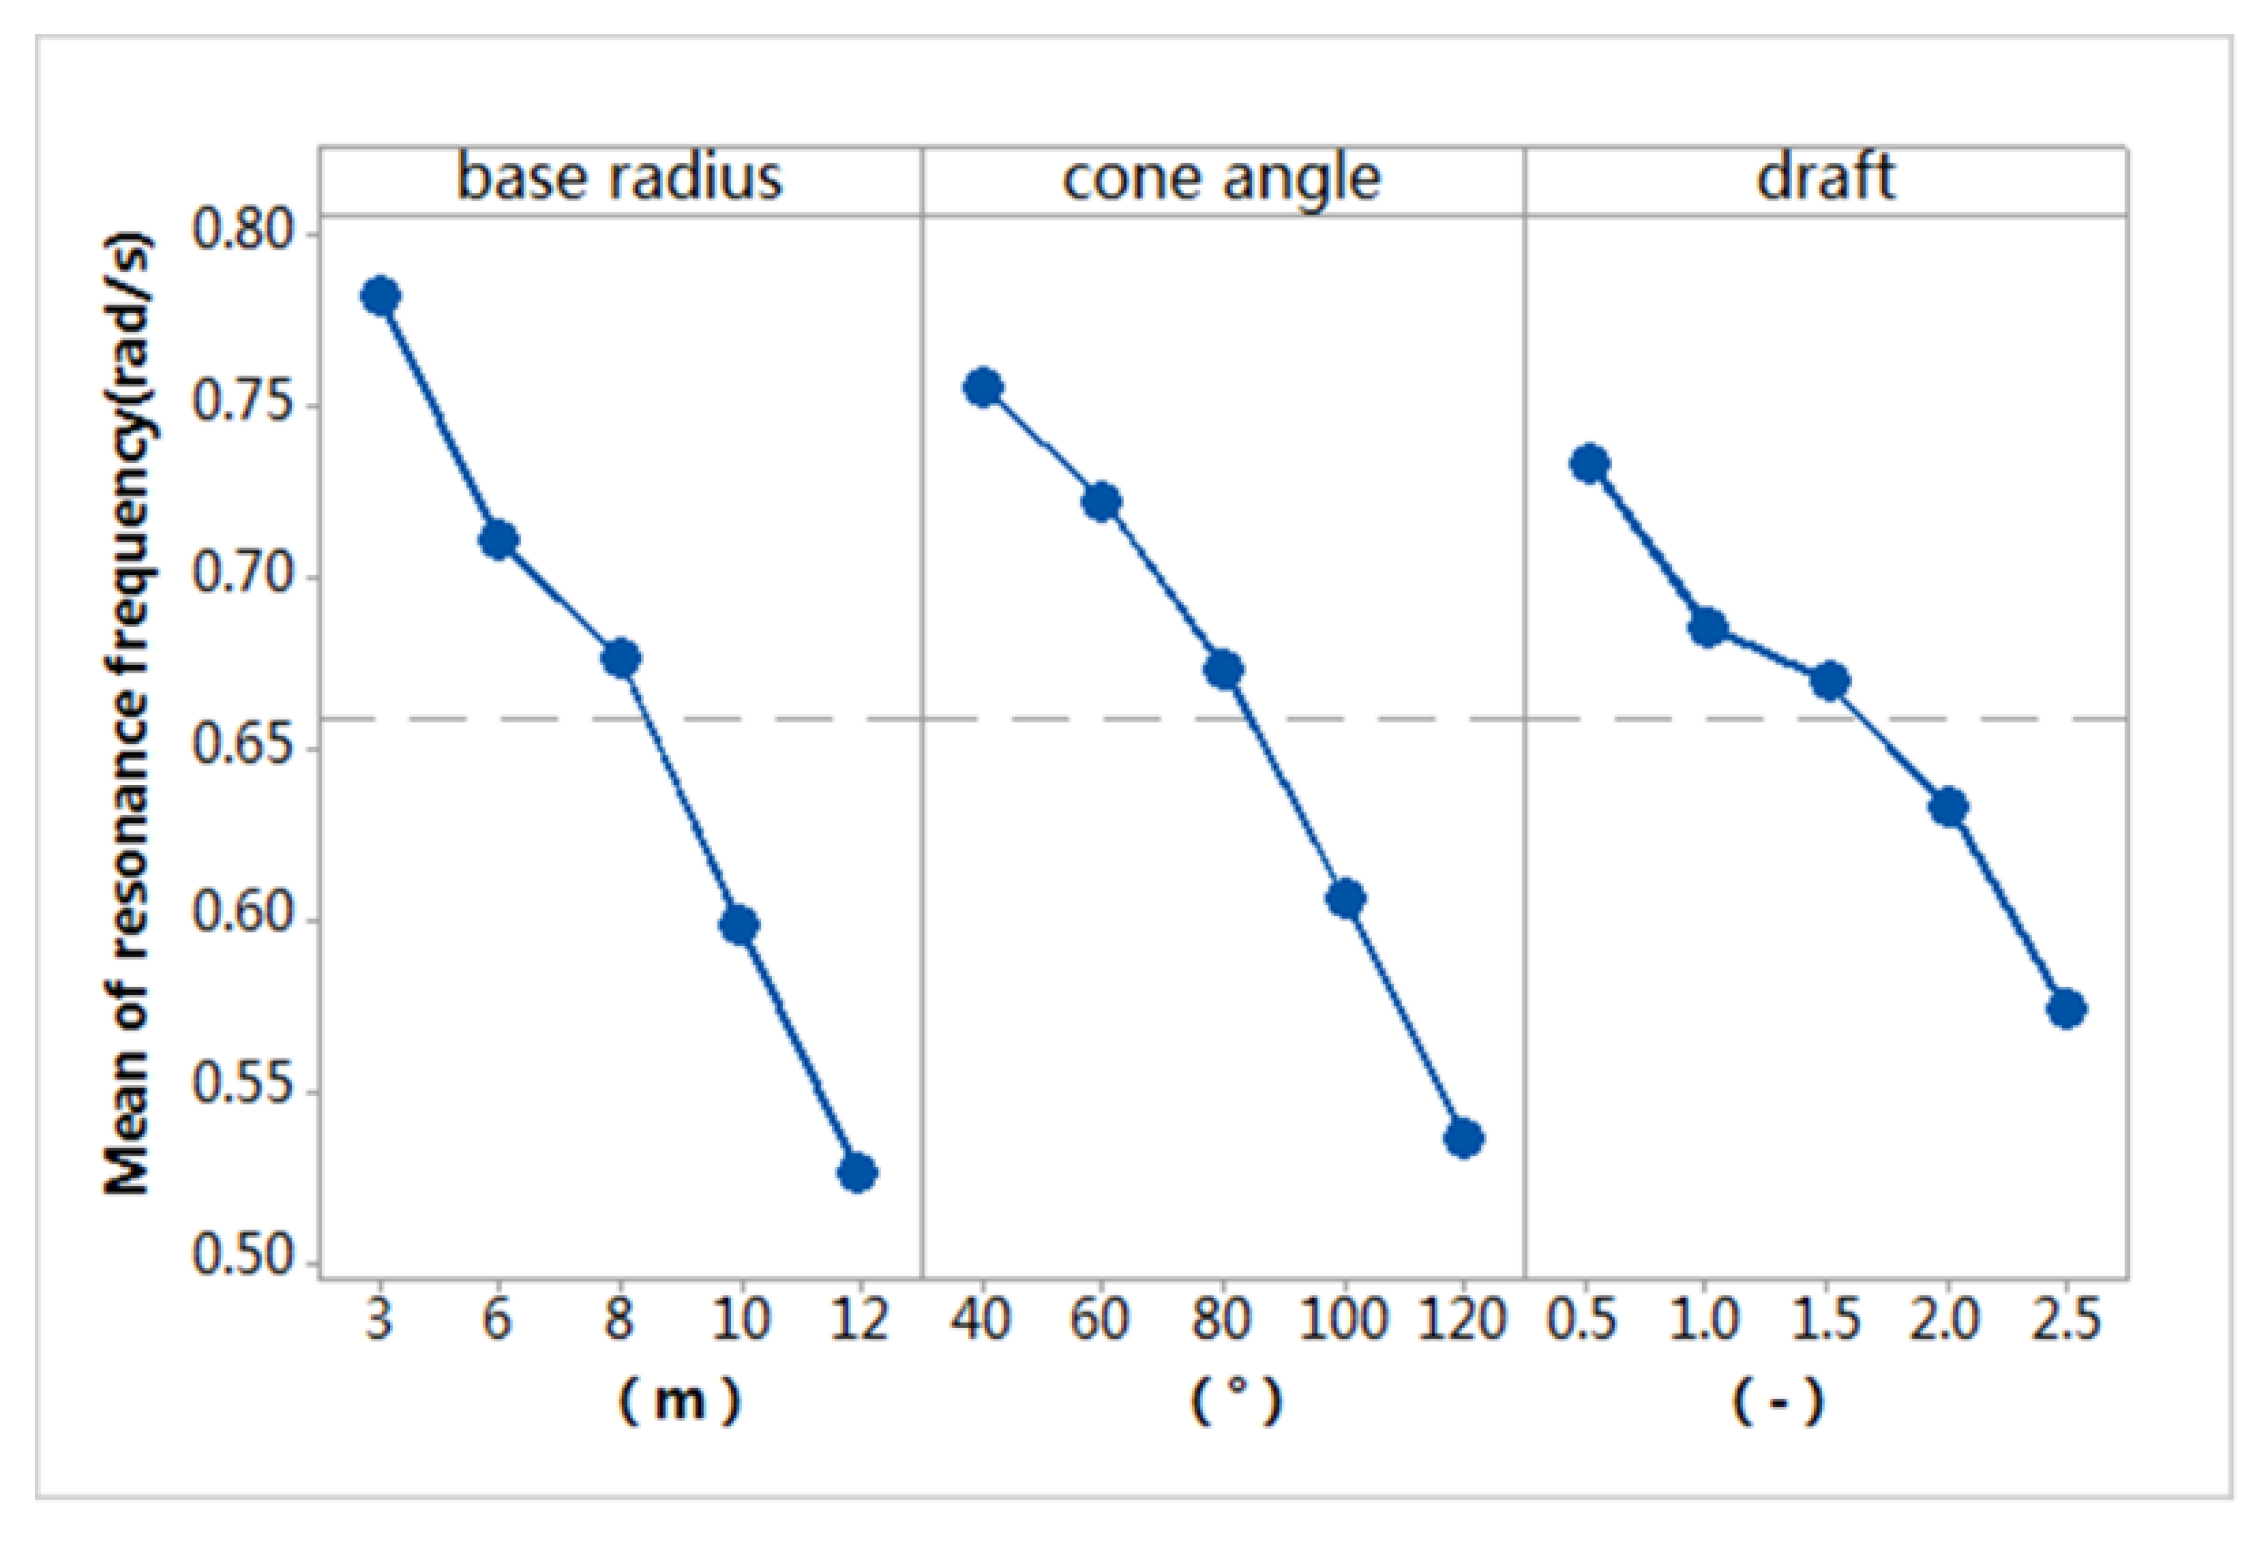
| Base Radius | Cone Angle | Draft | |
|---|---|---|---|
| Maximum (rad/s) | 0.7820 | 0.7560 | 0.7335 |
| Minimum (rad/s) | 0.5263 | 0.5364 | 0.5735 |
| Range (rad/s) | 0.2557 | 0.2196 | 0.1600 |
| Percentage | 40% | 35% | 25% |
| Rank | 1 | 2 | 3 |
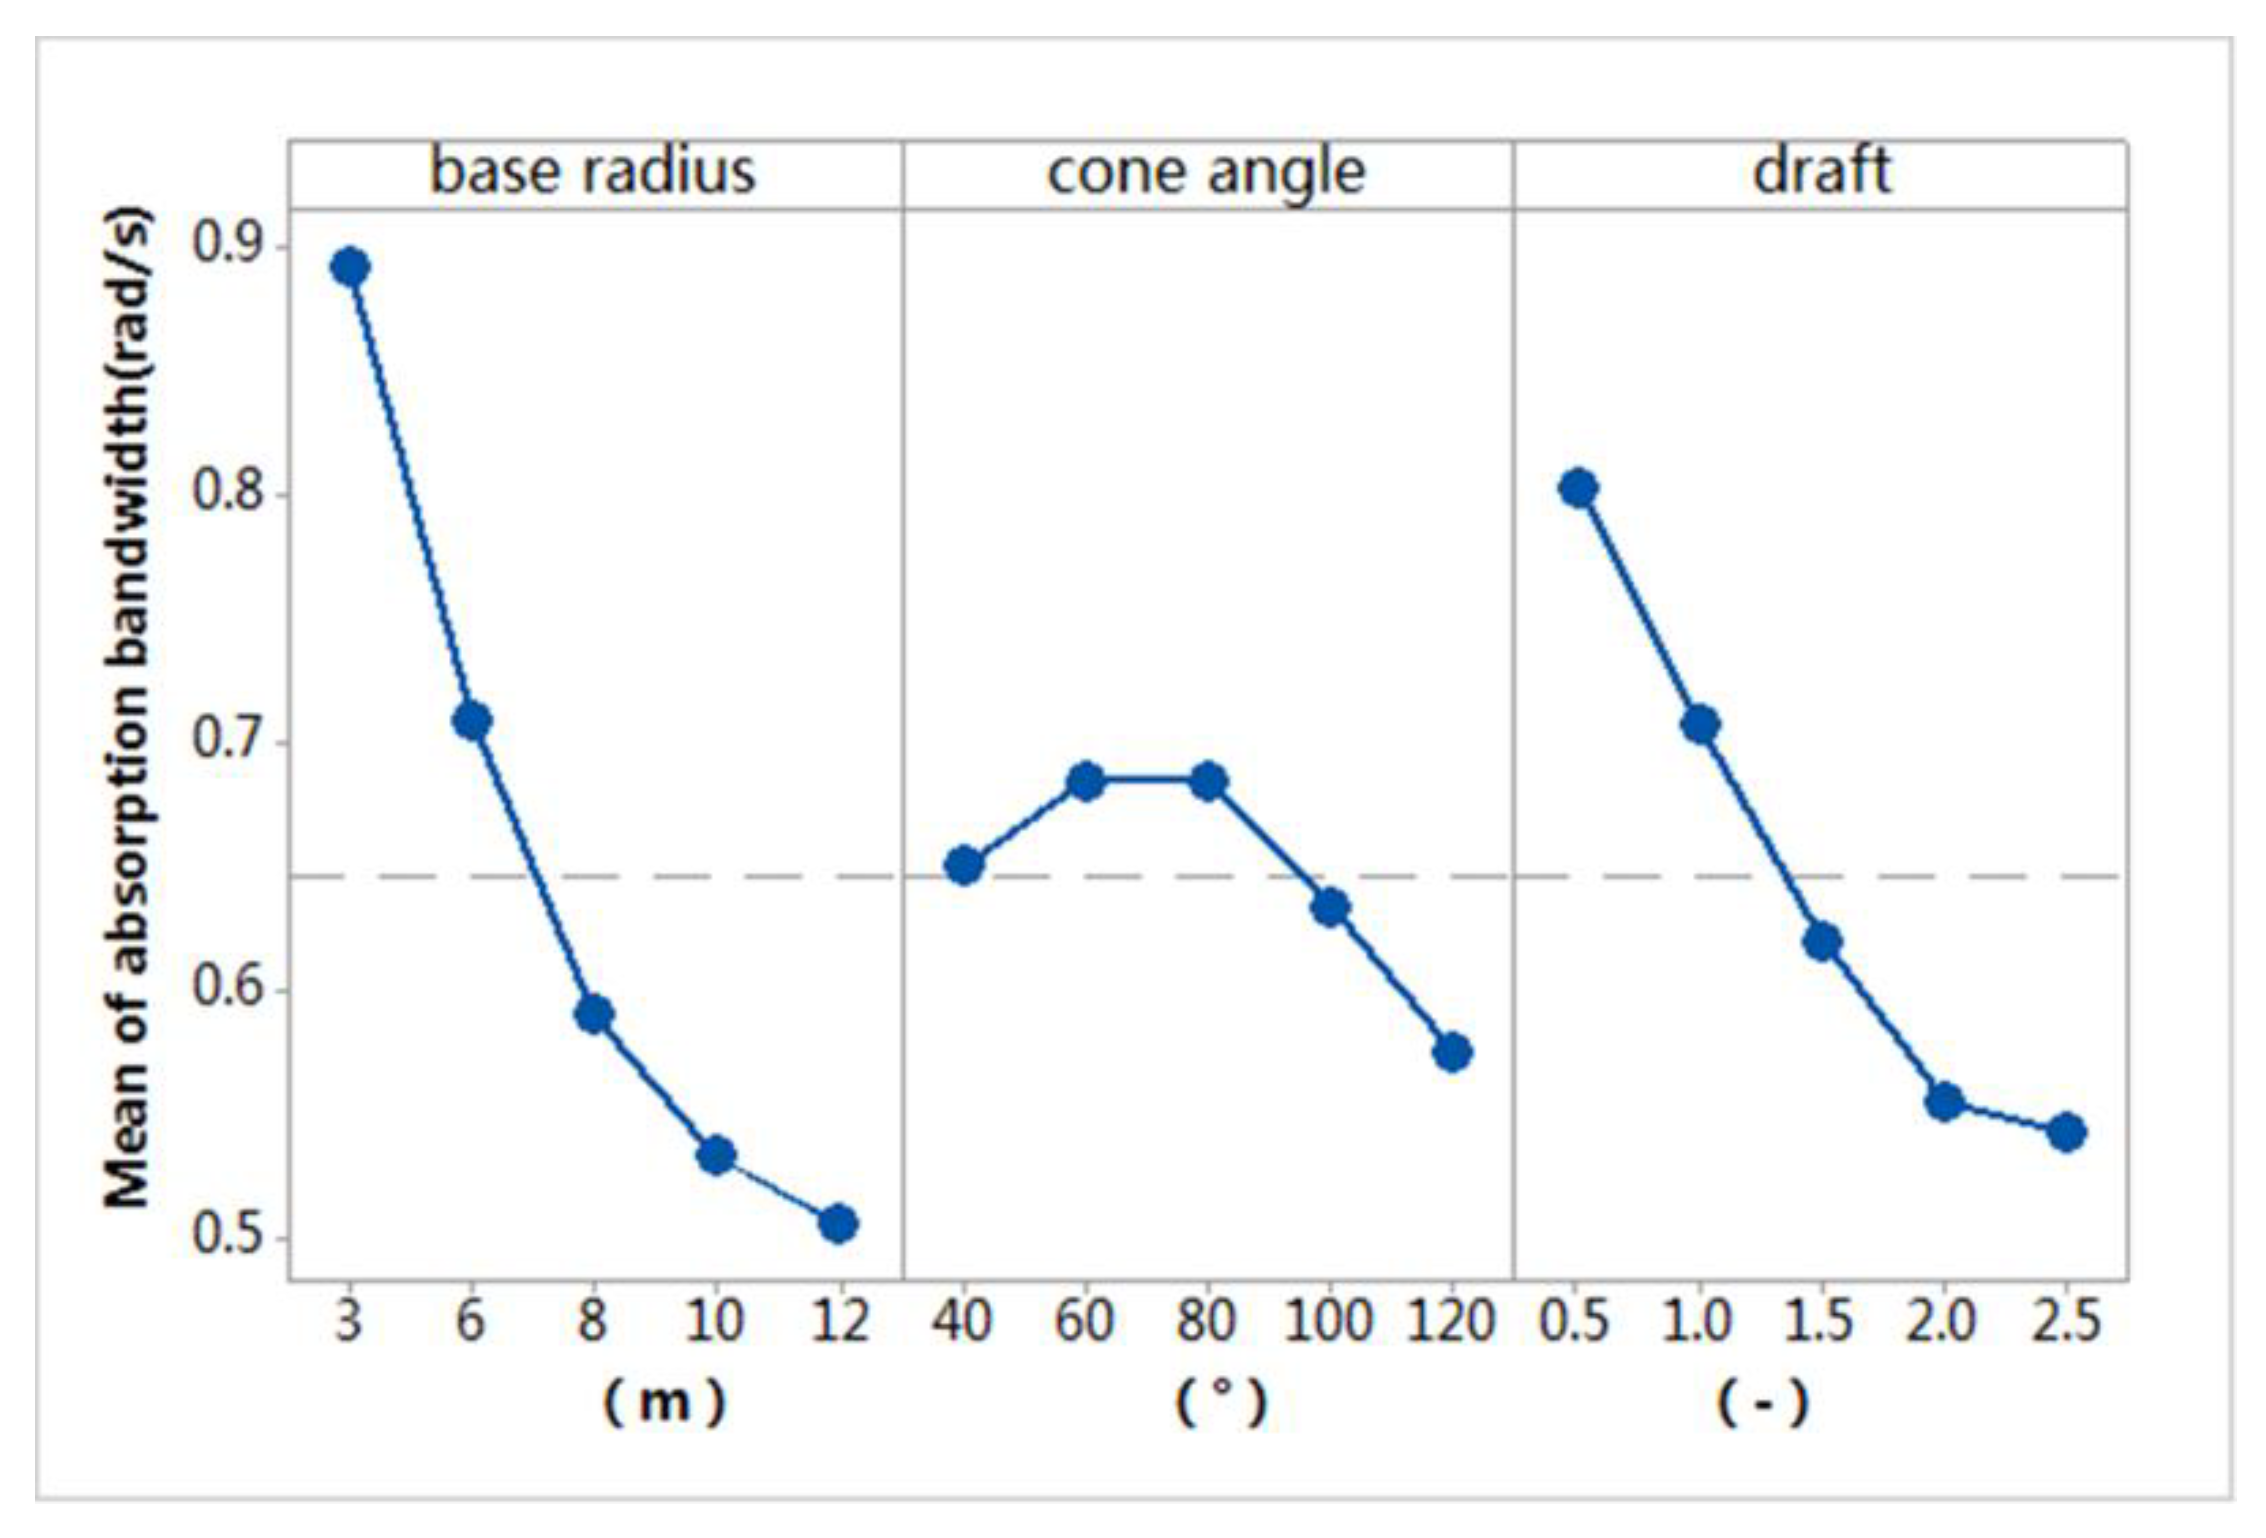
| Base Radius | Cone Angle | Draft | |
|---|---|---|---|
| Maximum (rad/s) | 0.8919 | 0.6856 | 0.8039 |
| Minimum (rad/s) | 0.5064 | 0.5762 | 0.5439 |
| Range (rad/s) | 0.3855 | 0.1096 | 0.2600 |
| Percentage | 51% | 15% | 34% |
| Rank | 1 | 3 | 2 |
| Base Radius | Cone Angle | Draft | |
|---|---|---|---|
| Maximum (kW) | 1254 | 1169 | 951 |
| Minimum (kW) | 201 | 423 | 297 |
| Range (kW) | 1053 | 746 | 654 |
| Percentage | 43% | 30% | 27% |
| Rank | 1 | 2 | 3 |
© 2018 by the authors. Licensee MDPI, Basel, Switzerland. This article is an open access article distributed under the terms and conditions of the Creative Commons Attribution (CC BY) license (http://creativecommons.org/licenses/by/4.0/).
Share and Cite
Wen, Y.; Wang, W.; Liu, H.; Mao, L.; Mi, H.; Wang, W.; Zhang, G. A Shape Optimization Method of a Specified Point Absorber Wave Energy Converter for the South China Sea. Energies 2018, 11, 2645. https://doi.org/10.3390/en11102645
Wen Y, Wang W, Liu H, Mao L, Mi H, Wang W, Zhang G. A Shape Optimization Method of a Specified Point Absorber Wave Energy Converter for the South China Sea. Energies. 2018; 11(10):2645. https://doi.org/10.3390/en11102645
Chicago/Turabian StyleWen, Yadong, Weijun Wang, Hua Liu, Longbo Mao, Hongju Mi, Wenqiang Wang, and Guoping Zhang. 2018. "A Shape Optimization Method of a Specified Point Absorber Wave Energy Converter for the South China Sea" Energies 11, no. 10: 2645. https://doi.org/10.3390/en11102645
APA StyleWen, Y., Wang, W., Liu, H., Mao, L., Mi, H., Wang, W., & Zhang, G. (2018). A Shape Optimization Method of a Specified Point Absorber Wave Energy Converter for the South China Sea. Energies, 11(10), 2645. https://doi.org/10.3390/en11102645