Analyzing of a Photovoltaic/Wind/Biogas/Pumped-Hydro Off-Grid Hybrid System for Rural Electrification in Sub-Saharan Africa—Case Study of Djoundé in Northern Cameroon


Abstract
:1. Introduction
- higher reliability,
- better efficiency,
- reduced energy storage capacity, and
- lower levelized life-cycle power cost.
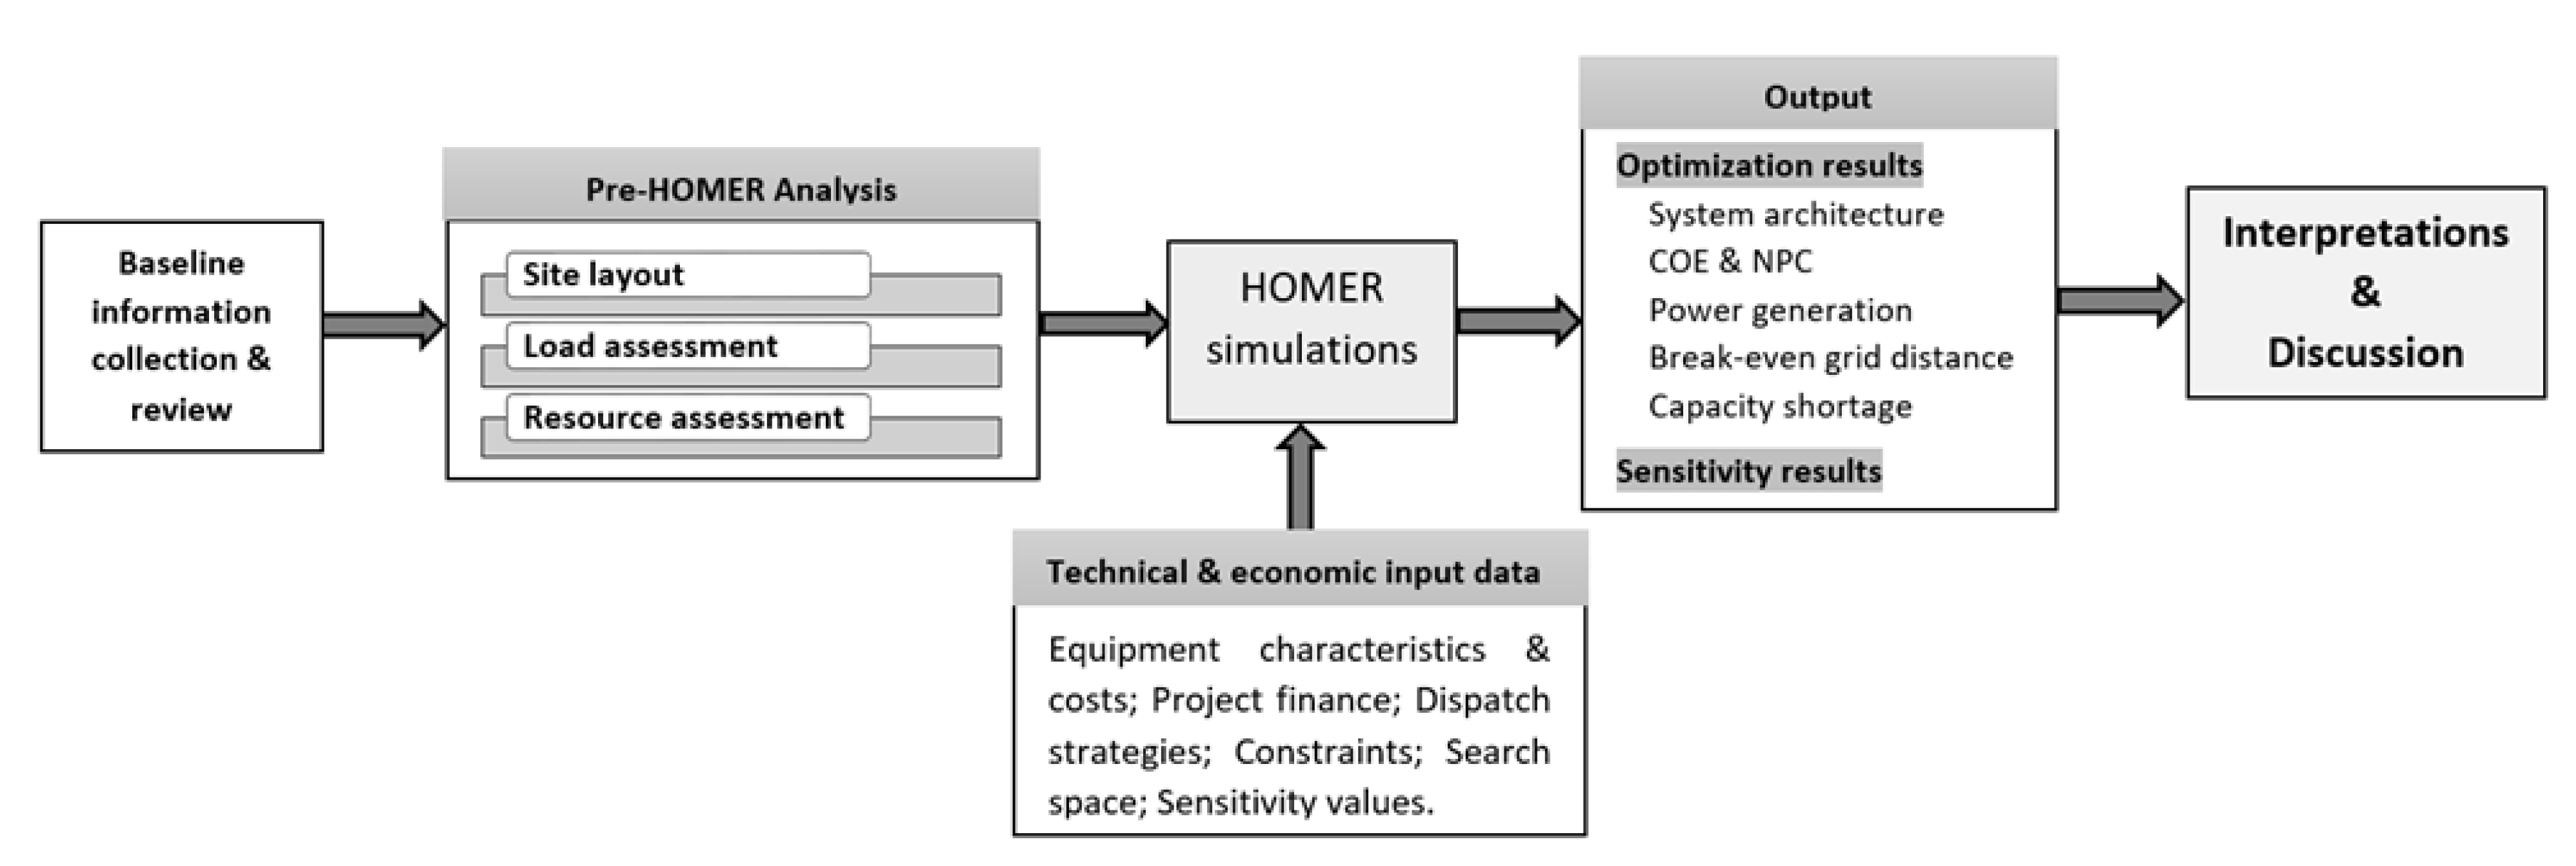
2. Materials and Methods
2.1. Introduction
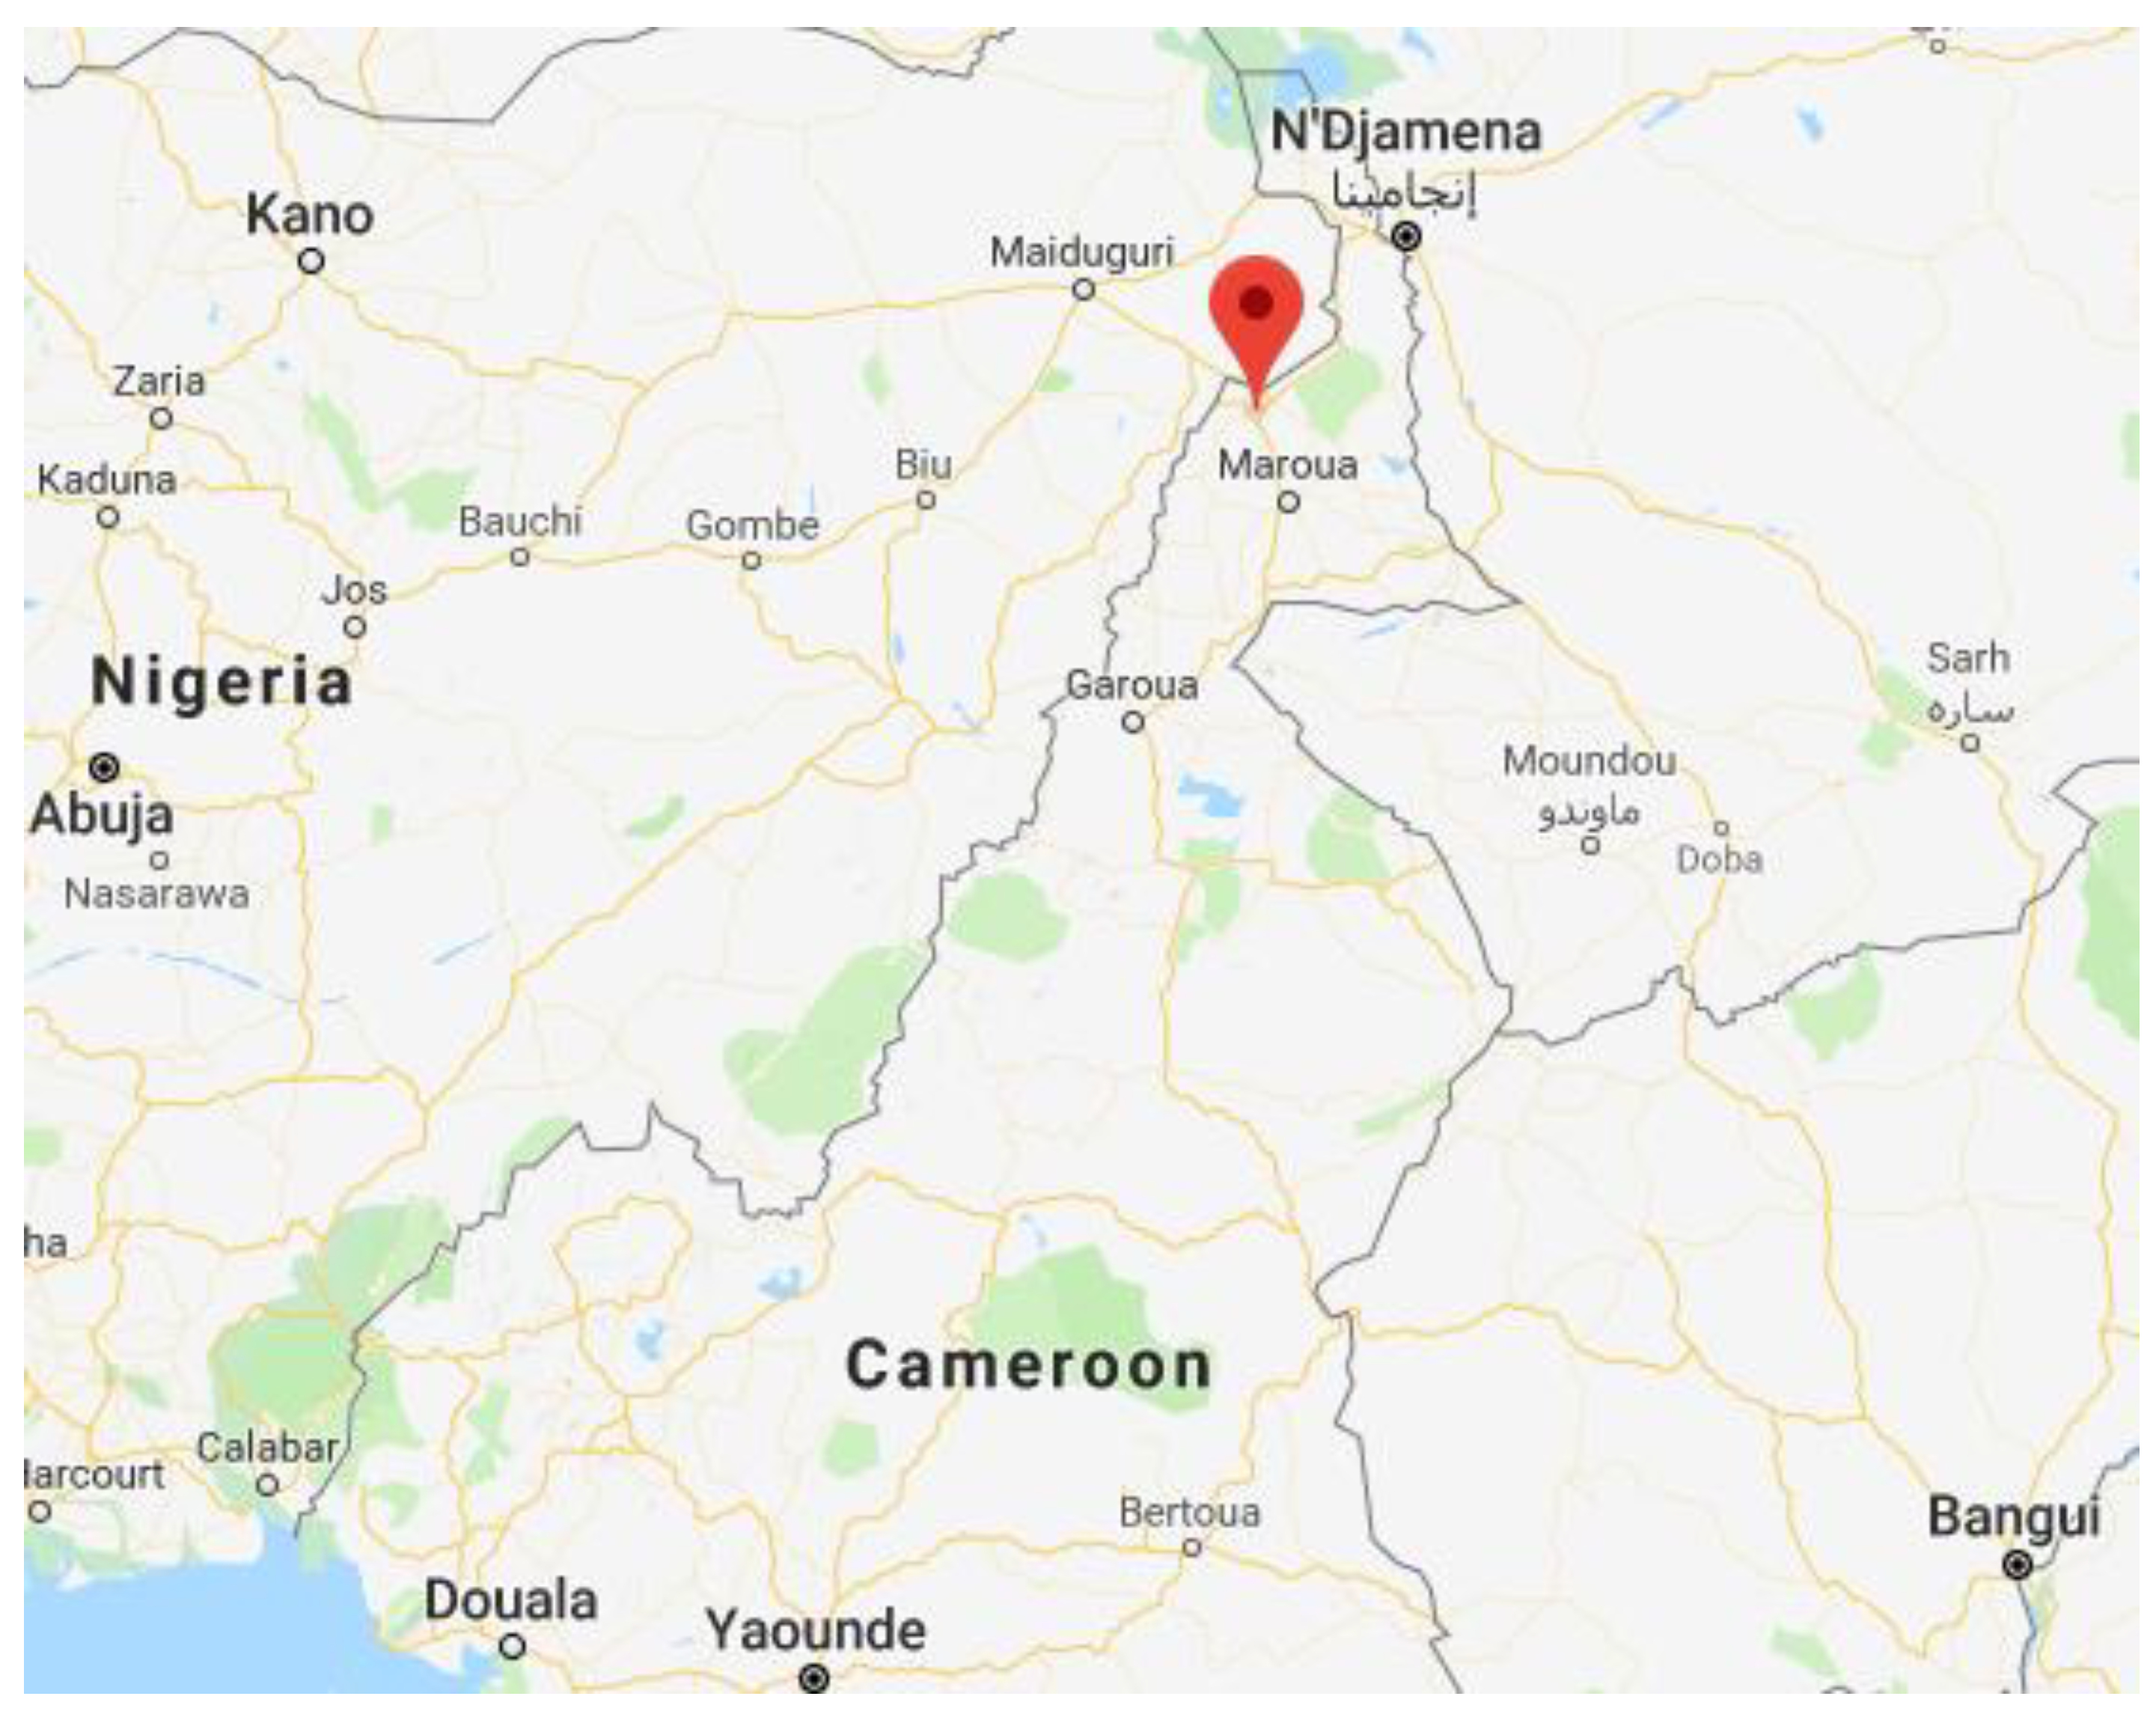
2.2. Study Location
2.3. Load Assessment
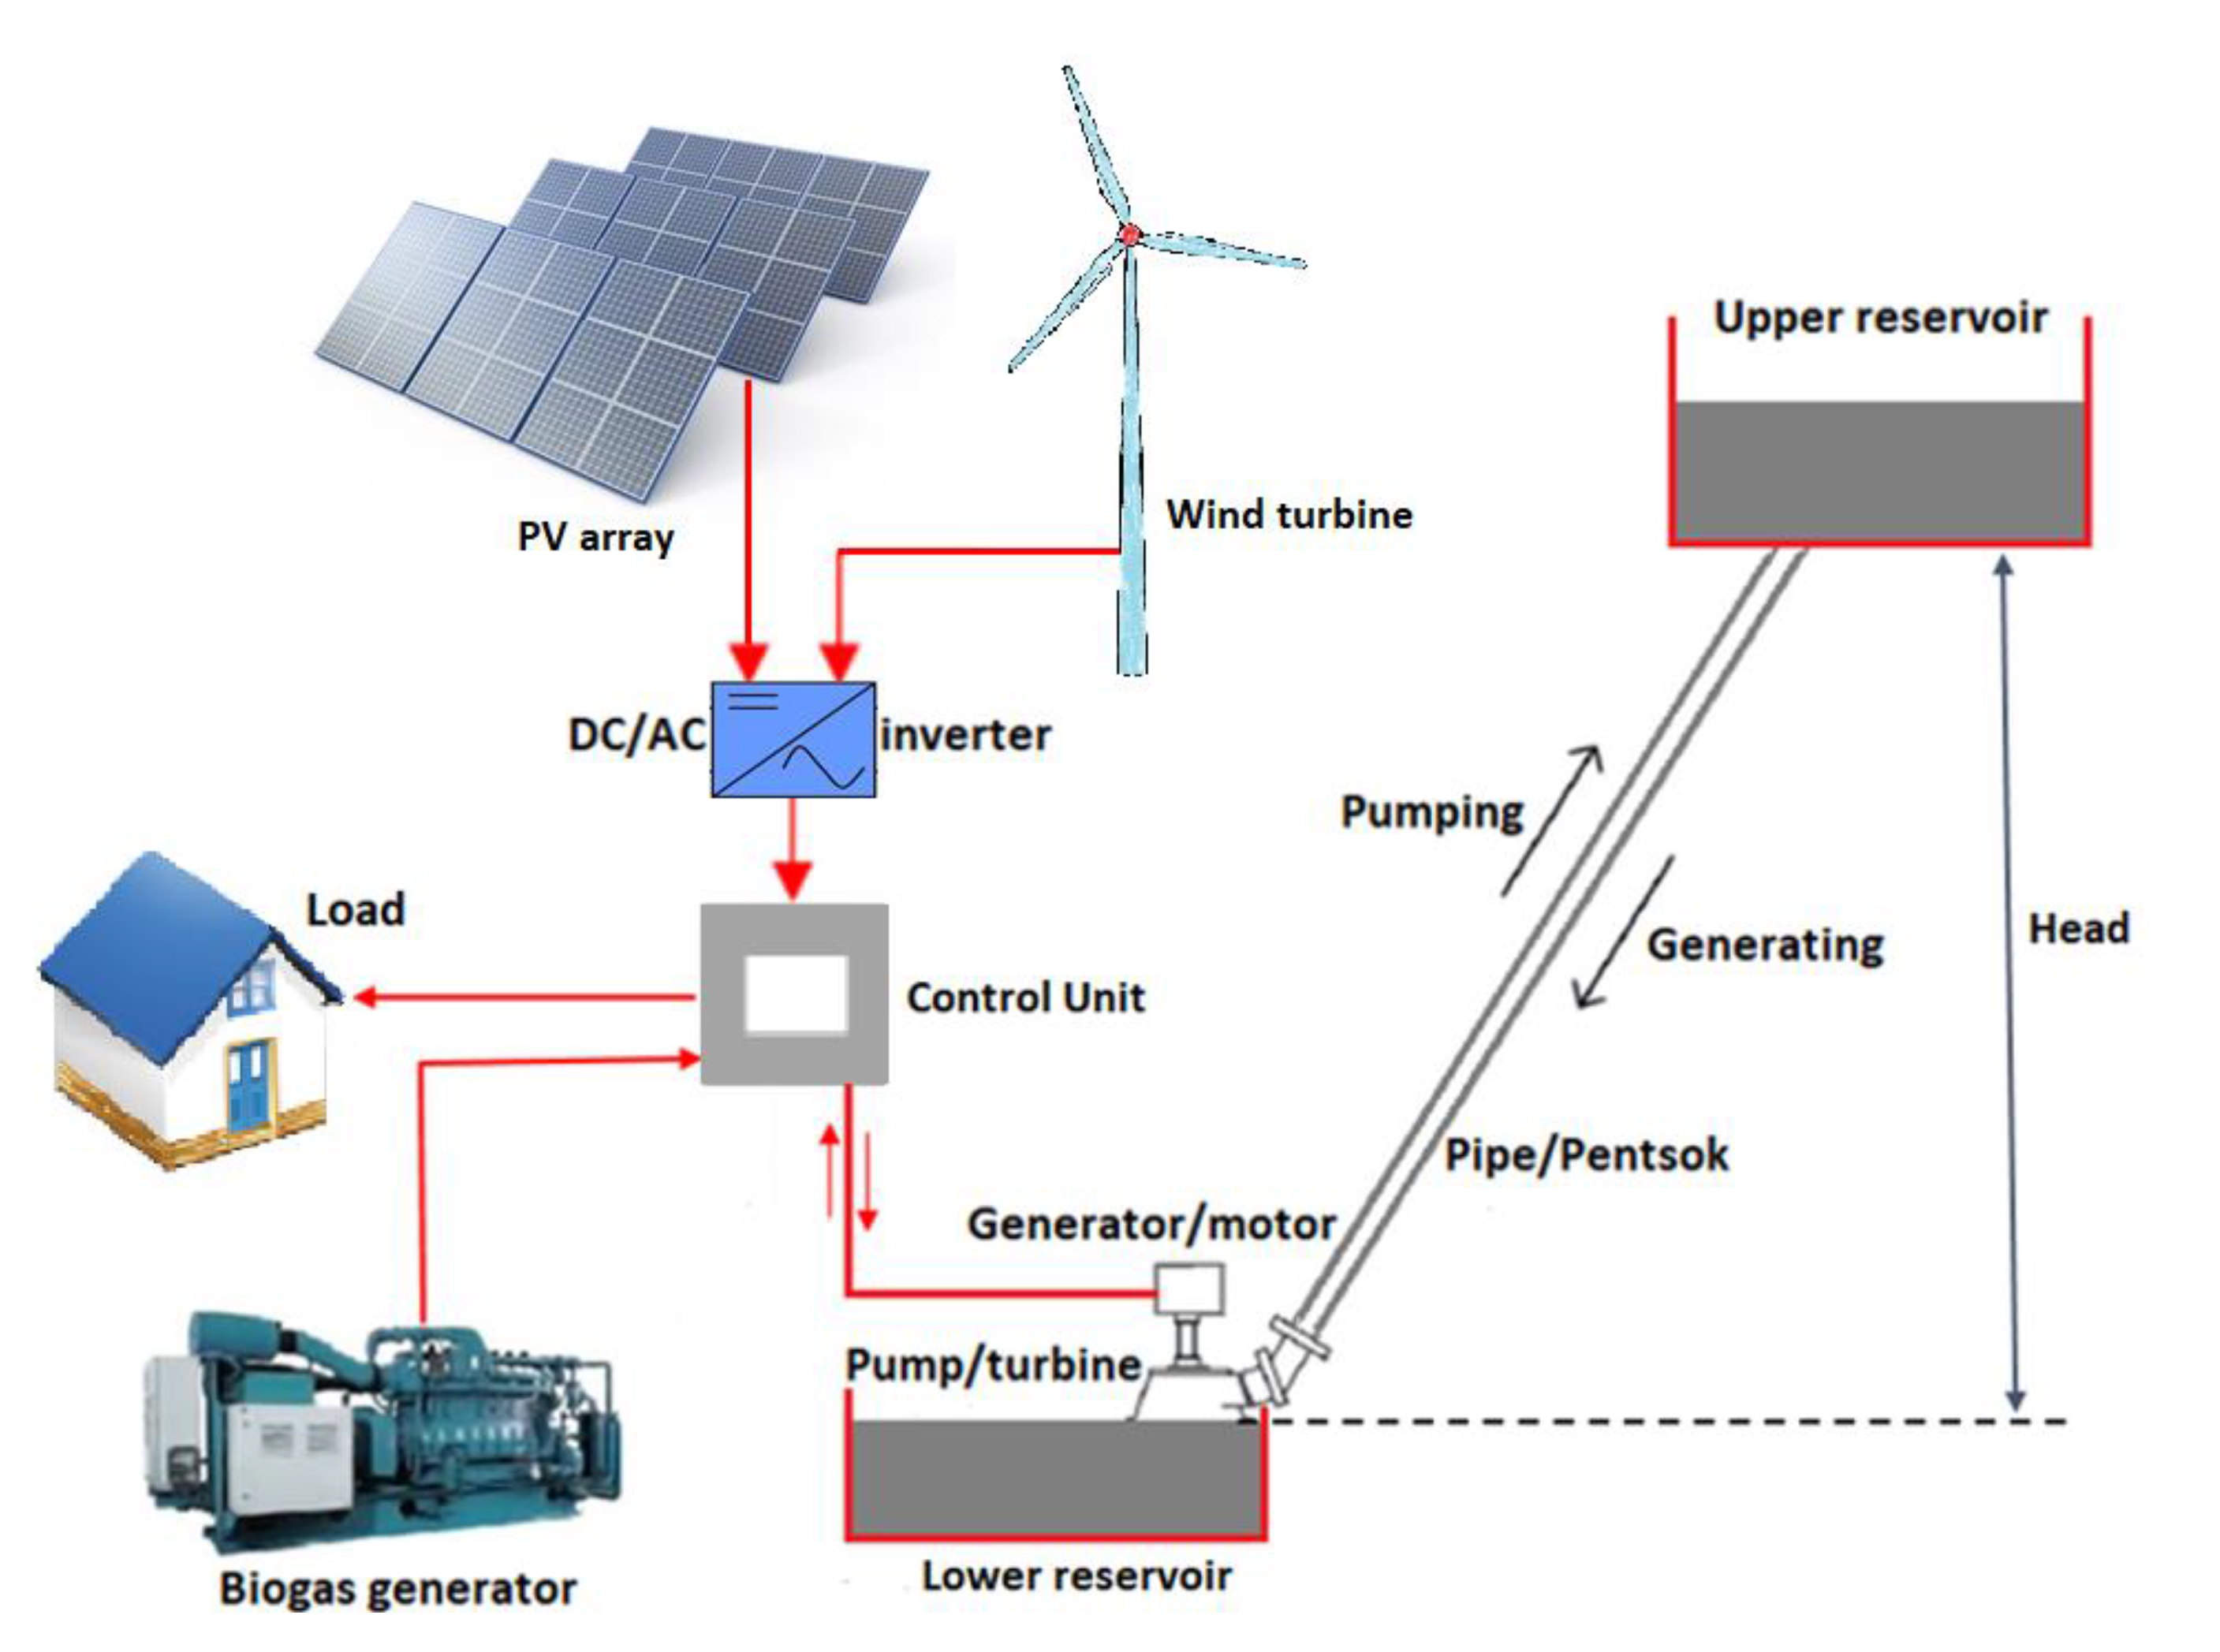
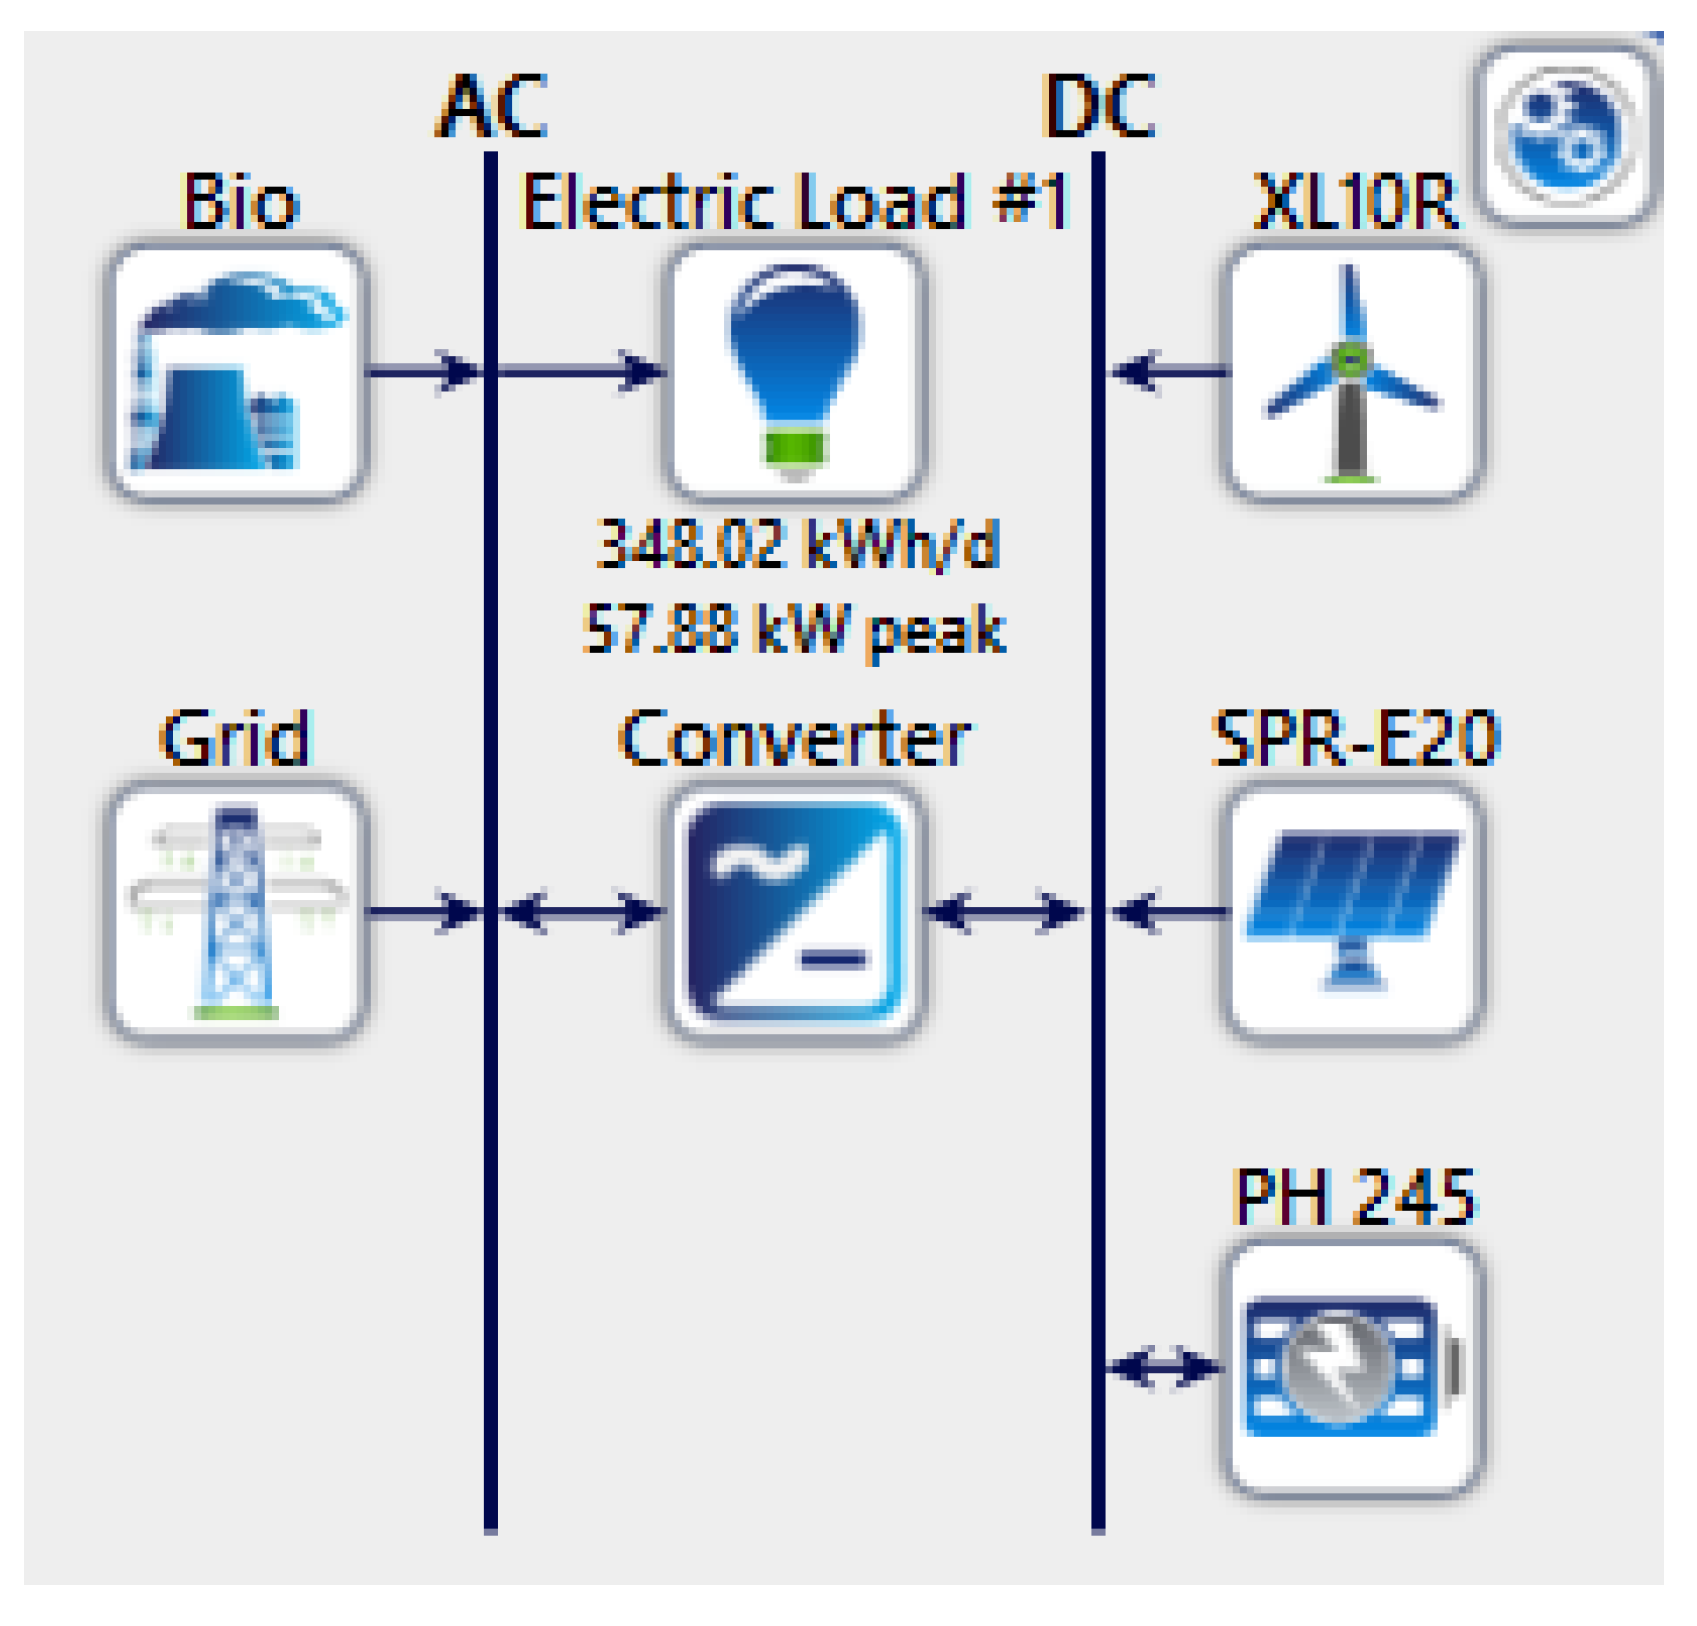
2.4. System Configuration
2.5. Assessment of Available Energy Resources
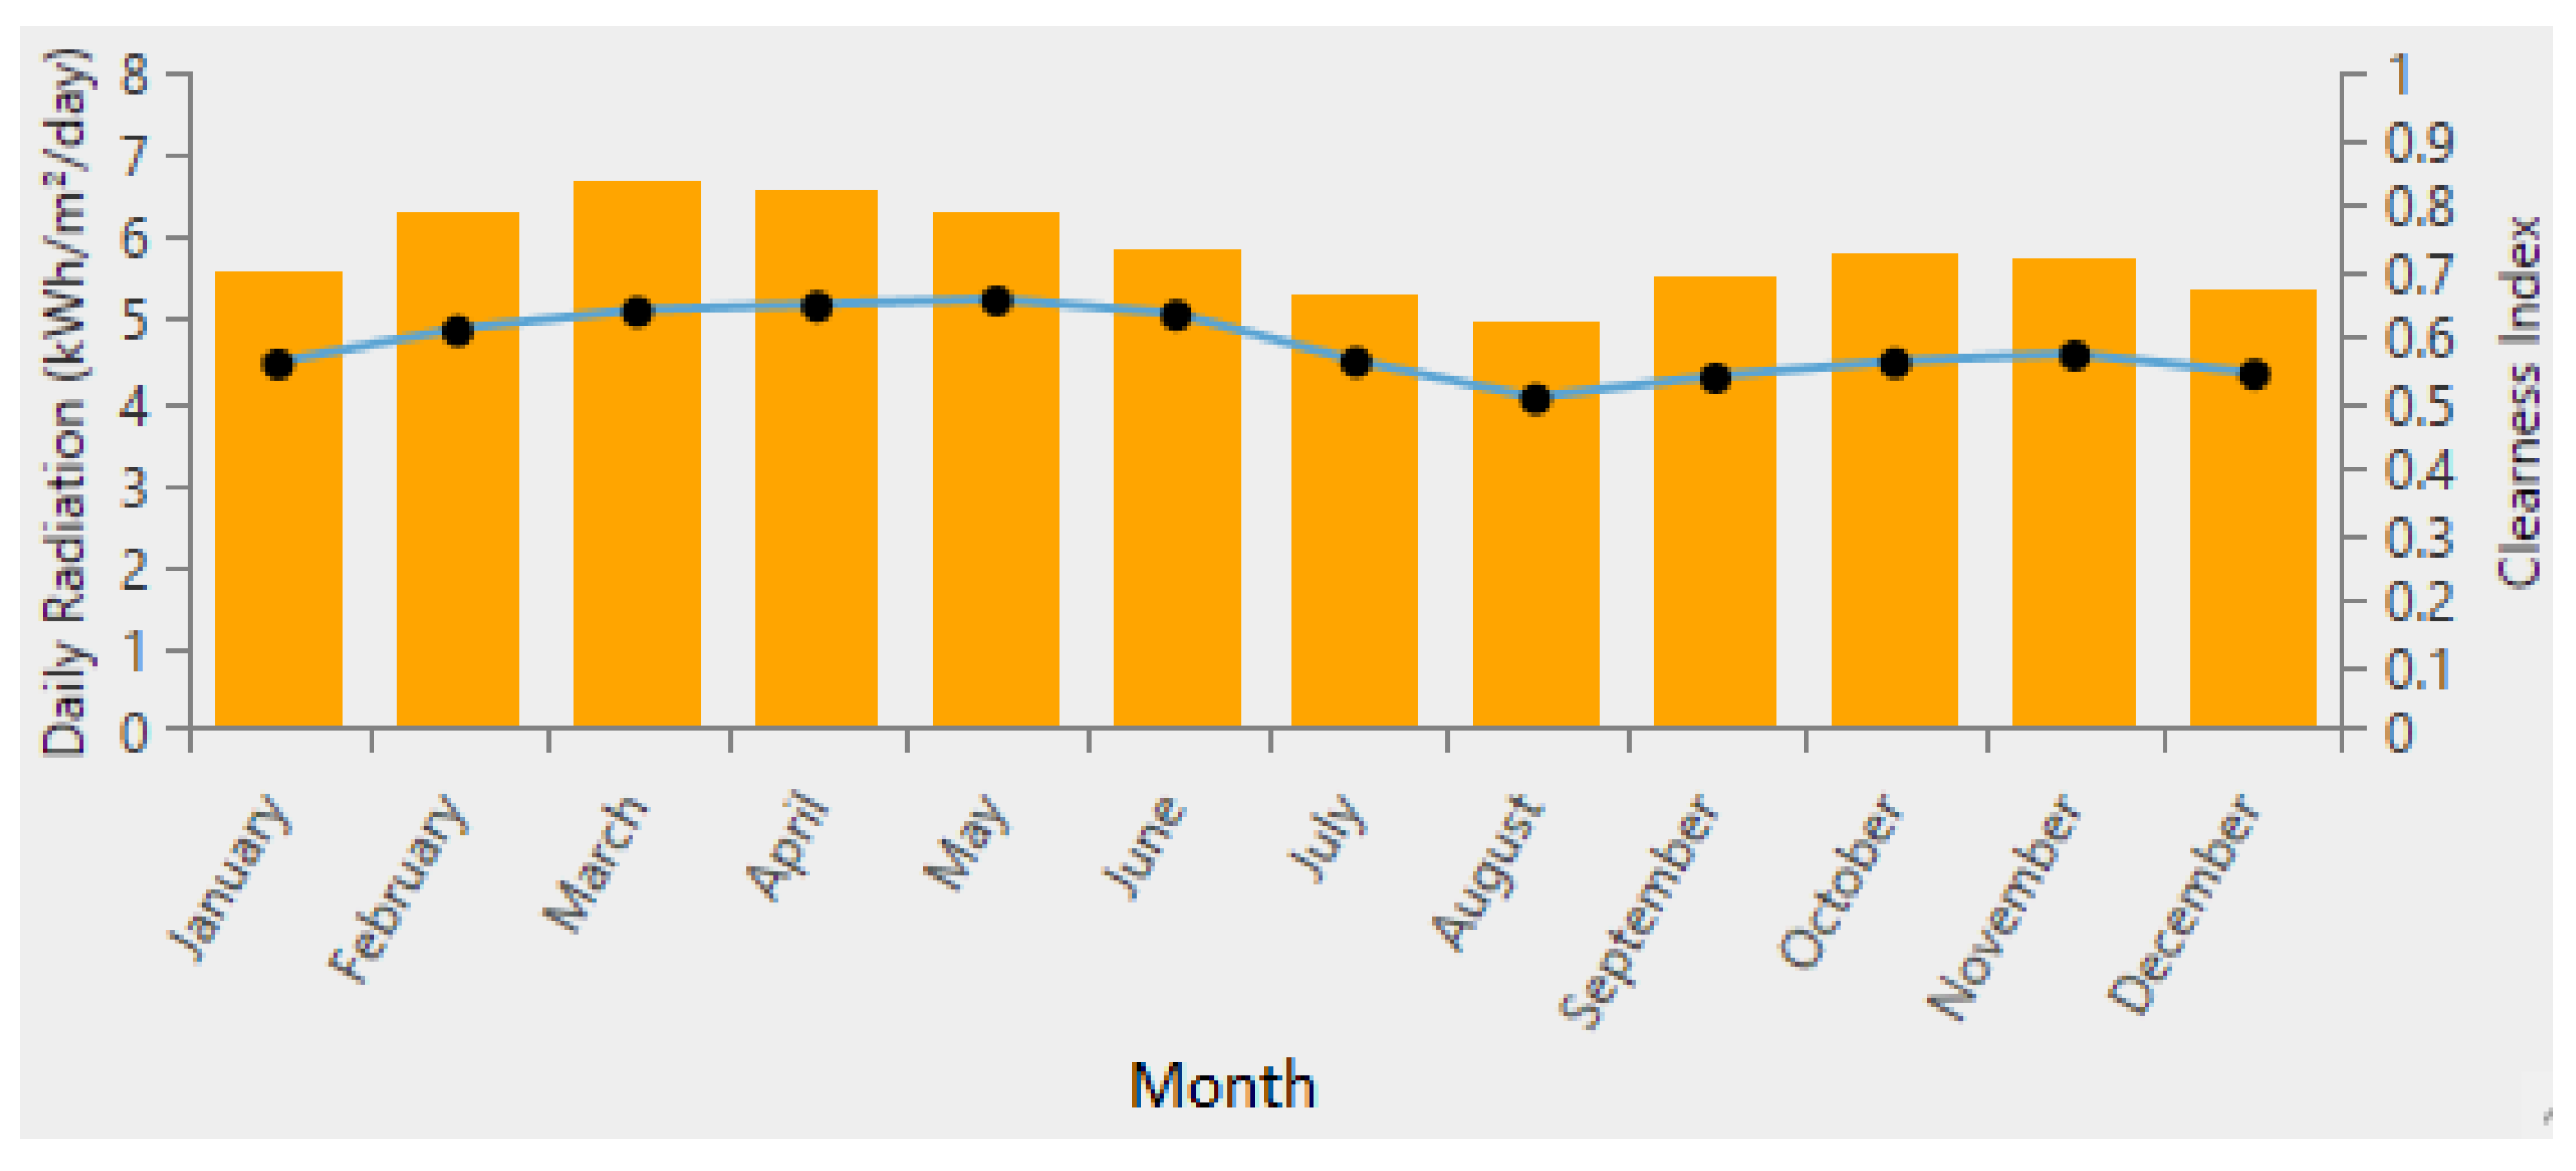
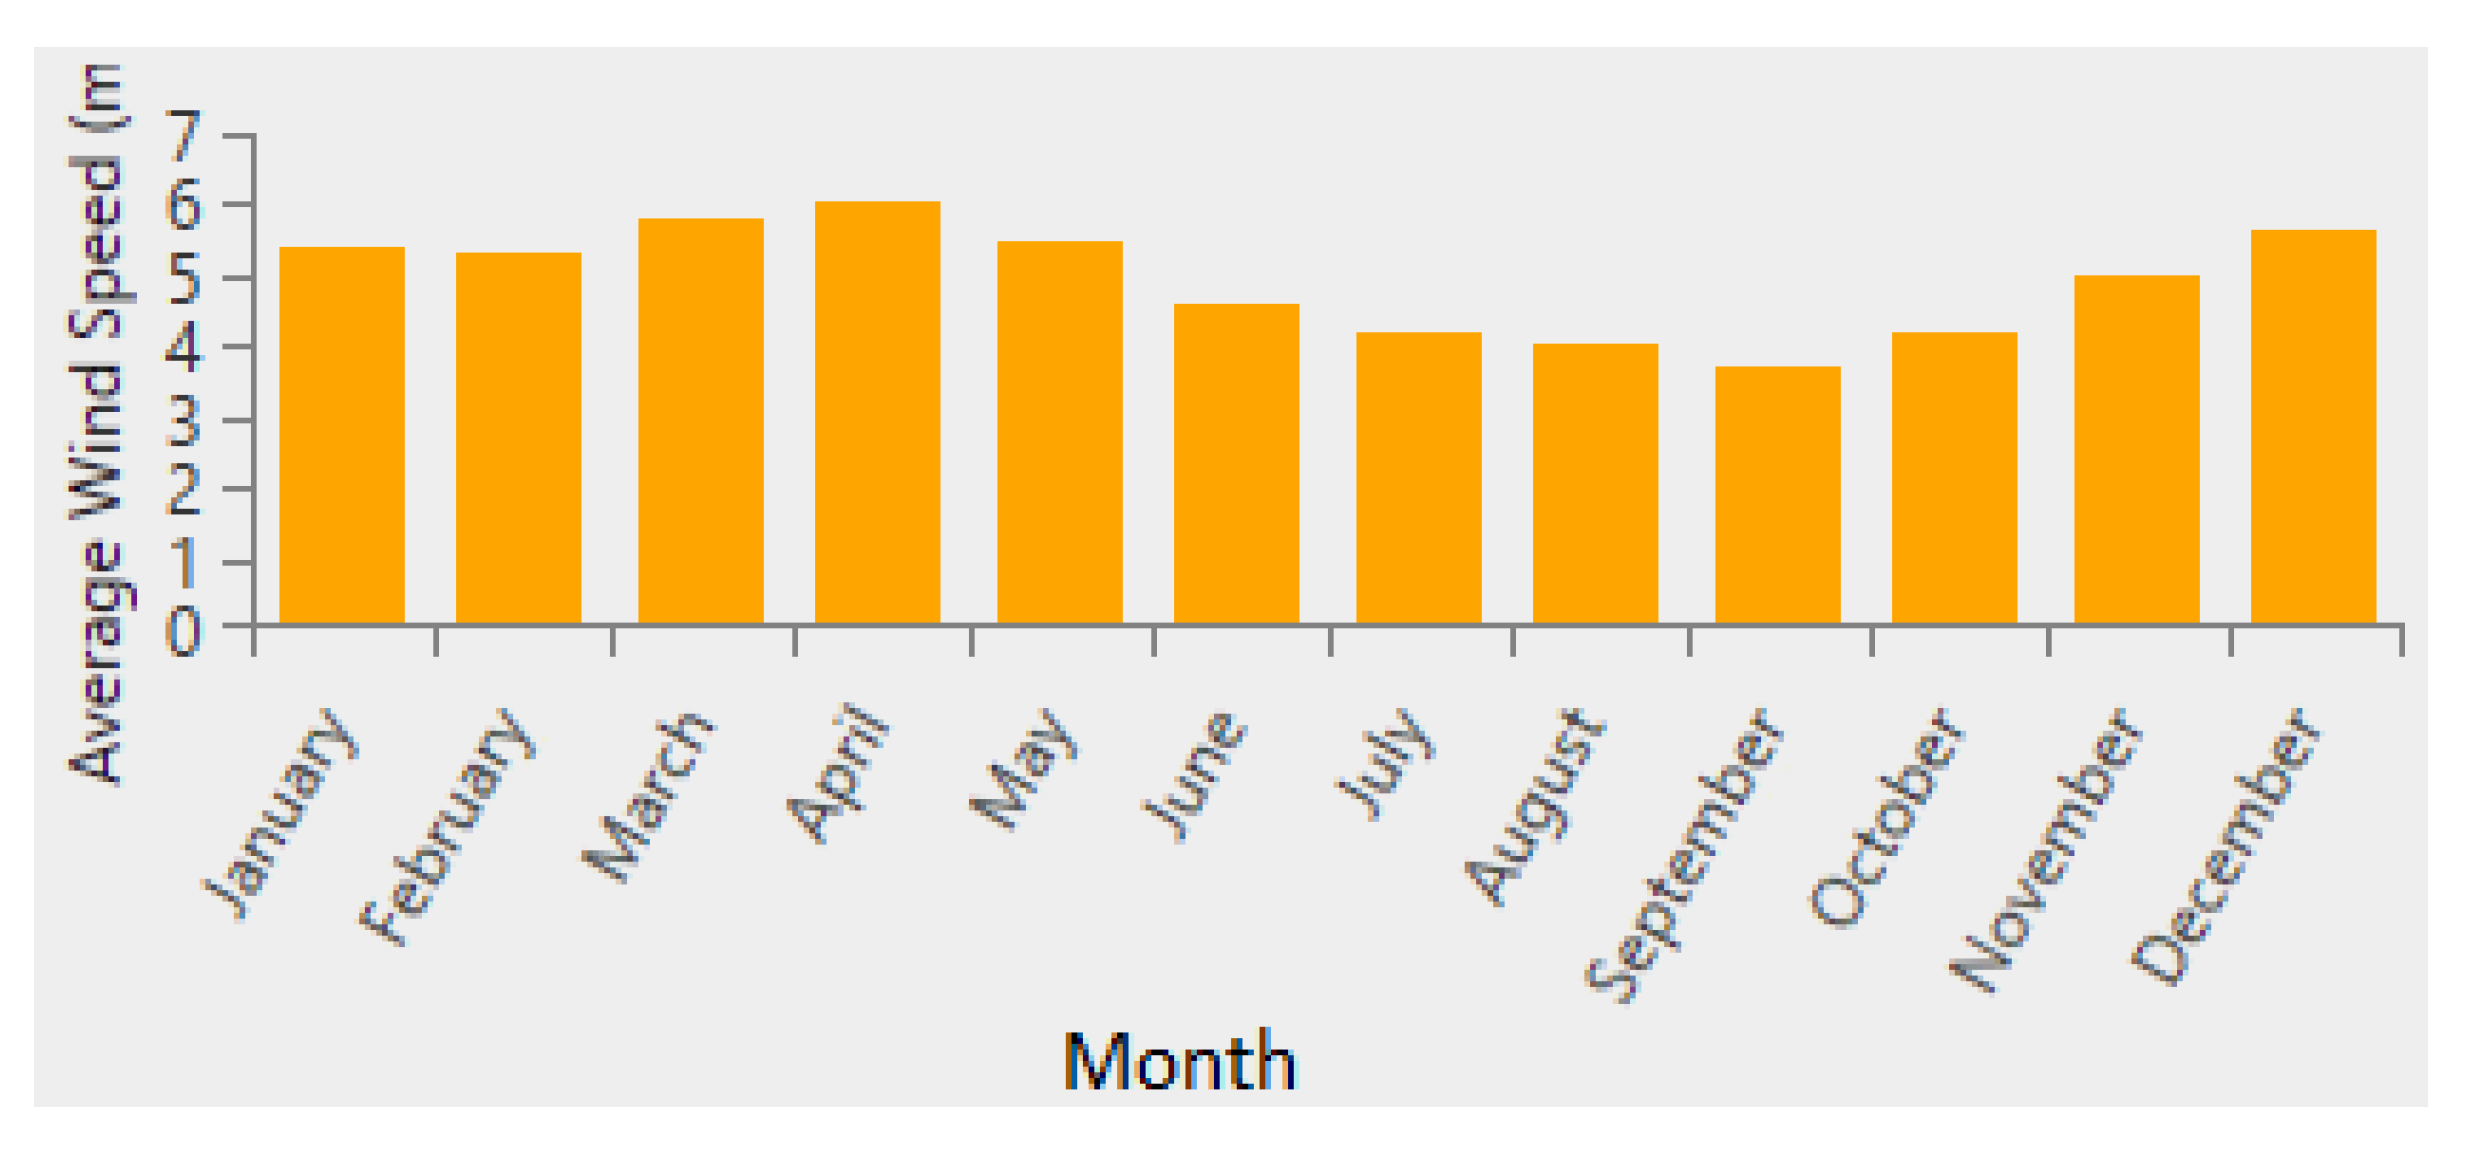
2.5.1. Available Solar and Wind Resources
2.5.2. Biomass Resources
2.6. System Analysis
2.6.1. PV Array
2.6.2. Wind Turbine
2.6.3. Biogas Generator
2.6.4. Pumped-Hydro Storage
2.6.5. Converter
2.7. Simulation and Optimization
2.7.1. The Assessment Criteria
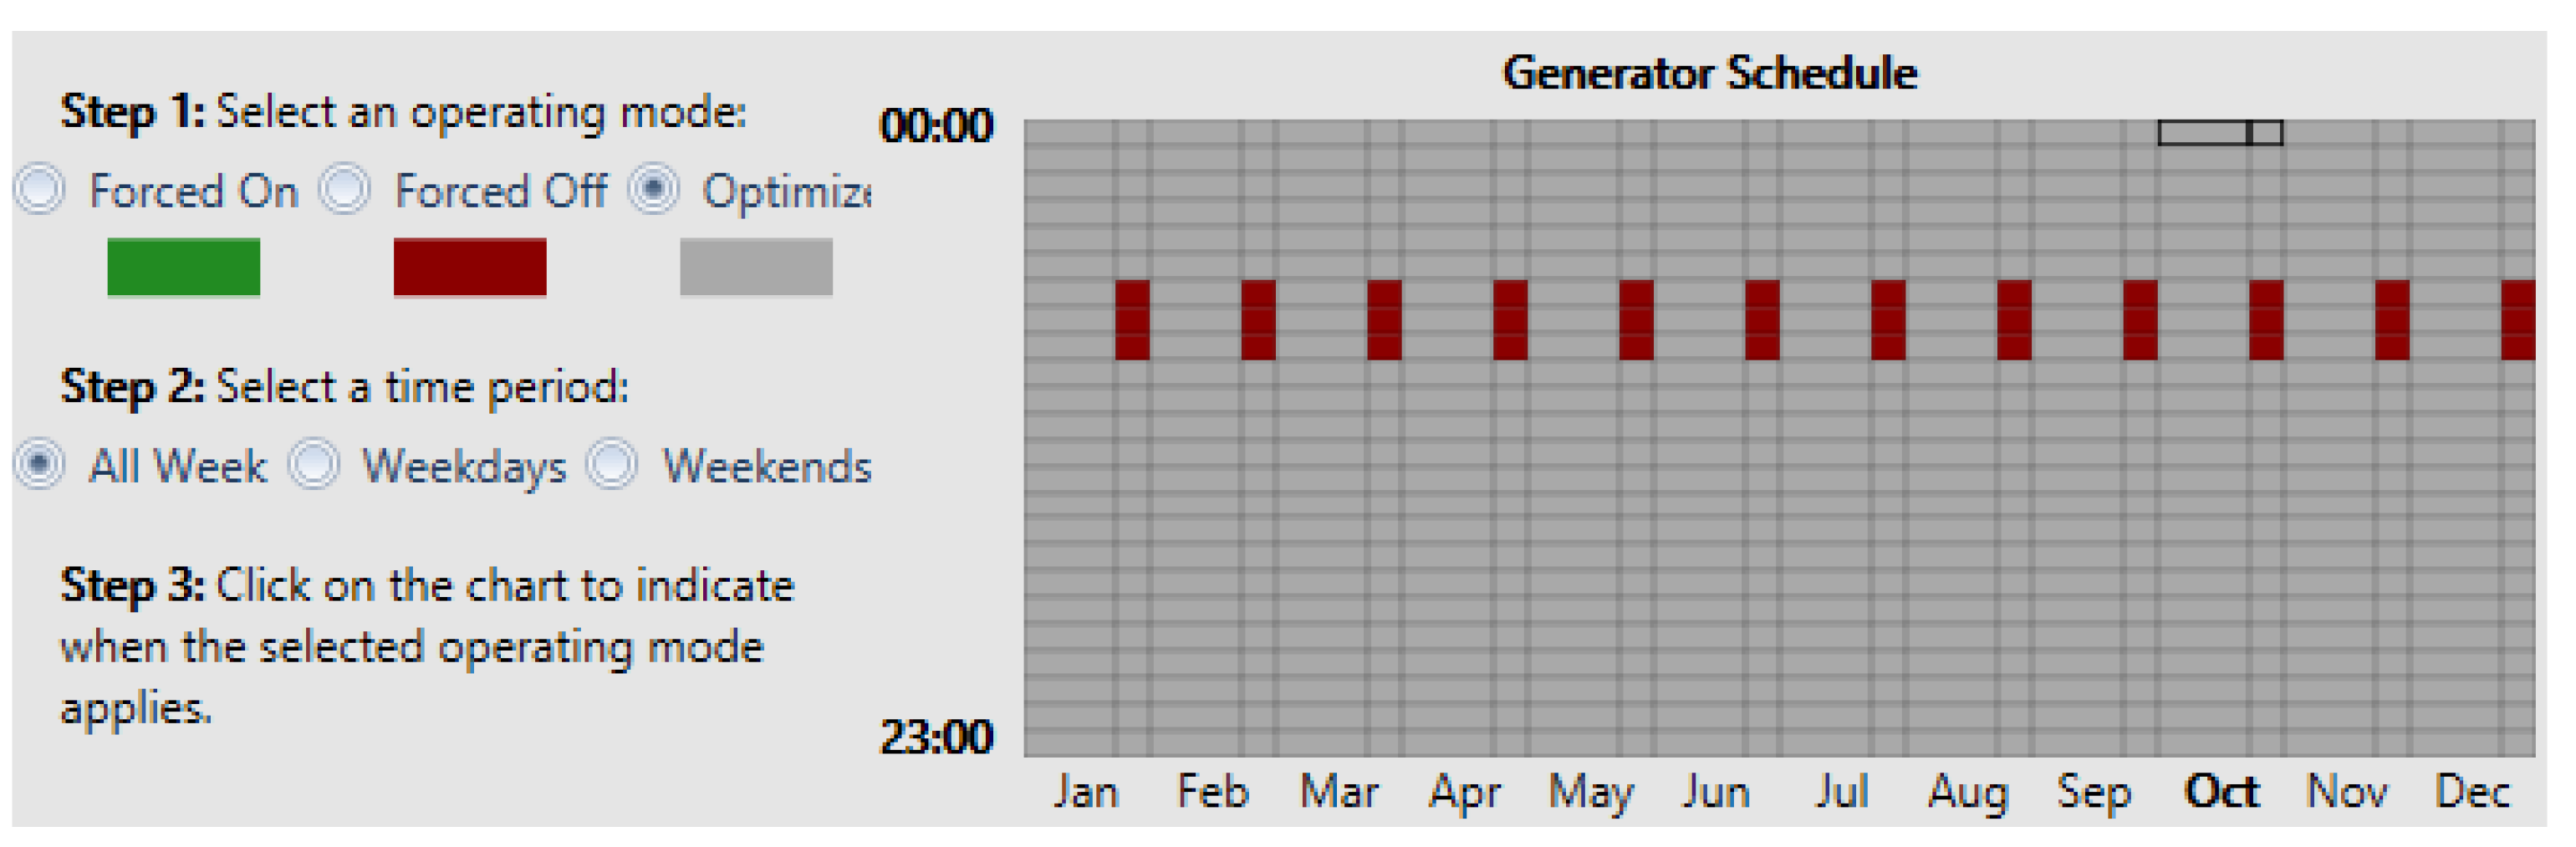
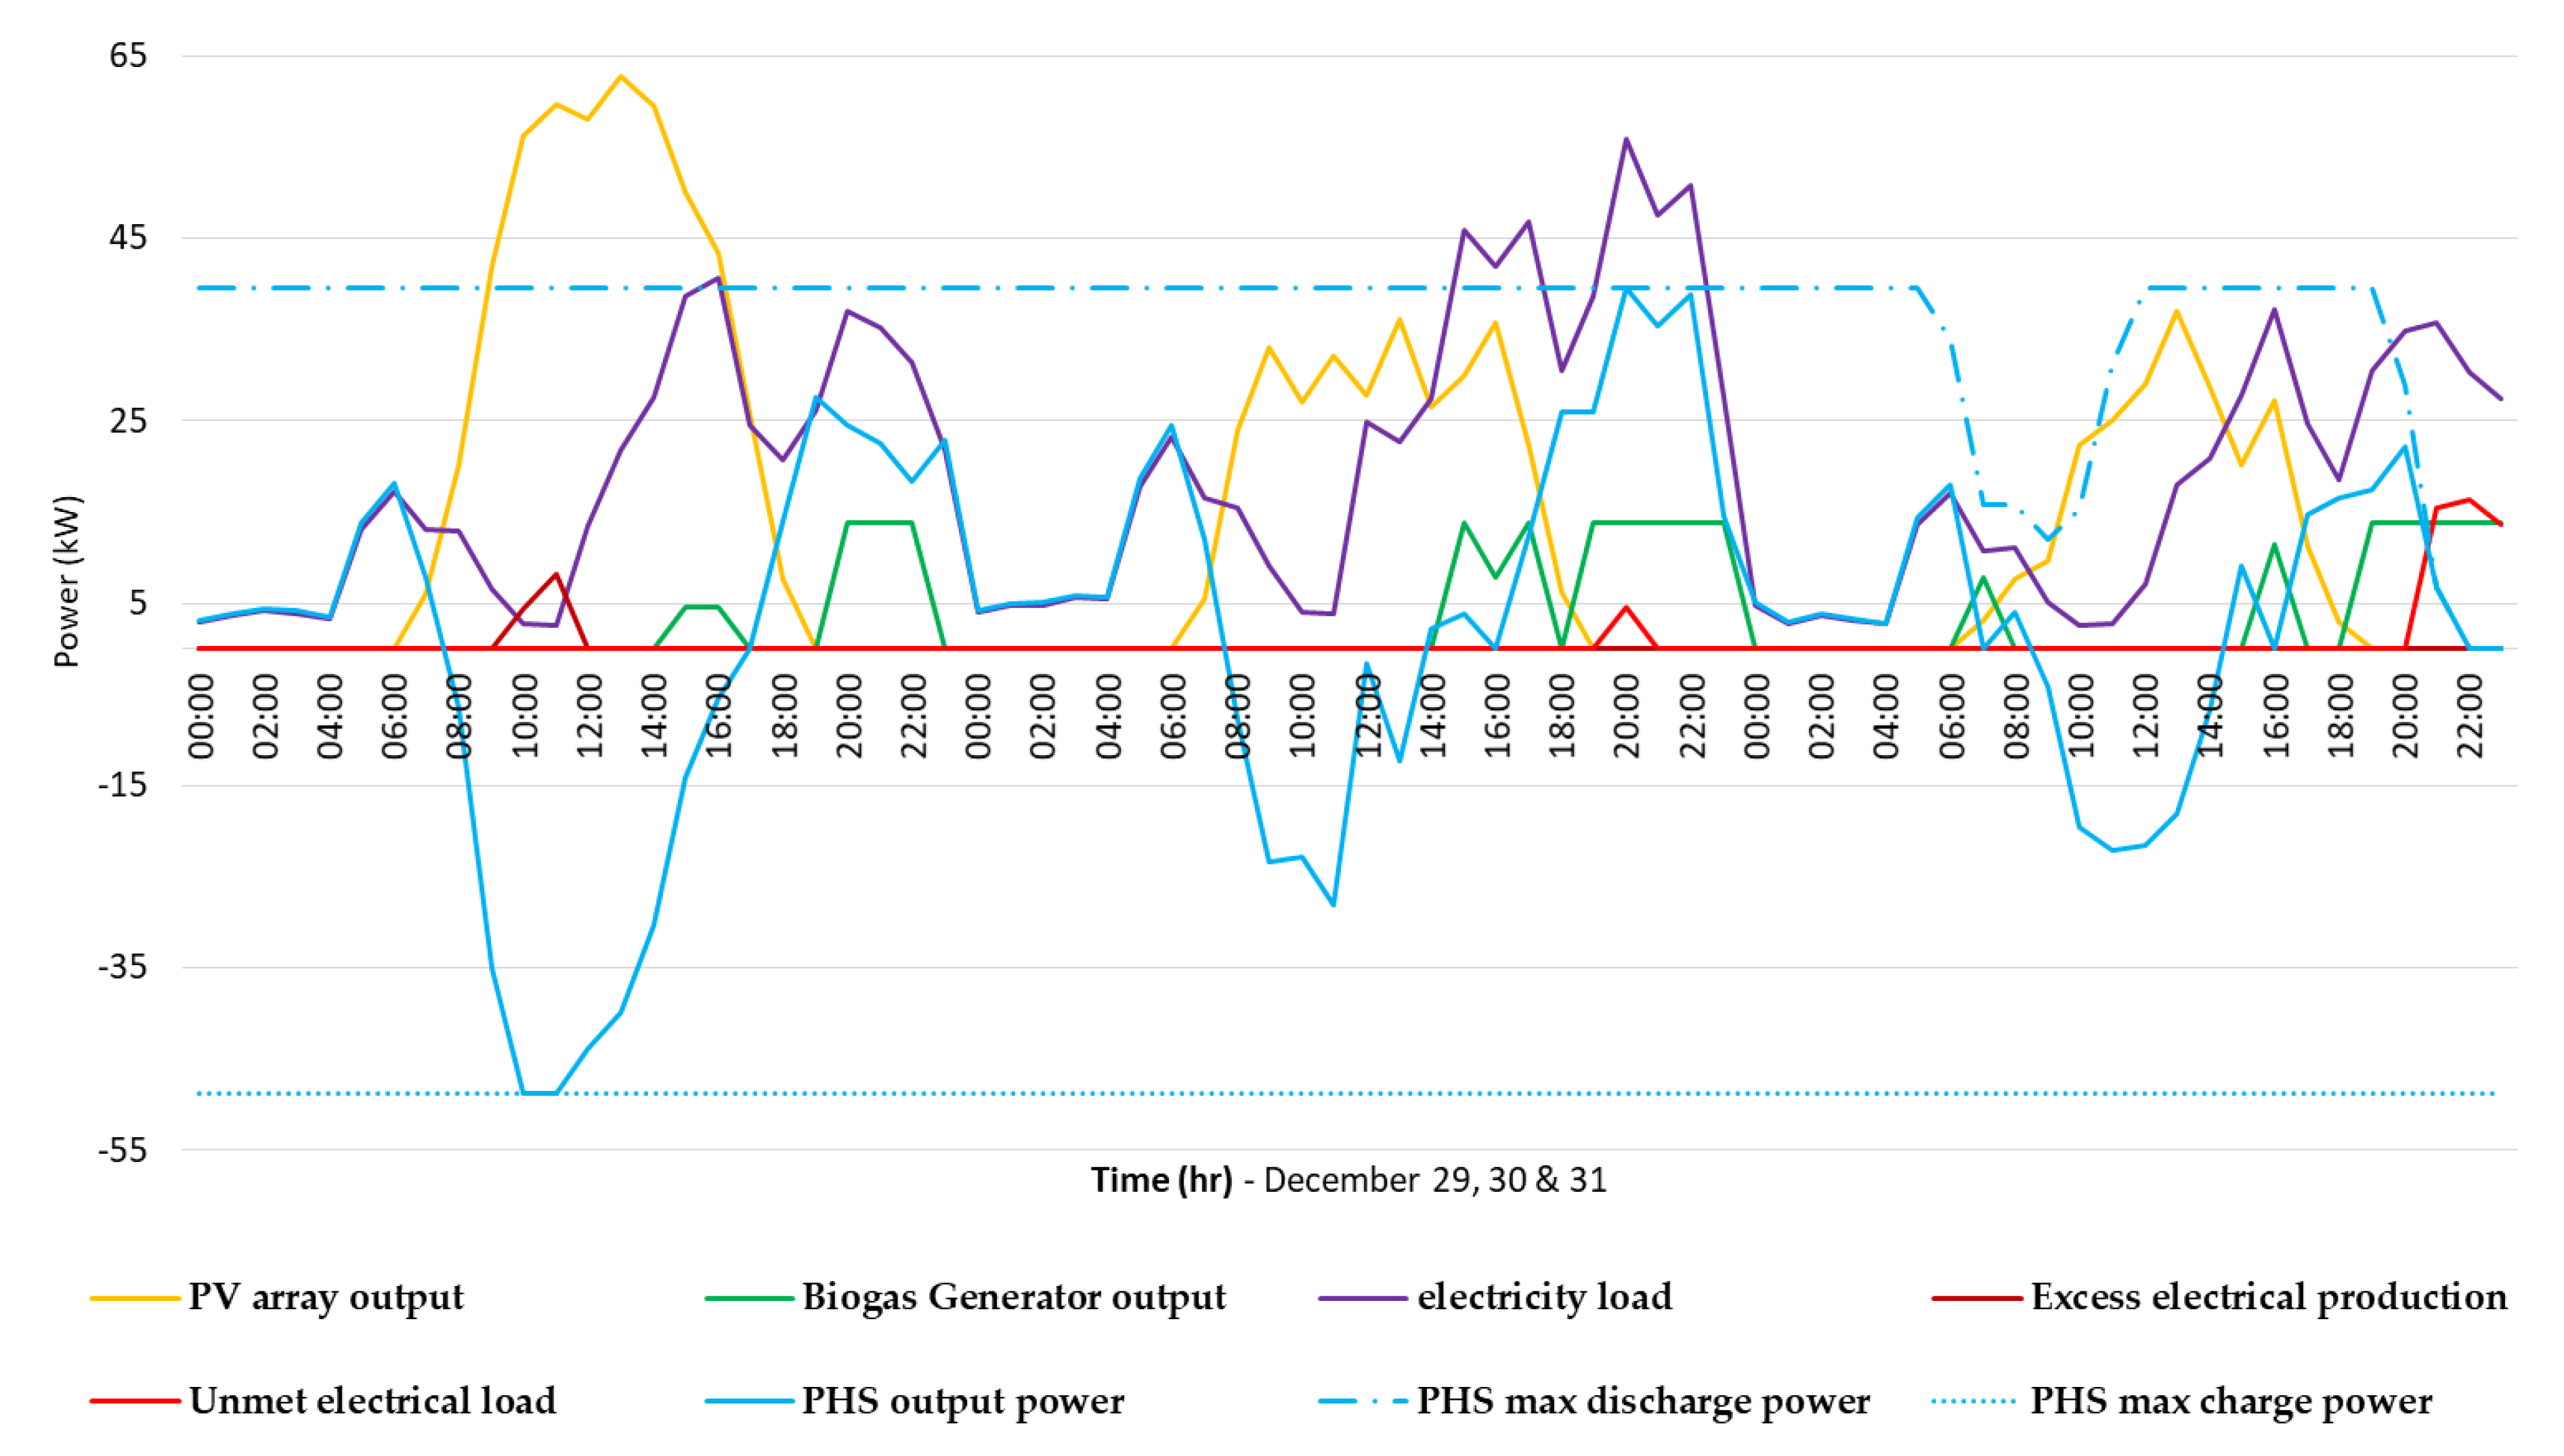
2.7.2. Dispatch Strategy
2.7.3. Optimization Variables and Search Space
2.7.4. Constraints
- The constraint that is related to the capacity shortage is defined by the maximum annual capacity shortage, which was set at 5% in this study. This means that HOMER discarded any system that did not meet at least 95% of the annual electrical load plus the operating reserve.
- Constraints related to the operating reserve are those that impose excess operating capacity to ensure the reliability of the system in the event of a sudden increase in load or a reduction in renewable energy production. HOMER defines the required operating reserve using four inputs, two of which are as a percentage of the variability of the electricity load: load in current time step and annual peak load; and two as a percentage of renewable energy production: solar power output and wind power output. In this case study, the operating reserve percentages that are associated with the load in current time step, annual peak load, solar power output, and wind power wind output were set at 10%, 15%, 20%, and 50%, respectively.
2.8. Sensitivity Analysis
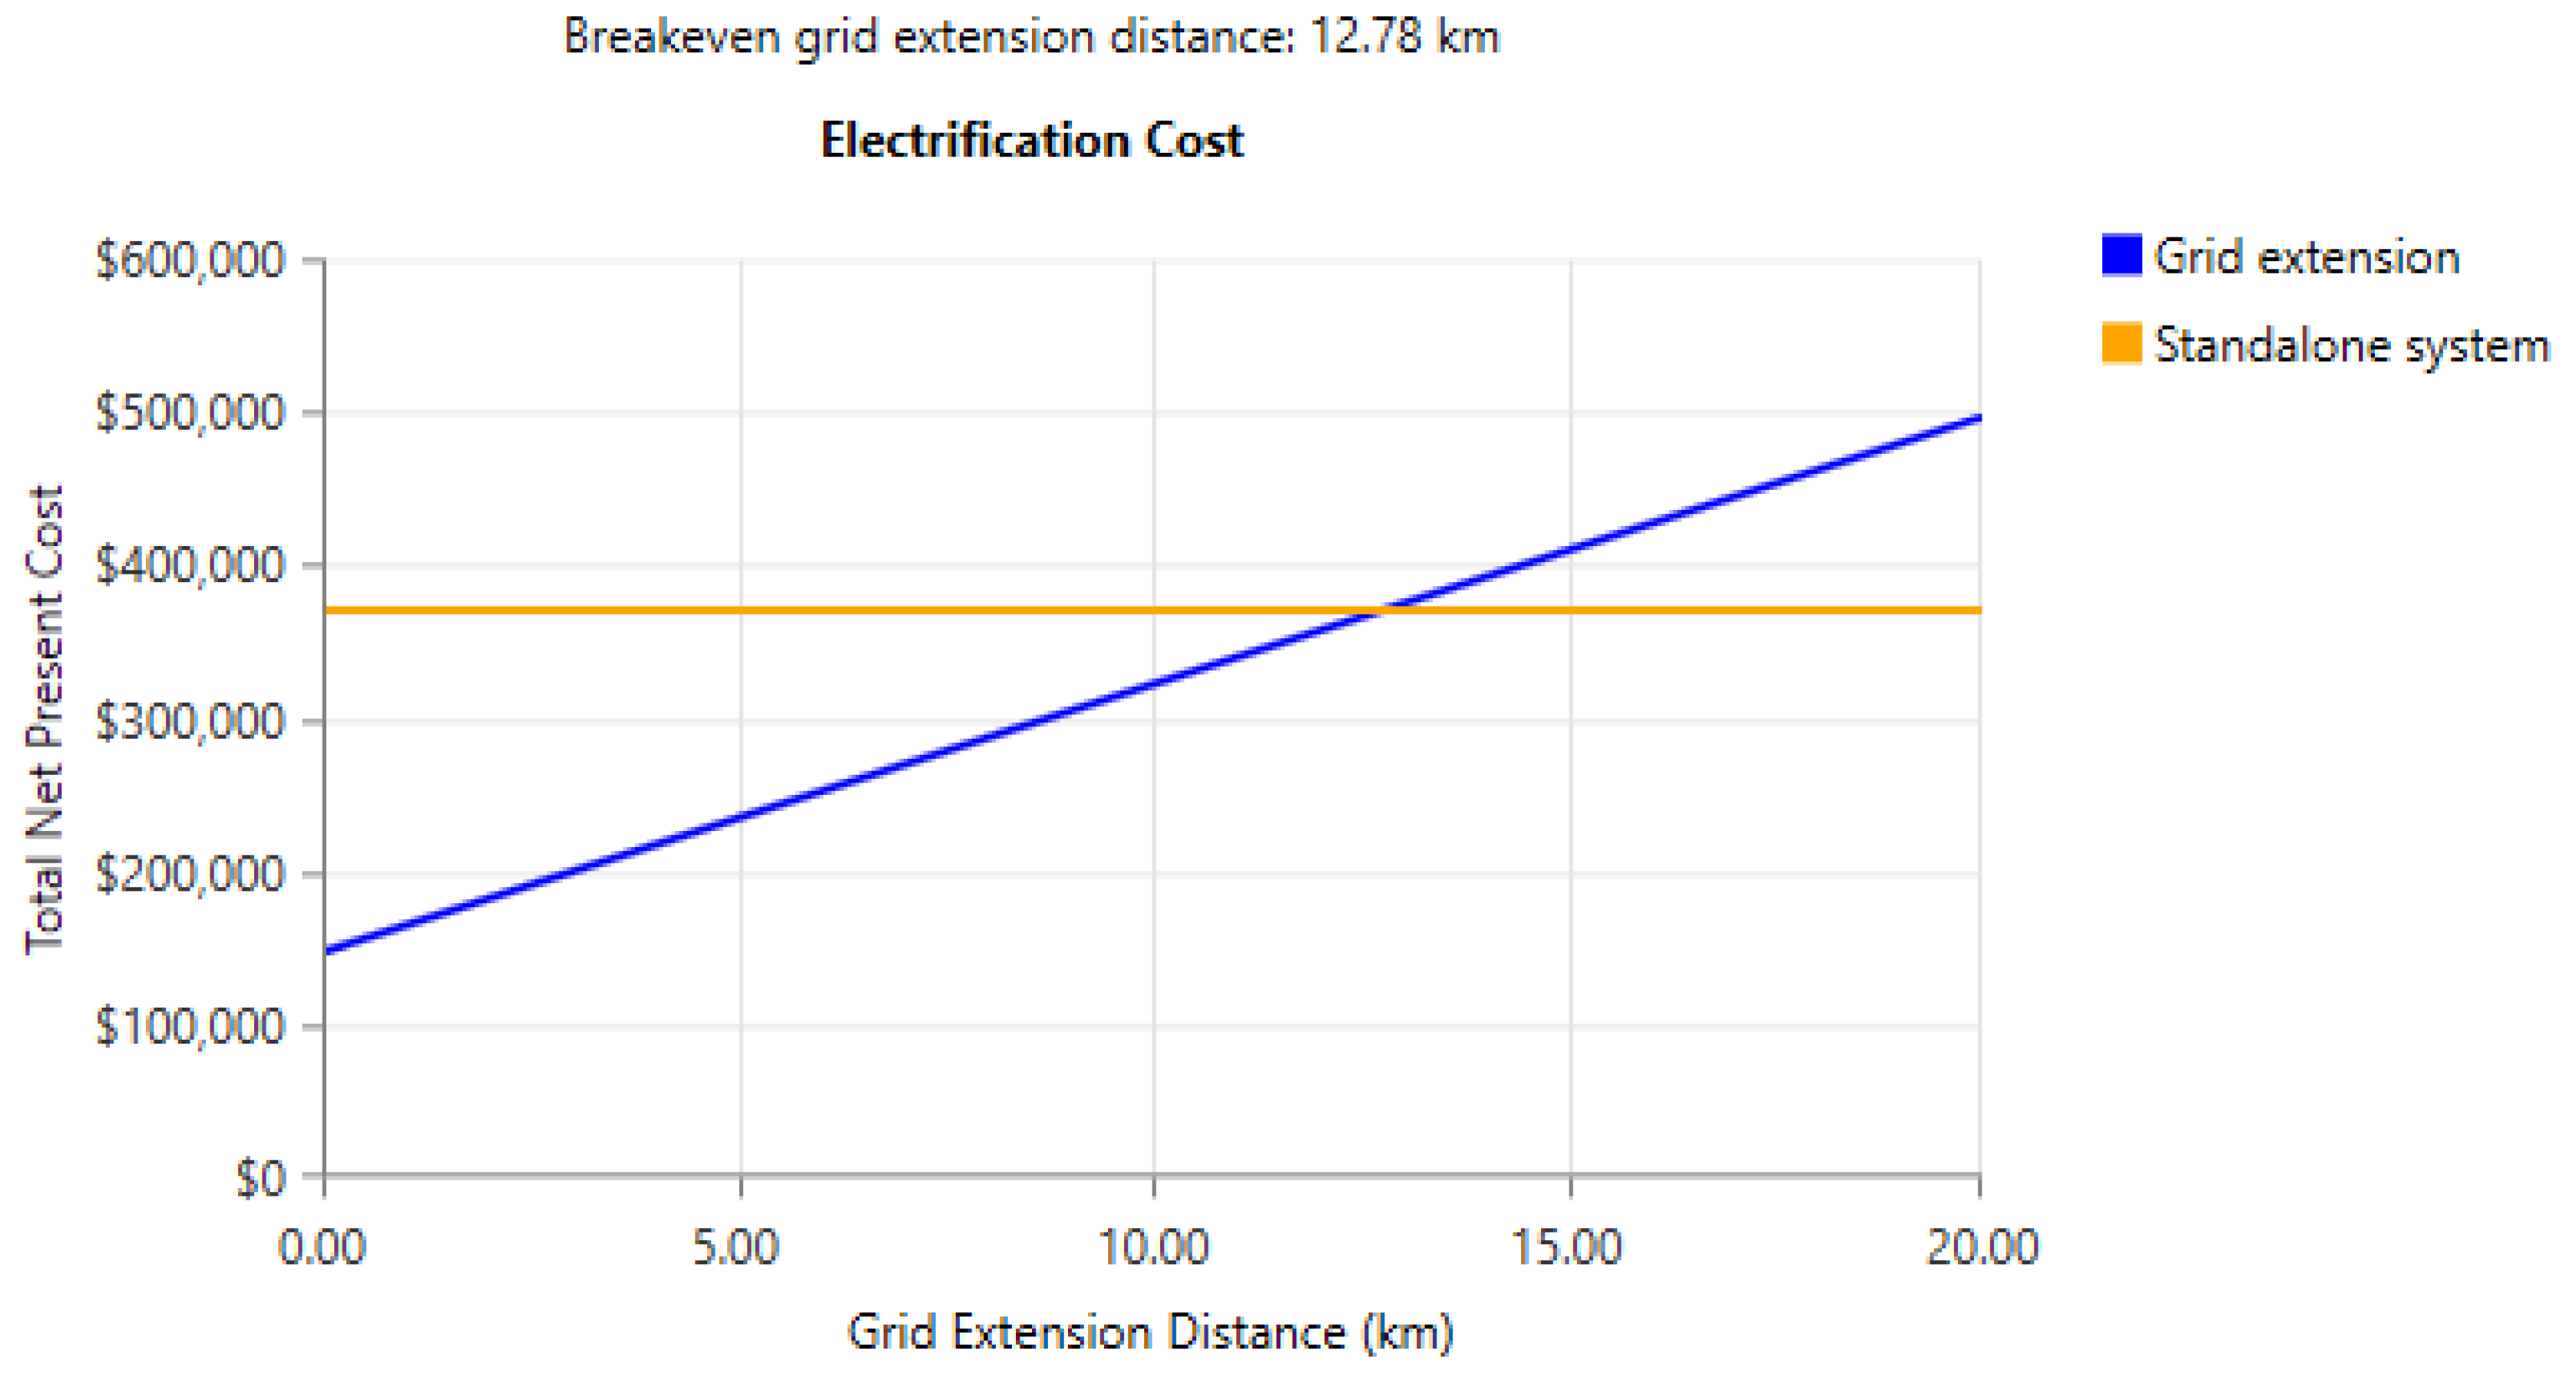
2.9. The grid Extension
3. Results
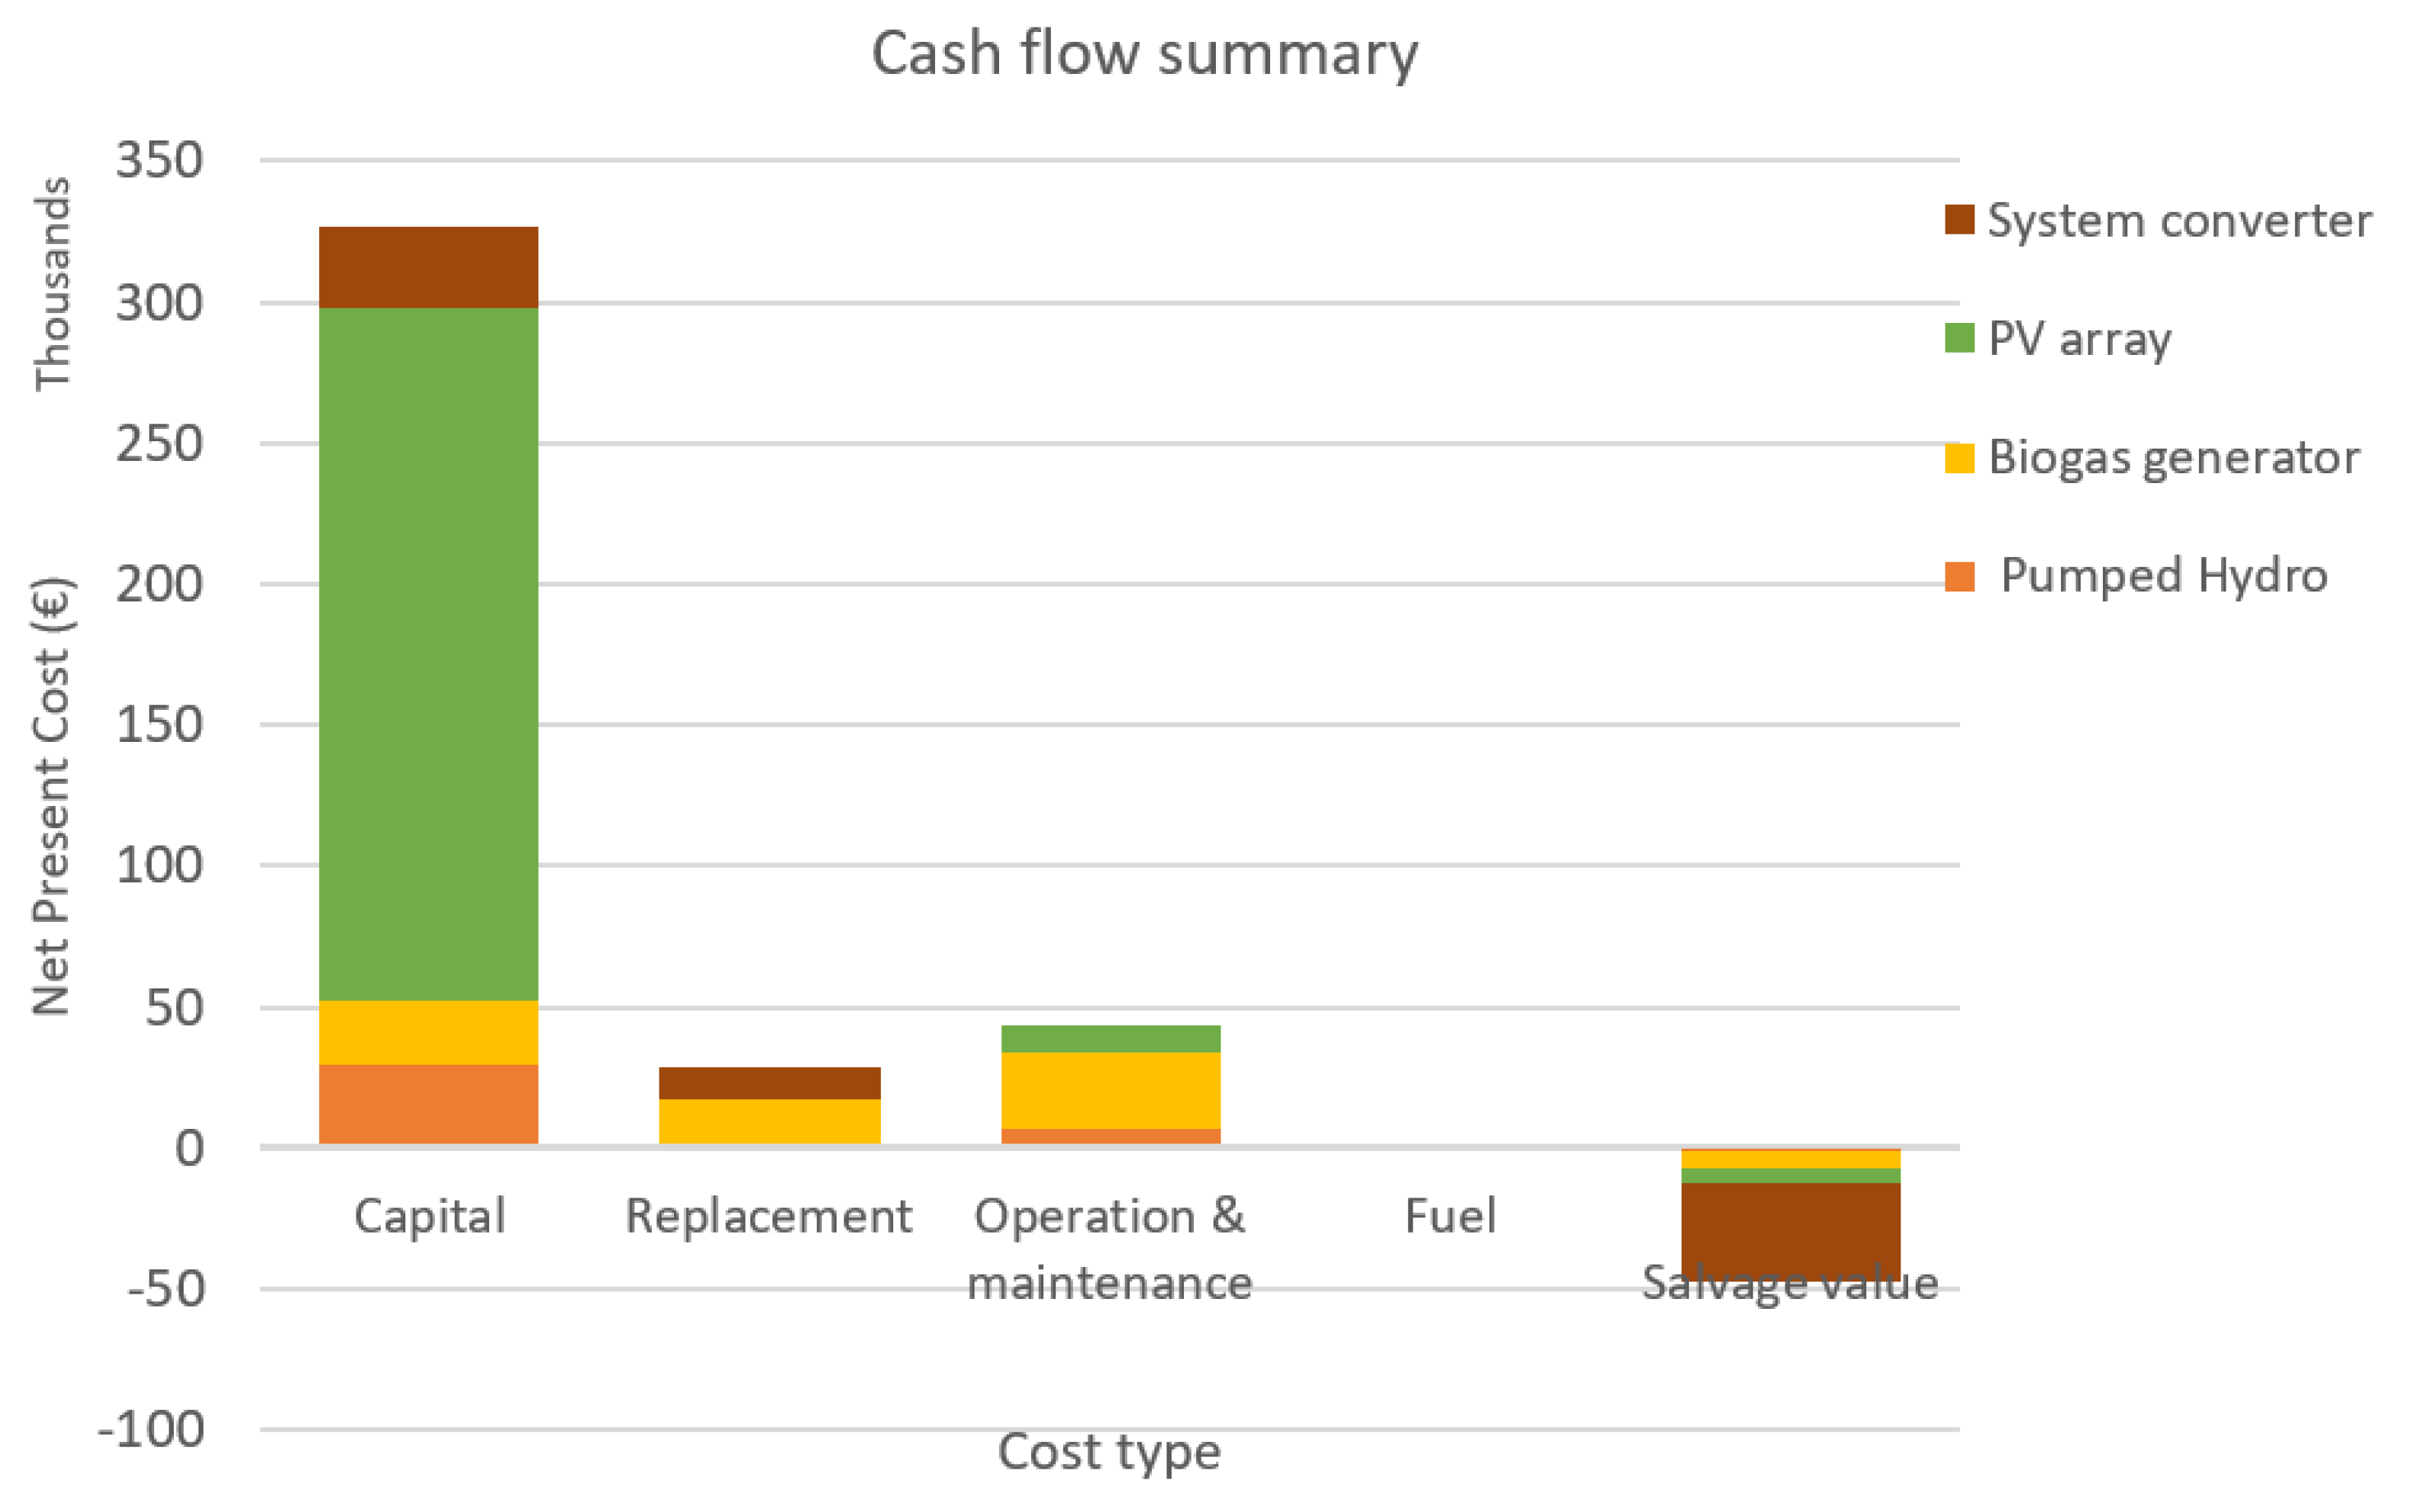
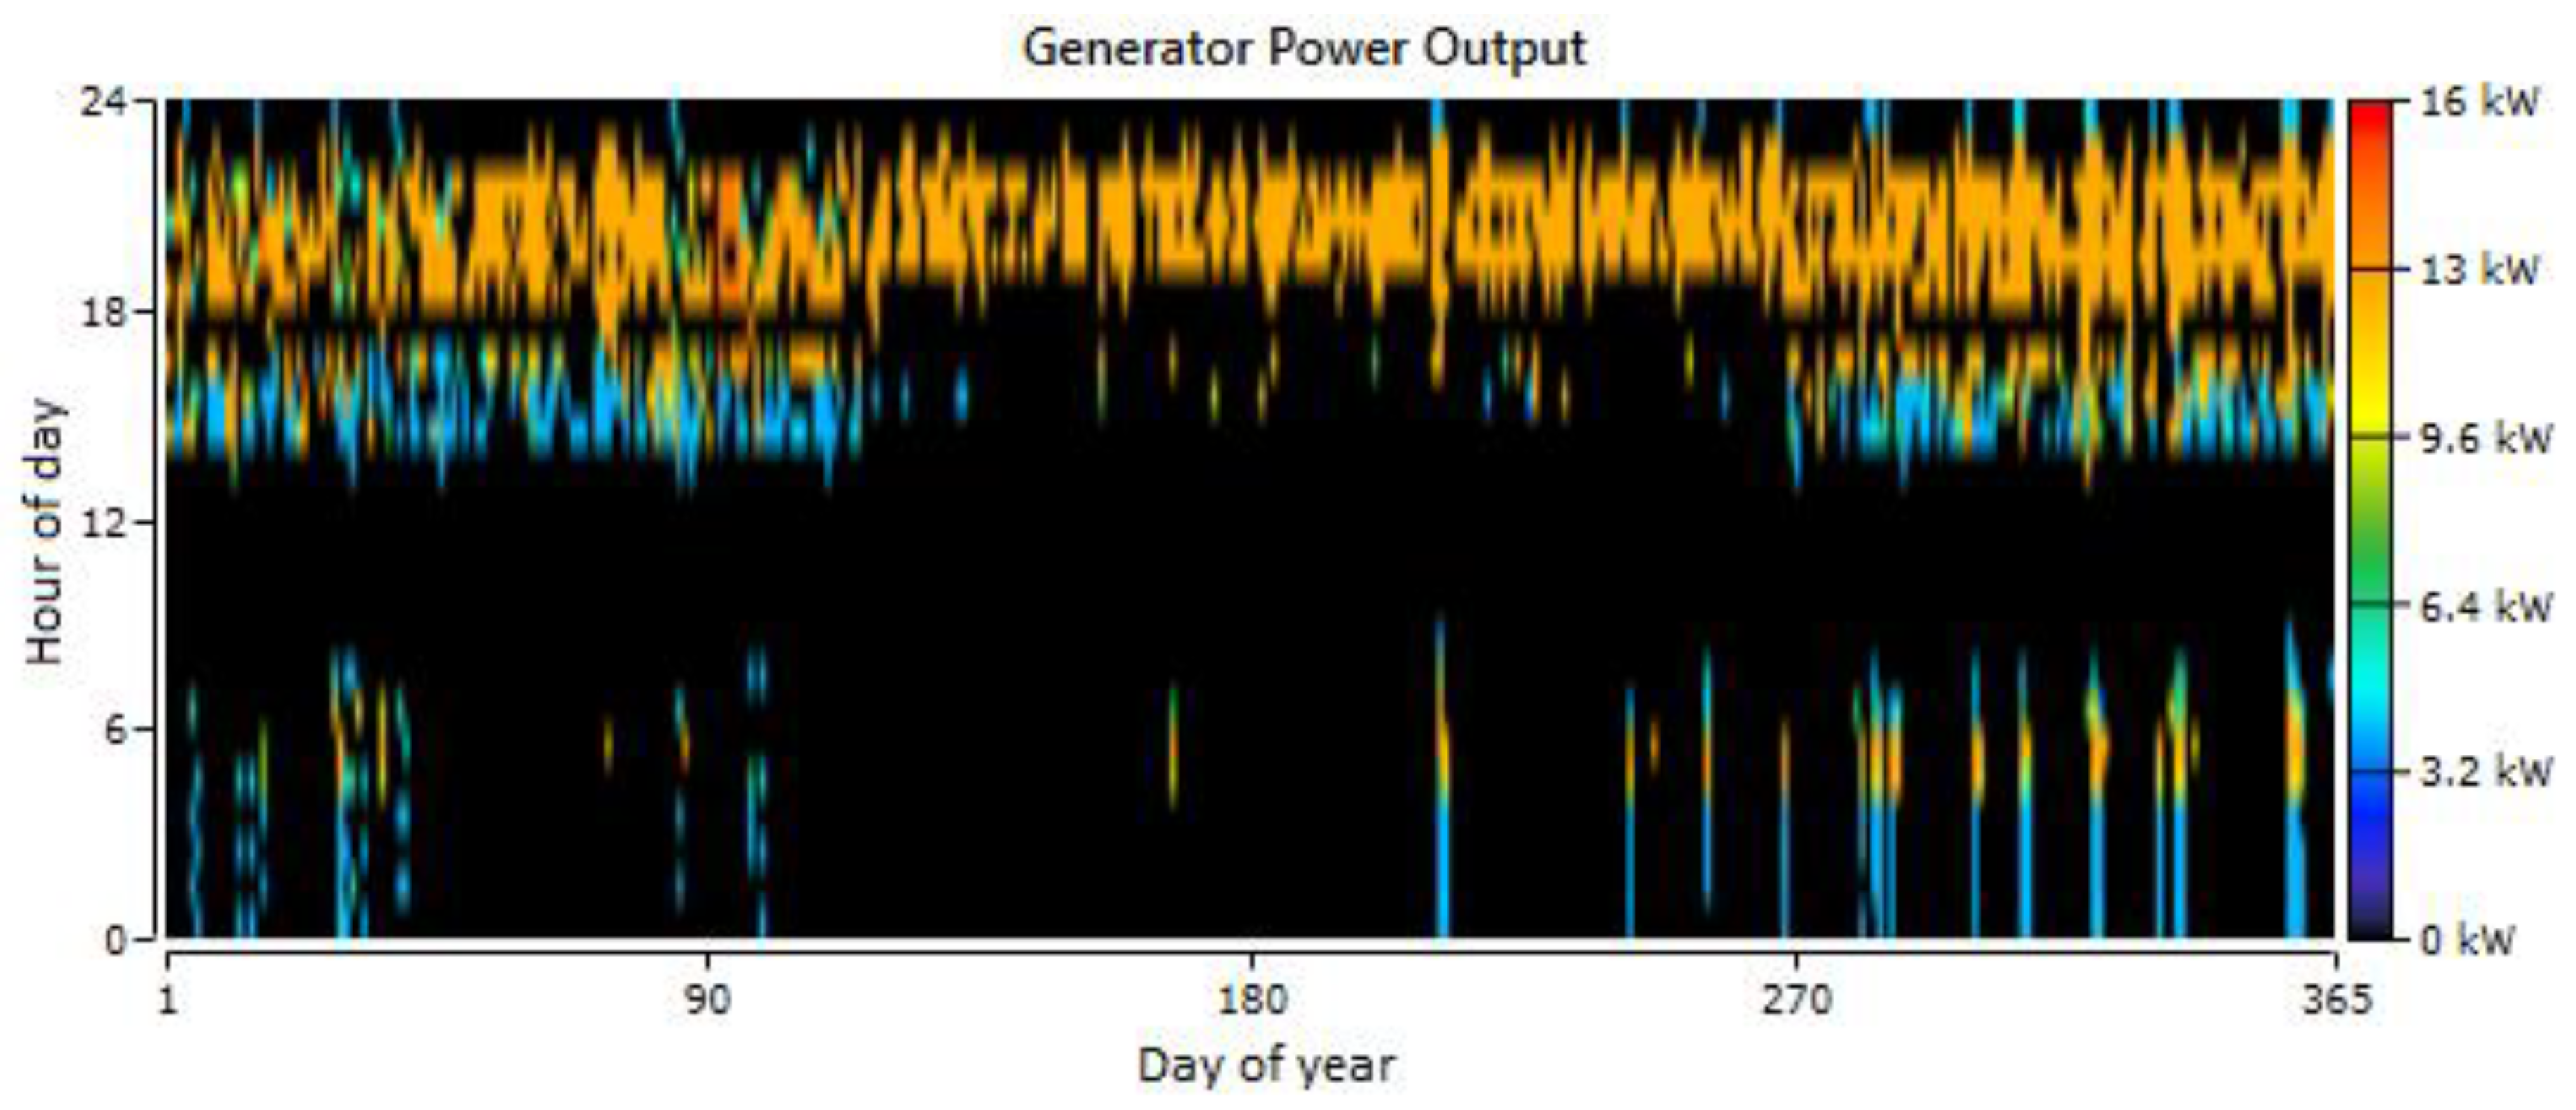
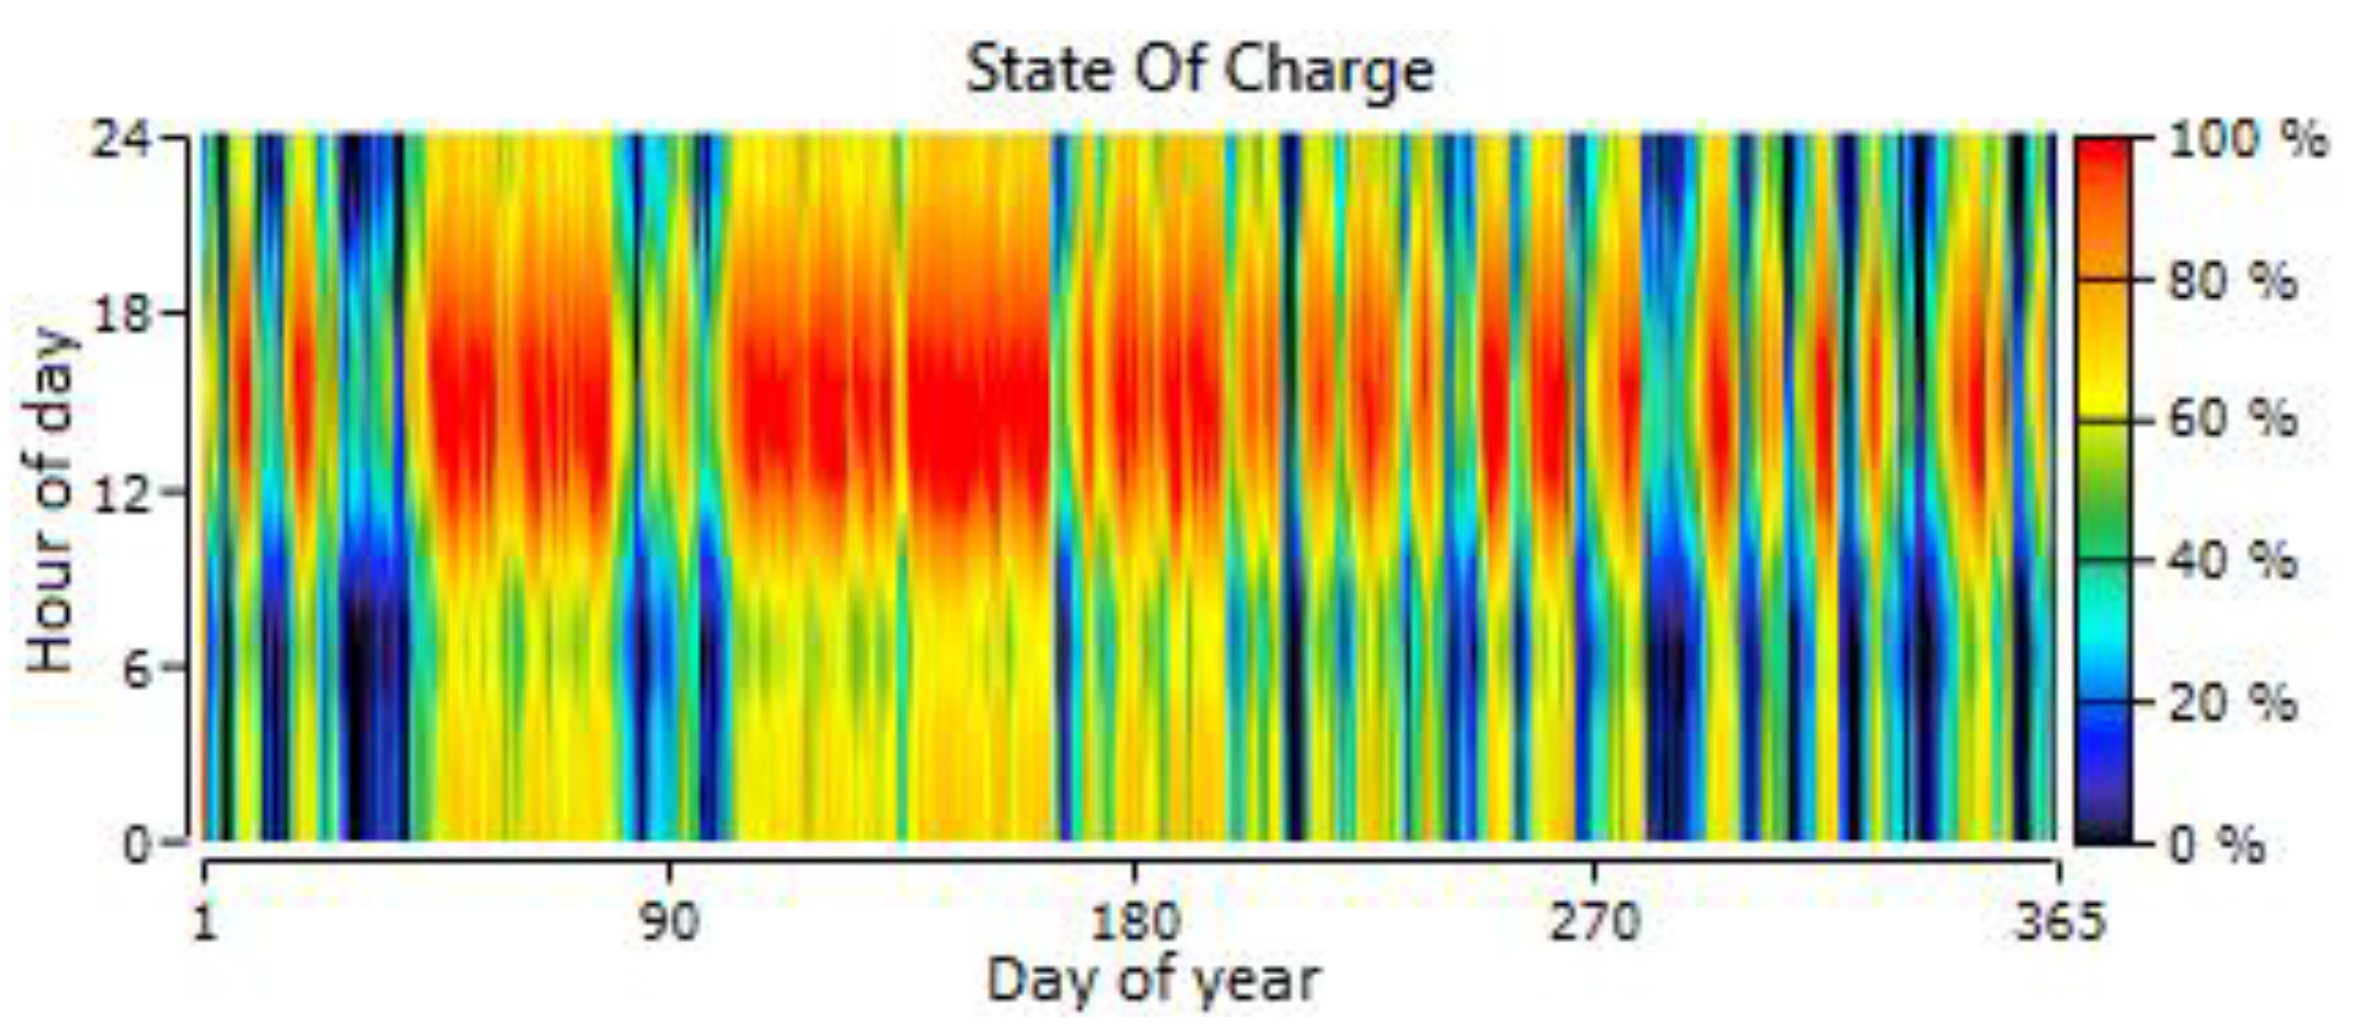
3.1. Optimization Results
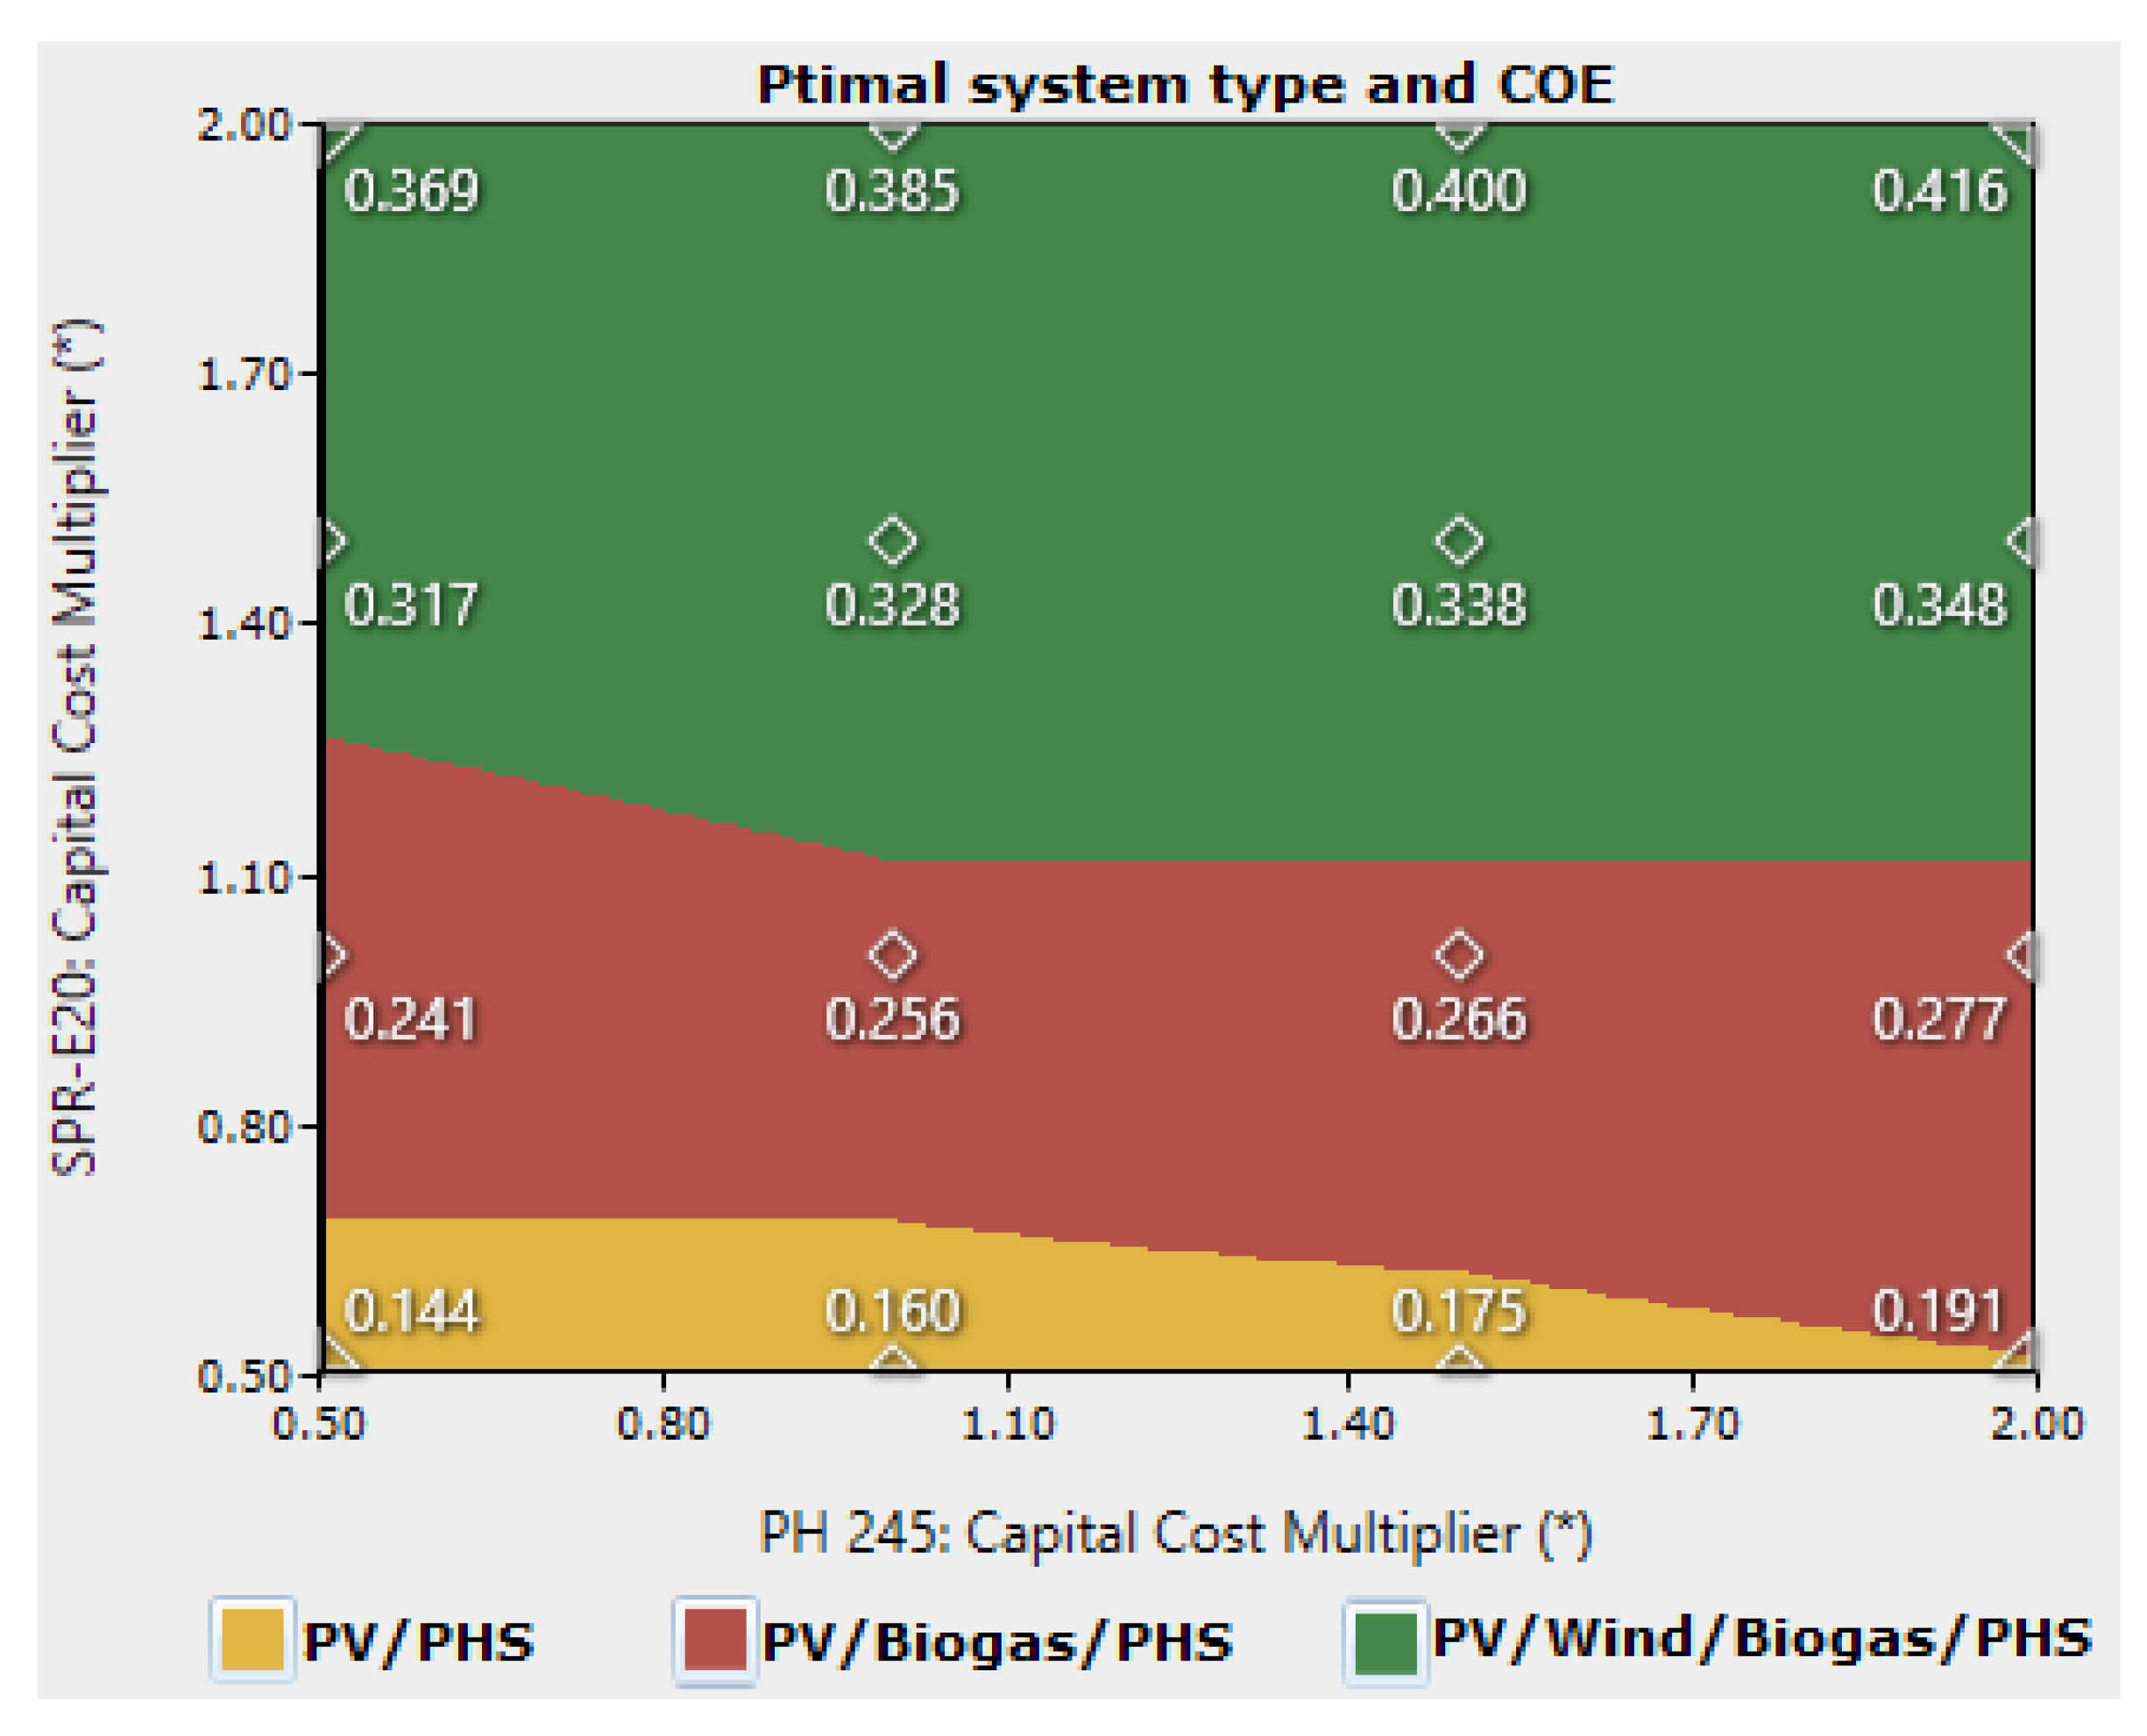
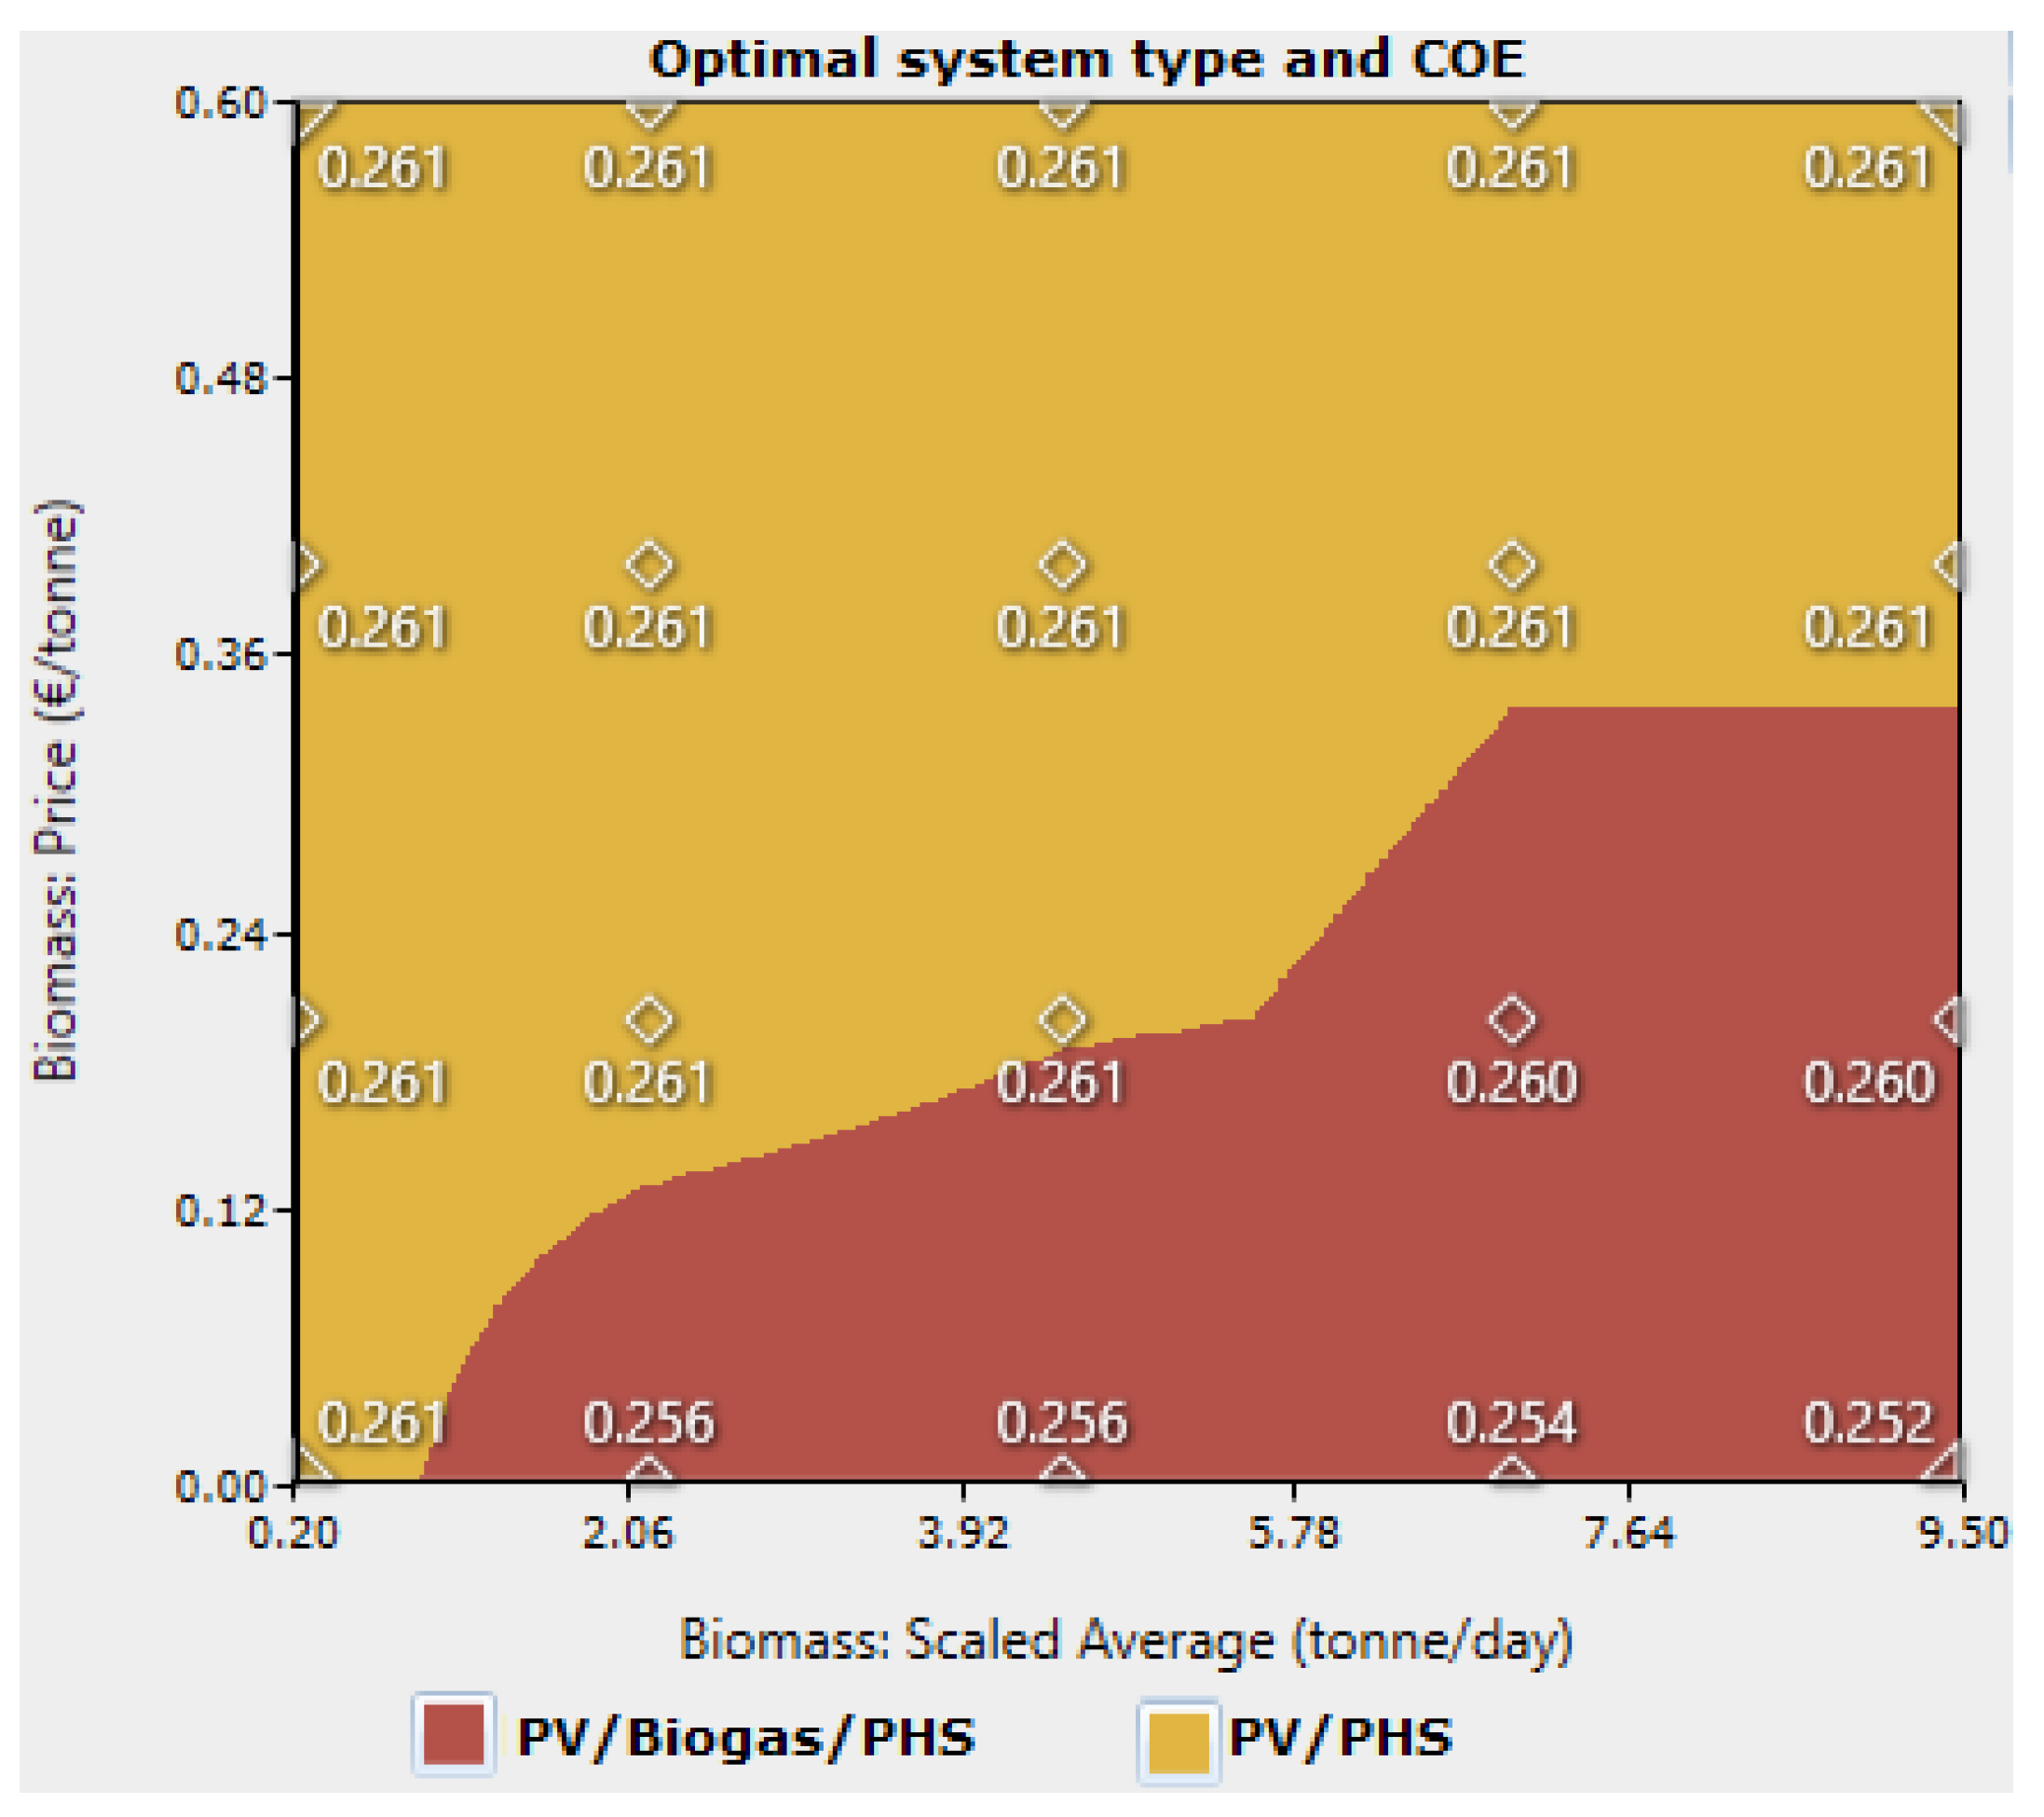
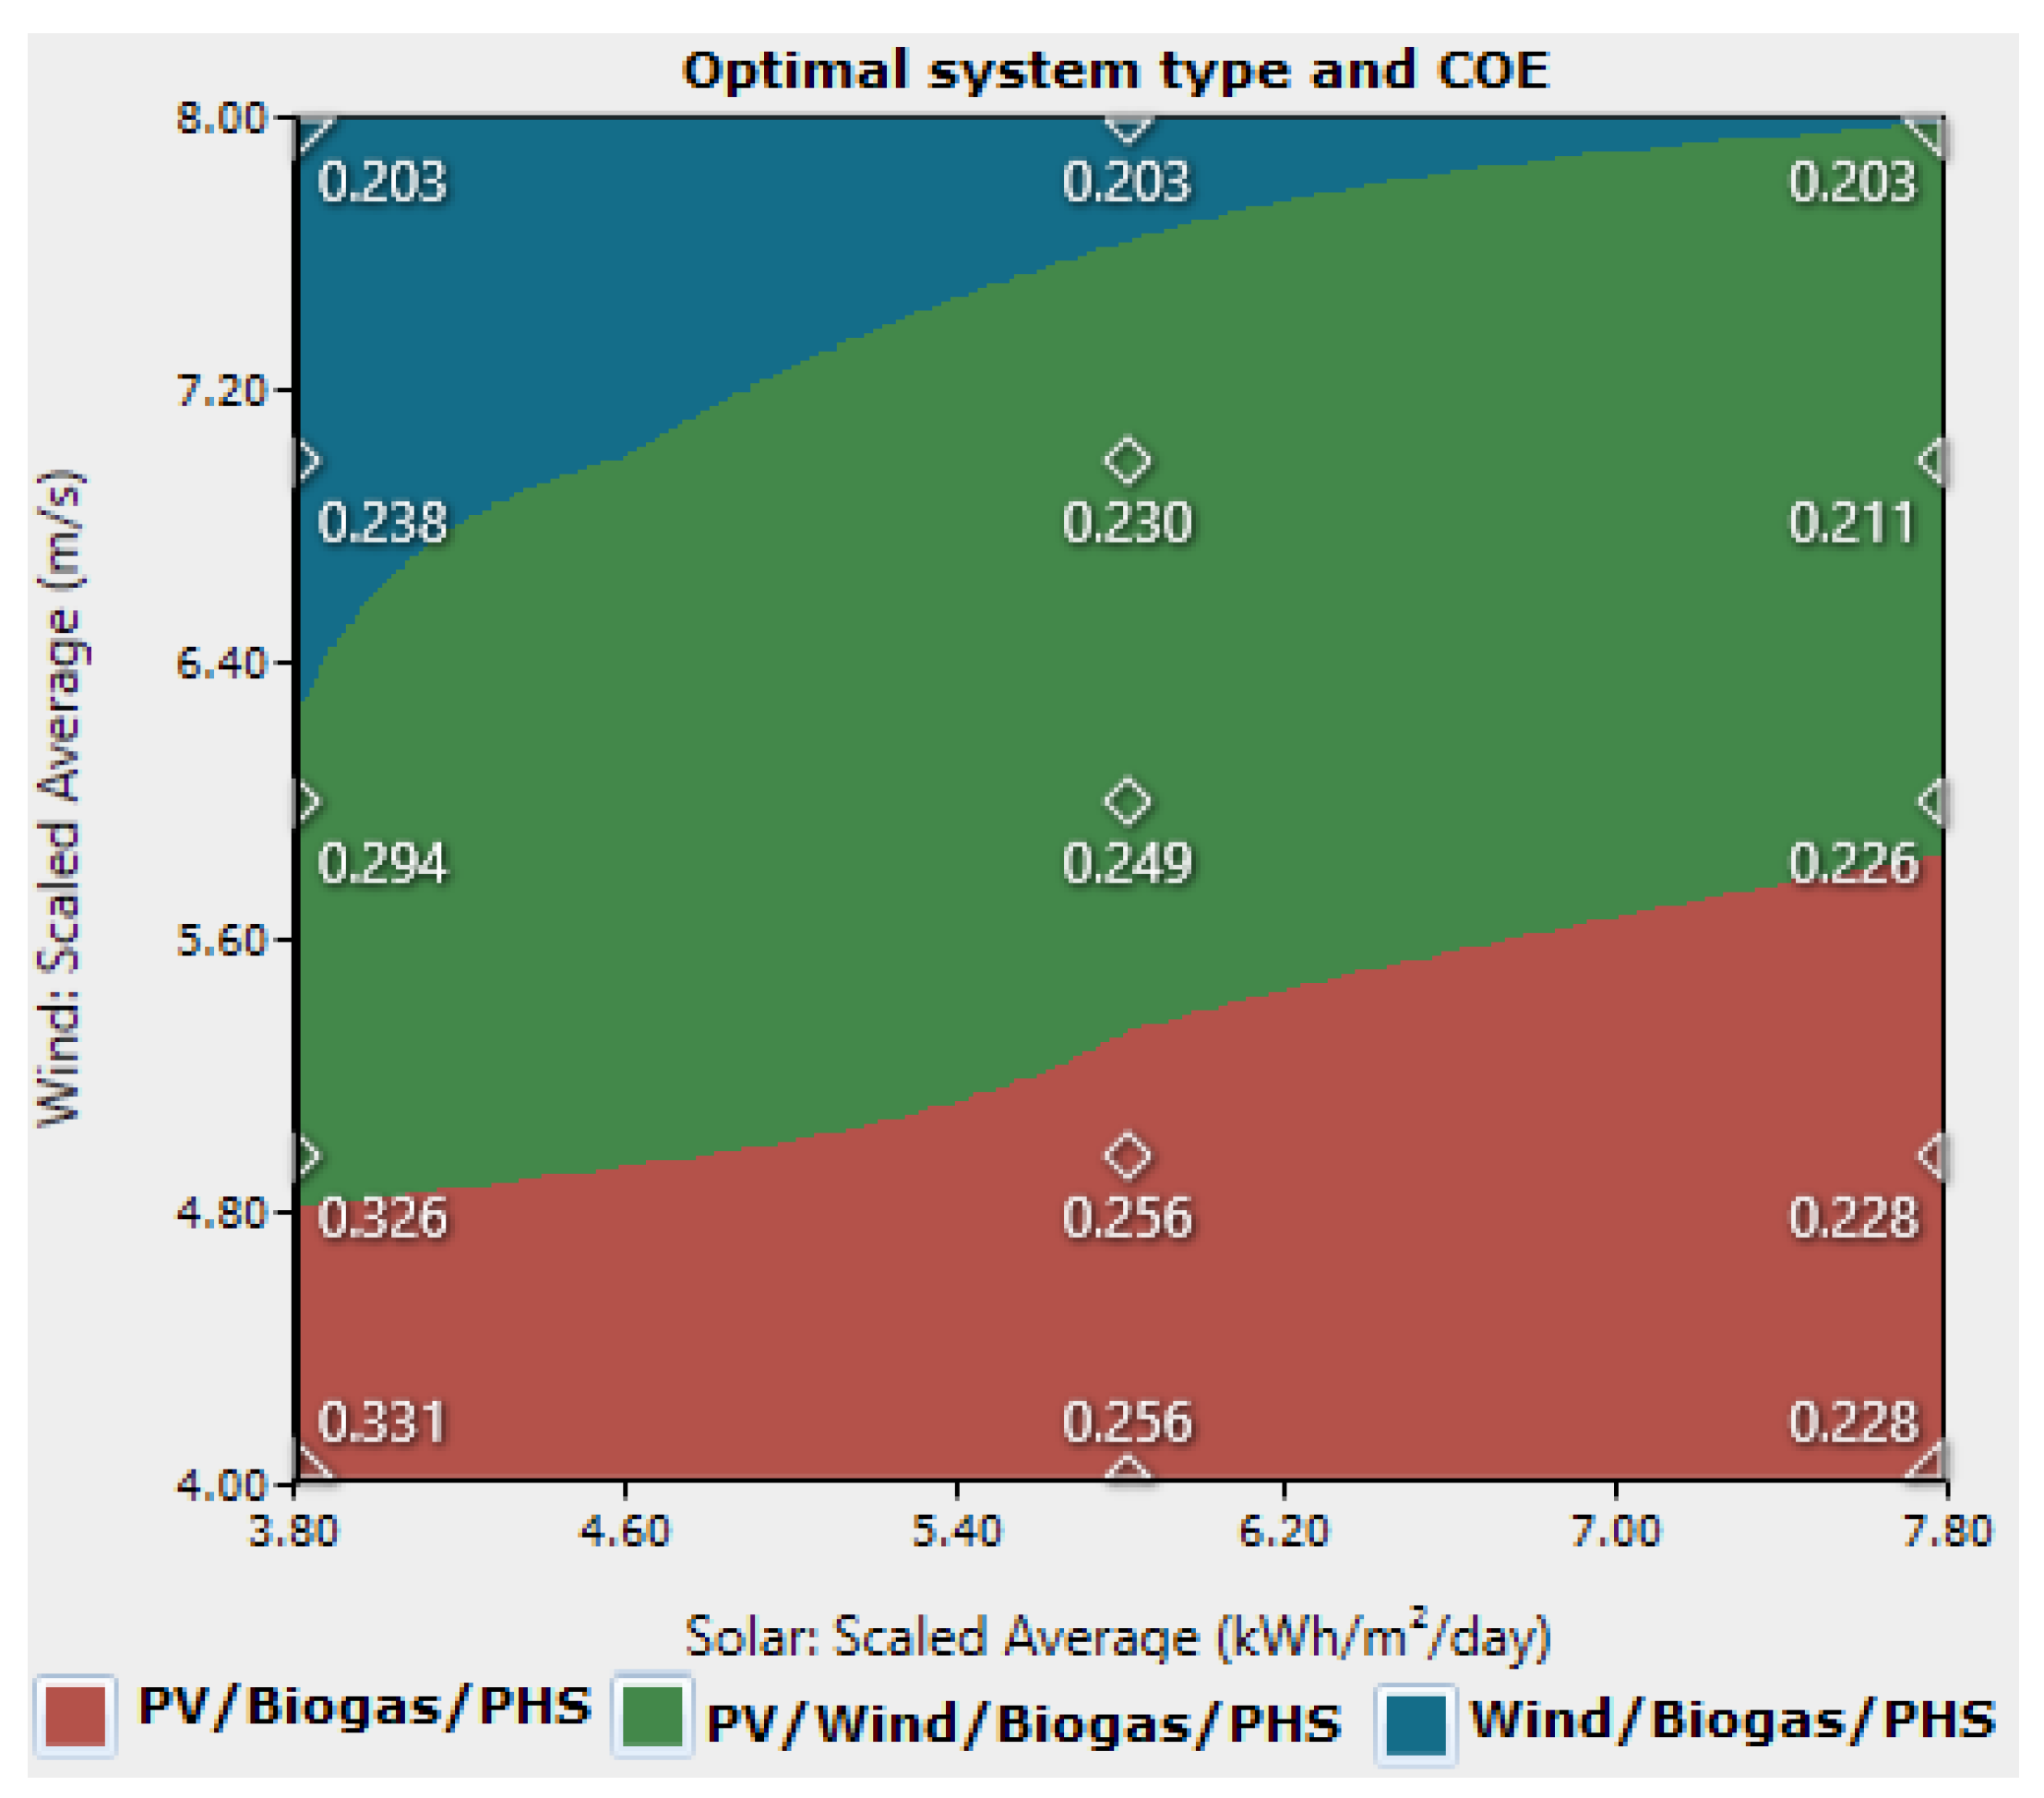
3.2. Sensitivity Results
4. Discussion
5. Conclusions
Author Contributions
Funding
Conflicts of Interest
References
- Riva, F.; Ahlborg, H.; Hartvigsson, E.; Pachauri, S.; Colombo, E. Electricity access and rural development: Review of complex socio-economic dynamics and casual diagrams for more appropriate energy modelling. Energy Sustain. Dev. 2018, 43, 203–223. [Google Scholar] [CrossRef]
- World Energy Outlook Special Report. Energy Access Outlook 2017: From Poverty to Prosperity. Available online: https://www.iea.org/publications/freepublications/publication/WEO2017SpecialReport_EnergyAccessOutlook.pdf (accessed on 10 September 2018).
- Adams, S.; Klobodu, E.K.M.; Opoku, E.E.O. Energy consumption, political regime and economic growth in sub-Saharan Africa. Energy Policy 2016, 96, 36–44. [Google Scholar] [CrossRef]
- Trotter, P.A. Rural electrification, electrification inequality and democratic institutions in sub-Saharan Africa. Energy Sustain. Dev. 2016, 34, 111–129. [Google Scholar] [CrossRef]
- Feder, G.; Savastano, S. Modern agricultural technology adoption in sub-Saharan Africa: A four-country analysis. In Agriculture and Rural Development in a Globalizing World; Routledge: Abingdon-on-Thames, UK, 2017; pp. 11–25. [Google Scholar]
- Orlando, M.B.; Janik, V.L.; Vaidya, P.; Angelou, N.; Zumbyte, I.; Adams, N. Getting to Gender Equality in Energy Infrastructure: Lessons from Electricity Generation, Transmission, and Distribution Projects. 2018. Available online: http://documents.worldbank.org/curated/en/930771499888717016/pdf/117350-ESMAP-P147443-PUBLIC-getting-to-gender-equality.pdf (accessed on 12 August 2018).
- Dagnachew, A.G.; Lucas, P.L.; Hof, A.F.; Gernaat, D.E.; de Boer, H.-S.; van Vuuren, D.P. The role of decentralized systems in providing universal electricity access in Sub-Saharan Africa–A model-based approach. Energy 2017, 139, 184–195. [Google Scholar] [CrossRef]
- McCright, A.M.; Dunlap, R.E. The politicization of climate change and polarization in the American public’s views of global warming, 2001–2010. Sociol. Q. 2011, 52, 155–194. [Google Scholar] [CrossRef]
- Lauber, V.; Jacobsson, S. The politics and economics of constructing, contesting and restricting socio-political space for renewables–The German Renewable Energy Act. Environ. Innov. Soc. Transit. 2016, 18, 147–163. [Google Scholar] [CrossRef]
- Sinha, S.; Chandel, S. Review of software tools for hybrid renewable energy systems. Renew. Sustain. Energy Rev. 2014, 32, 192–205. [Google Scholar] [CrossRef]
- Nfah, E.; Ngundam, J. Feasibility of pico-hydro and photovoltaic hybrid power systems for remote villages in Cameroon. Renew. Energy 2009, 34, 1445–1450. [Google Scholar] [CrossRef]
- Adaramola, M.S.; Agelin-Chaab, M.; Paul, S.S. Analysis of hybrid energy systems for application in southern Ghana. Energy Convers. Manag. 2014, 88, 284–295. [Google Scholar] [CrossRef]
- Halabi, L.M.; Mekhilef, S.; Olatomiwa, L.; Hazelton, J. Performance analysis of hybrid PV/diesel/battery system using HOMER: A case study Sabah, Malaysia. Energy Convers. Manag. 2017, 144, 322–339. [Google Scholar] [CrossRef]
- Singh, S.; Singh, M.; Kaushik, S.C. Feasibility study of an islanded microgrid in rural area consisting of PV, wind, biomass and battery energy storage system. Energy Convers. Manag. 2016, 128, 178–190. [Google Scholar] [CrossRef]
- Sigarchian, S.G.; Paleta, R.; Malmquist, A.; Pina, A. Feasibility study of using a biogas engine as backup in a decentralized hybrid (PV/wind/battery) power generation system–Case study Kenya. Energy 2015, 90, 1830–1841. [Google Scholar] [CrossRef]
- Baghdadi, F.; Mohammedi, K.; Diaf, S.; Behar, O. Feasibility study and energy conversion analysis of stand-alone hybrid renewable energy system. Energy Convers. Manag. 2015, 105, 471–479. [Google Scholar] [CrossRef]
- Ma, T.; Yang, H.; Lu, L.; Peng, J. Technical feasibility study on a standalone hybrid solar-wind system with pumped hydro storage for a remote island in Hong Kong. Renew. Energy 2014, 69, 7–15. [Google Scholar] [CrossRef]
- Kenfack, J.; Neirac, F.P.; Tatietse, T.T.; Mayer, D.; Fogue, M.; Lejeune, A. Microhydro-PV-hybrid system: Sizing a small hydro-PV-hybrid system for rural electrification in developing countries. Renew. Energy 2009, 34, 2259–2263. [Google Scholar] [CrossRef]
- Singh, S.S.; Fernandez, E. Modeling, size optimization and sensitivity analysis of a remote hybrid renewable energy system. Energy 2018, 143, 719–731. [Google Scholar] [CrossRef]
- Ahmad, J.; Imran, M.; Khalid, A.; Iqbal, W.; Ashraf, S.R.; Adnan, M.; Ali, S.F.; Khokhar, K.S. Techno economic analysis of a wind-photovoltaic-biomass hybrid renewable energy system for rural electrification: A case study of Kallar Kahar. Energy 2018, 148, 208–234. [Google Scholar] [CrossRef]
- Kusakana, K. Optimization of the daily operation of a hydrokinetic–diesel hybrid system with pumped hydro storage. Energy Convers. Manag. 2015, 106, 901–910. [Google Scholar] [CrossRef]
- Sawle, Y.; Gupta, S.; Bohre, A.K. Socio-techno-economic design of hybrid renewable energy system using optimization techniques. Renew. Energy 2018, 119, 459–472. [Google Scholar] [CrossRef]
- Aoudji, A.K.; Kindozoun, P.; Adegbidi, A.; Ganglo, J.C. Land Access and Household Food Security in Kpomassè District, Southern Benin: A Few Lessons for Smallholder Agriculture Interventions. Sustain. Agric. Res. 2017, 6, 104. [Google Scholar] [CrossRef]
- Luo, X.; Wang, J.; Dooner, M.; Clarke, J. Overview of current development in electrical energy storage technologies and the application potential in power system operation. Appl. Energy 2015, 137, 511–536. [Google Scholar] [CrossRef]
- Ma, T.; Yang, H.; Lu, L. Feasibility study and economic analysis of pumped hydro storage and battery storage for a renewable energy powered island. Energy Convers. Manag. 2014, 79, 387–397. [Google Scholar] [CrossRef]
- Connolly, D.; Lund, H.; Mathiesen, B.V.; Leahy, M. A review of computer tools for analysing the integration of renewable energy into various energy systems. Appl. Energy 2010, 87, 1059–1082. [Google Scholar] [CrossRef]
- Luna-Rubio, R.; Trejo-Perea, M.; Vargas-Vázquez, D.; Ríos-Moreno, G. Optimal sizing of renewable hybrids energy systems: A review of methodologies. Sol. Energy 2012, 86, 1077–1088. [Google Scholar] [CrossRef]
- Bahramara, S.; Moghaddam, M.P.; Haghifam, M. Optimal planning of hybrid renewable energy systems using HOMER: A review. Renew. Sustain. Energy Rev. 2016, 62, 609–620. [Google Scholar] [CrossRef]
- Shahzad, M.K.; Zahid, A.; ur Rashid, T.; Rehan, M.A.; Ali, M.; Ahmad, M. Techno-economic feasibility analysis of a solar-biomass off grid system for the electrification of remote rural areas in Pakistan using HOMER software. Renew. Energy 2017, 106, 264–273. [Google Scholar] [CrossRef]
- Sen, R.; Bhattacharyya, S.C. Off-grid electricity generation with renewable energy technologies in India: An application of HOMER. Renew. Energy 2014, 62, 388–398. [Google Scholar] [CrossRef]
- Mahlia, T.; Saktisahdan, T.; Jannifar, A.; Hasan, M.; Matseelar, H. A review of available methods and development on energy storage; technology update. Renew. Sustain. Energy Rev. 2014, 33, 532–545. [Google Scholar] [CrossRef]
- NASA Surface Meteorology and Solar Energy. Available online: https://power.larc.nasa.gov/ (accessed on 10 September 2018).
- Kidmo, D.K.; Deli, K.; Raidandi, D.; Yamigno, S.D. Wind energy for electricity generation in the far north region of Cameroon. Energy Procedia 2016, 93, 66–73. [Google Scholar] [CrossRef]
- Bhatt, A.; Sharma, M.; Saini, R. Feasibility and sensitivity analysis of an off-grid micro hydro–photovoltaic–biomass and biogas–diesel–battery hybrid energy system for a remote area in Uttarakhand state, India. Renew. Sustain. Energy Rev. 2016, 61, 53–69. [Google Scholar] [CrossRef]
- Hasan, A.M.; Khan, M.F.; Dey, A.; Yaqub, M.; Al Mamun, M.A. Feasibility study on the available renewable sources in the island of Sandwip, Bangladesh for generation of electricity. In Proceedings of the 2nd International Conference on the Developments in Renewable Energy Technology (ICDRET 2012), Dhaka, Bangladesh, 5–7 January 2012. [Google Scholar]
- Mandal, S.; Yasmin, H.; Sarker, M.; Beg, M. Prospect of solar-PV/biogas/diesel generator hybrid energy system of an off-grid area in Bangladesh. AIP Conf. Proc. 2017, 1919. [Google Scholar] [CrossRef]
- Wang, L.; Shahbazi, A.; Hanna, M.A. Characterization of corn stover, distiller grains and cattle manure for thermochemical conversion. Biomass Bioenergy 2011, 35, 171–178. [Google Scholar] [CrossRef]
- Lambert, T.; Gilman, P.; Lilienthal, P. Micropower system modeling with HOMER. Integr. Altern. Sources Energy 2005, 379–418. [Google Scholar]
- Graham, V.; Hollands, K. A method to generate synthetic hourly solar radiation globally. Sol. Energy 1990, 44, 333–341. [Google Scholar] [CrossRef]
- Distributed Generation Renewable Energy Estimate of Costs. Available online: Https://www.nrel.gov/analysis/tech-lcoe-re-cost-est.html (accessed on 10 September 2018).
- SunPower SPR-E20-327. Available online: https://www.energysage.com/panels/SunPower/SPR-E20-327/ (accessed on 10 September 2018).
- The excel 10 kW Wind Power. Available online: Available at: bergey.com/products/wind-turbines/10kw-bergey-excel (accessed on 10 September 2018).
- Pumped Hydro—Homer Energy. Available online: https://www.homerenergy.com/products/pro/docs/3.11/pumped_hydro.html (accessed on 10 September 2018).
- Deane, J.P.; Gallachóir, B.Ó.; McKeogh, E. Techno-economic review of existing and new pumped hydro energy storage plant. Renew. Sustain. Energy Rev. 2010, 14, 1293–1302. [Google Scholar] [CrossRef]
- Zachary, O.; Authority, R.E. Rural Electrification Programme in Kenya; Rural Electrification Authority: Nairobi, Kenya, 2011. [Google Scholar]
- Kaldellis, J.; Kapsali, M.; Kavadias, K. Energy balance analysis of wind-based pumped hydro storage systems in remote island electrical networks. Appl. Energy 2010, 87, 2427–2437. [Google Scholar] [CrossRef]
- Fadare, D.; Irimisose, I.; Oni, A.; Falana, A. Modeling of solar energy potential in Africa using an artificial neural network. Am. J. Sci. Ind. Res. 2010, 1, 144–157. [Google Scholar] [CrossRef]
- Mentis, D.; Hermann, S.; Howells, M.; Welsch, M.; Siyal, S.H. Assessing the technical wind energy potential in Africa a GIS-based approach. Renew. Energy 2015, 83, 110–125. [Google Scholar] [CrossRef]
- Energiewende, A.; Mayer, J.N.; Philipps, S.; Saad, N.; Hussein, D.; Schlegl, T.; Senkpiel, C. Current and future cost of photovoltaics. Berl. Agora Energiewende 2015. [Google Scholar]
- Canales, F.A.; Beluco, A. Modeling pumped hydro storage with the micropower optimization model (HOMER). J. Renew. Sustain. Energy 2014, 6, 043131. [Google Scholar] [CrossRef]
- Kusakana, K. Feasibility analysis of river off-grid hydrokinetic systems with pumped hydro storage in rural applications. Energy Convers. Manag. 2015, 96, 352–362. [Google Scholar] [CrossRef]
- Bettencourt, E.M.V.; Tilman, M.; Narciso, V.; Carvalho, M.L.S.; Henriques, P.D.S. The livestock roles in the wellbeing of rural communities of Timor-Leste. Rev. Econ. E Sociol. Rural 2015, 53, 63–80. [Google Scholar] [CrossRef]
- Shahzad, K.; Nasir, A.; Shafiq Anwar, M.; Farid, M.U. Bioenergy Prospective and Efficient Utilization Pattern for Rural Energy Supply in District Pakpattan. J. Agric. Res. 2017, 55, 101–113. [Google Scholar]


| S No | Authors/Ref. | Country of Application | Energy Sources | Storage Device | Load Type | Study Objectives | Technique/Software |
|---|---|---|---|---|---|---|---|
| 1 | Nfah et al. [11] | Cameroon | MHP-SPV-BGS | Battery | DS | Minimizing NPC | HOMER |
| 2 | Adaramola et al. [12] | Ghana | WES-SPV-DG | Battery | DS | Minimizing NPC | HOMER |
| 3 | Halabi et al. [13] | Malaysia | SPV-DG | Battery | DS | Minimizing NPC | HOMER |
| 4 | Singh et al. [14] | India | SPV-WES-BGS | Battery | DS, C | Minimizing NPC | ABC algorithm |
| 5 | Sigarchian et al. [15] | Kenya | SPV-WES-BGS | Battery | DS | Minimizing NPC | HOMER |
| 6 | Baghdadi et al. [16] | Algeria | WES-SPV-DG | Battery | DS | Maximise the RF | HOMER |
| 7 | Ma et al. [17] | China | WES-SPV | PHS | DS, C | Finding a feasible configuration | Mathematical models |
| 8 | Kenfack et al. [18] | Cameroon | SPV-MHS | Battery | DS, C | Minimizing NPC | HOMER |
| 9 | Singh and Fernandez [19] | India | WES-PV | Battery | DS, C | Minimizing NPC | MATLAB & Cuckoo Search |
| 10 | Ahmad et al. [20] | Pakistan | WES-PV-BMS | No SD | DS, C | Minimizing NPC | HOMER |
| 11 | Kusakana [21] | South Africa | HKN-DG | PHS | Maximise the RF | MATLAB | |
| 12 | Sawle et al. [22] | India | WES-PV-BMS-DG | Battery | DS, C | Multi objective | Genetic algorithm |
| Particulars | Details |
|---|---|
| Country | Cameroon |
| Region | Far North |
| Division | Mayo-Sava |
| Name of the municipality | Mora |
| Latitude | 11°03′00′′ North |
| Longitude | 14°18′00′′ East |
| Elevation above sea level | 100 m |
| Number of households | 180 |
| Nearest power transformer | Mora, 18 km |
| Main socio-economic activities | Agriculture, small business, and crafts |
| Load Type | Appliances | Rating (W) | Total Quantity |
|---|---|---|---|
| A-Domestic | |||
| CFL | 15 | 360 | |
| TV | 65 | 180 | |
| Radio | 12 | 180 | |
| Mobile Charger | 12 | 180 | |
| Fan | 40 | 360 | |
| Water pump | 450 | 9 | |
| B-Commercial | |||
| Shops | CFL | 15 | 12 |
| Fan | 40 | 12 | |
| Refrigerator | 500 | 1 | |
| Mini dairy | - | 3000 | 1 |
| Flour mill | - | 4800 | 1 |
| C-Agricultural | |||
| Water irrigation pumps | - | 2200 | 3 |
| Cutting machine | - | 1500 | 2 |
| Threshing machine | - | 4000 | 2 |
| D-Community | |||
| School | CFL | 15 | 20 |
| Fan | 40 | 2 | |
| Health centre | CFL | 15 | 5 |
| Fan | 40 | 6 | |
| Refrigerator | 500 | 1 | |
| Street lights | CFL | 100 | 20 |
| Hour | Domestic load (kW) | Commercial Load (kW) | Agricultural Load (kW) | Community Loads | Electricity Demand (kW) | |||||||||||||||||
|---|---|---|---|---|---|---|---|---|---|---|---|---|---|---|---|---|---|---|---|---|---|---|
| School | Health Centre | STL | Dry Season | Rainy Season | ||||||||||||||||||
| CFL | TV | Radio | Fan DS/RS | WP | MC | CFL | Fan DS/RS | RF | FM | MD | WIP DS/RS | TM | CM | CFL | Fan DS/RS | CFL | Fan DS/RS | RF | CFL | |||
| 01:00 | 0.5 | 0.075 | 0.5 | 2 | 3.075 | 3.075 | ||||||||||||||||
| 02:00 | 0.5 | 0.075 | 0.5 | 2 | 3.075 | 3.075 | ||||||||||||||||
| 03:00 | 0.5 | 0.075 | 0.5 | 2 | 3.075 | 3.075 | ||||||||||||||||
| 04:00 | 5.4 | 2.2 | 0.5 | 0.075 | 0.5 | 2 | 10.675 | 10.675 | ||||||||||||||
| 05:00 | 5.4 | 2.2 | 2.2 | 0.5 | 3 | 0.075 | 0.5 | 2 | 15.875 | 15.875 | ||||||||||||
| 06:00 | 2.2 | 2.2 | 0.5 | 3 | 3 | 0.075 | 0.5 | 11.475 | 11.475 | |||||||||||||
| 07:00 | 2.2 | 0.5 | 3 | 3 | 0.6 | 0.8/0 | 0.075 | 0.5 | 10.675 | 9.875 | ||||||||||||
| 08:00 | 0.5 | 3 | 0.6 | 0.8/0 | 0.5 | 5.4 | 4.6 | |||||||||||||||
| 09:00 | 0.5 | 0.6 | 0.8/0 | 0.5 | 2.4 | 1.6 | ||||||||||||||||
| 10:00 | 0.5 | 0.6 | 0.8/0 | 0.5 | 2.4 | 1.6 | ||||||||||||||||
| 11:00 | 7.2/0 | 0.5 | 4.8 | 0.6 | 0.8/0 | 0.24/0 | 0.5 | 14.64 | 6.4 | |||||||||||||
| 12:00 | 2.2 | 7.2/0 | 0.48/0 | 0.5 | 4.8 | 0.6 | 0.8/0 | 0.24/0 | 0.5 | 17.32 | 8.6 | |||||||||||
| 13:00 | 2.2 | 7.2/0 | 0.48/0 | 0.5 | 6.6/6.6 | 0.6 | 0.8/0 | 0.24/0 | 0.5 | 19.12 | 10.4 | |||||||||||
| 14:00 | 11.7 | 2.2 | 7.2/0 | 0.48/0 | 0.5 | 6.6/0 | 0.6 | 0.8/0 | 0.24/0 | 0.5 | 30.82 | 15.5 | ||||||||||
| 15:00 | 11.7 | 7.2/0 | 0.48/0 | 0.5 | 8 | 0.6 | 0.8/0 | 0.24/0 | 0.5 | 30.02 | 21.3 | |||||||||||
| 16:00 | 11.7 | 7.2/ | 0.48/0 | 0.5 | 8 | 0.24/0 | 0.5 | 28.62 | 20.7 | |||||||||||||
| 17:00 | 11.7 | 7.2/0 | 0.48/0 | 0.5 | 0.24/0 | 0.5 | 20.62 | 12.7 | ||||||||||||||
| 18:00 | 5.4 | 11.7 | 7.2/0 | 0.18 | 0.48/0 | 0.5 | 0.075 | 0.5 | 2 | 28.035 | 20.355 | |||||||||||
| 19:00 | 5.4 | 11.7 | 2.2 | 9 | 0.18 | 0.48/0 | 0.5 | 0.075 | 0.5 | 2 | 32.035 | 31.555 | ||||||||||
| 20:00 | 5.4 | 11.7 | 2.2 | 9 | 0.18 | 0.48/0 | 0.5 | 0.075 | 0.5 | 2 | 32.035 | 31.555 | ||||||||||
| 21:00 | 5.4 | 11.7 | 2.2 | 9 | 0.18 | 0.48/0 | 0.5 | 0.075 | 0.5 | 2 | 32.035 | 31.555 | ||||||||||
| 22:00 | 5.4 | 11.7 | 0.18 | 0.48/0 | 0.5 | 0.075 | 0.5 | 2 | 20.835 | 20.355 | ||||||||||||
| 23:00 | 0.18 | 0.48/0 | 0.5 | 0.075 | 0.5 | 2 | 3.735 | 3.255 | ||||||||||||||
| 00:00 | 0.5 | 0.075 | 0.5 | 2 | 3.075 | 3.075 | ||||||||||||||||
| Livestock | Population | Dung Availability (kg/head/day) | Total Dung (kg/day) | Total Dung (Recovery Factor = 0.70) | Total Gas Yield (m3/day) | Potential Power Yield (kWh/day) |
|---|---|---|---|---|---|---|
| Cows | 213 | 10 | 2130 | 1491 | 53.7 | 74 |
| Horse | 12 | 10 | 120 | 84 | 3 | 4 |
| Mule | 29 | 10 | 290 | 203 | 7,3 | 10 |
| Goat | 557 | 1 | 557 | 390 | 14 | 19 |
| Total | 811 | - | 3097 | 2168 | 78 | 107 |
| Item | Specification |
|---|---|
| Manufacturer | Sunpower |
| PV Module type | Mono-si |
| Module number | SPR-E20-327-C-AC |
| Module efficiency | 20.4% |
| Power capacity | 327 W |
| Power tolerance | +5/−0% |
| Rated voltage (Vmpp) | 54.7 V |
| Rated current (Impp) | 5.98 A |
| Open-Circuit Voltage (VoC) | 64.9 V |
| Short-Circuit Current (ISC) | 6.46 A |
| Maximum system voltage | DC 600 V |
| Power Temp Coef | −0.38%/°C |
| Volt Tem coef | −175 mV/°C |
| Current Temp Coef | 3.5 mA/°C |
| Dimensions | 46 mm × 1559 mm × 1046 mm |
| Operating temperature | −40 °C to +85 °C |
| Area | 1.63 m2 |
| Weight | 18.60 kg |
| Item | Specification |
|---|---|
| Manufacturer | Bergey WindPower |
| Model | Bergey excel 10-R |
| Nominal power | 10 kW at 12 m/s |
| Cut-in Wind Speed | 2.5 m/s |
| Cut-Out Wind Speed | None |
| Furling Wind Speed | 14–20 m/s |
| Max. Design Wind Speed | 60 m/s |
| Temperature range | −40 to + 60 °C |
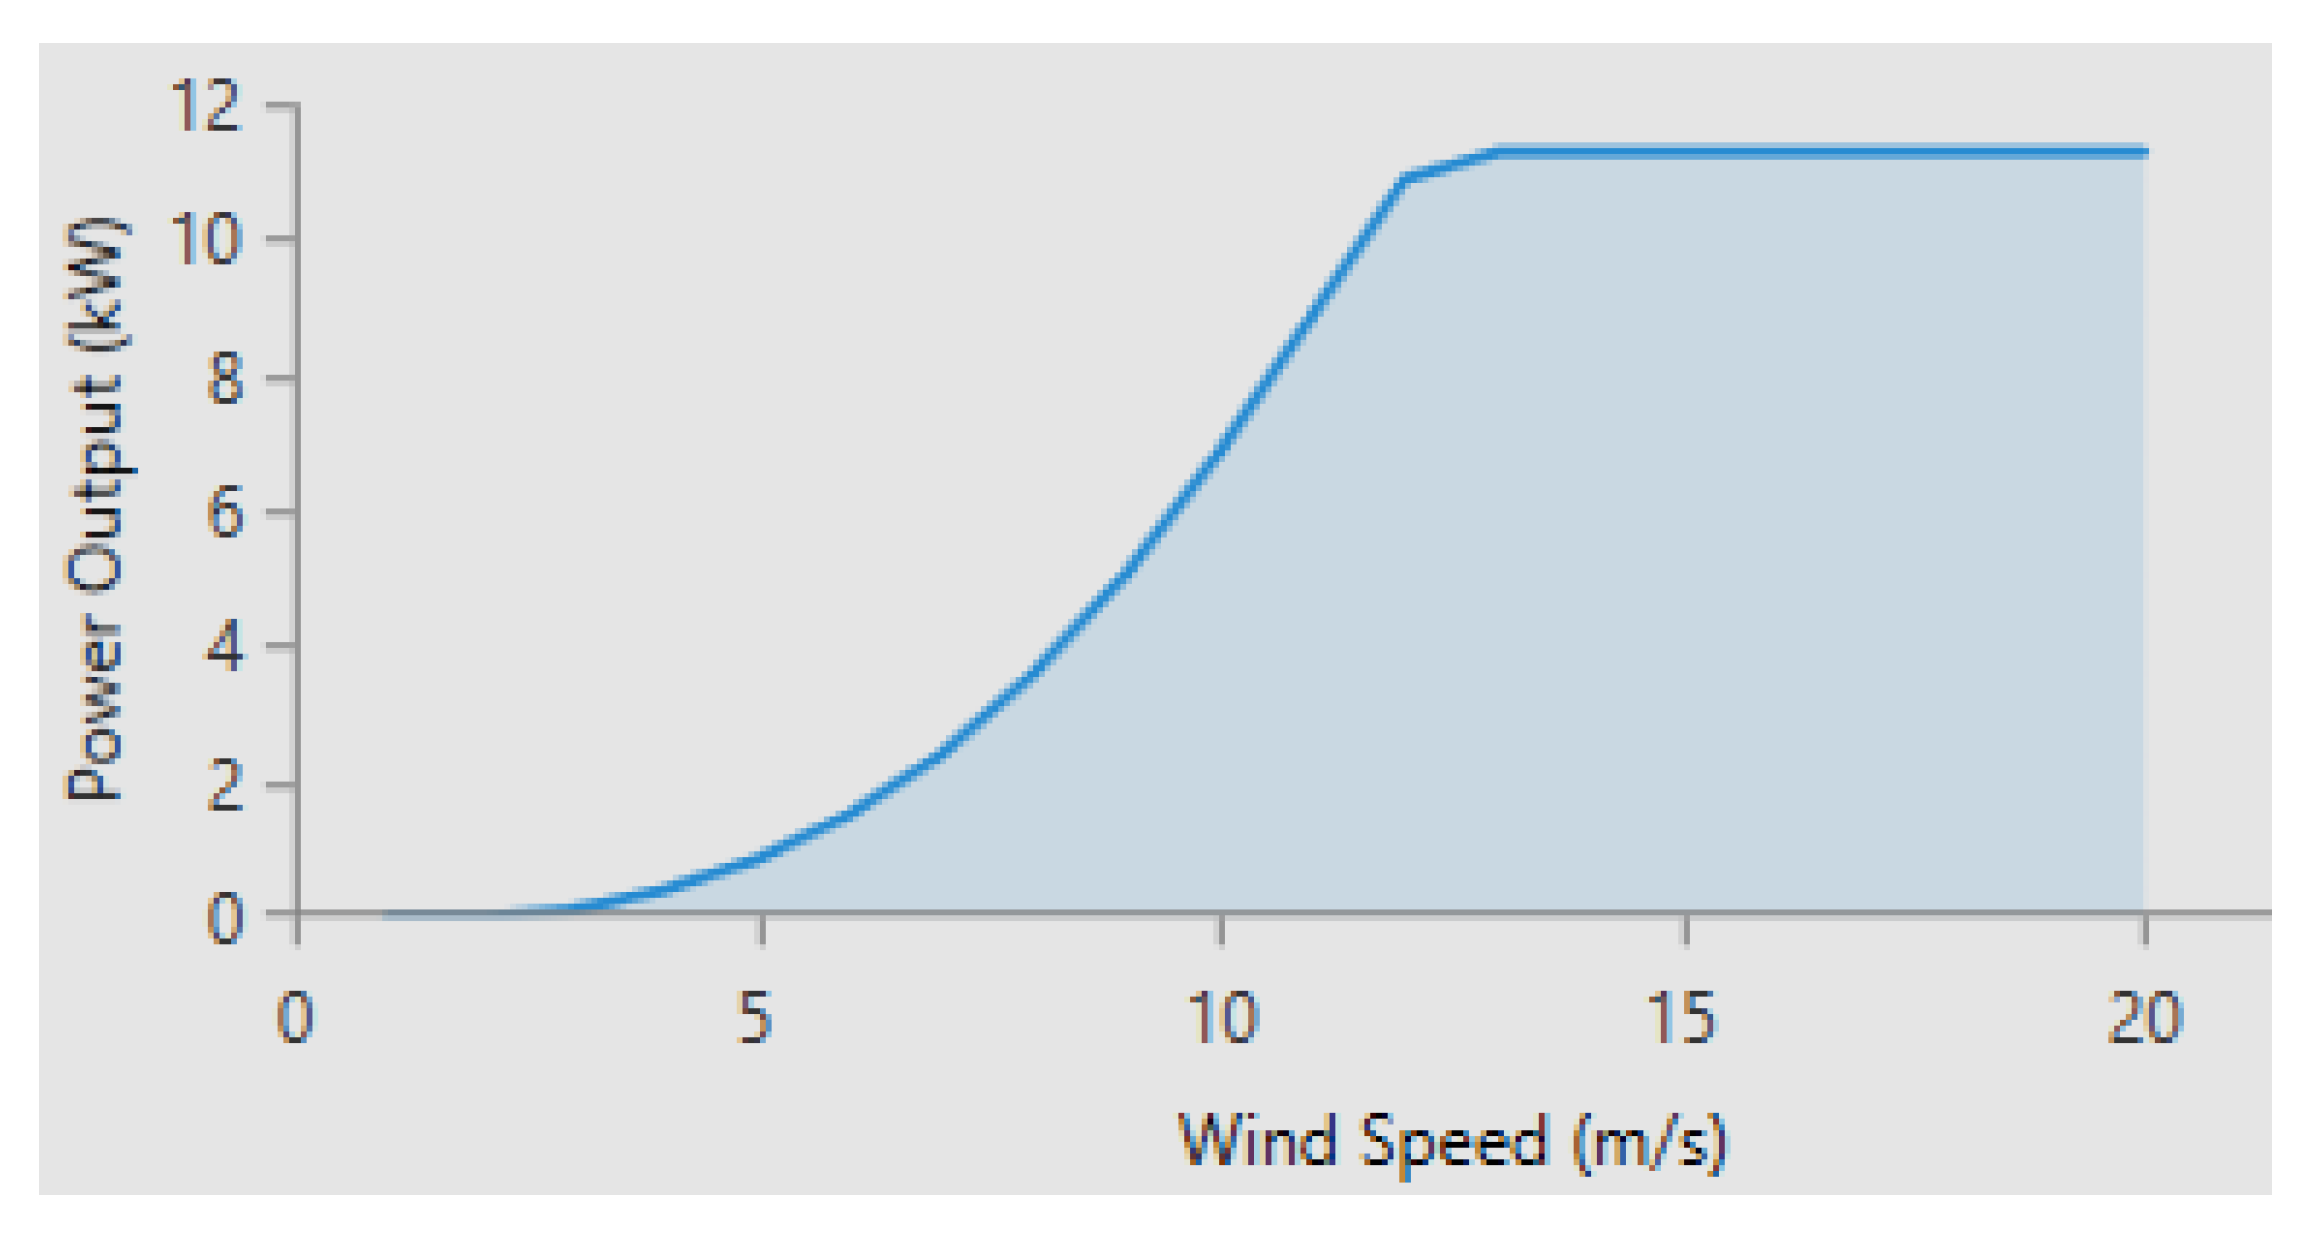
| Hub height | 30 m |
| Type | 3 Blade Upwind |
| Optimization variable | PV Array Size (kW) | Number of WT | Number of Pumped Hydro Storage (PHS) (number) | Biogas Generator Size (kW) | Converter Capacity (kW) |
|---|---|---|---|---|---|
| Maximum | 98.1 | 9 | 5 | 17.5 | 80 |
| Minimum | 0 | 0 | 0 | 0 | 0 |
| Step | 16.35 | 1 | 1 | 2.5 | 10 |
| Sensitivity Variable | Values |
|---|---|
| Wind speed (m/s) | 3.5, 4.95, 8 |
| Solar radiation (kWh/m2/day) | 3.8, 5.82, 7, 8 |
| Capital cost multiplier of PV | 0.5, 1, 1.5, 2 |
| Capital cost multiplier of PHS | 0.5, 1, 1.5, 2 |
| Biomass price (€/t) | 0, 0.2, 0.4, 0.6 |
| Biomass availability (t/day) | 0.2, 2.2, 4.5, 7, 9.5 |
| Maximum capacity shortage (%) | 0, 2.5, 5, 7.5, 10, 12.5 |
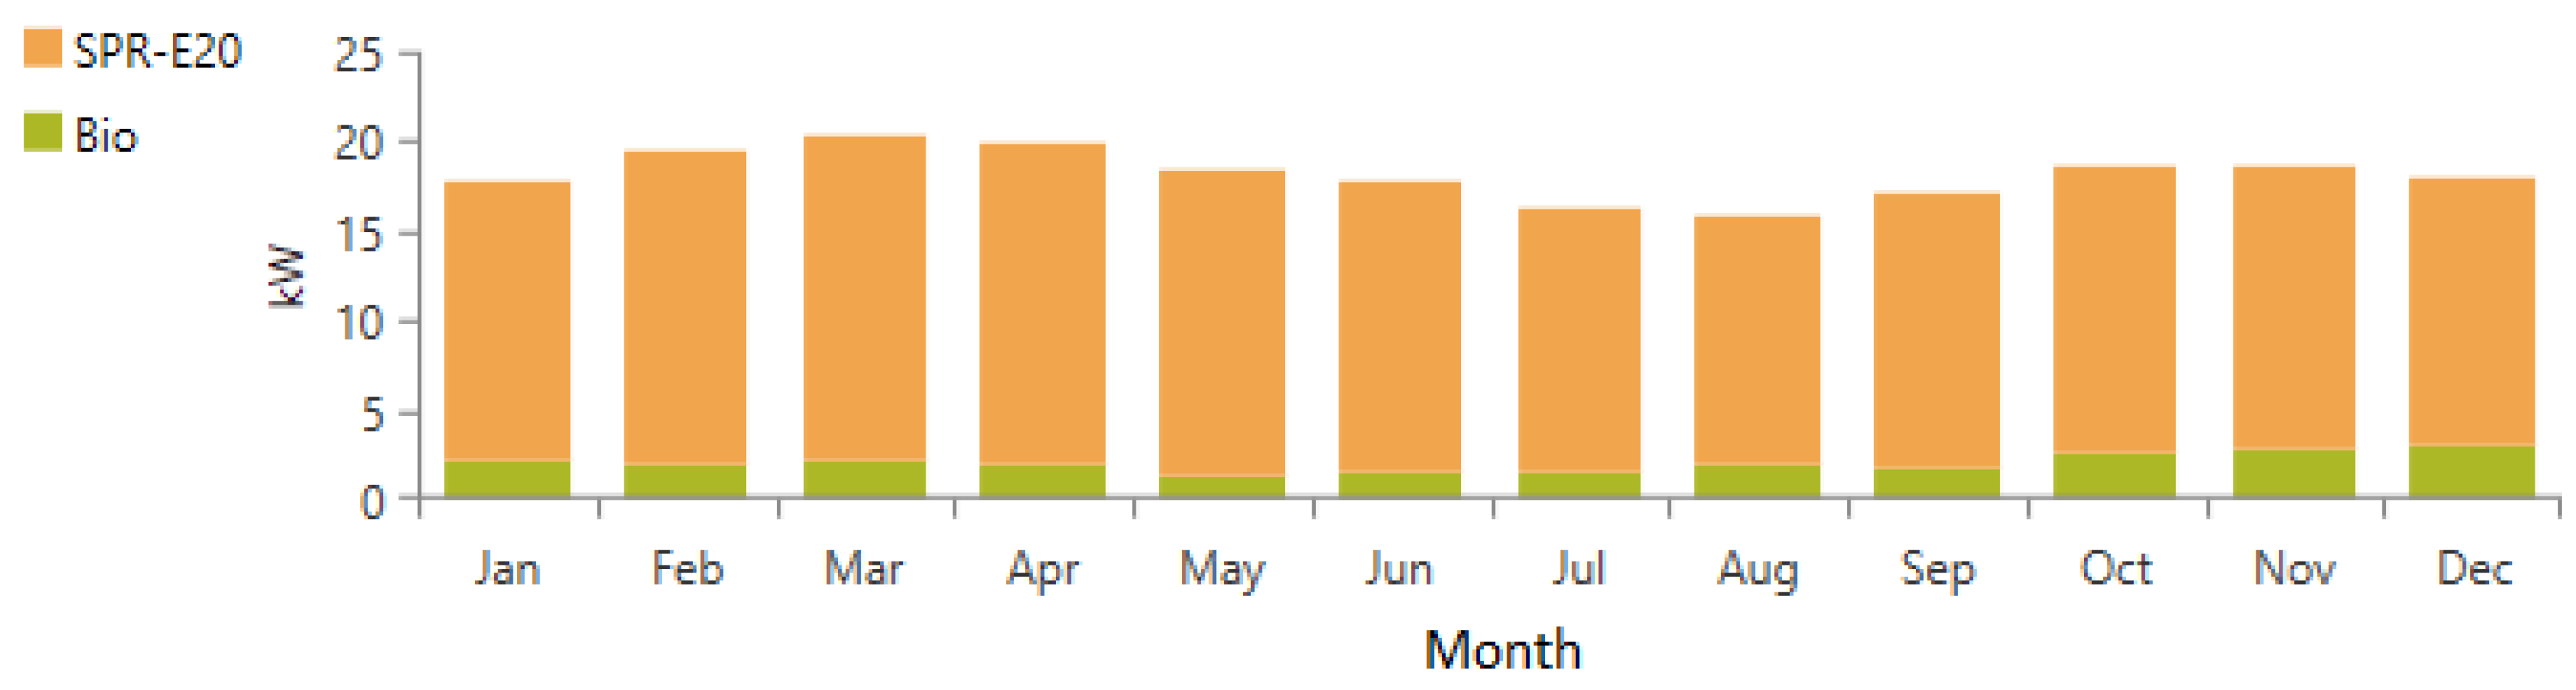
| Specification Category | Specification | Unit | Best Hybrid System Per Category | ||||
|---|---|---|---|---|---|---|---|
| Category 1 | Category 2 | Category 3 | Category 4 | Category 5 | |||
| System architecture | PV array 5SPR-E20 | kW | 81.8 | 65.4 | 98.1 | 81.8 | 0 |
| Wind turbine (XL10R) | Number | 0 | 1 | 0 | 1 | 8 | |
| Biogas gen. | kW | 15 | 15 | 0 | 0 | 12.5 | |
| Pumped Hydro (PH 245) | Number | 2 | 2 | 3 | 3 | 4 | |
| Converter | kW | 40 | 40 | 50 | 50 | 70 | |
| Dispatch strategy | LF or CC | LF | LF | CC | CC | CC | |
| Cost | LCOE | €/kWh | 0.256 | 0.260 | 0.261 | 0.265 | 0.417 |
| NPC | € | 370,426 | 375,945 | 379,257 | 383,757 | 598,368 | |
| Total O&M cost | €/year | 4031 | 4425 | 644 | 950 | 6400 | |
| Total capital cost | € | 323,750 | 324,700 | 371,800 | 372,750 | 524,250 | |
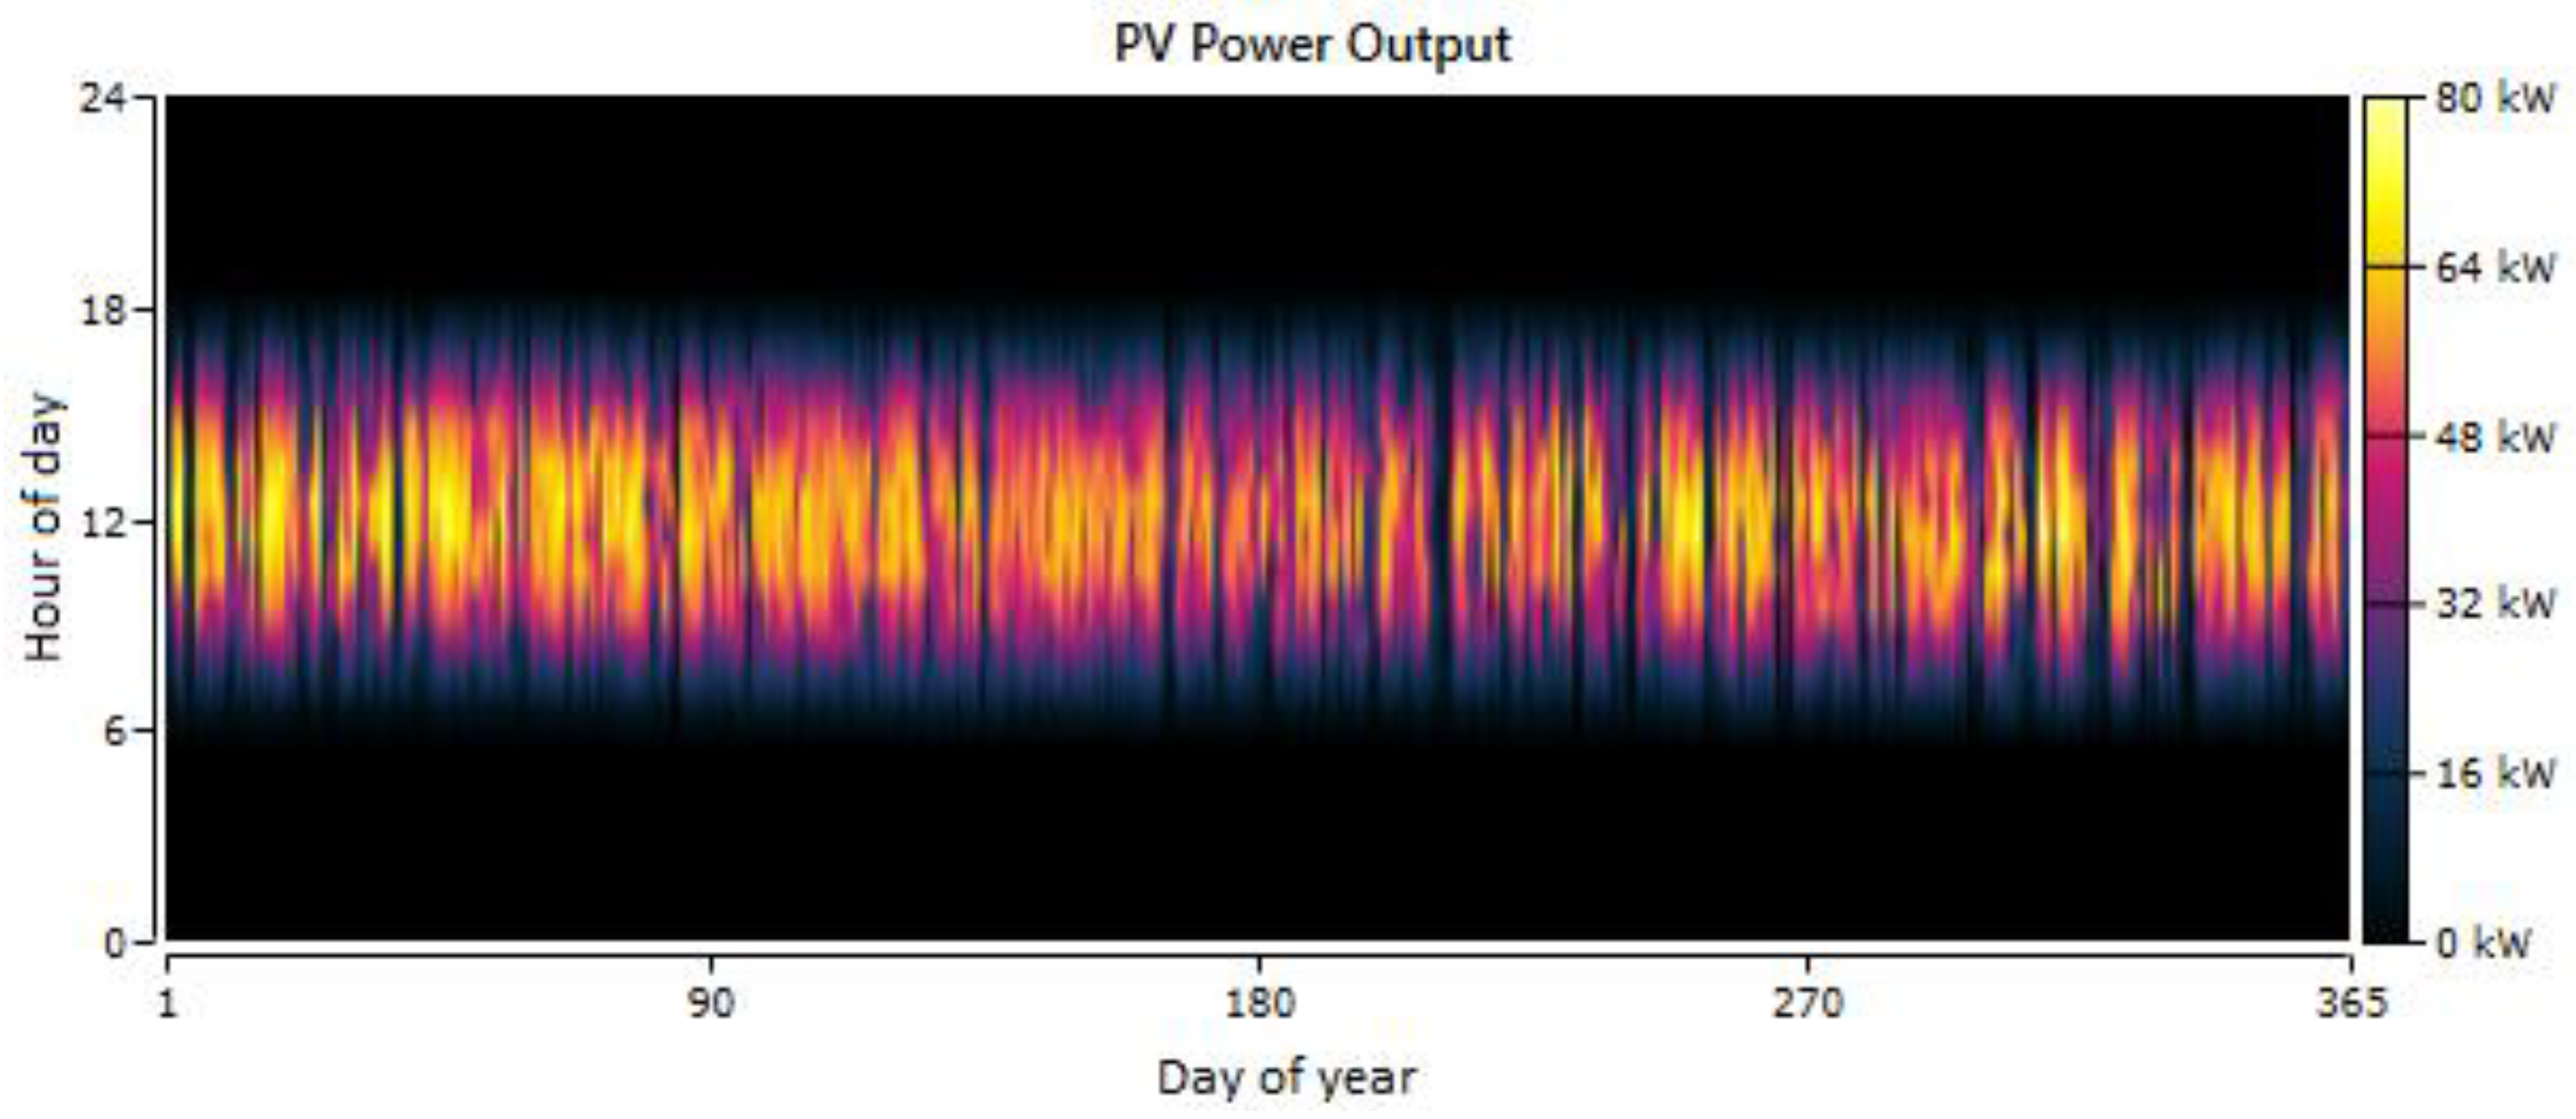
| Power production | PV array | kWh/year | 141,046 | 112,837 | 169,255 | 141,046 | 0 |
| Wind turbine | kWh/year | 0 | 19,031 | 0 | 19,031 | 152,249 | |
| Biogas Generator | kWh/year | 17,794 | 18,508 | 0 | 0 | 17,323 | |
| Total electricity production | kWh/year | 158,840 | 150,376 | 169,255 | 160,077 | 169,572 | |
| Primary load consumption | kWh/year | 125,056 | 124,916 | 125,225 | 124,888 | 123,901 | |
| Capacity shortage | kWh/year (%) | 6.071 (4.8) | 6430 (5) | 4756 (3.7) | 6269 (4.9) | 6377 (5) | |
| Unmet load | kWh/year (%) | 1972 (1.6) | 2112 (1.7) | 1503 (1.2) | 2140 (1.7) | 3127 (2.4) | |
| Excess electricity | kWh/year (%) | 13,670 (8.6) | 7158 (4.8) | 19,249 (11.4) | 12,532 (7.8) | 27,693 (15.9) | |
| Capacity factor | PV array 5SPR-E20 | % | 19.7 | 19.7 | 19.7 | 19.7 | 0 |
| Wind turbine (XL10R) | % | 0 | 21.7 | 0 | 21.7 | 21.7 | |
| Biogas gen. | % | 13.5 | 14.1 | 0 | 0 | 18.8 | |
© 2018 by the authors. Licensee MDPI, Basel, Switzerland. This article is an open access article distributed under the terms and conditions of the Creative Commons Attribution (CC BY) license (http://creativecommons.org/licenses/by/4.0/).
Share and Cite
Yimen, N.; Hamandjoda, O.; Meva’a, L.; Ndzana, B.; Nganhou, J. Analyzing of a Photovoltaic/Wind/Biogas/Pumped-Hydro Off-Grid Hybrid System for Rural Electrification in Sub-Saharan Africa—Case Study of Djoundé in Northern Cameroon. Energies 2018, 11, 2644. https://doi.org/10.3390/en11102644
Yimen N, Hamandjoda O, Meva’a L, Ndzana B, Nganhou J. Analyzing of a Photovoltaic/Wind/Biogas/Pumped-Hydro Off-Grid Hybrid System for Rural Electrification in Sub-Saharan Africa—Case Study of Djoundé in Northern Cameroon. Energies. 2018; 11(10):2644. https://doi.org/10.3390/en11102644
Chicago/Turabian StyleYimen, Nasser, Oumarou Hamandjoda, Lucien Meva’a, Benoit Ndzana, and Jean Nganhou. 2018. "Analyzing of a Photovoltaic/Wind/Biogas/Pumped-Hydro Off-Grid Hybrid System for Rural Electrification in Sub-Saharan Africa—Case Study of Djoundé in Northern Cameroon" Energies 11, no. 10: 2644. https://doi.org/10.3390/en11102644
APA StyleYimen, N., Hamandjoda, O., Meva’a, L., Ndzana, B., & Nganhou, J. (2018). Analyzing of a Photovoltaic/Wind/Biogas/Pumped-Hydro Off-Grid Hybrid System for Rural Electrification in Sub-Saharan Africa—Case Study of Djoundé in Northern Cameroon. Energies, 11(10), 2644. https://doi.org/10.3390/en11102644