Economic Feasibility of Energy Supply by Small Modular Nuclear Reactors on Small Islands: Case Studies of Jeju, Tasmania and Tenerife


Abstract
1. Introduction
2. Methodology
2.1. Three Islands
2.2. Data
2.3. Modelling
3. Results
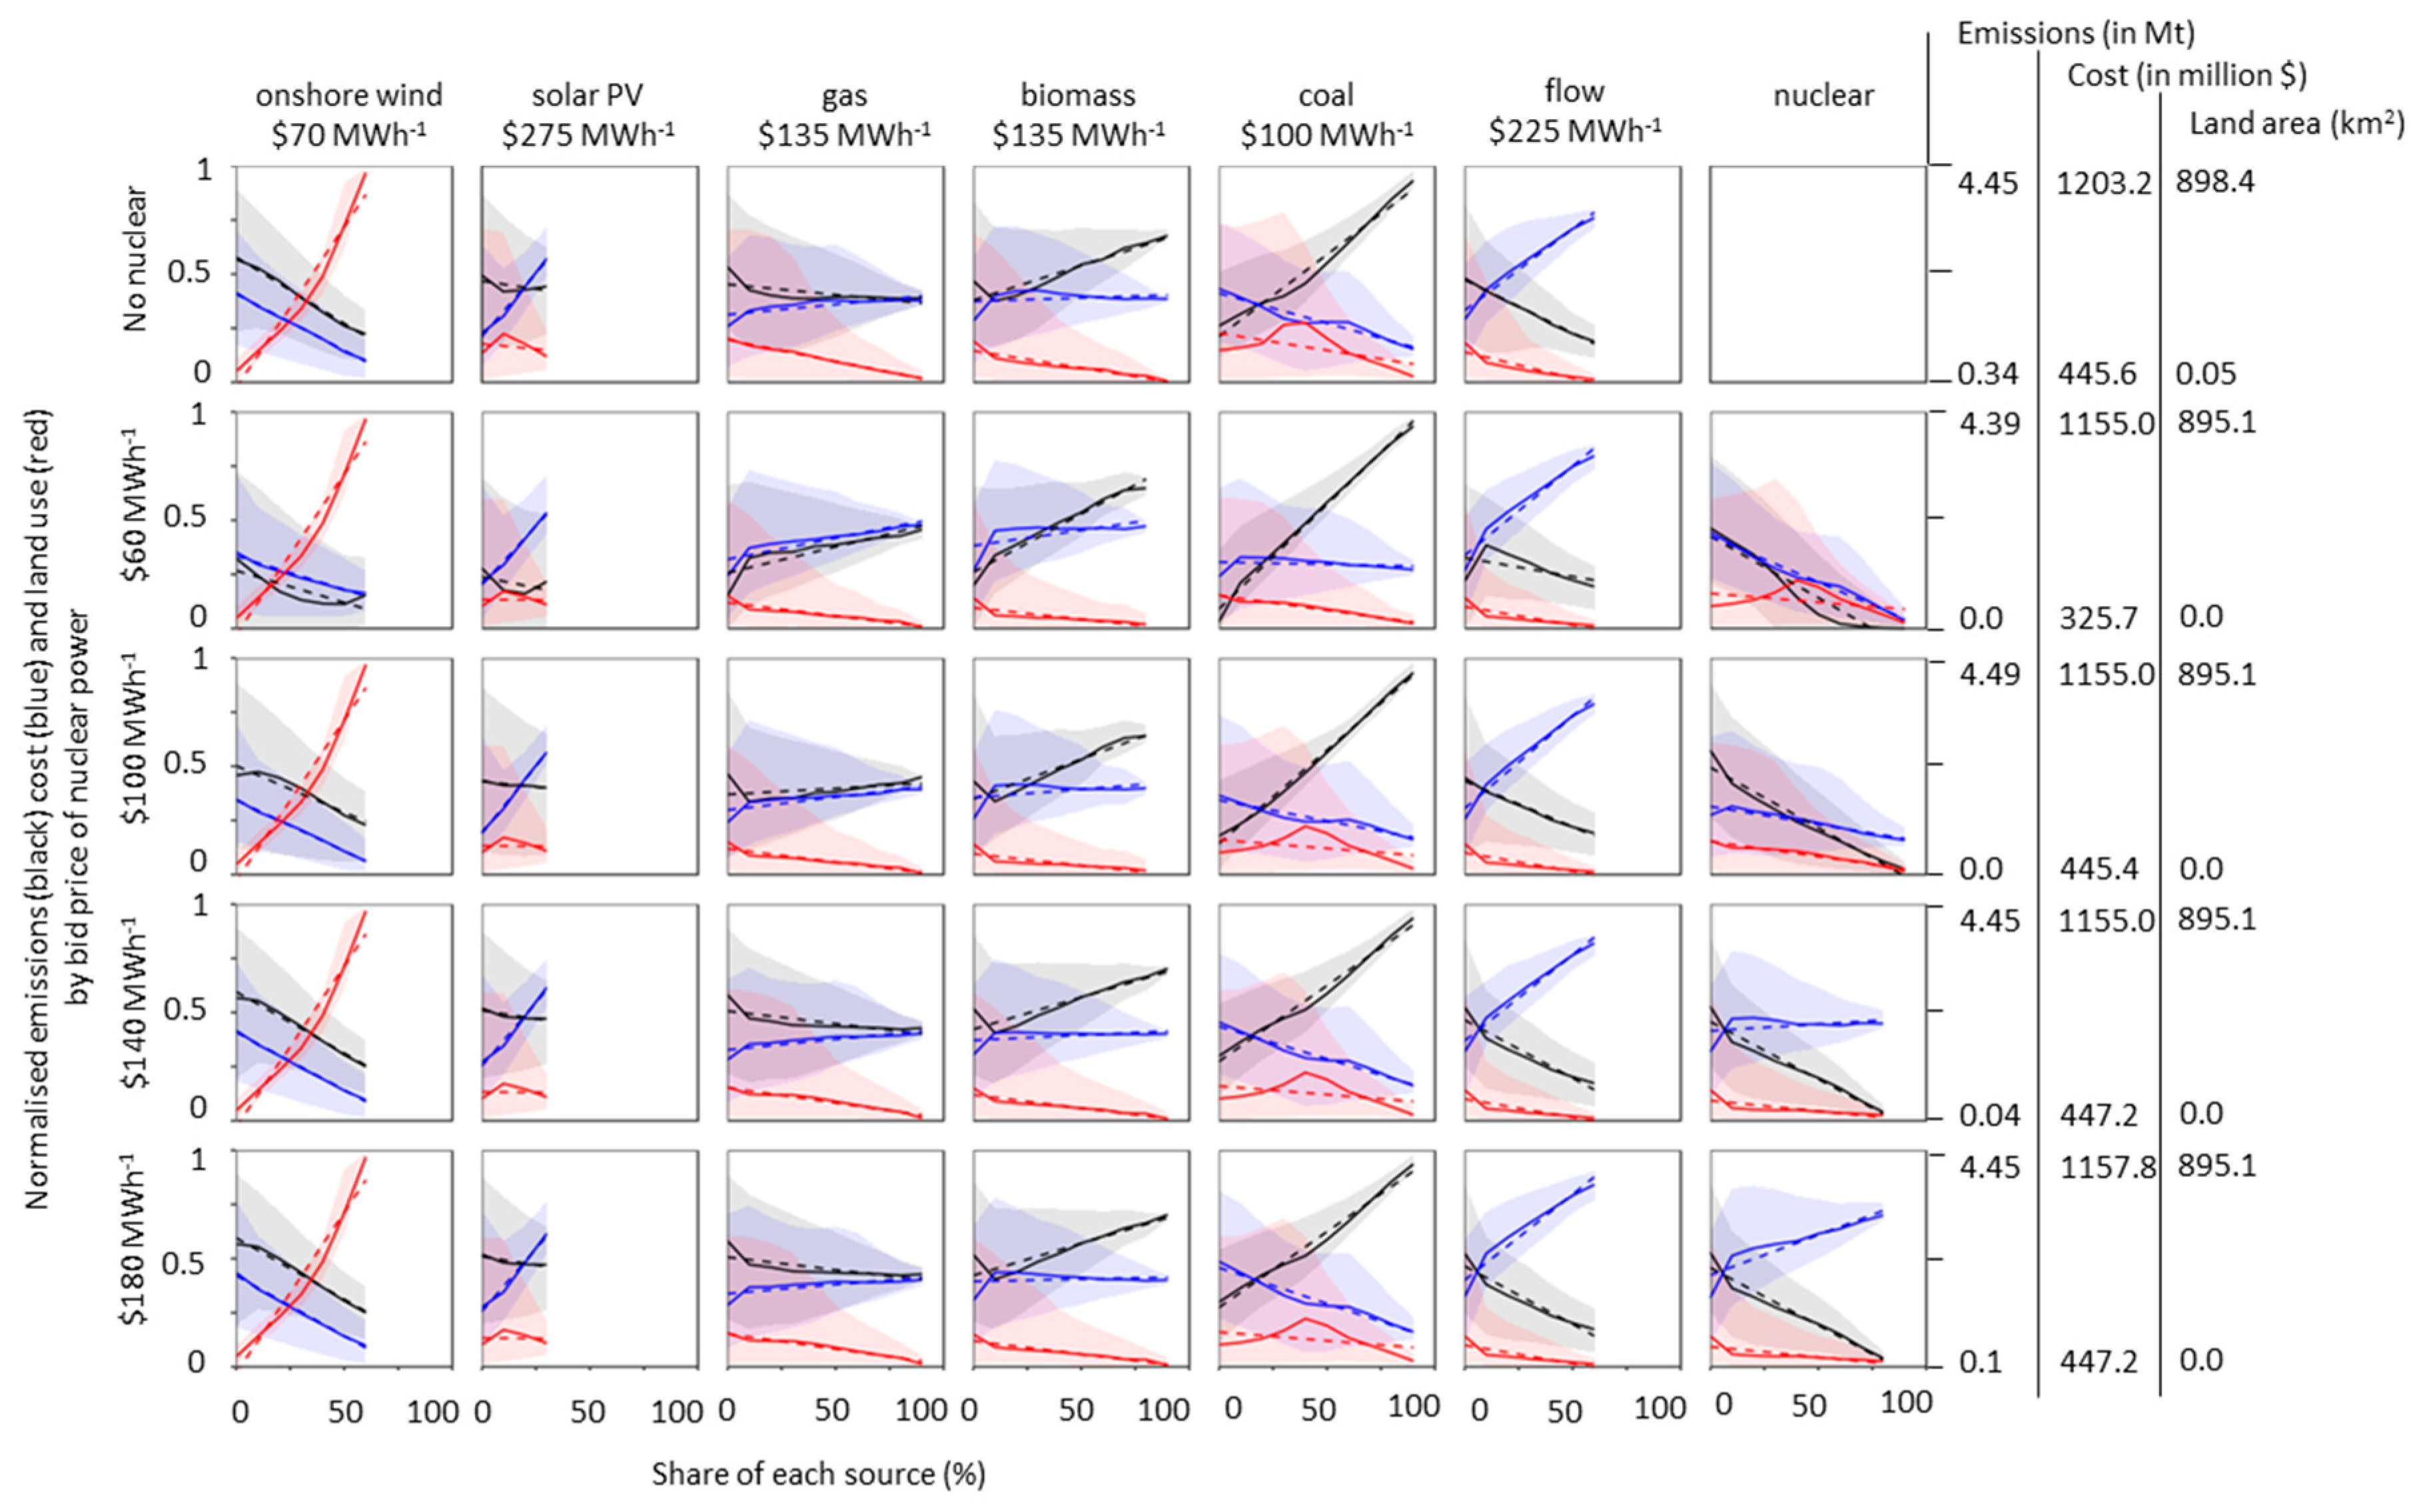
3.1. Jeju
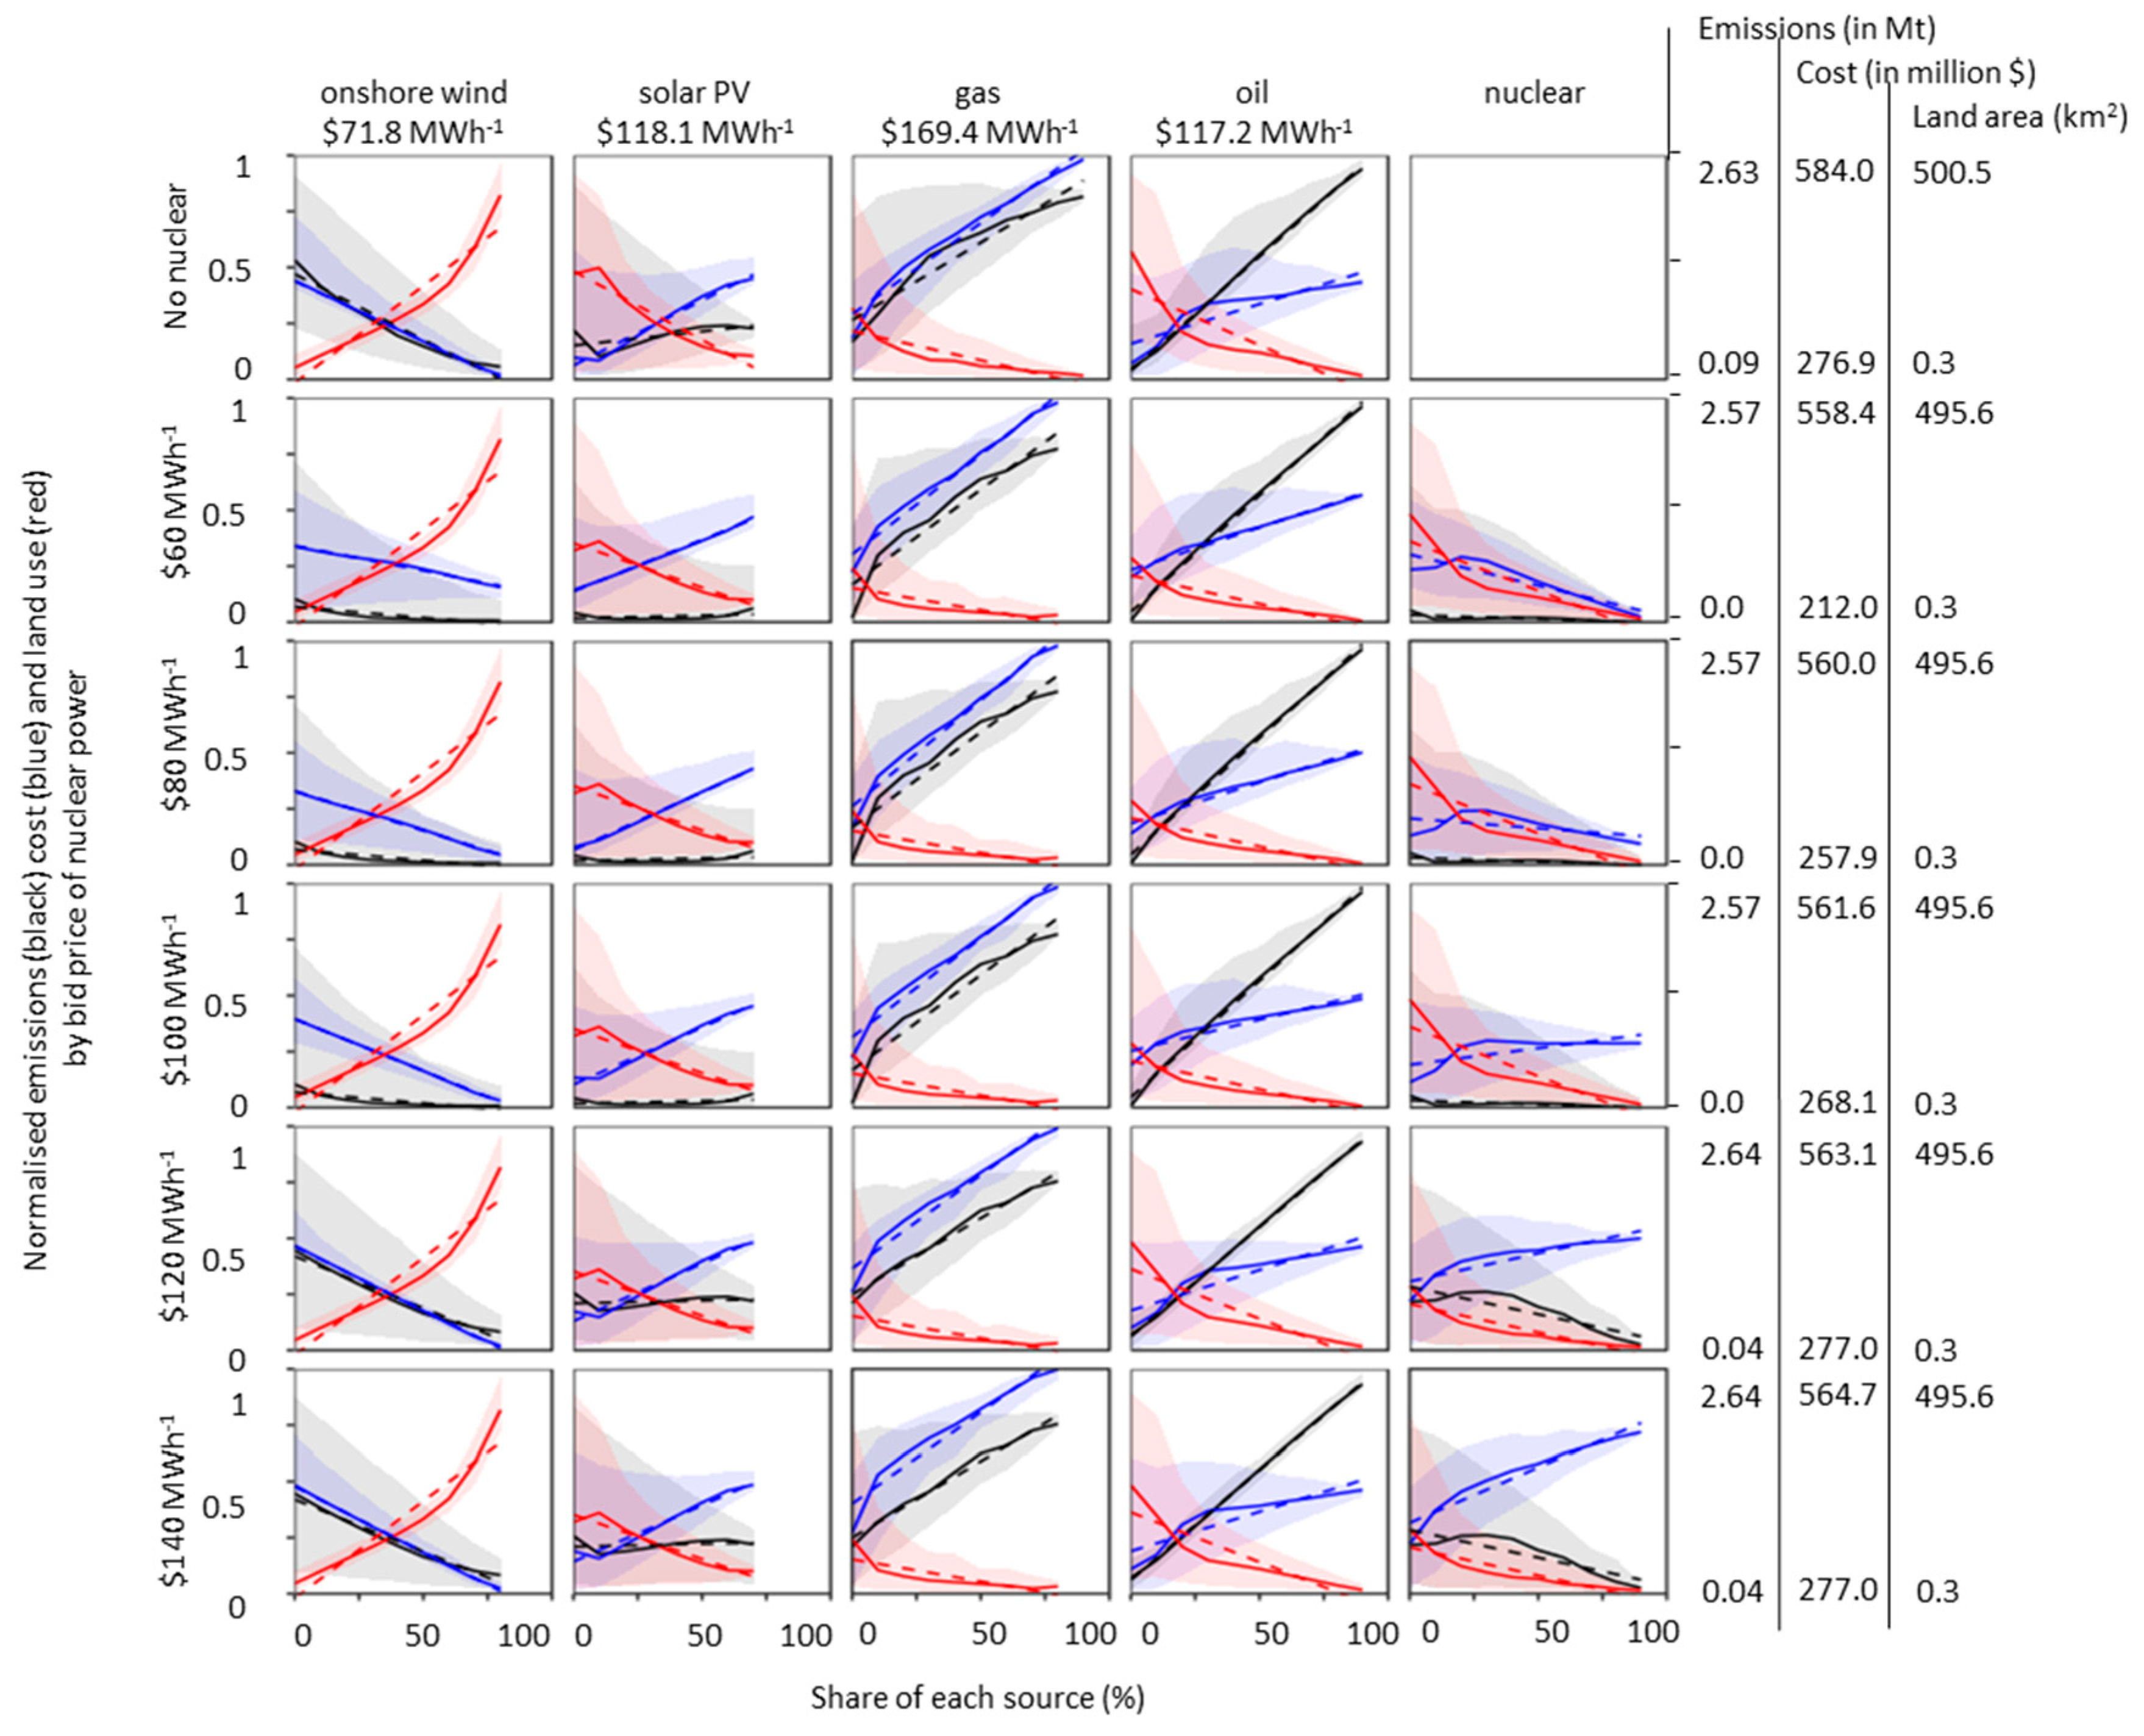
3.2. Tenerife
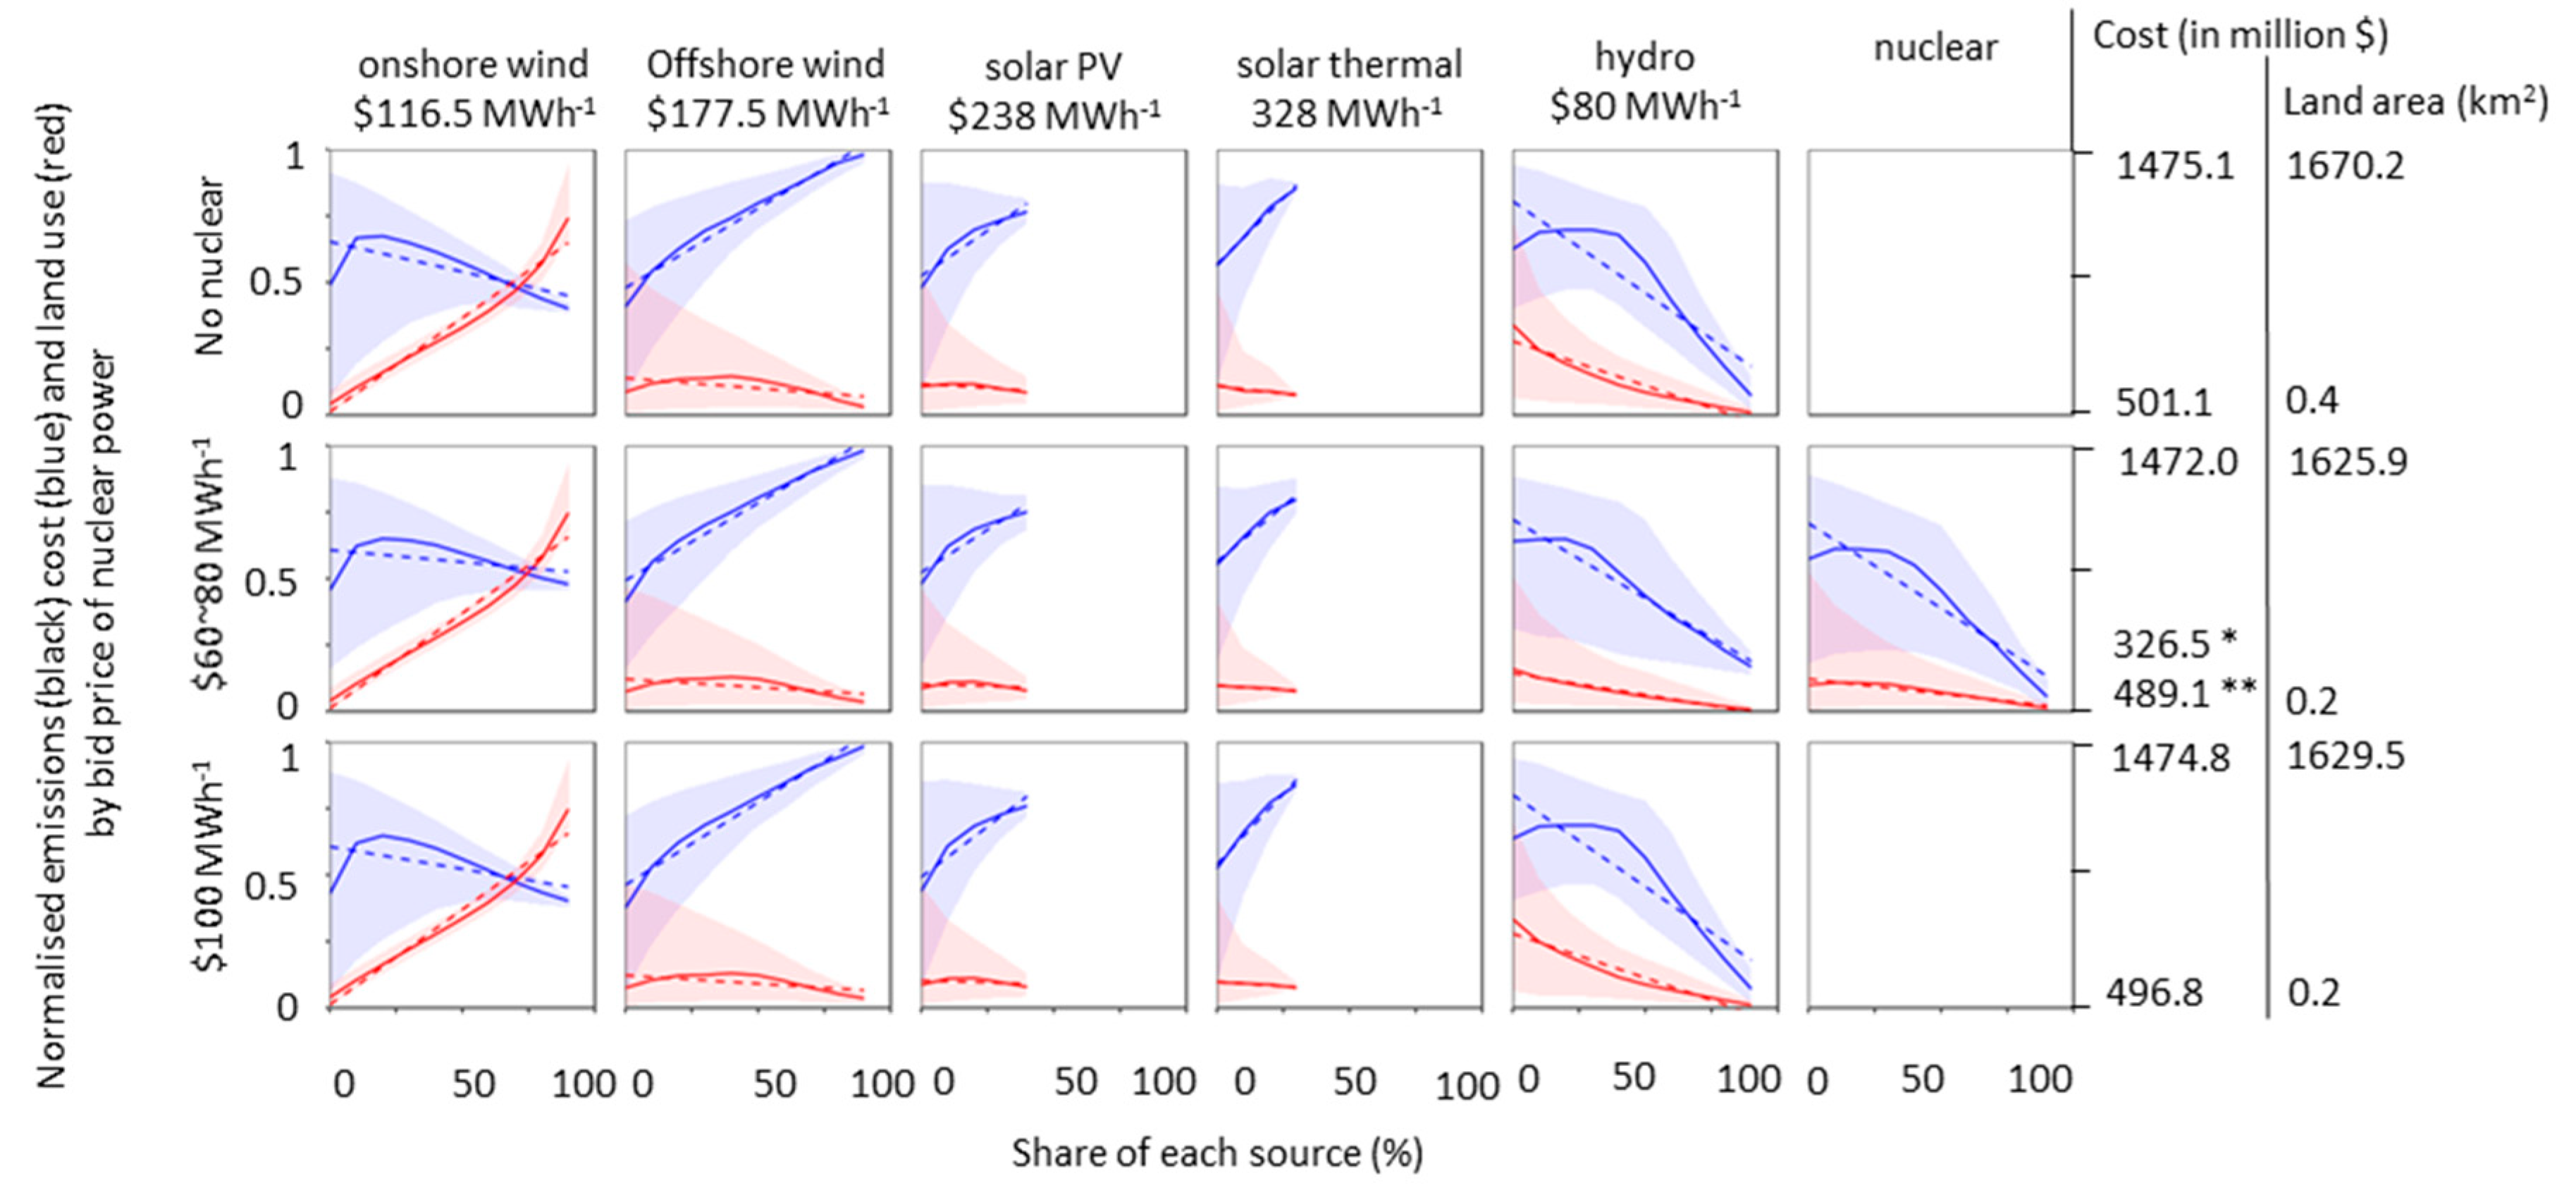
3.3. Tasmania
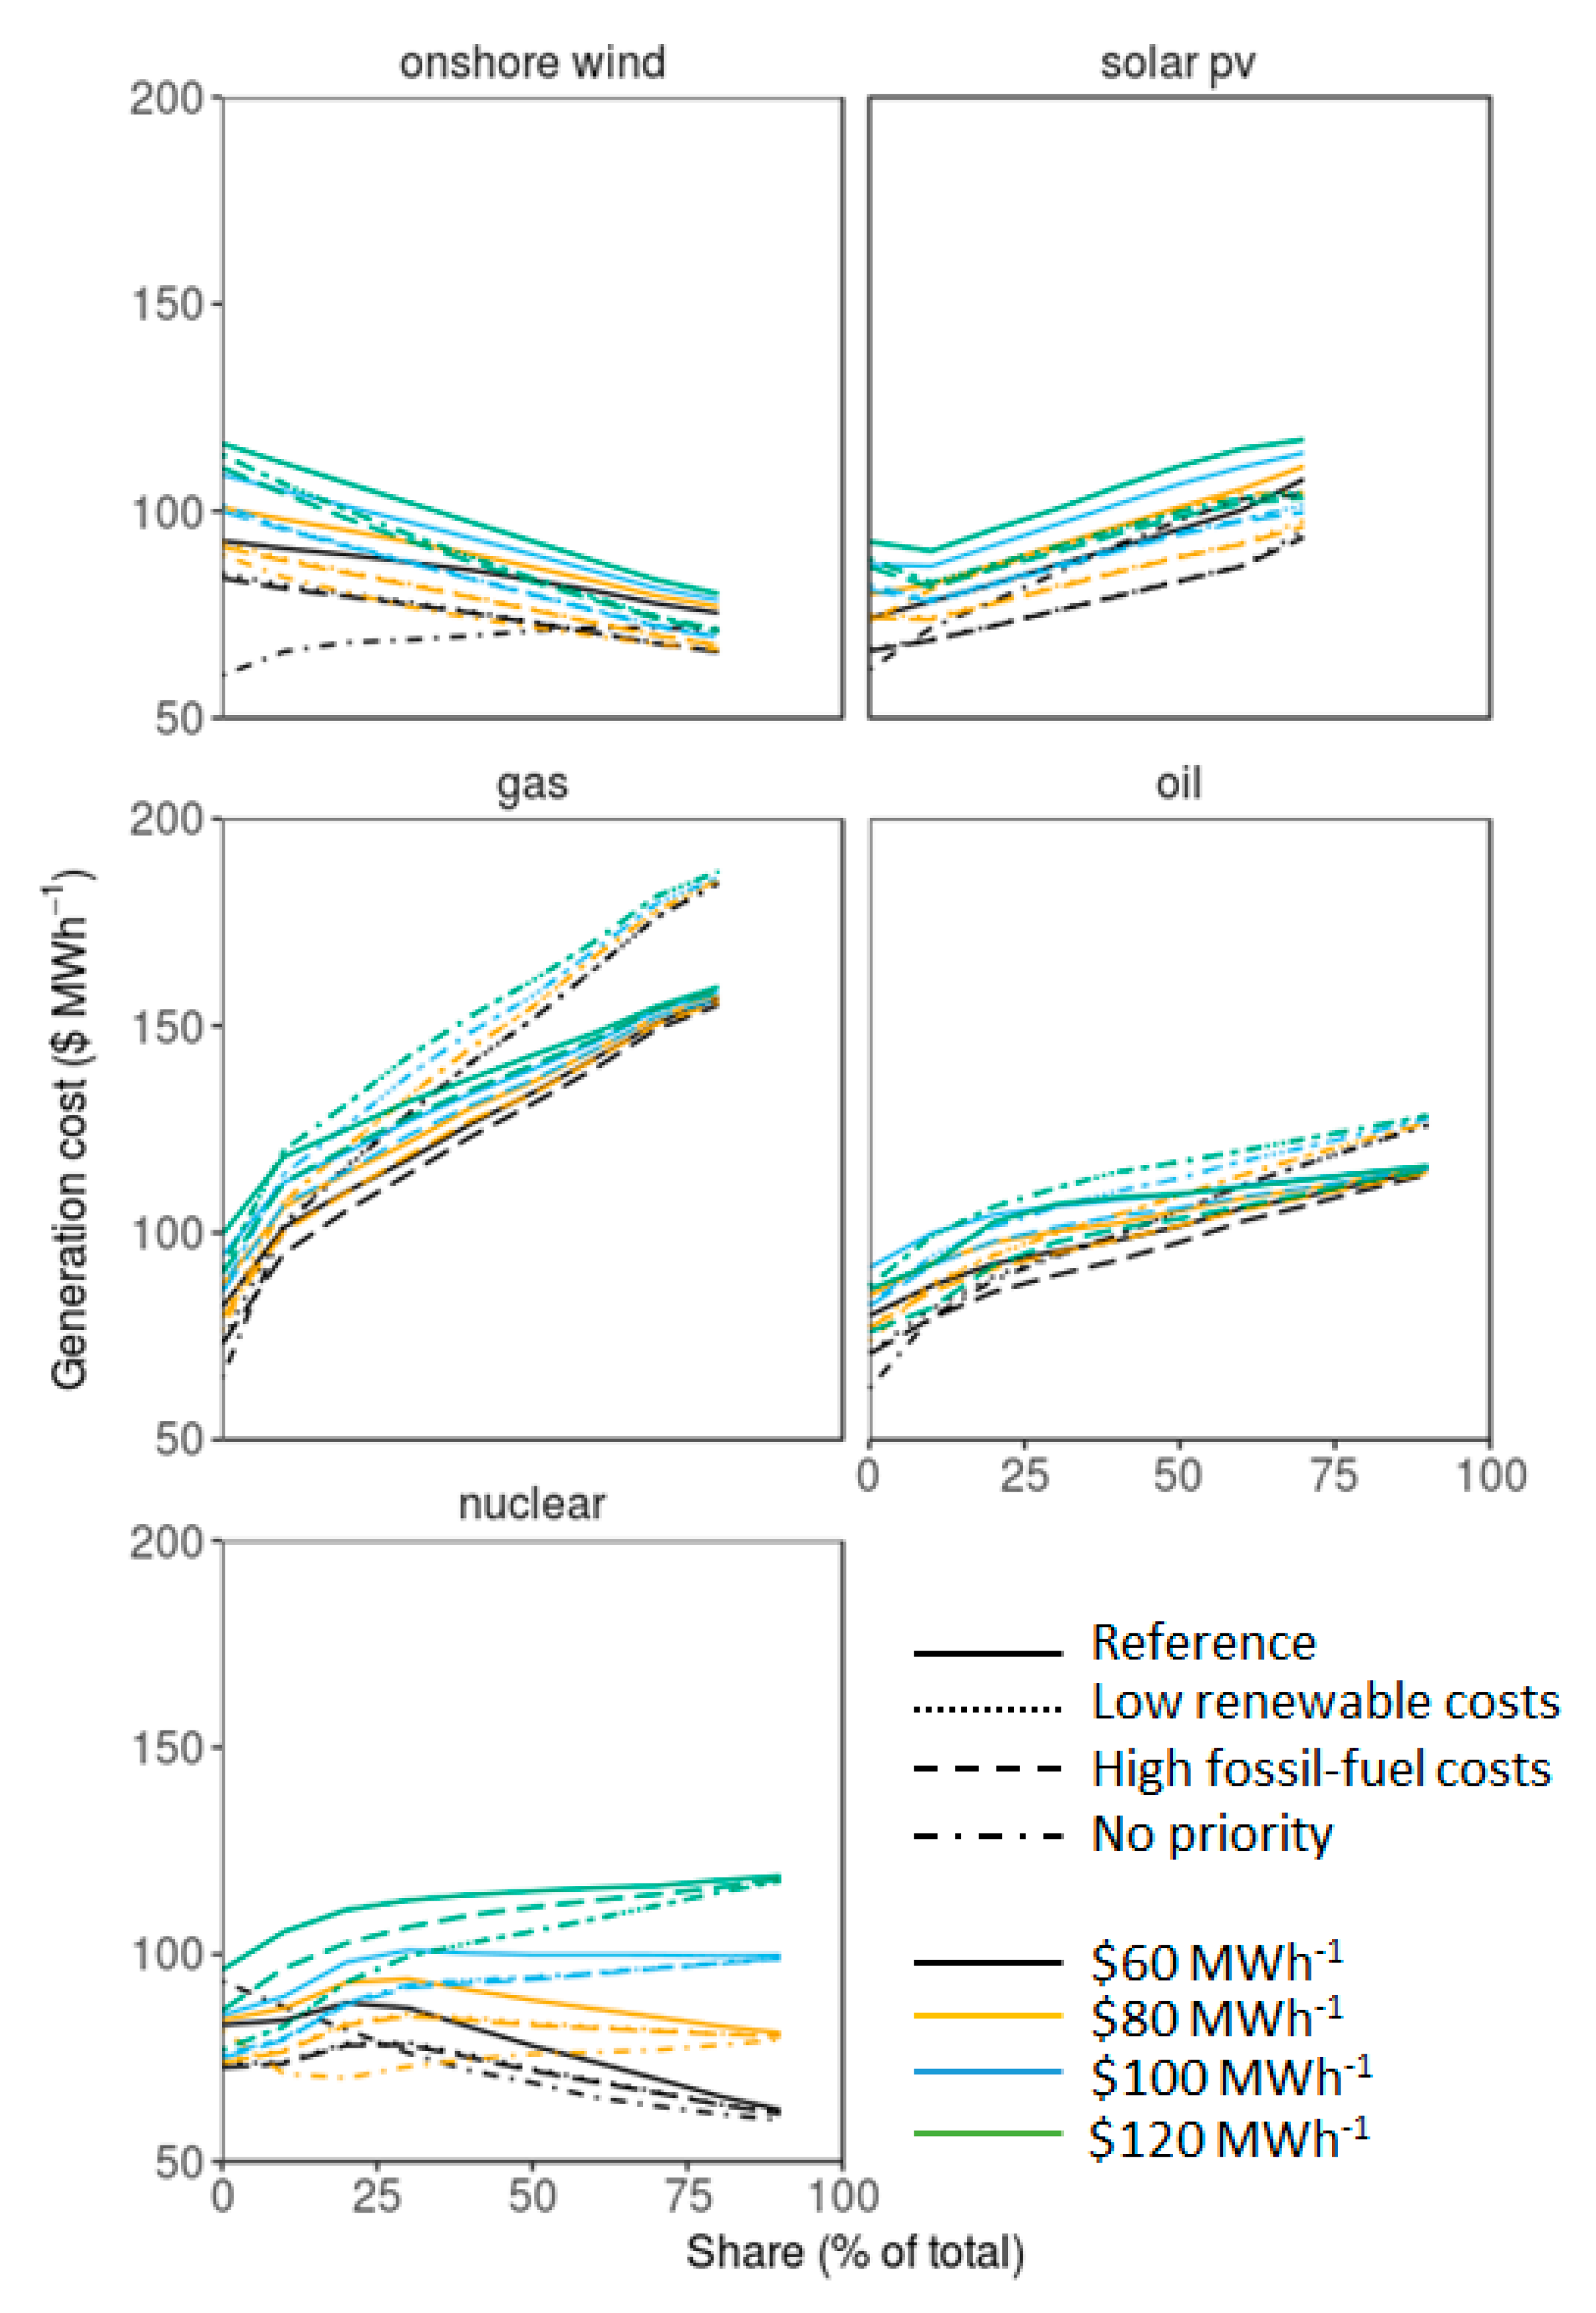
3.4. Variation: Low Renewable, High Fossil-Fuel Costs and No Priority Dispatch
4. Conclusions
Author Contributions
Funding
Conflicts of Interest
References
- International Energy Agency (IEA). World Energy Outlook 2016; International Energy Agency: Paris, France, 2016. [Google Scholar]
- York, R.; McGee, J.A. Does Renewable Energy Development Decouple Economic Growth from CO2 Emissions? Socius 2017, 3. [Google Scholar] [CrossRef]
- Hansen, J.P.; Narbel, P.A.; Aksnes, D.L. Limits to growth in the renewable energy sector. Renew. Sustain. Energy Rev. 2017, 70, 769–774. [Google Scholar] [CrossRef]
- Howe, E.; Blechinger, P.; Cader, C.; Breyer, C. Analyzing drivers and barriers for renewable energy integration to small islands power generation–tapping a huge market potential for mini-grids. In Proceedings of the 2nd International Conference on Micro Perspectives for Decentralized Energy, Berlin, Germany, 27 February 2013. [Google Scholar]
- IEA. Statistics. Available online: http://www.iea.org/statistics/ (accessed on 16 February 2018).
- Szabó, S.; Kougias, I.; Moner-Girona, M.; Bódis, K. Sustainable Energy Portfolios for Small Island States. Sustainability 2015, 7, 12340–12358. [Google Scholar] [CrossRef]
- IAEA. Advances in Small Modular Reactor Technology Developments. Available online: https://aris.iaea.org/publications/smr-book_2018.pdf (accessed on 13 September 2018).
- Fukaya, Y.; Goto, M. Sustainable and safe energy supply with seawater uranium fueled HTGR and its economy. Ann. Nucl. Energy 2017, 99, 19–27. [Google Scholar] [CrossRef]
- Blechinger, P.; Seguin, R.; Cader, C.; Bertheau, P.; Breyer, C. Assessment of the Global Potential for Renewable Energy Storage Systems on Small Islands. Energy Procedia 2014, 46, 294–300. [Google Scholar] [CrossRef]
- Díaz, A.R.; Ramos-Real, F.J.; Marrero, G.A.; Perez, Y. Impact of Electric Vehicles as Distributed Energy Storage in Isolated Systems: The Case of Tenerife. Sustainability 2015, 7, 15152–15178. [Google Scholar] [CrossRef]
- Lokhov, A.; Cameron, R.O.N.; Sozoniuk, V. OECD/NEA Study on the economics and market of small reactors. Nucl. Eng. Technol. 2013, 45, 701–706. [Google Scholar] [CrossRef]
- Korea Power Exchange. Korea Power Exchange. Available online: https://www.kpx.or.kr/eng/index.do (accessed on 20 June 2018).
- AEMO. Generation and Load. Available online: https://www.aemo.com.au/Electricity/National-Electricity-Market-NEM/Data/Market-Management-System-MMS/Generation-and-Load (accessed on 20 June 2018).
- Red Eléctrica de España. Home | Red Eléctrica de España. Available online: http://www.ree.es/en (accessed on 20 June 2018).
- Syed, A. The Australian Energy Assessment (AETA) 2013 Model Update; BREE: Canberra, Australia, 2018. [Google Scholar]
- Hernandez, R.R.; Hoffacker, M.K.; Murphy-Mariscal, M.L.; Wu, G.C.; Allen, M.F. Solar energy development impacts on land cover change and protected areas. Proc. Natl. Acad. Sci. USA 2015, 112, 13579–13584. [Google Scholar] [CrossRef] [PubMed]
- Denholm, P.; Hand, M.; Jackson, M.; Ong, S. Land Use Requirements of Modern Wind Power Plants in the United States; NREL/TP-6A2-45834; National Renewable Energy Laboratory (NREL): Golden, CO, USA, 2009.
- Novak, L. South Australia energy plan: Port Augusta will be home to new $650 million solar thermal power plant. Adelaide Now, 14 August 2017. [Google Scholar]
- Brook, B.W.; Bradshaw, C.J.A. Key role for nuclear energy in global biodiversity conservation. Conserv. Biol. 2015, 29, 702–712. [Google Scholar] [CrossRef] [PubMed]
- Clean Energy Regulator. Electricity Sector Emissions and Generation Data 2016–2017. Available online: http://www.cleanenergyregulator.gov.au/NGER/National%20greenhouse%20and%20energy%20reporting%20data/electricity-sector-emissions-and-generation-data/electricity-sector-emissions-and-generation-data-2016-17 (accessed on 10 June 2018).
- EPSIS. Electric Power Statistics Information System. Available online: http://epsis.kpx.or.kr/epsisnew/selectEkifBoardList.do?menuId=090140&boardId=003140 (accessed on 10 June 2018).
- Zakeri, B.; Syri, S. Value of energy storage in the Nordic Power market—Benefits from price arbitrage and ancillary services. In Proceedings of the 2016 13th International Conference on the European Energy Market (EEM), Porto, Portugal, 6–9 June 2016; pp. 1–5. [Google Scholar]
- Lee, S. 환경부, 한라산국립공원 4.3배 확대 추진, 내년 확정 (Translation: Ministrry of Environment Decided to Expand the Protect Area in Jeju). Available online: http://www.jejusori.net/?mod=news&act=articleView&idxno=199650 (accessed on 28 June 2018).
- Hong, S.; Brook, B.W. A nuclear- to-gas transition in South Korea: Is it environmentally friendly or economically viable? Energy Policy 2018, 112, 67–73. [Google Scholar] [CrossRef]
- Hong, S.; Brook, B.W. At the crossroads: An uncertain future facing the electricity-generation sector in South Korea. Asia Pac. Policy Stud. 2018, 5, 522–532. [Google Scholar] [CrossRef]
- Hydro Tasmania. Battery of the Nations. Available online: https://www.hydro.com.au/clean-energy/battery-of-the-nation (accessed on 28 August 2018).
- Ueckerdt, F.; Brecha, R.; Luderer, G. Analyzing major challenges of wind and solar variability in power systems. Renew. Energy 2015, 81, 1–10. [Google Scholar] [CrossRef]
- Voorspools, K.R.; D’Haeseleer, W.D. An analytical formula for the capacity credit of wind power. Renew. Energy 2006, 31, 45–54. [Google Scholar] [CrossRef]
- Hong, S.; Bradshaw, C.J.A.; Brook, B.W. Evaluating options for sustainable energy mixes in South Korea using scenario analysis. Energy 2013, 52, 237–244. [Google Scholar] [CrossRef]
- Hong, S.; Qvist, S.; Brook, B.W. Economic and environmental costs of replacing nuclear fission with solar and wind energy in Sweden. Energy Policy 2018, 112, 56–66. [Google Scholar] [CrossRef]
- Nian, V. Technology perspectives from 1950 to 2100 and policy implications for the global nuclear power industry. Prog. Nucl. Energy 2018, 105, 83–98. [Google Scholar] [CrossRef]
- Locatelli, G.; Bingham, C.; Mancini, M. Small modular reactors: A comprehensive overview of their economics and strategic aspects. Prog. Nucl. Energy 2014, 73, 75–85. [Google Scholar] [CrossRef]
- Islam, M.R.; Gabbar, H.A. Study of small modular reactors in modern microgrids. Int. Trans. Electr. Energy Syst. 2015, 25, 1943–1951. [Google Scholar] [CrossRef]
- Black, G.; Taylor Black, M.A.; Solan, D.; Shropshire, D. Carbon free energy development and the role of small modular reactors: A review and decision framework for deployment in developing countries. Renew. Sustain. Energy Rev. 2015, 43, 83–94. [Google Scholar] [CrossRef]
- Alonso, G.; Vargas, S.; del Valle, E.; Ramirez, R. Alternatives of seawater desalination using nuclear power. Nucl. Eng. Des. 2012, 245, 39–48. [Google Scholar] [CrossRef]
- Orhan, M.F.; Dincer, I.; Naterer, G.F.; Rosen, M.A. Coupling of copper–chloride hybrid thermochemical water splitting cycle with a desalination plant for hydrogen production from nuclear energy. Int. J. Hydrogen Energy 2010, 35, 1560–1574. [Google Scholar] [CrossRef]
- Ohashi, H.; Sato, H.; Goto, M.; Yan, X.; Sumita, J.; Tazawa, Y.; Nomoto, Y.; Aihara, J.; Inaba, Y.; Fukaya, Y.; et al. A Small-Sized HTGR System Design for Multiple Heat Applications for Developing Countries. Int. J. Nucl. Energy 2013. [Google Scholar] [CrossRef]
- Mantero, G.; Lomonaco, G.; Marotta, R. Nuclear desalination: An alternative solution to the water shortage. Glob. J. Energy Technol. Res. Updat. 2014, 1, 57–70. [Google Scholar]
- Castagnola, L.; Lomonaco, G.; Marotta, R. Nuclear systems for hydrogen production: State of art and perspectives in transport sector. Glob. J. Energy Technol. Res. Updat. 2014, 1, 4–18. [Google Scholar]
- Dincer, I. Green methods for hydrogen production. Int. J. Hydrogen Energy 2012, 37, 1954–1971. [Google Scholar] [CrossRef]


| Jeju | Tasmania | Tenerife | |
|---|---|---|---|
| Latitude | 33° N | 42° S | 28° N |
| Longitude | 126° E | 147° E | 16° E |
| Area (km2) | 1849 | 68,401 | 2034 |
| Population | 604,771 | 515,000 | 889,936 |
| Transmission (MW) | 400 (from mainland to Jeju) | 500 (bidirectional) | None |
| Peak (MW) | 921 | 1721 | 569 |
| Demand (GWh) | 5422 | 10,527 | 3530 |
| Renewables (GWh) | 714 (wind) | 8038 (hydro) 1063 (wind) | 62 (wind) |
| Fossil fuels (GWh) | 2410 | 794 | 3488 |
| Criteria | Power Plant | Jeju | Tasmania | Tenerife |
|---|---|---|---|---|
| land use (km2 MW−1) | solar photovoltaic (pv) | 0.025 | 0.025 | 0.025 |
| onshore wind | 0.33 | 0.33 | 0.33 | |
| solar thermal | 0.04 | |||
| emissions (kg MWh−1) | coal | 823 | 880 | |
| gas | 362 | 519 | ||
| oil | ||||
| biomass | 600 | 491 | ||
| cost (USD$ MWh−1) * | solar pv | 60, 80 | 212, 264 | 98.5, 137.7 |
| onshore wind | 200, 350 | 111, 122 | 62.5, 81.2 | |
| offshore wind | 130, 225 | |||
| solar thermal | 295, 361 | |||
| coal | 80, 120 | 84, 94 | ||
| gas | 120, 150 | 81, 93 | 134.3, 204.4 | |
| oil | 104.3, 130.17 | |||
| biomass | 120, 150 | 75, 160 | ||
| hydro | 75, 85 | |||
| transmission | 200, 250 | 150, 200 | ||
| nuclear | 60, 80 | 94, 99 | 100, 200 |
© 2018 by the authors. Licensee MDPI, Basel, Switzerland. This article is an open access article distributed under the terms and conditions of the Creative Commons Attribution (CC BY) license (http://creativecommons.org/licenses/by/4.0/).
Share and Cite
Hong, S.; Brook, B.W. Economic Feasibility of Energy Supply by Small Modular Nuclear Reactors on Small Islands: Case Studies of Jeju, Tasmania and Tenerife. Energies 2018, 11, 2587. https://doi.org/10.3390/en11102587
Hong S, Brook BW. Economic Feasibility of Energy Supply by Small Modular Nuclear Reactors on Small Islands: Case Studies of Jeju, Tasmania and Tenerife. Energies. 2018; 11(10):2587. https://doi.org/10.3390/en11102587
Chicago/Turabian StyleHong, Sanghyun, and Barry W. Brook. 2018. "Economic Feasibility of Energy Supply by Small Modular Nuclear Reactors on Small Islands: Case Studies of Jeju, Tasmania and Tenerife" Energies 11, no. 10: 2587. https://doi.org/10.3390/en11102587
APA StyleHong, S., & Brook, B. W. (2018). Economic Feasibility of Energy Supply by Small Modular Nuclear Reactors on Small Islands: Case Studies of Jeju, Tasmania and Tenerife. Energies, 11(10), 2587. https://doi.org/10.3390/en11102587