1. Introduction
The exponential increase in energy demand, concerns over environmental degradation due to the effects of greenhouse gases, and the depletion of fossil fuels have resulted in stricter emission laws, making alternative, renewable energy sources a sustainable and promising option. Fossil fuel-based transport and associated sectors accounted for about 30–35% in many developed countries [
1]. Recently, batteries used in electric vehicles (EVs) have gathered reasonable importance as a possible means to reduce fossil fuel dependence. In EVs, the battery serves as a power source for driving the vehicle, and can be recharged before use, as compared to internal combustion engine (ICE) operated automotives, where power is derived from the combustion of fossil fuel.
A stack of battery packs is the primary power source in many modern EVs. A single battery pack is composed of many modules; each module is composed of many battery cells, making the single cell the fundamental unit of the power source for EVs. As a result, the overall performance, range, and operation of EVs are affected by the performance of the battery pack, module, and individual single cell. Lithium-ion batteries have high specific power and specific energy densities, lower discharge rates when not in use leading to better shelf life, relatively longer charge-discharge life cycles, and faster charging capabilities, which makes them favorable as the power source to drive EVs [
2,
3,
4]. Zubi et al. conducted a comprehensive review about the current state of lithium-ion batteries, and determined that lithium-ion batteries have the capability of developing as an essential segment of future energy needs, including in the automotive sector [
5]. However, the degradation of lithium-ion batteries’ capabilities in terms of capacity fade, power fade, and self-discharge at extreme temperatures indicates temperature influence; a temperature range of 25 °C to 40 °C could be considered as favorable for optimal operation [
6]. For lower temperatures, the reduction in power is attributed to higher internal resistance, and for higher temperatures, the reduction in lifespan is attributed to thermal deterioration. In the absence of an efficient cooling system, the battery temperature escalates due to heat accumulation, and could lead to thermal runaway damaging whole battery power source [
7,
8]. In thermal runaway, a large number of chain chemical reactions occur continuously, leading to a short circuit, with the possibility of fire. Safety in the battery-operated vehicles is one of the main impediments for comprehensive usage of batteries in the vehicles, making the thermal management of batteries a very important aspect for the advancement of EVs [
9].
The cooling strategy employed in the battery thermal management system needs to maintain maximum temperature, average temperature, and temperature evenness in the battery pack, as well as in each cell in the specified working temperature range, for better performance [
6]. A variety of cooling strategies are being investigated for lithium-ion batteries, with different coolants such as air, mineral oil, heat pipes, water, and phase change material (PCM). Among the various cooling methods and coolants, water-based cooling systems have generated much attention, as water has excellent thermal properties as a coolant [
10]. Air-based cooling strategies have the advantage of a simplified arrangement and little maintenance, but suffer from limitations in maximum heat removal capacity. In addition, the noise issue due to the high fan speed makes this solution undesirable [
11]. Integrating PCM into the cooling system has shown the advantage of even temperature distribution; however, the low cooling efficiency issue needs to be resolved [
12]. PCM-based cooling could be a promising option provided that the thermal conductivity of PCM is improved [
13]. Mineral oil, due to its dielectric behavior, could be used for direct cooling with better efficiency, but feasibility for practical usage needs to be tested [
14,
15]. Comparing a variety of cooling strategies, water-based cooling systems provide excellent cooling, and have the advantage of less volume requirement due to compactness. Panchal et al. [
16] conducted an experimental and numerical study on the thermal behavior of prismatic lithium-ion battery cells by employing a mini-channel cold plate, and suggested that CFD simulations could be used in the design and optimization of battery cooling systems. In a supplement to the above discussion, major automotive manufacturing companies such Tesla, Hyundai, General Motors etc. are using water-based cooling methods for temperature control of the lithium-ion pouch cells in EVs.
One of the methods to enhance the travel range of EVs is to design lithium-ion batteries with higher energy densities which can provide more power per unit weight [
17]. Throughout the last decade, the enhancement in the energy density of lithium-ion batteries has resulted in a corresponding increase in EV travel range. However, high energy density lithium-ion batteries have the disadvantage of high heat generation. Therefore, effective and compact cooling is necessary for safe operation and longevity [
18,
19]. The optimization of existing cooling methods is one of the effective ways to enhance the cooling capability.
In the present study, the cooling performance characteristics of lithium-ion pouch cells with cold plates on both surfaces are numerically investigated. The input parameters are varied by changing the inlet coolant mass flow rate and temperature for 1C and 2C discharge rates. The validation of numerical analysis is conducted by comparing with experimental results provided by Panchal et al. [
20]. Maximum temperature, temperature difference, pressure drop, and cooling energy efficiency parameters are studied as performance evaluating parameters. In addition, the effects of a different number of channels on the cooling performance of a 20 Ah lithium-ion pouch cell are studied.
3. Results and Discussion
Literature exists for the water jacket cooling [
22] and mini channel cold plate cooling [
23], but detailed analysis of U-turn cold plates with varying the inlet coolant mass flow rates, the inlet coolant temperatures and the number of cooling channels on both side surfaces of the lithium-ion pouch cell are not reported. Therefore, the cooling performance characteristics of the 20 Ah lithium-ion pouch cell with cold plates along both surfaces are numerically investigated with variations of the inlet coolant mass flow rate and the inlet coolant temperature for 1C and 2C discharge rates. The temperature distribution, the pressure drop, and the cooling energy efficiency parameter (
β) are considered as the performance parameters. In addition, variations in the cold plate geometry are considered with different numbers of the cooling channels, and the subsequent effect on the cooling performance is investigated.
3.1. Validation
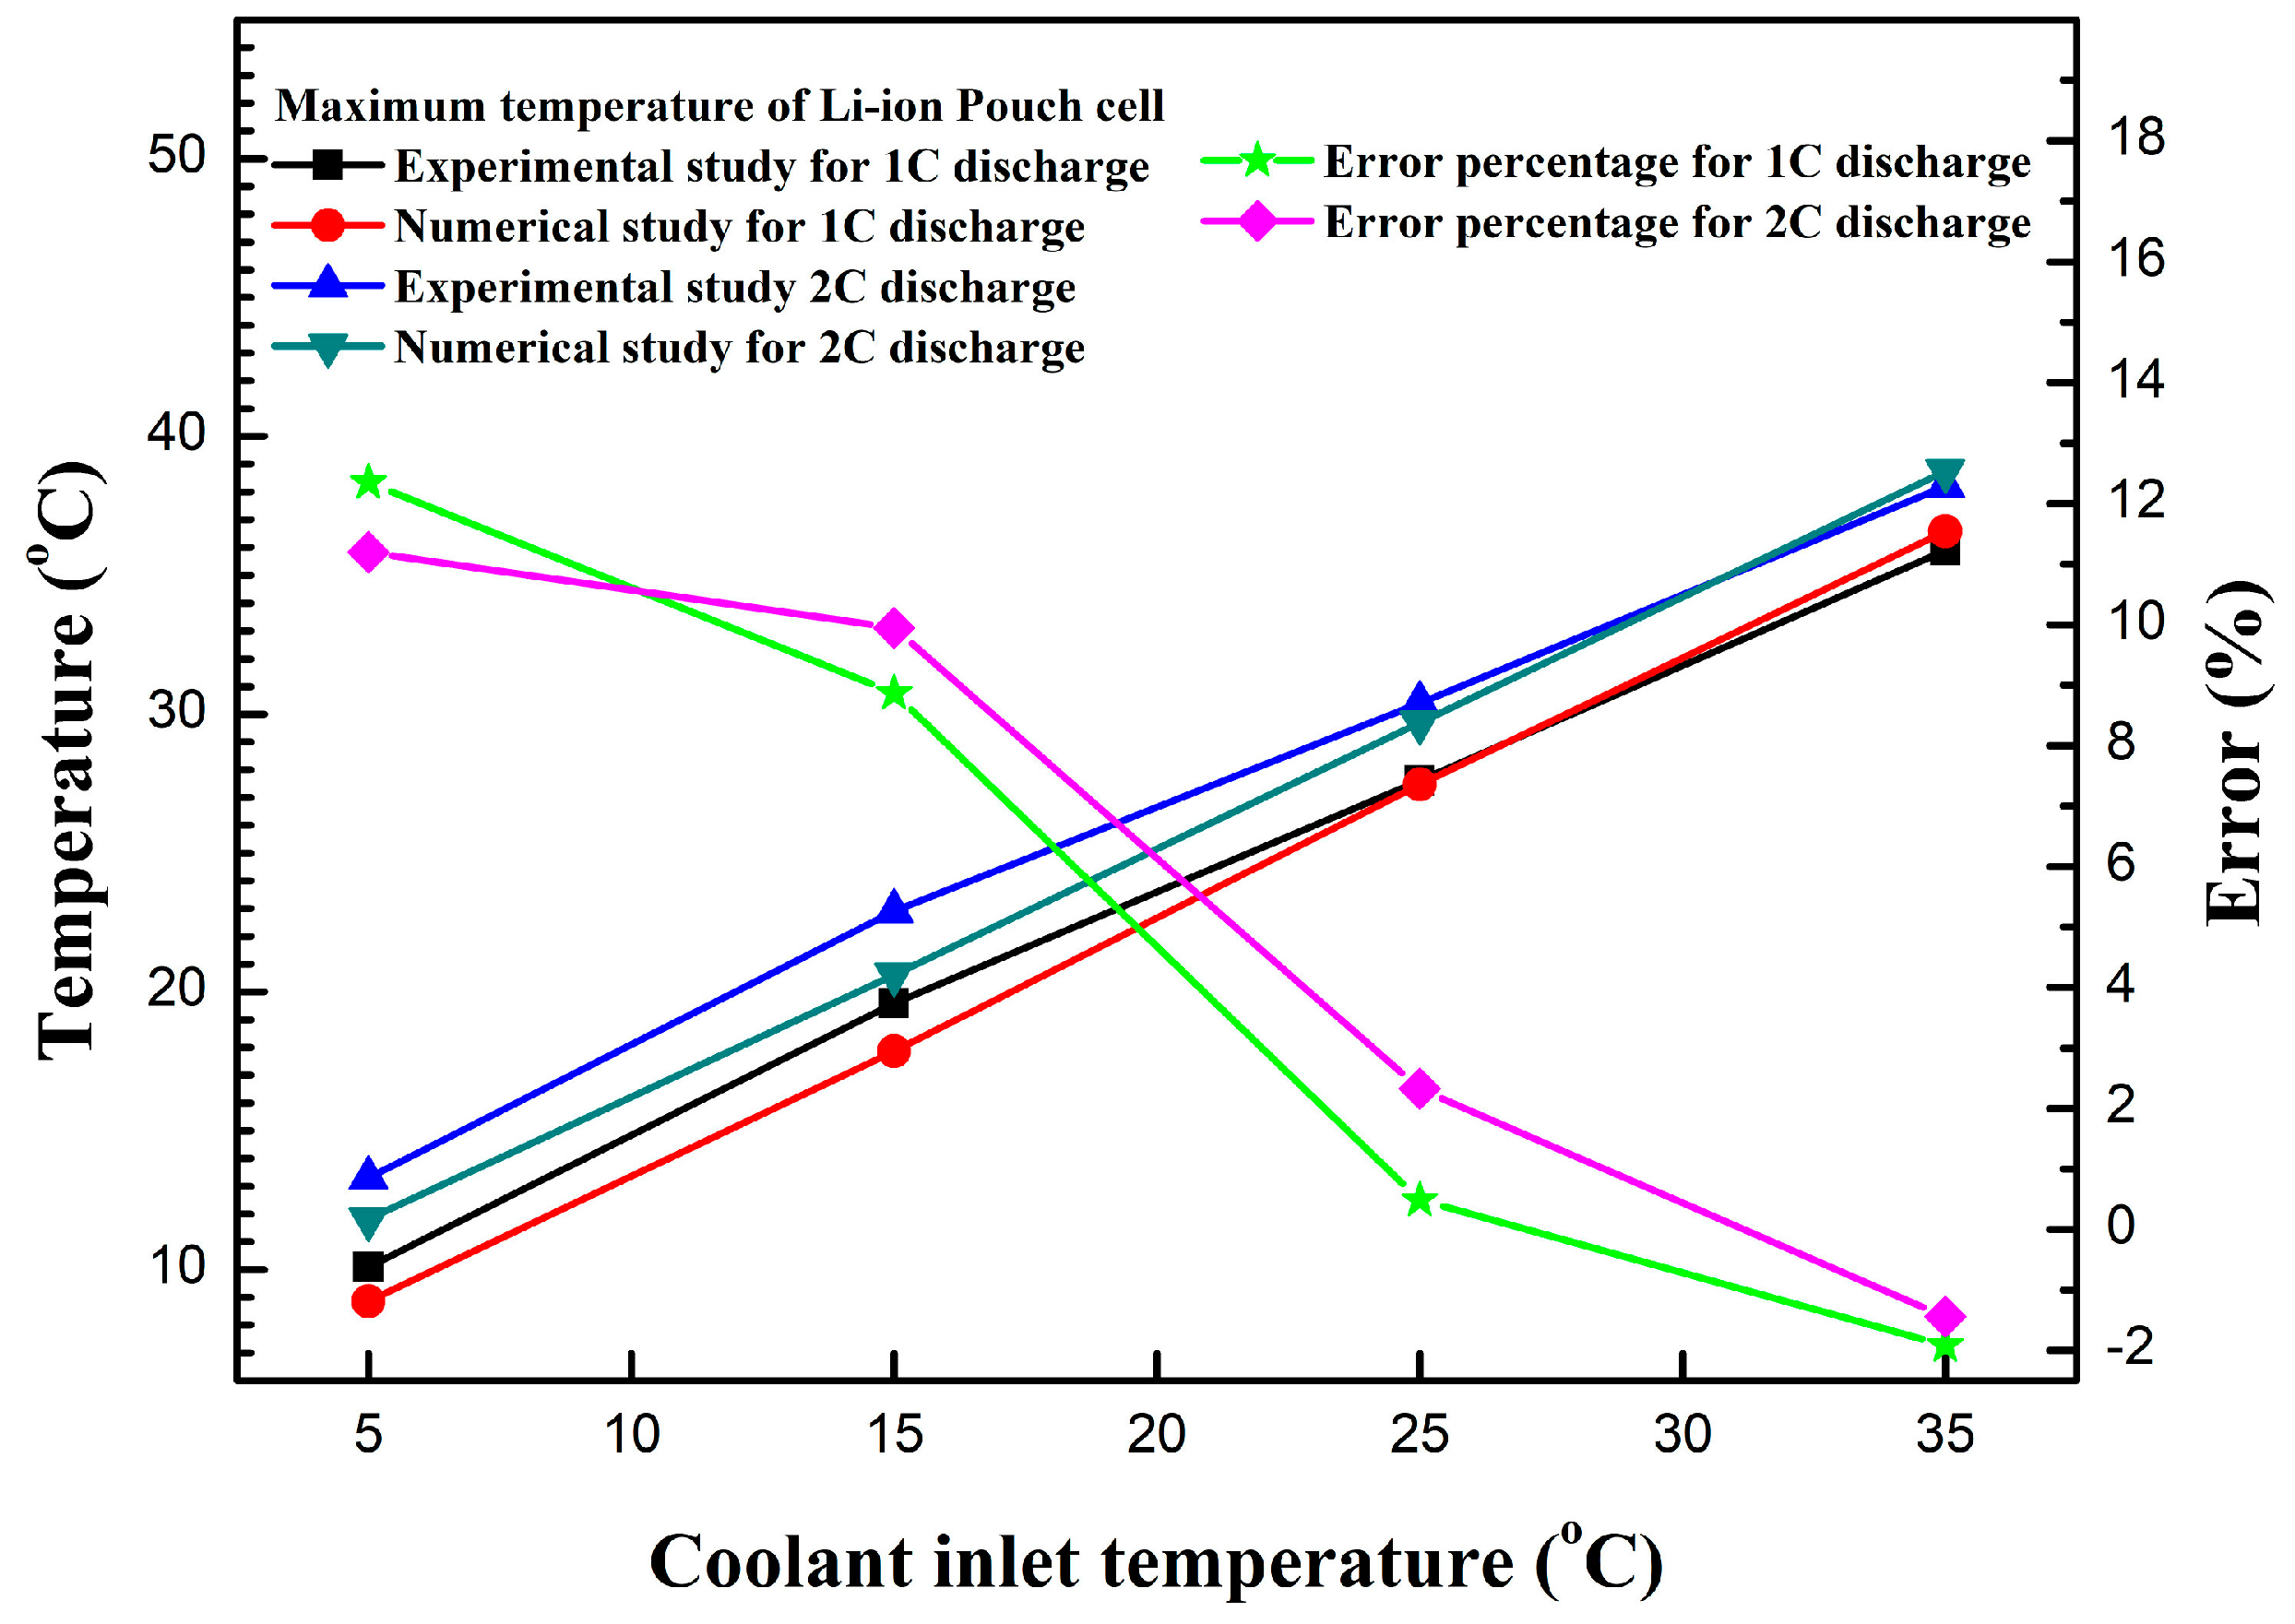
To validate the accuracy of the numerical simulation results with the experimental results, the maximum temperature of 20 Ah lithium-ion pouch cell with varying the inlet coolant temperature is considered. A comparison of the experimental and the numerical simulation is carried out by employing similar geometries, dimensions, and boundary conditions.
Figure 4 shows the comparison of the numerical results with the experimental results provided by Panchal et al. [
20]. The comparison showed good agreement within ±13% of the existed data; thus, validation is confirmed.
3.2. Temperature Distribution
Internal resistance leading to ohmic heating, and electrochemical reactions leading to entropy change, contribute to heat generation during the battery cell operation. The generated heat could increase the battery temperature owing to heat accumulation. The increase in temperature affects the battery capacity as well as its resistance. This is significant for the advancement of EVs, as vehicle driving range is dependent on battery cell and operating temperature. The maximum temperature and the temperature non-uniformity in the battery during the operation are two critical criteria for quantifying the performance of the battery cooling system. The temperature non-uniformity in the battery is an indicator of uneven temperature distribution, and is defined as the difference between the maximum and minimum temperature of the battery.
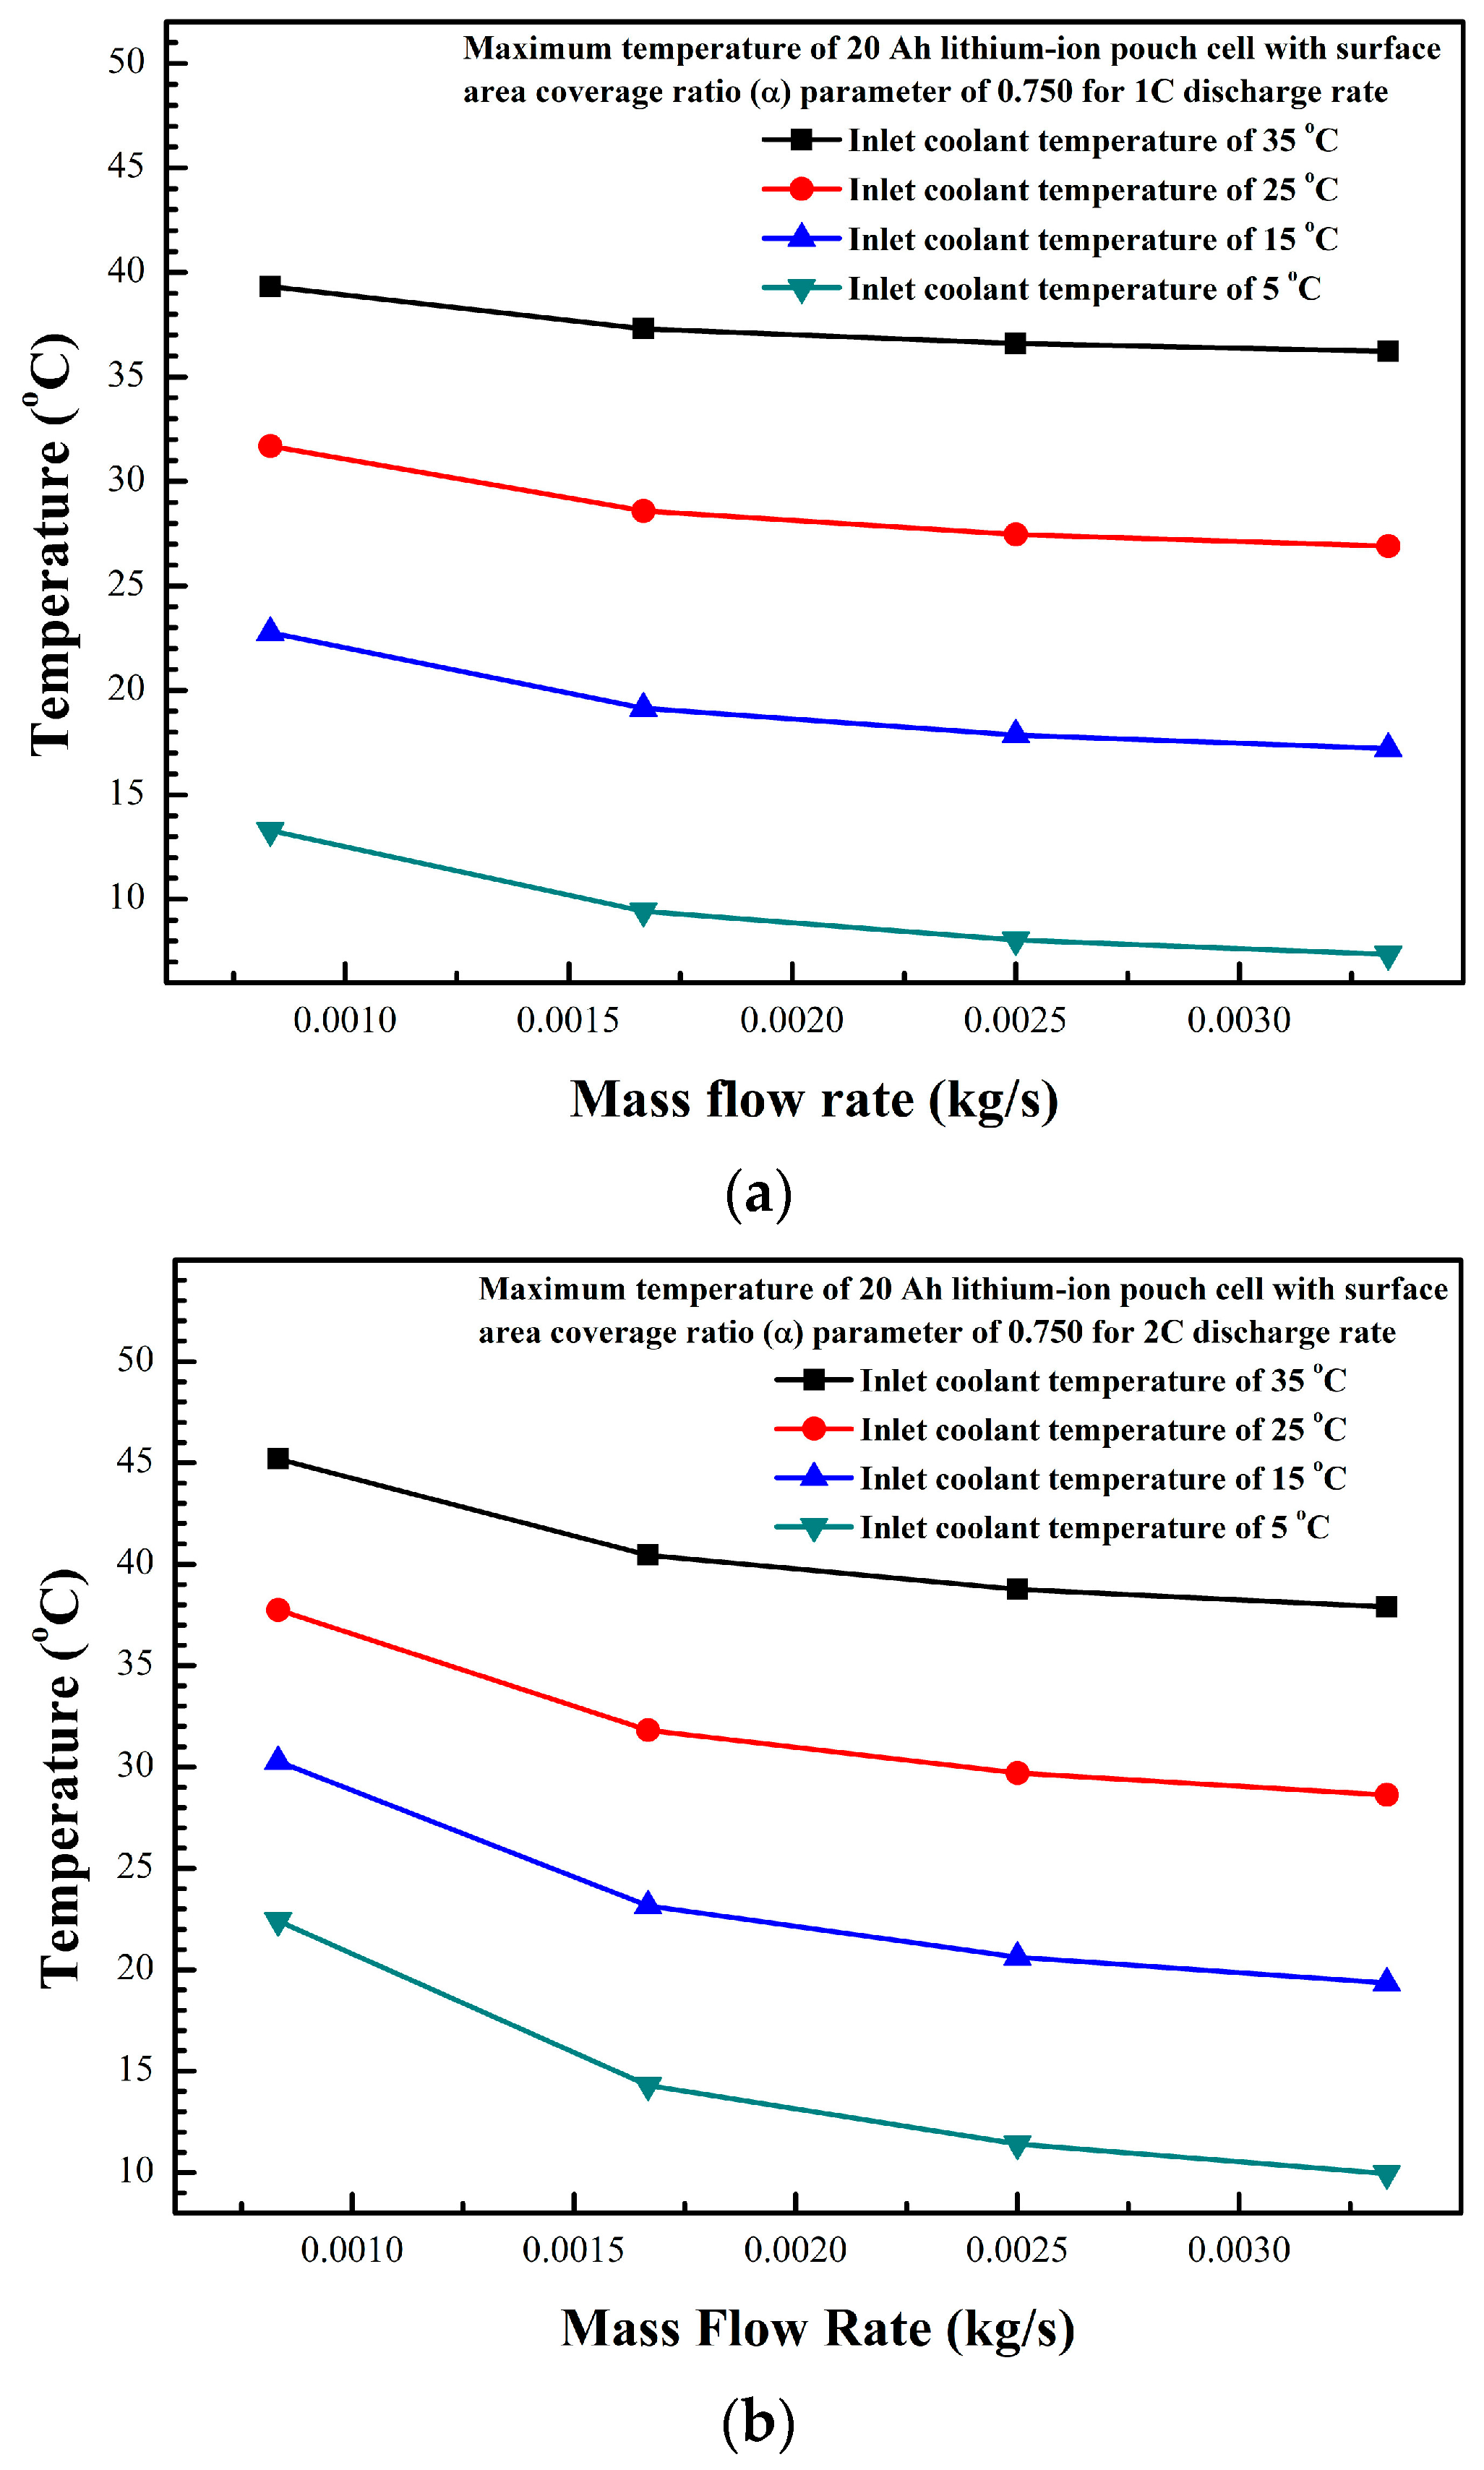
Figure 5 shows the maximum temperature distribution for the 20 Ah lithium-ion pouch cell with surface area coverage ratio (α) parameter of 0.750.
Figure 5a,b show the maximum temperature distribution for the 20 Ah lithium-ion pouch cell for 1C and 2C discharge rates, respectively. For both 1C and 2C discharge rates, the maximum temperature decreased with an increase of the inlet coolant mass flow rate varying from 0.000833 kg/s to 0.003333 kg/s, with surface area coverage ratio (α) parameter of 0.750.
Figure 5a shows that the maximum temperature increased by 392.3% as the inlet coolant temperature increased from 5 °C to 35 °C at the inlet coolant mass flow rate of 0.003333 kg/s. As shown in the
Figure 5a, the maximum temperature decreased by 8.5% as the inlet coolant mass flow rate increased from 0.000833 kg/s to 0.003333 kg/s at an inlet coolant temperature of 35 °C and the maximum temperature increased by 80.6% as the inlet coolant mass flow rate increased from 0.000833 kg/s to 0.003333 kg/s at an inlet coolant temperature of 5 °C.
Figure 5b shows that the maximum temperature increased by 280.7% as the inlet coolant temperature increased from 5 °C to 35 °C at the inlet coolant mass flow rate of 0.003333 kg/s. As shown in the
Figure 5b, the maximum temperature increased by 19.2% as the inlet coolant mass flow rate increased from 0.000833 kg/s to 0.003333 kg/s at an inlet coolant temperature of 35 °C. The maximum temperature increased by 125.2% as the inlet coolant mass flow rate increased from 0.000833 kg/s to 0.003333 kg/s at an inlet coolant temperature of 5 °C. This indicates that, for both 1C and 2C discharge rates, the higher inlet coolant mass flow rate and the lower inlet coolant temperature provides the lower maximum temperature in the lithium-ion pouch cell with cold plates along both surfaces. As shown in
Figure 5a,b, when the inlet coolant mass flow rates varied from 0.001667 kg/s to 0.003333 kg/s, the reduction scale of the maximum temperature is lower than those of the inlet coolant mass flow rates varying from 0.000833 kg/s to 0.001667 kg/s for the different inlet coolant temperatures. Comparing with
Figure 5a and
Figure 5b, the maximum temperatures show similar trends; however, the maximum temperatures for 2C discharge rate are higher than those for 1C discharge rate. As shown in the
Figure 5b, the highest maximum temperature is maintained below 45 °C for all cases, except for the inlet coolant temperature of 35 °C and the inlet coolant mass flow rate of 0.000833 kg/s. Except for this one case, the maximum temperature is maintained below 40 °C, which, as suggested by many researchers, yields optimum performance [
6]. The variation in the inlet coolant temperatures has a significant effect on the maximum temperatures of the lithium-ion pouch cell as compared with variations in an inlet coolant mass flow rate. Therefore, it can be concluded that for providing optimum operating temperature in the ranges from 25 °C to 40 °C for the lithium-ion pouch cell for 1C and 2C discharge rates with cold plates along both surfaces, inlet coolant temperatures of 15 °C and 25 °C are suggested.
Temperature non-uniformity may cause capacity reduction and hikes in resistance, which may ultimately speed up non-uniform aging of the lithium-ion pouch cell [
24].
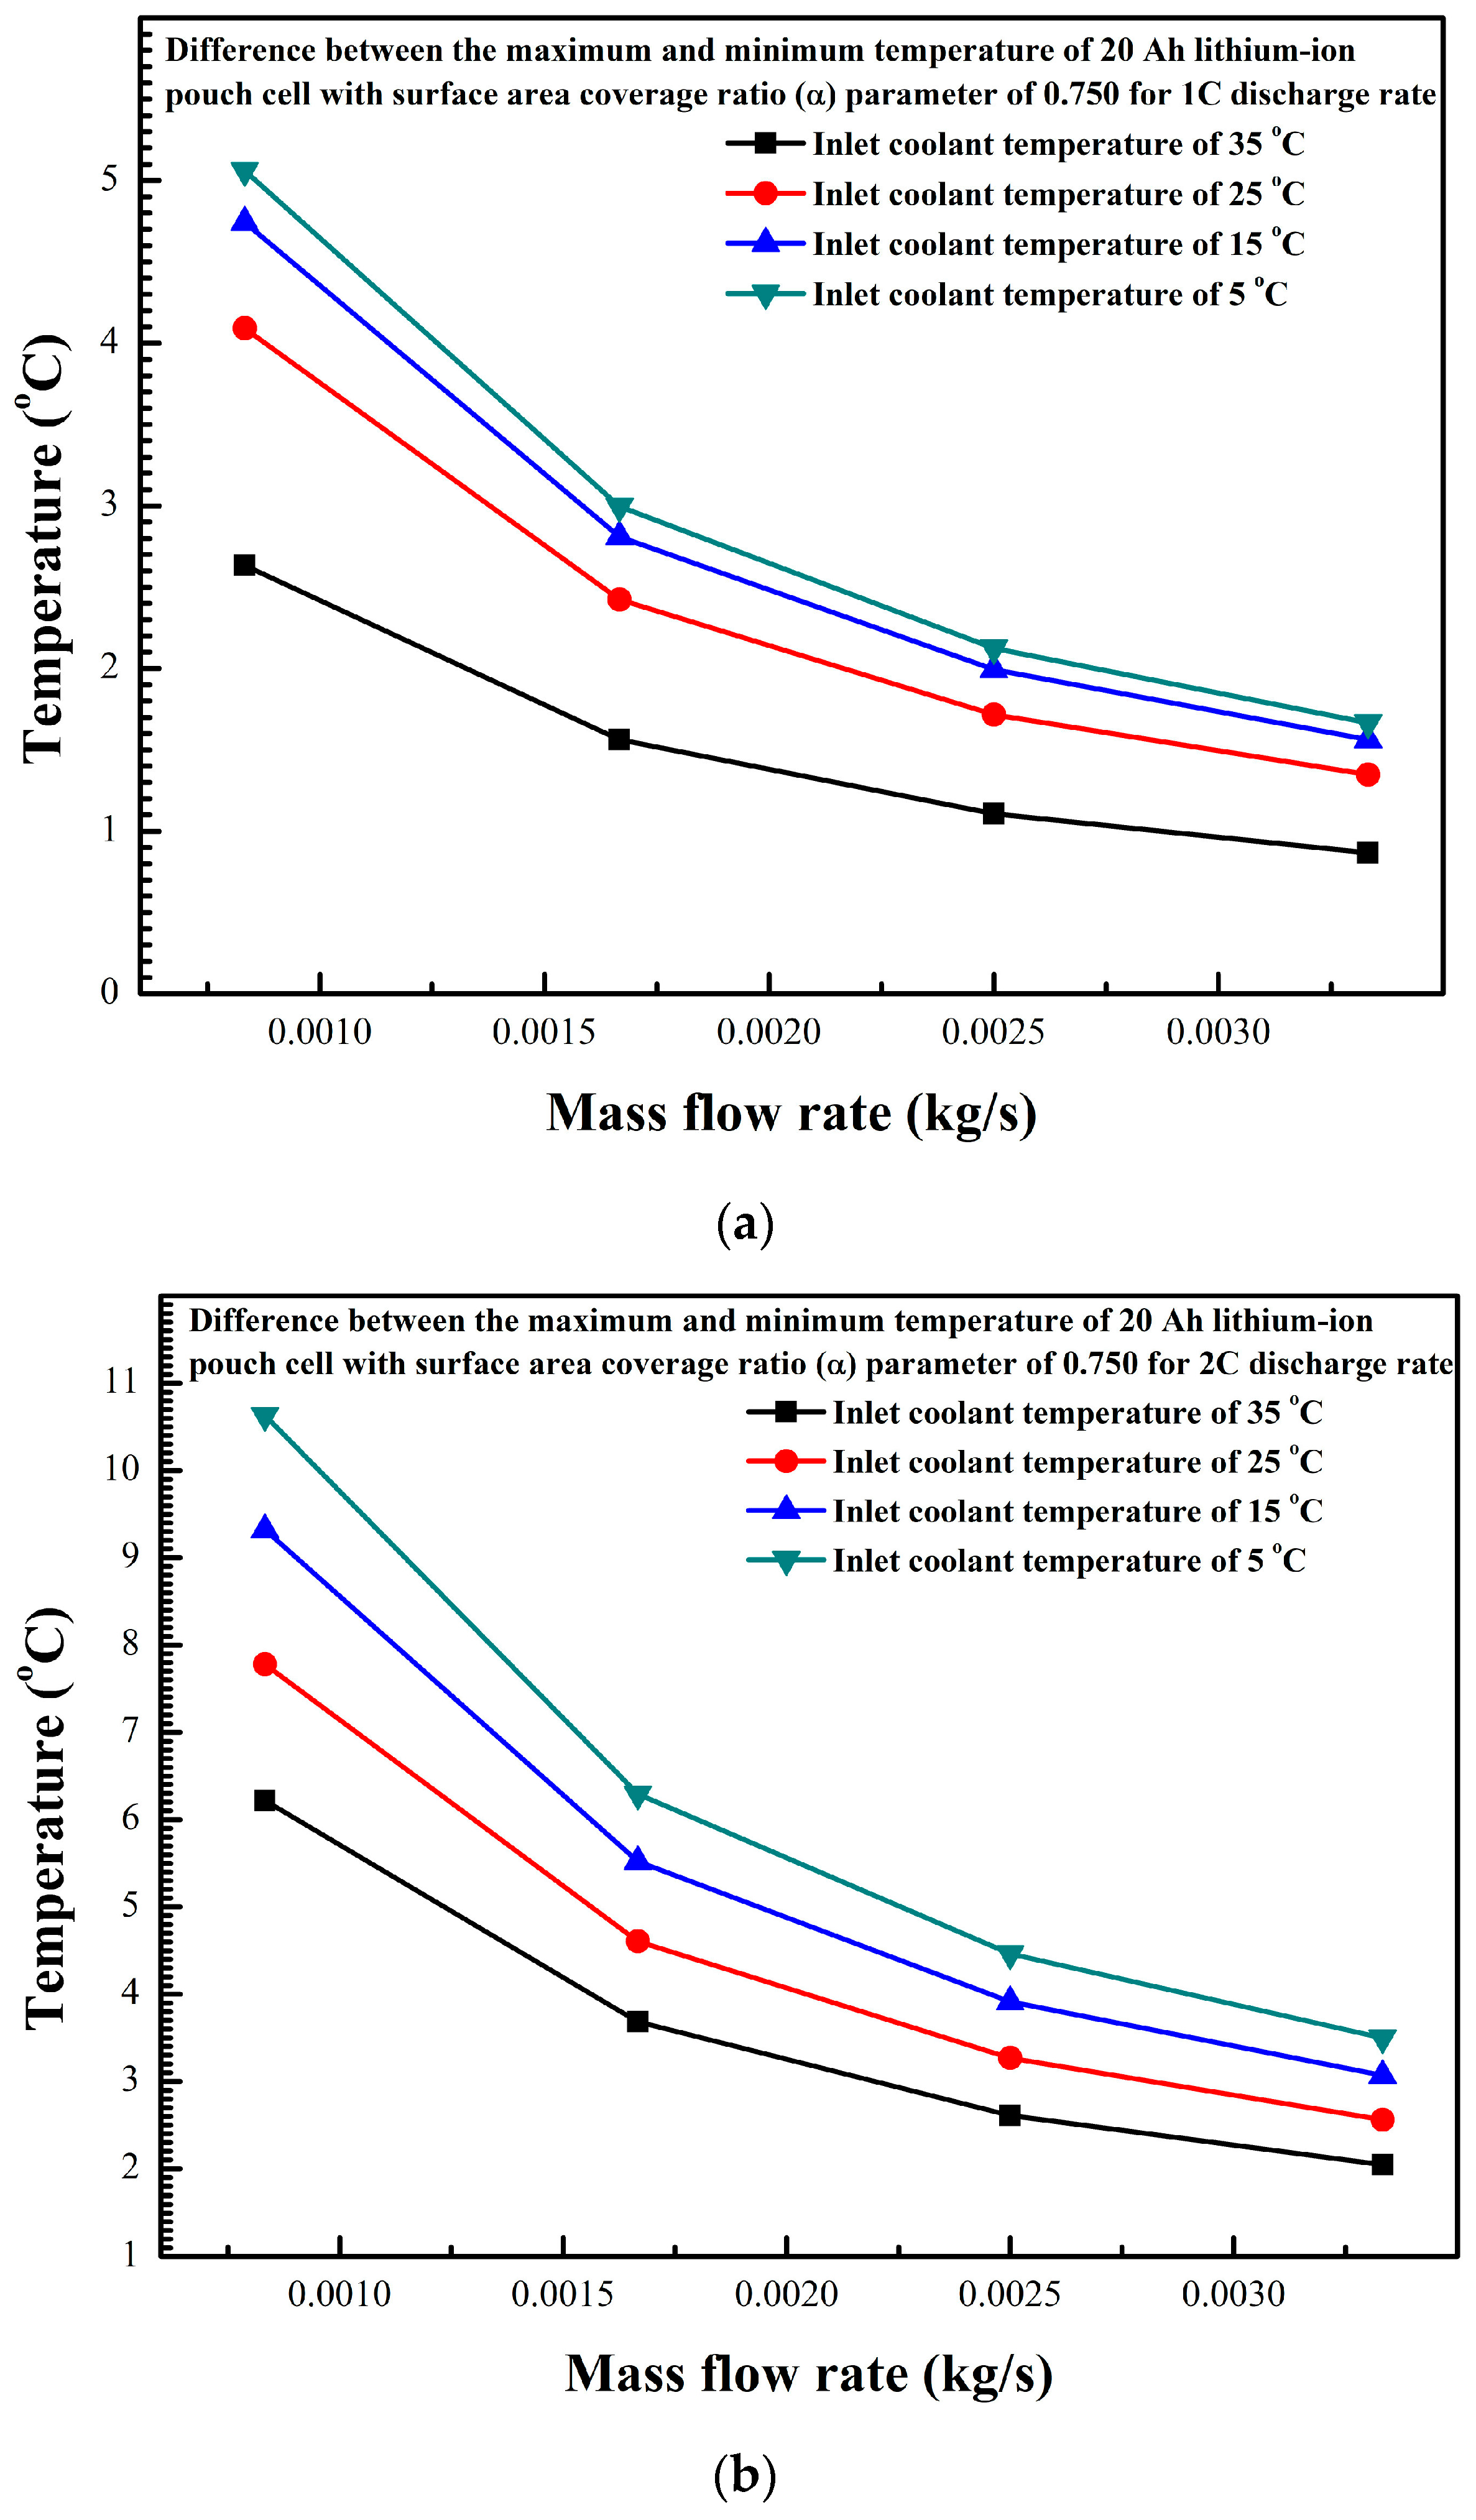
Figure 6 shows the difference between the maximum and the minimum temperature of 20 Ah lithium-ion pouch cell with surface area coverage ratio (α) parameter of 0.750.
Figure 6a,b show the difference between the maximum and the minimum temperature of 20 Ah lithium-ion pouch cell for 1C and 2C discharge rates, respectively. For both 1C and 2C discharge rates, the difference between the maximum and the minimum temperature decreased with increase of the inlet coolant mass flow rate varied from 0.000833 kg/s to 0.003333 kg/s for surface area coverage ratio (α) parameter of 0.750.
For the low inlet coolant mass flow rate, the difference between the maximum and the minimum temperature significantly decreased with an increase of the inlet coolant temperature. However, for the higher inlet coolant mass flow rates, the difference between the maximum and minimum temperatures is changed slightly with an increase of the inlet coolant temperature. This indicates that, for both 1C and 2C discharge rates, the higher inlet coolant mass flow rate and the higher inlet coolant temperature provides the better temperature uniformity considering the difference between the maximum and the minimum temperature in 20 Ah lithium-ion pouch cell with cold plates along both surfaces. As shown in
Figure 6a,b, for the inlet coolant mass flow rates varying from 0.001667 kg/s to 0.003333 kg/s, the reduction scale of the difference between the maximum and the minimum temperature is lower than those of the inlet coolant mass flow rates varying from 0.000833 kg/s to 0.001667 kg/s for the different inlet coolant temperatures. Comparing with
Figure 6a and
Figure 6b, the difference between the maximum and the minimum temperatures are close for 1C discharge rate for the inlet coolant temperatures of 5 °C and 15 °C, when the inlet coolant mass flow rate coolant varied from 0.000833 kg/s to 0.003333 kg/s. As shown in the
Figure 6b, the highest difference between the maximum and the minimum temperature is maintained below 5 °C for the inlet coolant mass flow rates of 0.002500 kg/s and 0.003333 kg/s. Therefore, it can be concluded that for providing optimum operating difference between the maximum and the minimum temperature below 5 °C for the 20 Ah lithium-ion pouch cell for 1C and 2C discharge rates with cold plates along both surfaces, the inlet coolant mass flow rates of 0.002500 kg/s and 0.003333 kg/s are suggested.
3.3. Pressure Drop
Figure 7 shows the pressure drop for the coolant of 20 Ah lithium-ion pouch cell with varying the number of channels and the mass flow rates. The number of channels is varied from 4 to 10 and the mass flow rate is varied from 0.000833 kg/s to 0.003333 kg/s. The pressure drop is directly indicative of pumping cost, and must be kept as low as possible. As shown in
Figure 7, the number of channels and the mass flow rates have the opposite influence on the pressure drop. As a result, to provide better energy efficiency, the number of channels and the mass flow rates could be optimized. The pressure drop increased by 466.8% as the number of channels decreased from 10 to 4. The pressure drop increased by 1124.0% as the mass flow rate of the coolant is increased from 0.000833 kg/s to 0.003333 kg/s. The effect of both parameters of the mass flow rate as well as the number of channels on the pressure drop are significant.
3.4. Cooling Energy Efficiency
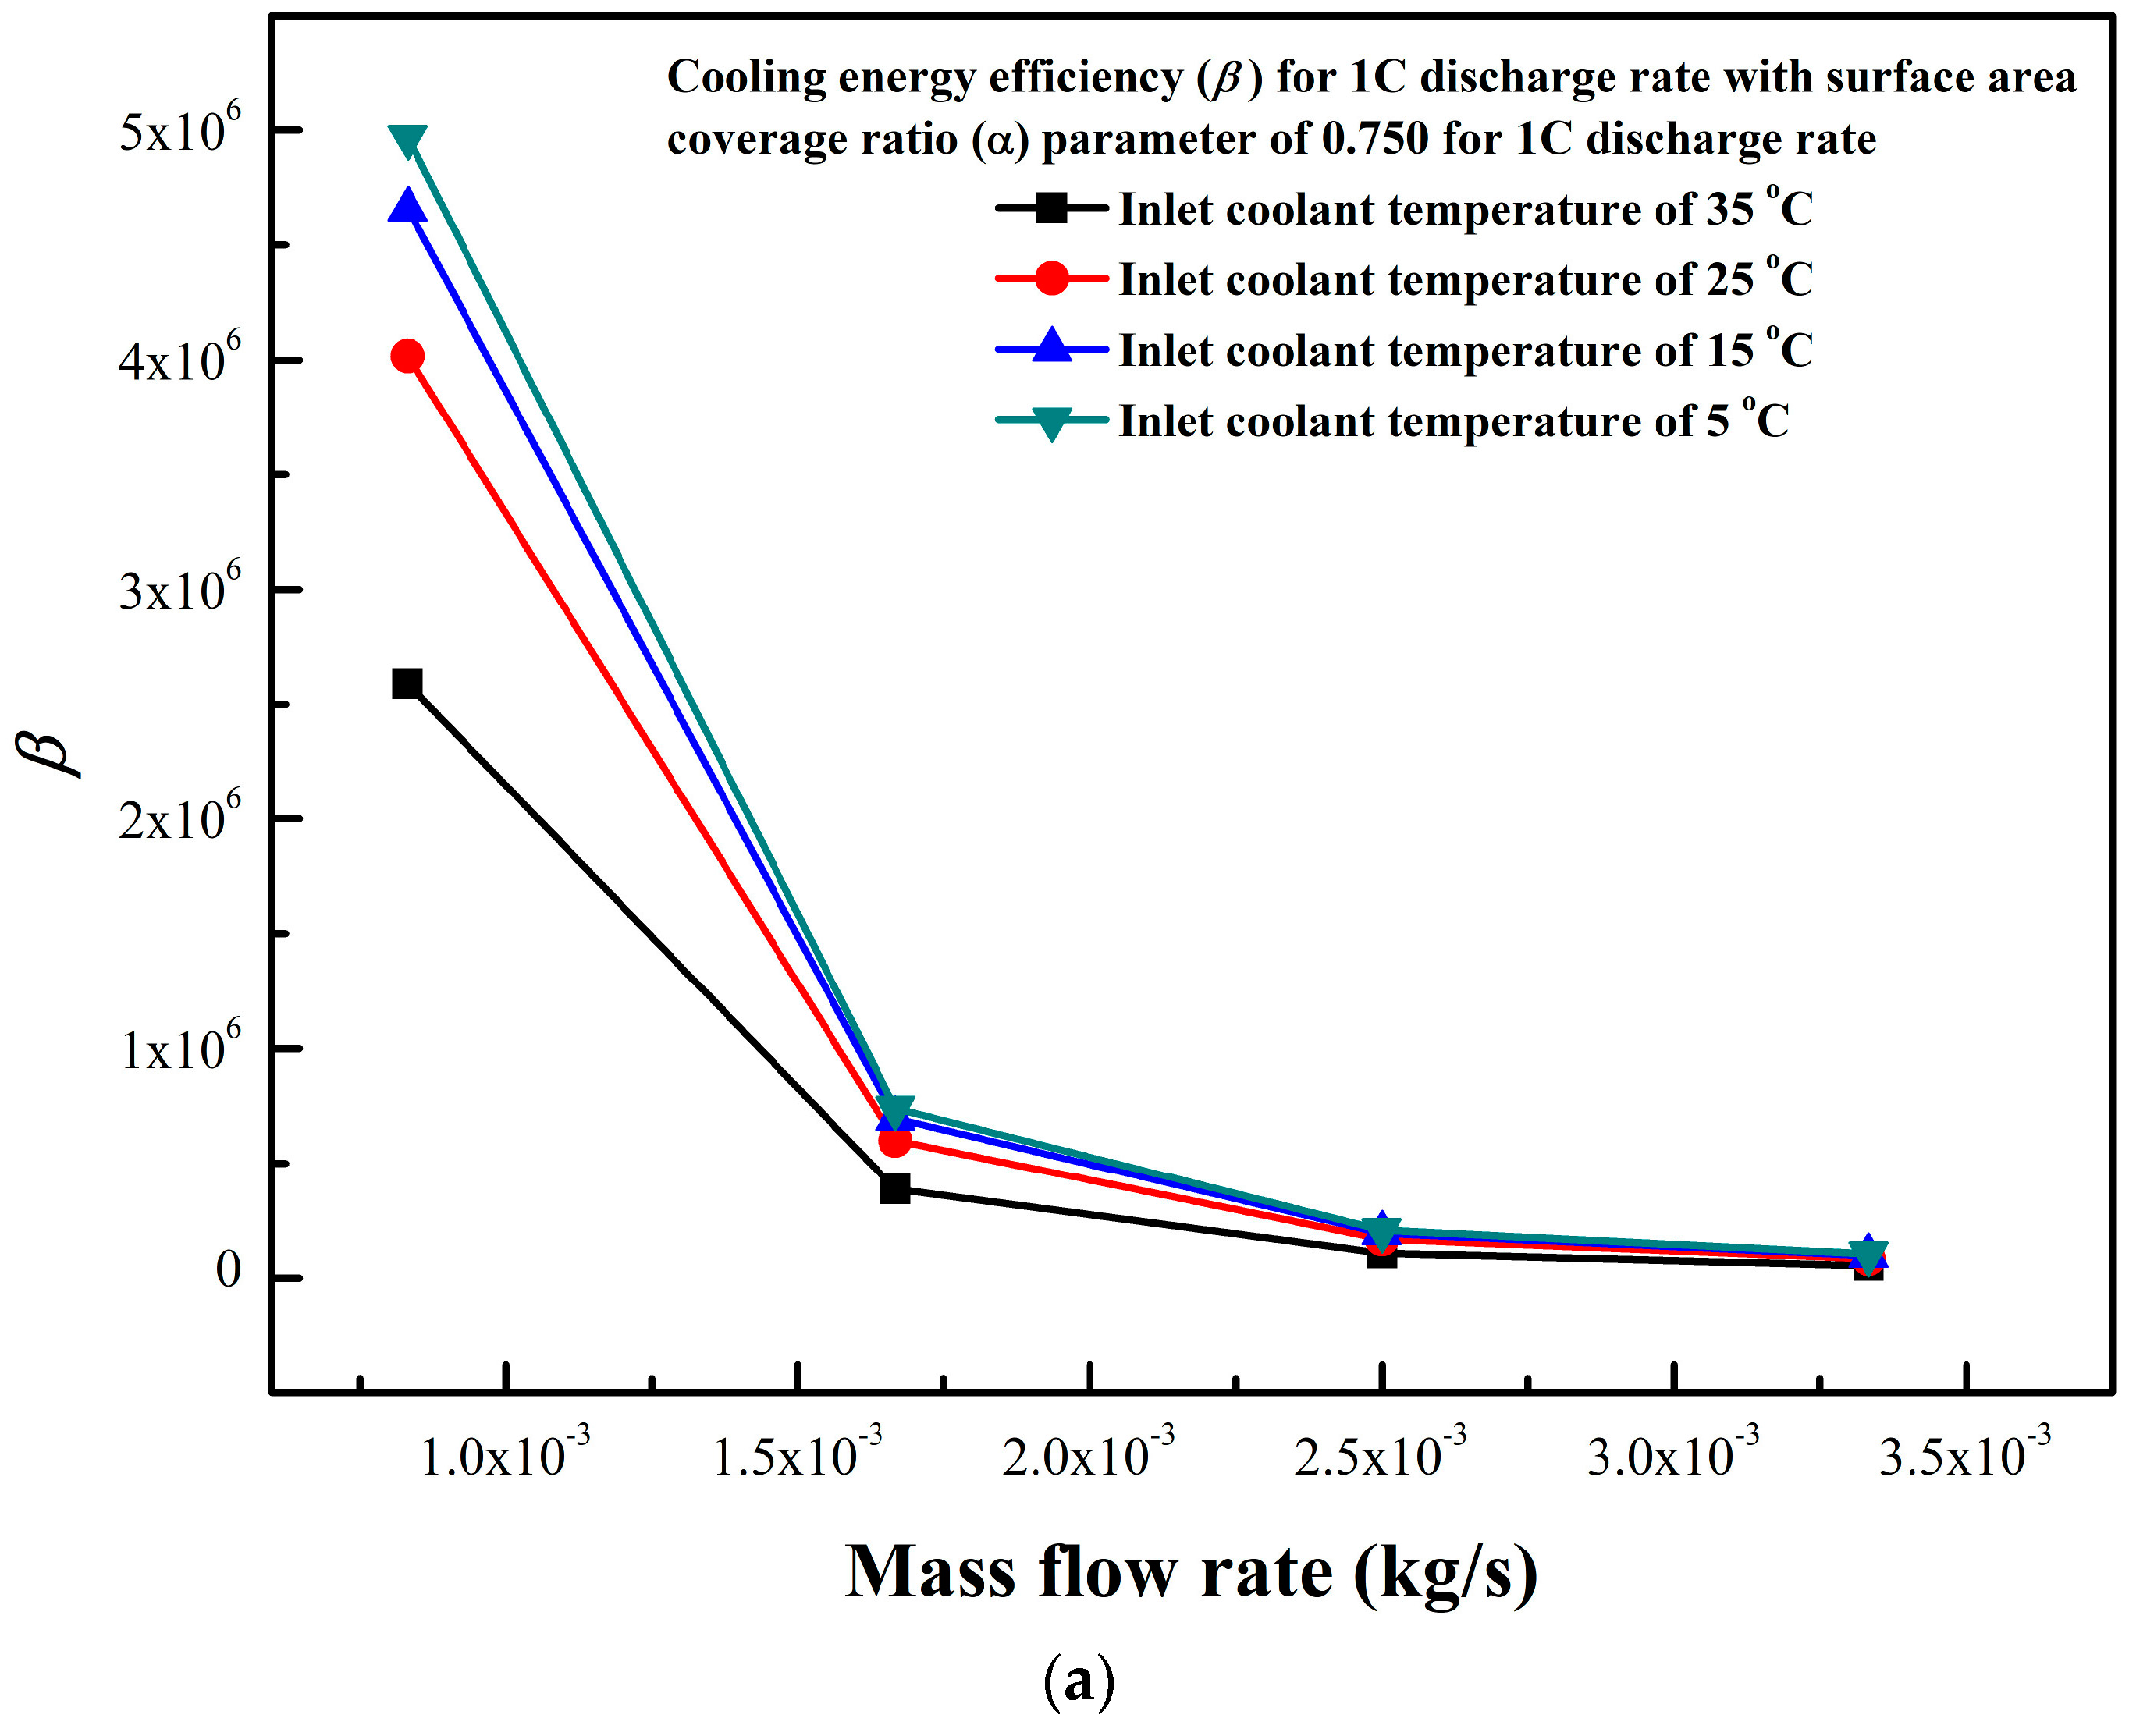
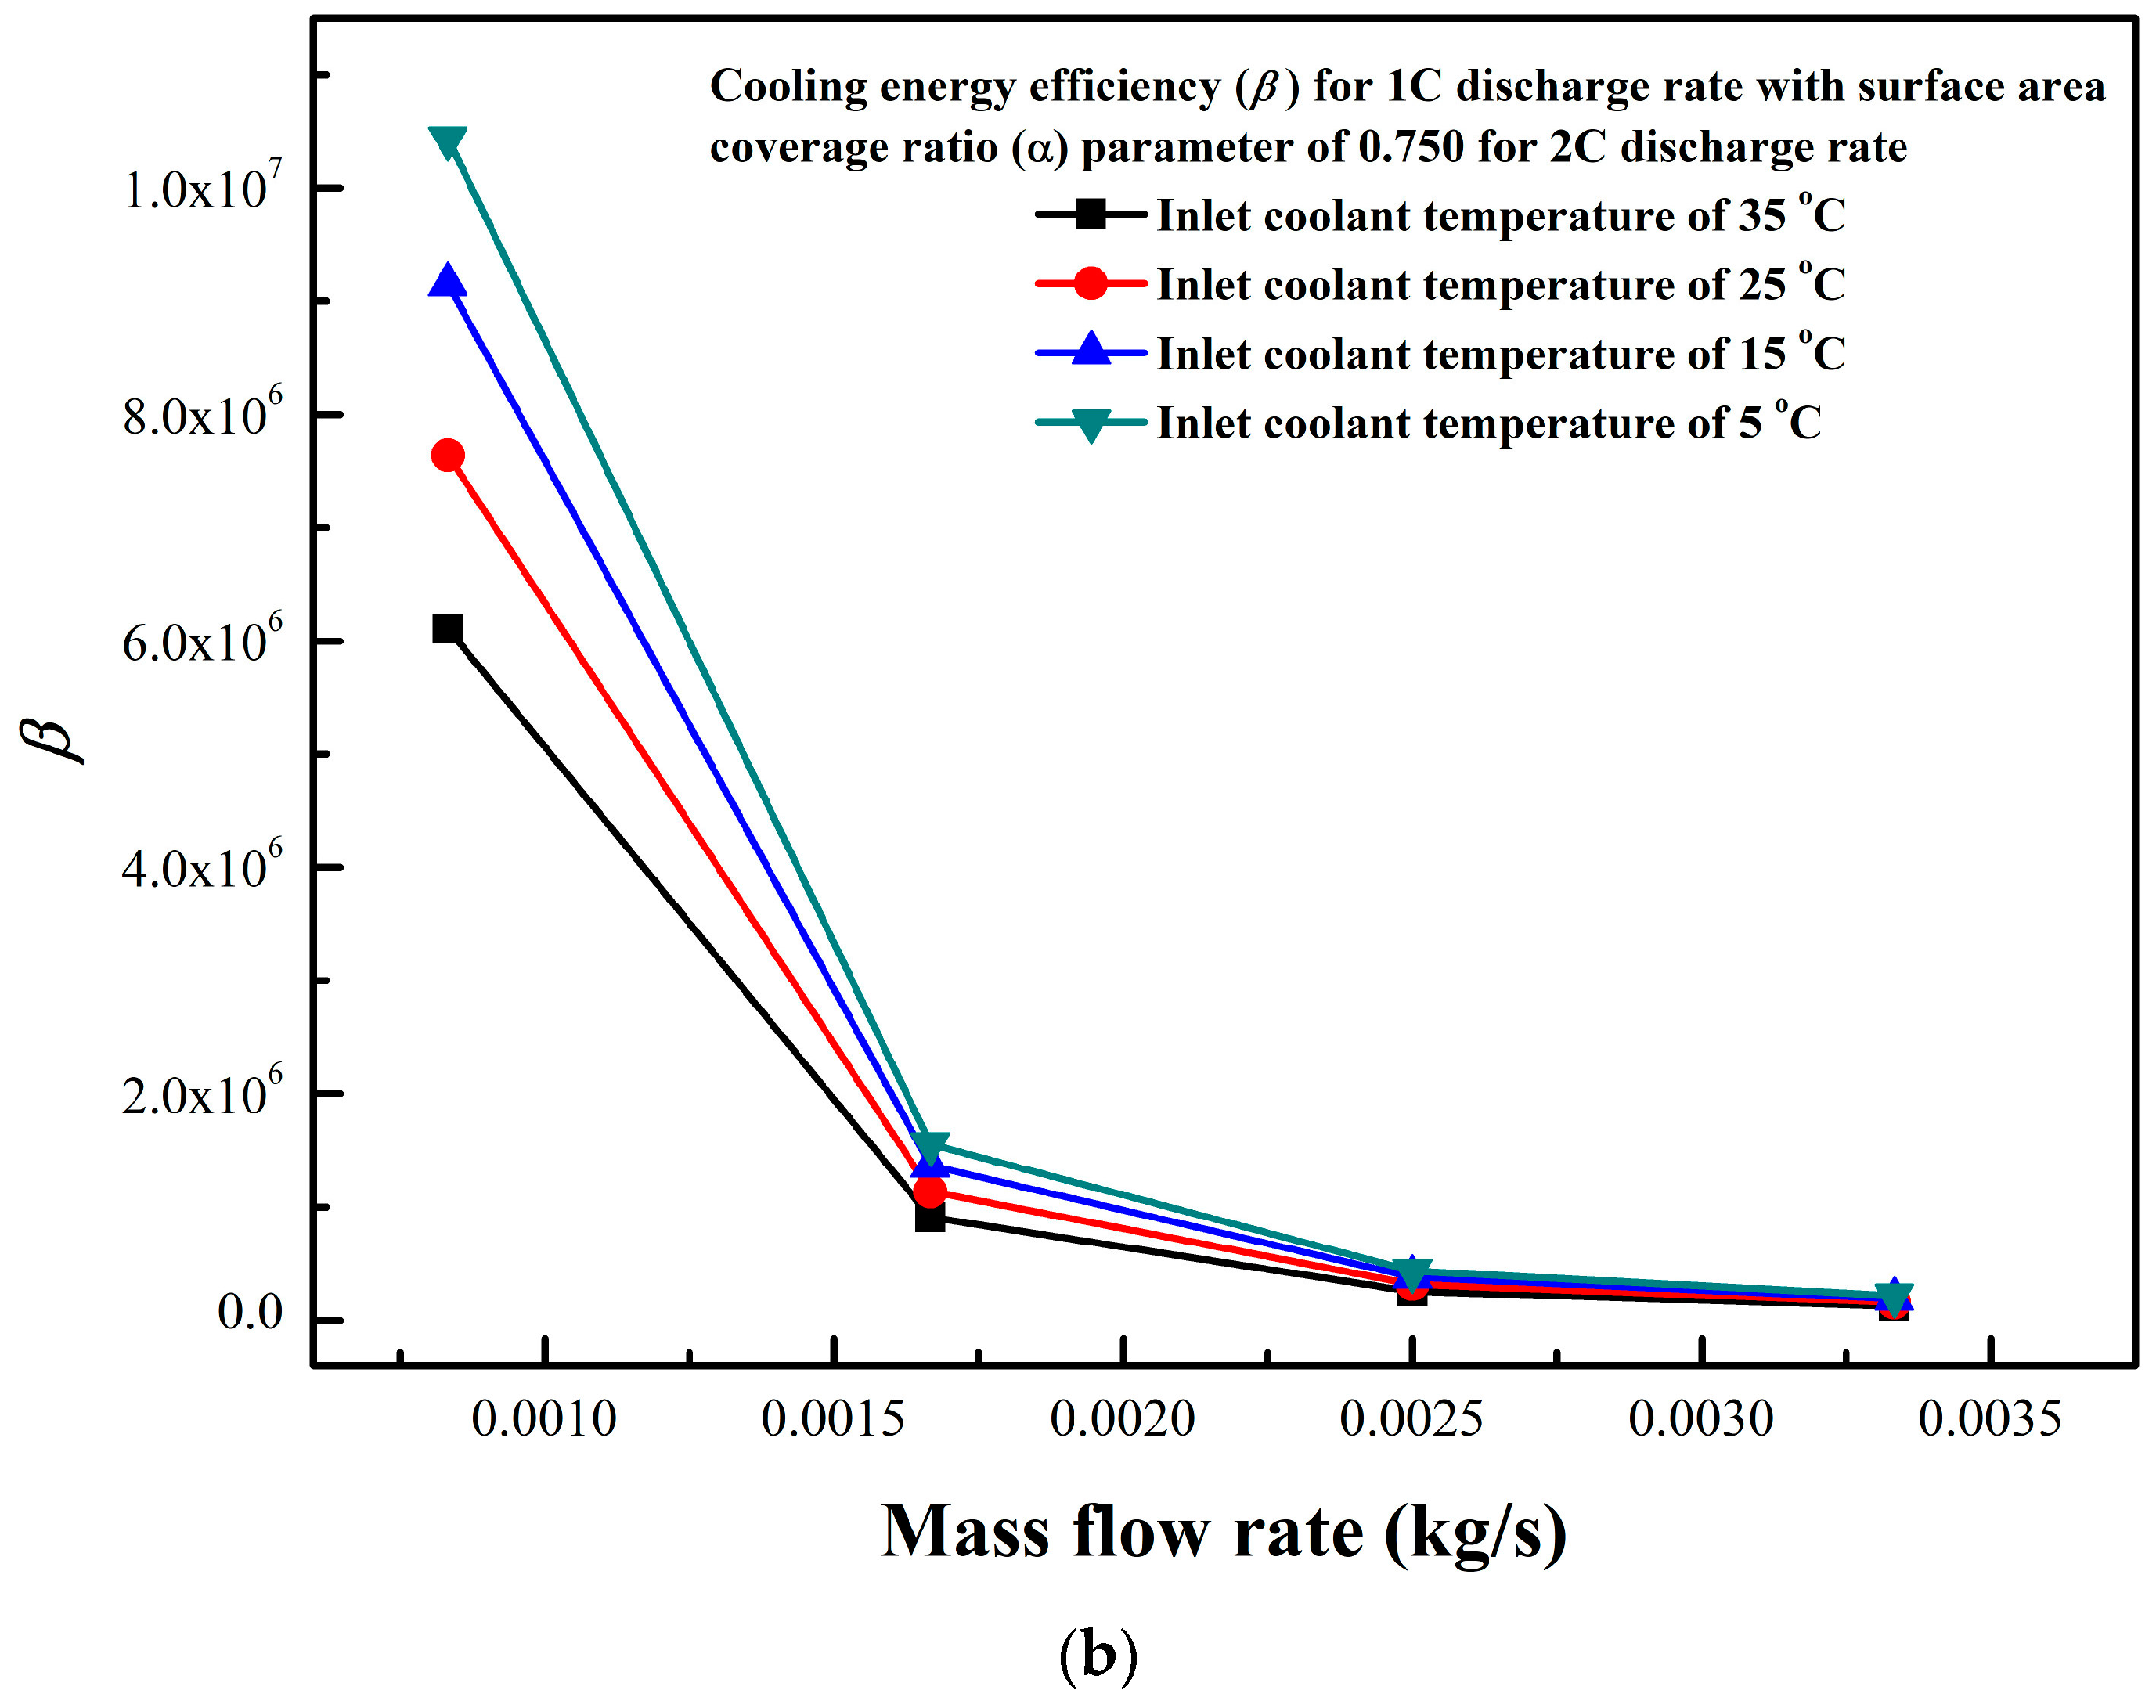
Figure 8 shows the cooling energy efficiency (
β) of the 20 Ah lithium-ion pouch cell with a surface area coverage ratio (α) parameter of 0.750.
Figure 8a,b show the cooling energy efficiency parameter (
β) of the 20 Ah lithium-ion pouch cell for 1C and 2C discharge rates, respectively. For both 1C and 2C discharge rates, the cooling energy efficiency parameter (
β) decreased with the increase of the inlet coolant mass flow rate varying from 0.000833 kg/s to 0.003333 kg/s for surface area coverage ratio (α) parameter of 0.750. For the low inlet coolant mass flow rate, the energy efficiency parameter significantly increased with the decrease of an inlet coolant temperature. However, for the high inlet coolant mass flow rate, the energy efficiency parameters are changed slightly with the increase of the inlet coolant temperature. This indicates that, for both 1C and 2C discharge rates, for the low inlet coolant mass flow rate, the lower inlet coolant temperature provides the better energy efficiency in the 20 Ah lithium-ion pouch cell with cold plates along both surfaces. As shown in the
Figure 8a,b, with inlet coolant mass flow rates varying from 0.001667 kg/s to 0.003333 kg/s, the reduction scale of the energy efficiency parameter is lower than those of the inlet coolant mass flow rates varying from 0.000833 kg/s to 0.001667 kg/s for the different inlet coolant temperatures. Comparing with
Figure 8a and
Figure 8b, the energy efficiency parameters are close for 1C discharge rate for the inlet coolant temperatures of 5 °C and 15 °C, respectively, for the inlet mass flow rate coolant varying from 0.000833 kg/s to 0.001667 kg/s.
As shown in the
Figure 8a, the lowest energy efficiency parameter (
β) is above 54,000 for the inlet coolant temperature of 35 °C and the inlet coolant mass flow rate of 0.003333 kg/s. This value is significant based on the definition of an energy efficiency parameter [
25]. Therefore, it can be concluded that for the inlet coolant temperature of 5 °C and the inlet coolant mass flow rate of 0.000833 kg/s, the 20 Ah lithium-ion pouch cell with cold plates on both sides shows excellent cooling effectiveness. This is because of more heat removal capacity of the lower inlet coolant temperature and the lower power consumption for supplying coolant at low mass flow rate.
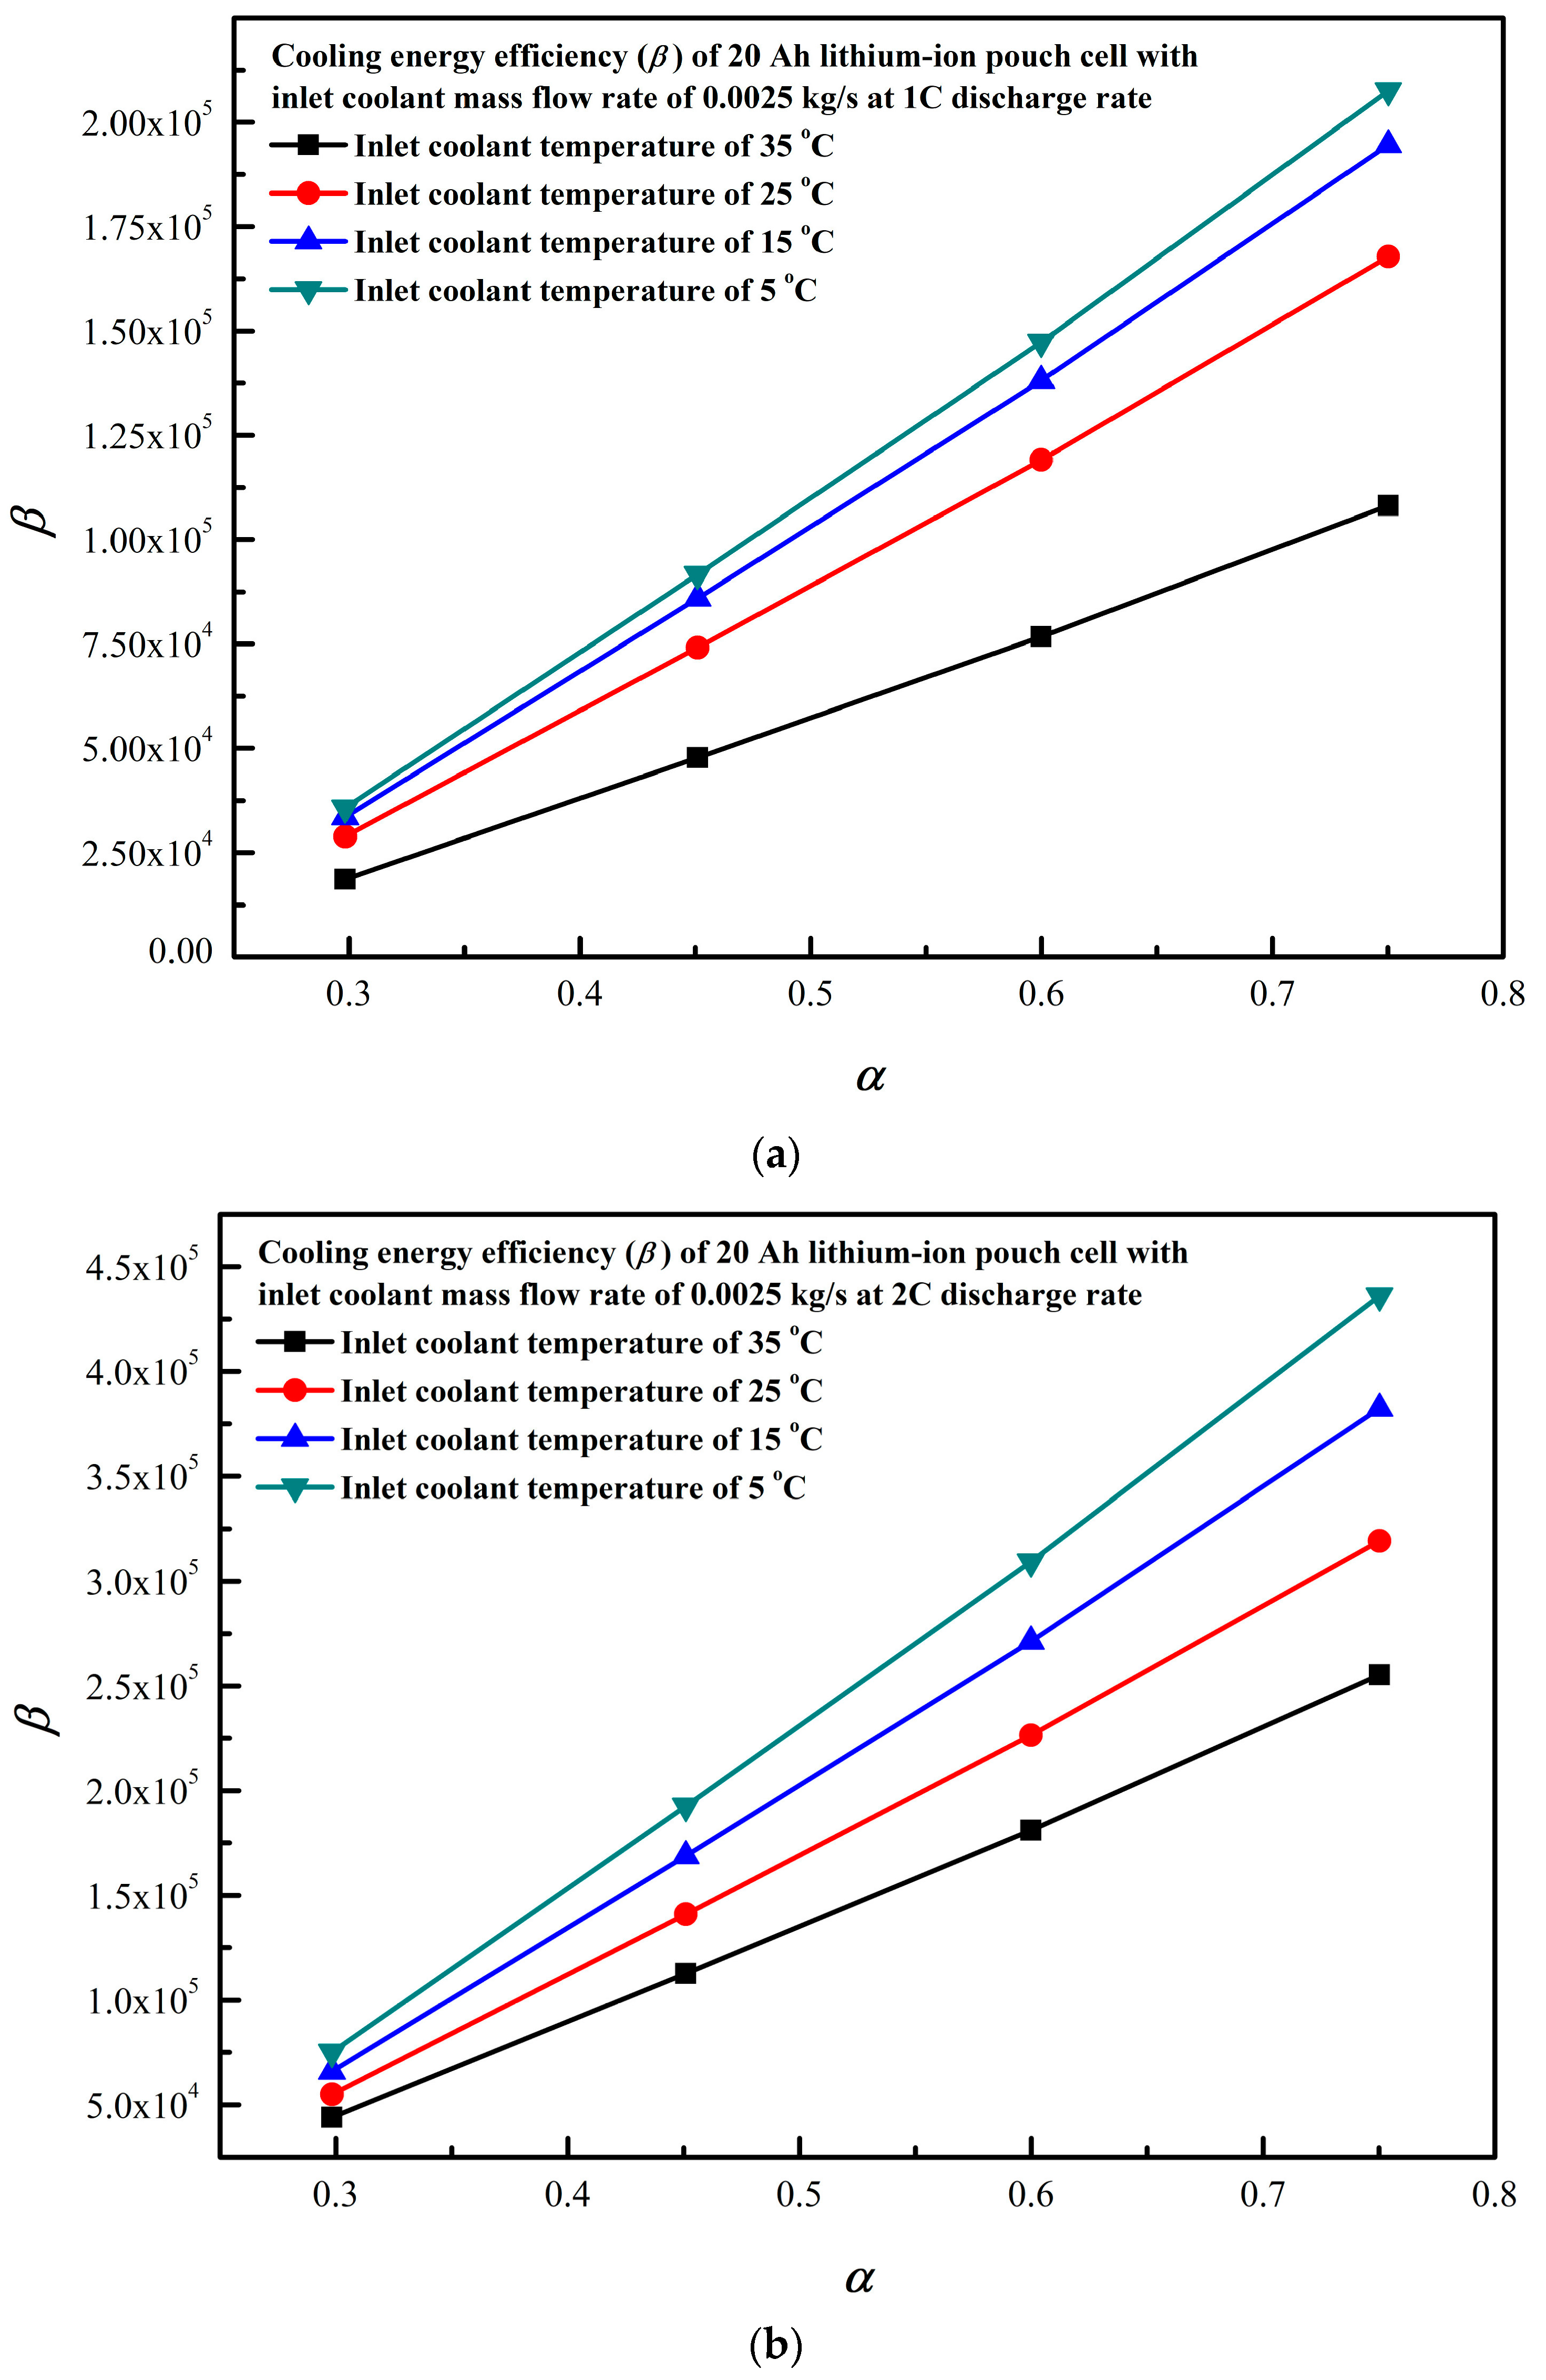
Figure 9 shows the cooling energy efficiency (
β) of the 20 Ah lithium-ion pouch cell with the inlet coolant mass flow rate of 0.025 kg/s.
Figure 9a,b show the cooling energy efficiency parameters (
β) of the 20 Ah lithium-ion pouch cell for 1C and 2C discharge rates, respectively. The cooling energy efficiency parameter (
β) increased with increase of the surface area coverage ratio (α) parameter from 0.298 to 0.750 for the inlet coolant mass flow rate of 0.002500 kg/s. For the higher surface area coverage ratio (α) parameter, the cooling energy efficiency parameter (
β) significantly increased with the decrease of an inlet coolant temperature. However, for the lower surface area coverage ratio (α) parameter, the cooling energy efficiency parameter (
β) is changed slightly with the decrease of an inlet coolant temperature. This indicates that for the low inlet coolant temperature, the higher surface area coverage ratio (α) parameter provided the better energy efficiency for the 20 Ah lithium-ion pouch cell with cold plates along both surfaces. As shown in
Figure 9a,b, with the surface area coverage ratio (α) parameter varying from 0.599 to 0.750, the enhancement scale of the energy efficiency parameter is higher than that of surface area coverage ratio (α) parameter varying from 0.298 to 0.599 for the different inlet coolant temperatures. Comparing with
Figure 9a and
Figure 9b, the cooling energy efficiency parameter (
β) is close for 1C discharge rate for the inlet coolant temperatures of 5 °C and 15 °C, respectively, for the surface area coverage ratio (α) parameter varying from 0.298 to 0.750. As shown in the
Figure 9a, the lowest cooling energy efficiency parameter (
β) is above 43900 for the surface area coverage ratio (α) parameter of 0.298 and the inlet coolant temperature of 35 °C. This value is significant based on the definition of an energy efficiency parameter [
25]. Therefore, it can be concluded that for the inlet coolant temperature of 5 °C and the surface area coverage ratio (α) parameter of 0.750, the 20 Ah lithium-ion pouch cell with cold plates on both sides shows an excellent cooling effectiveness because of heat removal capacity of the lower inlet coolant temperature and lower power consumption for supplying the coolant at high surface area coverage ratio (α) parameter.
In addition, the low inlet coolant temperature, the low inlet coolant mass flow rate, and high number of the cooling channels showed excellent cooling energy efficiency. The effects of the inlet coolant temperatures, the inlet coolant mass flow rates, and the surface area coverage ratio (α) parameter on three key parameters, namely, maximum temperature, temperature non-uniformity and cooling energy efficiency, are reported, and will be helpful to optimize the cooling strategy for lithium-ion pouch cell with cold plates on both surfaces.
3.5. Flow Visualization
Figure 10 shows the velocity distribution of the 20 Ah lithium-ion pouch cell cooling system for the different number of the channels. The uniform velocity distribution is observed throughout, except at curved flow paths with relatively higher velocity gradients. The velocity contours are obtained at the mid-plane of the cooling plate. For the channel number 4, a maximum velocity of 0.190 m/s is observed, while for the channel number 10, the maximum velocity of 0.077 m/s is observed. The general flow patterns are similar with the high velocity flow for lower number of the channels.
4. Conclusions
The cooling performance characteristics of a 20 Ah lithium-ion pouch cell with cold plates along both surfaces are studied numerically. The effects of variation of the inlet coolant mass flow rates (0.000833 kg/s, 0.001667 kg/s, 0.002500 kg/s, 0.003333 kg/s) and the inlet coolant temperatures (5 °C, 15 °C, 25 °C, 35 °C) for 1C and 2C discharge rates are reported. The temperature distribution, the pressure drop, and the cooling energy efficiency are considered as the critical performance parameters. In addition, the effects of the variation in the cold plate geometry with the number of the channels (4, 6, 8, 10) on the cooling performance characteristics of 20 Ah lithium-ion pouch cell are reported. The maximum temperature of 20 Ah lithium-ion pouch cell obtained at 2C discharge rate is 45.2 °C for the inlet coolant temperature of 35 °C and the inlet coolant mass flow rate of 0.000833 kg/s. The key results are provided below:
Considering the maximum temperature, for providing optimum operating temperature in the range of 25 °C to 40 °C for 20 Ah lithium-ion pouch cell for 1C and 2C discharge rate with cold plates along both surfaces, the inlet coolant temperatures of 15 °C and 25 °C are suggested.
Considering the difference between the maximum and the minimum temperature, for providing optimum operating difference between the maximum and the minimum temperatures below 5 °C for 20 Ah lithium-ion pouch cell for 1C and 2C discharge rate with cold plates along both surfaces, the inlet coolant mass flow rates of 0.002500 kg/s and 0.003333 kg/s are suggested.
The highest pressure drop of the coolant of 20 Ah lithium-ion pouch cell is 227.6 Pa for the mass flow rate of 0.001667 kg/s with 4 number of the channels.
Considering the cooling energy efficiency (β) of 20 Ah lithium-ion pouch cell with a surface area coverage ratio (α) parameter of 0.750, for the inlet coolant temperature of 5 °C and the inlet coolant mass flow rates of 0.000833 kg/s, the lithium-ion pouch cell with cold plates on both sides shows an excellent cooling effectiveness.
Considering the cooling energy efficiency (β) of 20 Ah lithium-ion pouch cell with the inlet coolant mass flow rate of 0.025 kg/s, an inlet coolant temperature of 5 °C and the surface area coverage ratio (α) parameter of 0.750, the lithium-ion pouch cell with cold plates on both sides shows an excellent cooling effectiveness.
The effects of inlet coolant temperature, inlet coolant mass flow rate, the surface area coverage ratio on three key parameters, namely, maximum temperature, temperature uniformity, and cooling energy efficiency of 20 Ah lithium-ion pouch cell with cold plates along both surfaces are reported, and will be useful for optimizing the cooling performances in the applications of the thermal management systems of the lithium-ion batteries for the electric vehicles.


