1. Introduction
In China, with the development of fully-mechanized mining equipment and the progress in surrounding rock control theories during high-intensity mining processes, fully-mechanized technologies for high mining heights are being widely used in underground mining, given their high resource recovery rates, high coal face yield, and ease of gas control [
1,
2,
3,
4,
5]. However, the increase in the thickness of extraction leads to violent strata behaviors, which results in serious reused roadway deformation, rib spalling, crushing triangle zones, and falling roofs. Affected by multiple mining activities, the stress states of the surrounding rocks are complex and the strata behaviors are more violent in the face ends. Additionally, rib spalling can easily cause roofs to fall, further exacerbating rib spalling. This vicious cycle not only affects the advance velocity of the coal face, but also poses a direct threat to the safety and security of production. Moreover, face ends are where mechanical equipment and production personnel operate. Therefore, coal and rock stability in the face ends is of great significance for the safe and efficient production of the coal face under high-intensity exploitation [
6,
7,
8,
9,
10].
During high-intensity mining, coal walls are more easily broken due to stress concentration and intense mining influences at both face ends, and rib spalling and roof accidents are more likely to occur [
11,
12]. During comprehensive mechanized coal mining, the basic supporting technologies for the fully-mechanized mining of a coal face have matured. However, development of the supporting technologies for face ends on both sides of the coal face has been relatively slow. The face end is located at the intersection of the strike of the coal face and the lateral abutment pressure. Failure of surrounding rock will occur during roadway excavation; this becomes increasingly serious during mining, greatly restricting production. Therefore, support for face ends is the key difficulty influencing roof maintenance [
13,
14,
15,
16]. To mitigate the high stress levels and large deformation in face ends, energy absorbing cables and anchor rods with constant resistance and large deformation tolerances are often used. For additional support, local grouting reinforcement combined with cable anchor supports has been used to strengthen coal walls in the field [
17,
18]. Grouting reinforcement can increase the strength of the coal and rock mass, form the bearing structure, and improve the force environment. Grouting can effectively prevent surrounding rock failure and enhance its self-supporting capacity. It has become a major technical measure used to ensure the reinforcement of the roadway and surrounding rocks [
19,
20,
21,
22,
23,
24]. Moreover, grouting reinforcement technology could be used to improve the strength and stability of coal masses in face ends, which is helpful to maintain the integrity of coal masses and, thus, manage the coal face roof. However, organic materials, such as polyurethane and sodium silicate, are expensive, inflammable, and poisonous; therefore, they are potentially risky and are not suitable as grouting materials [
25,
26,
27]. Common cement slurry has a long solidification time, low bonding strength, and serious leakage, which would not satisfy the grouting reinforcement requirements of a broken coal and rock mass, especially for the broken zones in face ends [
28,
29]. Novel inorganic grout materials are quick setting, high strength, sound permeable, safe, and environmentally friendly, and have good construction characteristics. Additionally, their cost is only one-third to one-fifth of polymer grouting materials. These new grouts could satisfy the requirements for material properties for coal and rock masses with different degrees of fragmentation in different projects [
30,
31].
At present, inorganic cement grouting reinforcement technology for the triangle zones of face ends under high-intensity mining has the following shortcomings. Firstly, there is insufficient understanding of the diffusion mechanism of grouting materials in broken surrounding rocks. The relationship between the setting time of the grouting materials and the engineering demand time of medium-depth hole grouting is unclear. Secondly, the lack of understanding about the scope of damage in the triangular zone under high-intensity mining will affect the range of grouting reinforcement and grouting time.
To address these problems and further improve inorganic cement grouting reinforcement technologies, this paper first analyzes the impacts of single addition or mixed addition of various accelerators with various ratios of water to material on the grouting material’s setting time and uniaxial compressive strength. Also, the consolidation strength characteristics of coals were studied under the influence of mixed addition of different types of accelerators and different types of organic grouting materials. Then, based on the specific geological conditions of the 1308 and 5303 coal faces in the Sihe coal mine, the range of the plastic zone, lateral abutment pressure, and advance abutment stress distribution laws in the face ends were elaborately analyzed under the impacts of repeated mining. Finally, reasonable grouting parameters and timing were determined.
2. Geological Situation of 1308 Coal Face
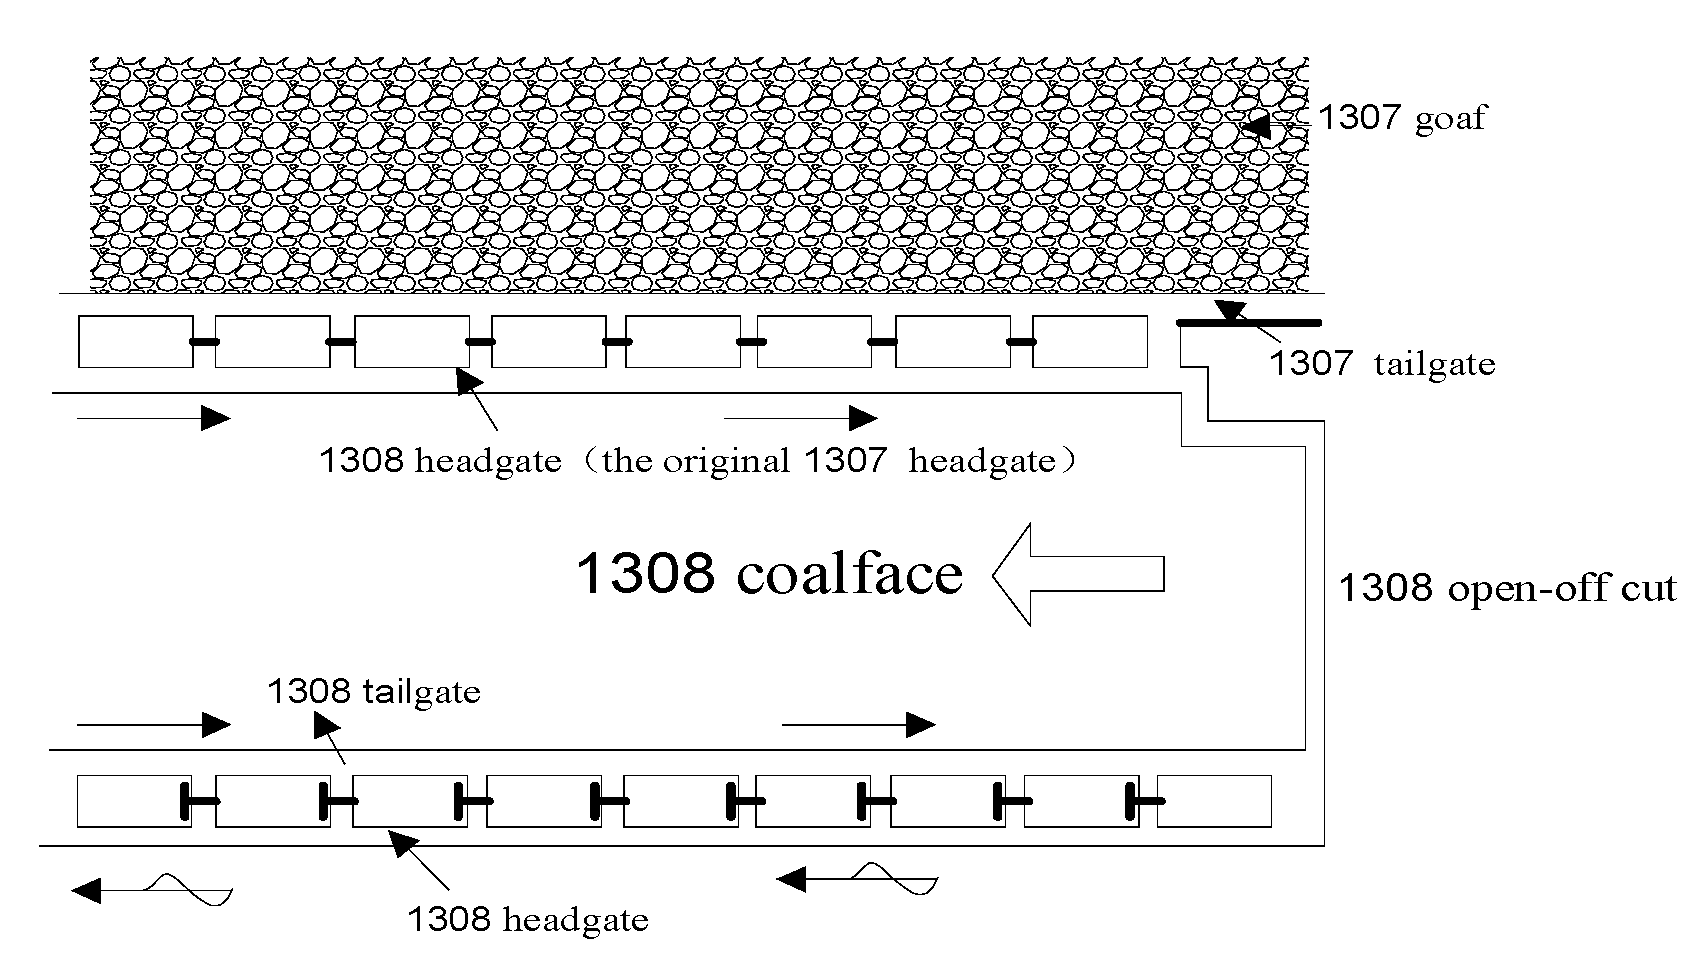
The Sihe coal mine of the Jincheng Coal Mining Group is the only 10-million-ton modern mine in China under high gas conditions. The #3 coal seam is currently being mined. The coal faces are all fully mechanized coal faces. The mining height was the first in China to reach 5.0 m, before a further breakthrough at 6.2 m was made. Advancement can reach 15 m per day, with a maximum length of the coal face of 300 m. The large mining height face often uses a multi-roadway layout, where the gateway of the coal face is the retained roadway used during the mining of the previous coal face.
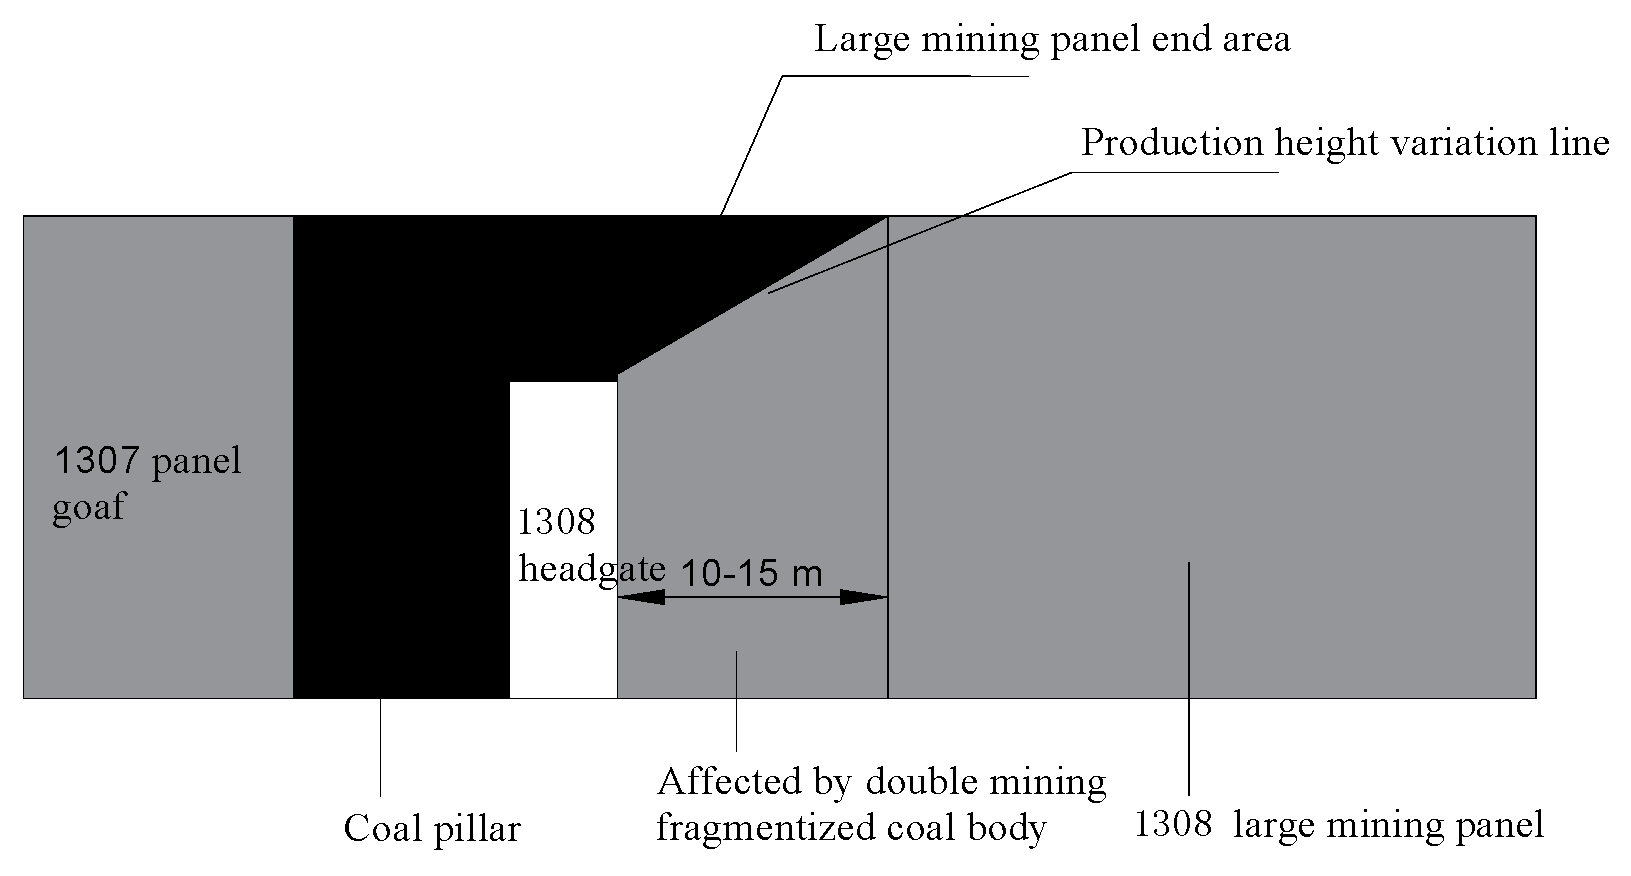
Figure 1 shows the roadway layout of the 1308 large mining height coal face. The average mining height is 6.2 m. The 1308 roadway was established in adjacent coal faces with a height of 3.8 m. Combined anchor-net-cable support was adopted. Moreover, grouting of coal seams was used to increase the strength of the broken surrounding rocks. The face end had a coal roof. The mining height of the coal face was about 6.0 m, and the height of the gateway was only 3.8 m. The transition range of the mining height was between 10 m and 15 m.
Figure 2 depicts a schematic of a large mining height face end. At large mining heights, high advancing velocity, large mining intensity, and double the mining activities in face ends cause intense strata behaviors and serious damage in face ends, which prevent safe and efficient mining.
3. Grouting Material Proportioning Experiment
To better understand the relationship between the setting time of grouting materials and the engineering demands for medium-depth hole grouting, we needed to determine the diffusion mechanism of grouting materials in broken surrounding rocks with an arrangement of medium-depth drilling holes, and obtain accelerator combinations with proper ratios of water to material. The experiment was carried out to study the effect of three types of single addition and mixed addition accelerators with various water-to-material ratios on setting time and compressive strength. The preferred types of accelerators with proper ratios of water to material were chosen and their mixing amounts were determined. According to the experimental design material ratios, the materials were prepared and placed into the molds of standard specimens. Then, they were placed into the moisture curing box. The time when all materials were mixed with water was defined as the starting point of the setting time. Standard-consistency cement was placed into a Vicat apparatus to measure the time for a Vicat needle to sink to a certain depth into the cement paste; this time was taken as the initial and final setting time of the slurry. The grouting materials, additives, and water were weighed using an electronic balance. Then, they were stirred evenly in a NJ160 Agitator (Cangzhou Shuangxing Instrument Equipment Co., Ltd., Cangzhou, China) and put into the molds for standard specimens. After curing in the SHBY-40B Curing Box (Hangzhou Tongqi Instrument Co., Ltd., Hangzhou, China), they were put into a SANS Exceed 40 Test System (MTS Industrial Systems (China) Co., Ltd., Shenzhen, China) for uniaxial loading until failure occurred, and the compressive strength was measured.
3.1. Effect of Single Addition Accelerators on Setting Time.
The components of material A included 100 parts sulphoaluminate clinkers, 1 part water reducer, 0.6 parts thickener, 0.6 parts retarder, and 100 parts water. The components of material B included 80 parts gypsum, 20 parts lime, 1.5 parts water reducer, 0.2 parts thickener, 1 part retarder, and 100 parts water. On this basis, different types and mixing amounts of accelerators were added to material B. After even mixing, their setting time and compressive strength were tested. The individual components of materials A and B were calculated by weight.
3.1.1. Impacts of the Single Addition of an Accelerator on the Setting Time
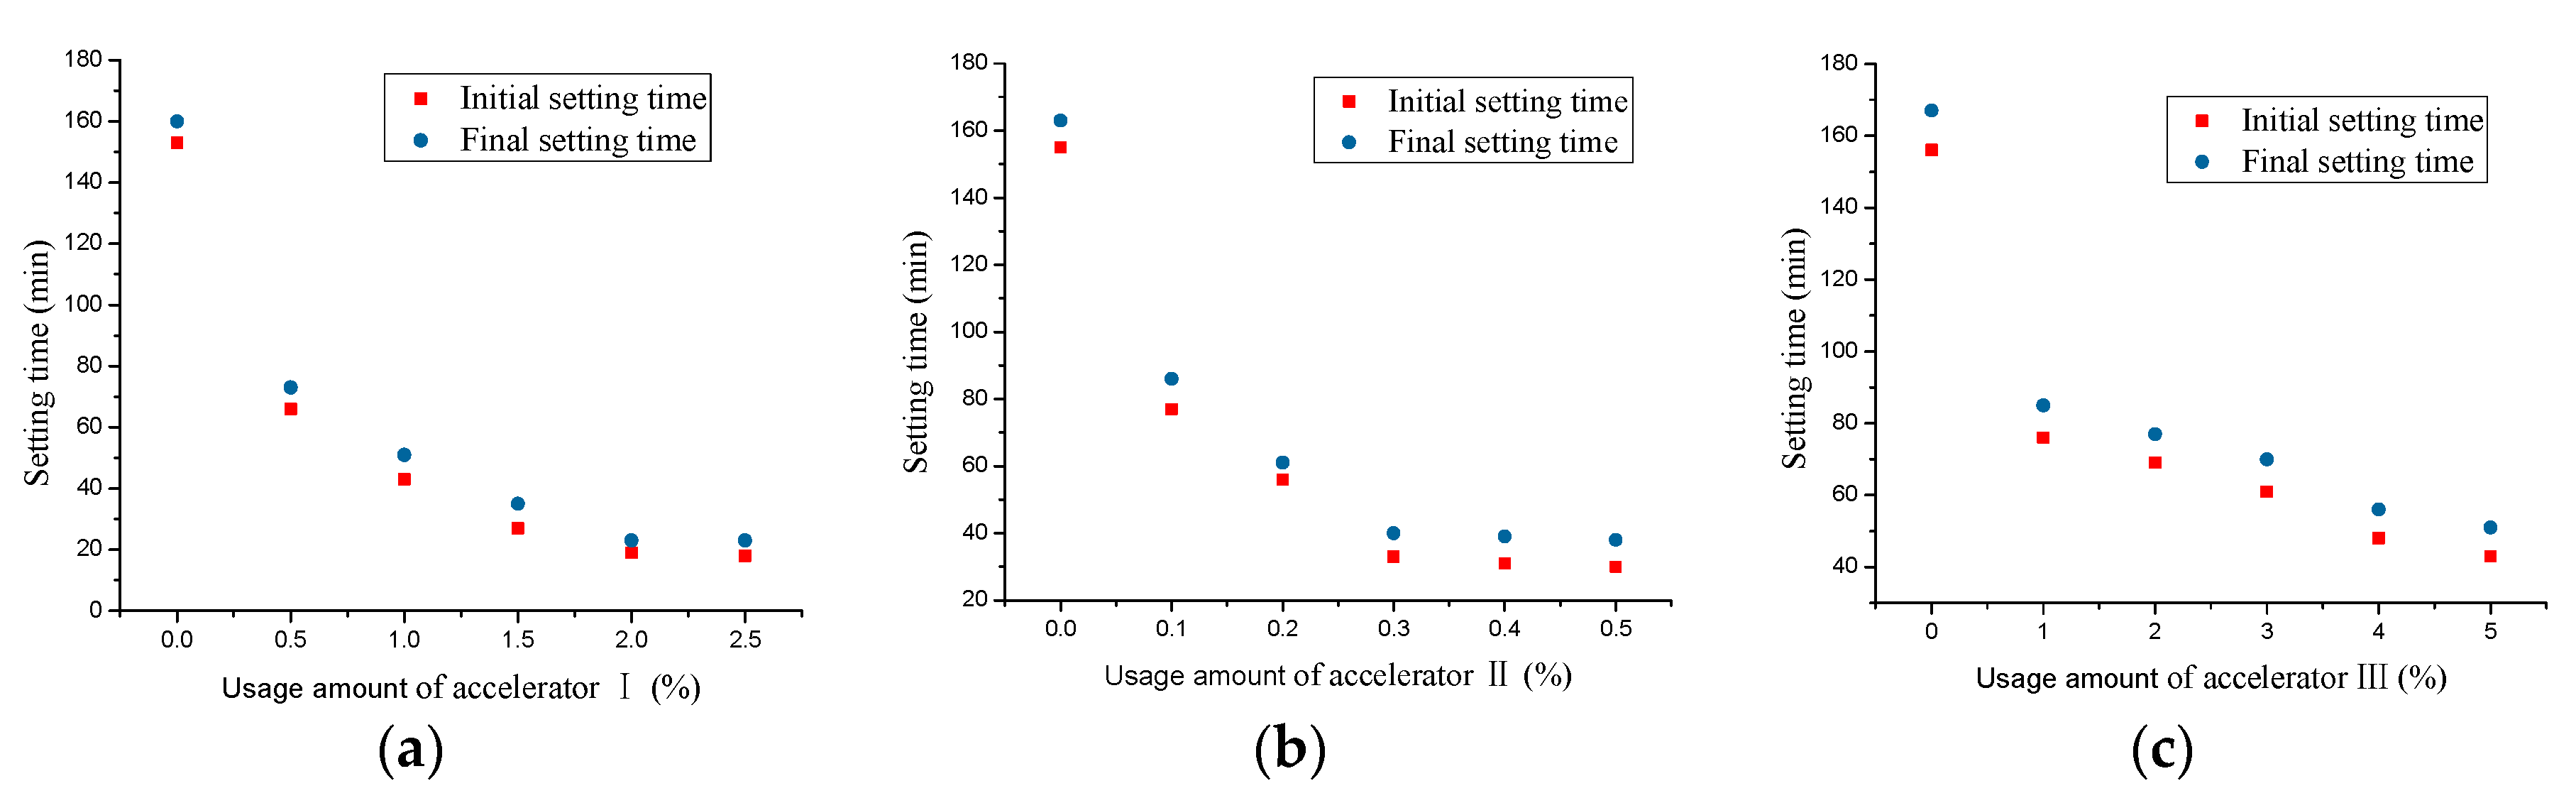
The impacts of the single addition of various accelerators on the setting time of the mixture are shown in
Figure 3. The results indicate that with increasing single addition of an accelerator, the setting time of the mixture gradually decreased. When the amount increased to a fixed value, the initial and final setting time of the mixture no longer shortened. The fixed value was defined as the threshold value of the mixture’s initial–final setting time. The initial–final setting time threshold values of the mixtures with accelerators I, II, and III were 2.0%, 0.3%, and 4.0%, respectively. The initial setting time was 19 min, 33 min, and 49 min, and the final setting time was 23 min, 40 min, and 56 min, respectively.
Through analyzing the impacts of the single addition of various accelerators on setting time of the mixture, we determined that the maximum mixing amounts of accelerators I, II, and II were 2.0%, 0.3%, and 4.0% of material B, respectively. Accelerator III had the largest initial–final setting time, followed by accelerators II and I.
3.1.2. Impacts of Mixed Addition of Accelerators on Setting Time
To quicken the setting time of the mixture, experimental mixes of accelerators were used. The optimum mixing amount of 2% accelerator I was added into accelerators II and III. The setting time of the mixtures was tested (
Figure 4).
The experimental results (
Figure 4) show that when the accelerator II with different ratios was added to accelerator I with a fixed amount of 2%, the initial and final setting time shortened. When the amount of accelerator II increased to 0.3%, the initial setting time decreased to 10 min and no longer shortened with continuous increases in accelerator II. Similarly, when accelerator III with various ratios was added to accelerator I at the fixed amount of 2%, the initial and final setting time decreased with increasing accelerator III. When the mixing amount of accelerator III increased to 3.0%, the initial setting time was shortened to 7 min and no longer shortened with continuous increases in accelerator III. When accelerator III with different ratios was added to the fixed 0.2% amount of accelerator II, the initial and final setting time also decreased as the amount of accelerator III increased. When accelerator III increased to 4.0%, the initial setting time was reduced to 12 min and no longer decreased with continuous increases in the amount.
In terms of the setting time, the mixes of 2% accelerator I and 0.3% accelerator II, 2.0% accelerator I and 3.0% accelerator III, and 0.2% accelerator II and 4.0% accelerator III achieved better results.
3.2. Effects of Different Water-to-Material Ratios on the Setting Time
With mass proportions of fixed sulphoaluminate cement clinker, gypsum, lime, and water reducer of 50%, 40%, 10%, and 1%, respectively, the slurry’s initial and final setting times were tested as the water consumption changed.
Figure 5 shows the test results.
It can be seen that as the water-to-material ratio increased, the initial and final setting time gradually increased. When the ratio was 0.8:1, the initial setting time was two minutes and the final setting time was eight minutes. When the ratio increased to 2.0:1, the initial and final setting times were 10 min and 20 min, respectively. The smaller the ratio of water to material, the quicker the setting time; the larger the ratio, the longer the setting time. However, a too-small ratio of water to material causes large liquid viscosity, poor fluidity, short storage time, and high pump pressure. Therefore, only water-to-material ratios over 1.0:1 are feasible.
3.3. Effect of Accelerators on the UCS
In this section, the single addition of accelerators and mixes of accelerators were added to material A and material B. The impacts of accelerators on the compressive strength of the mixture of materials A and B were tested and analyzed to further determine the preferred types and mixing amounts of accelerators. The components of material A included 100 parts sulphoaluminate clinker, 1.0 part water reducer, 0.6 parts thickener, 0.6 parts retarder, and 100 parts water consumption. The components of material B included 87.5 parts gypsum, 12.5 parts lime, 1.5 parts water reducer, 0.2 parts thickener, 1.0 part retarder, and 100 parts water consumption. On this basis, the different type accelerators with different mixing amounts were added to material B. After even mixing, the compressive strength of the mixture was tested.
3.3.1. Impacts of a Single Addition of an Accelerator on Compressive Strength
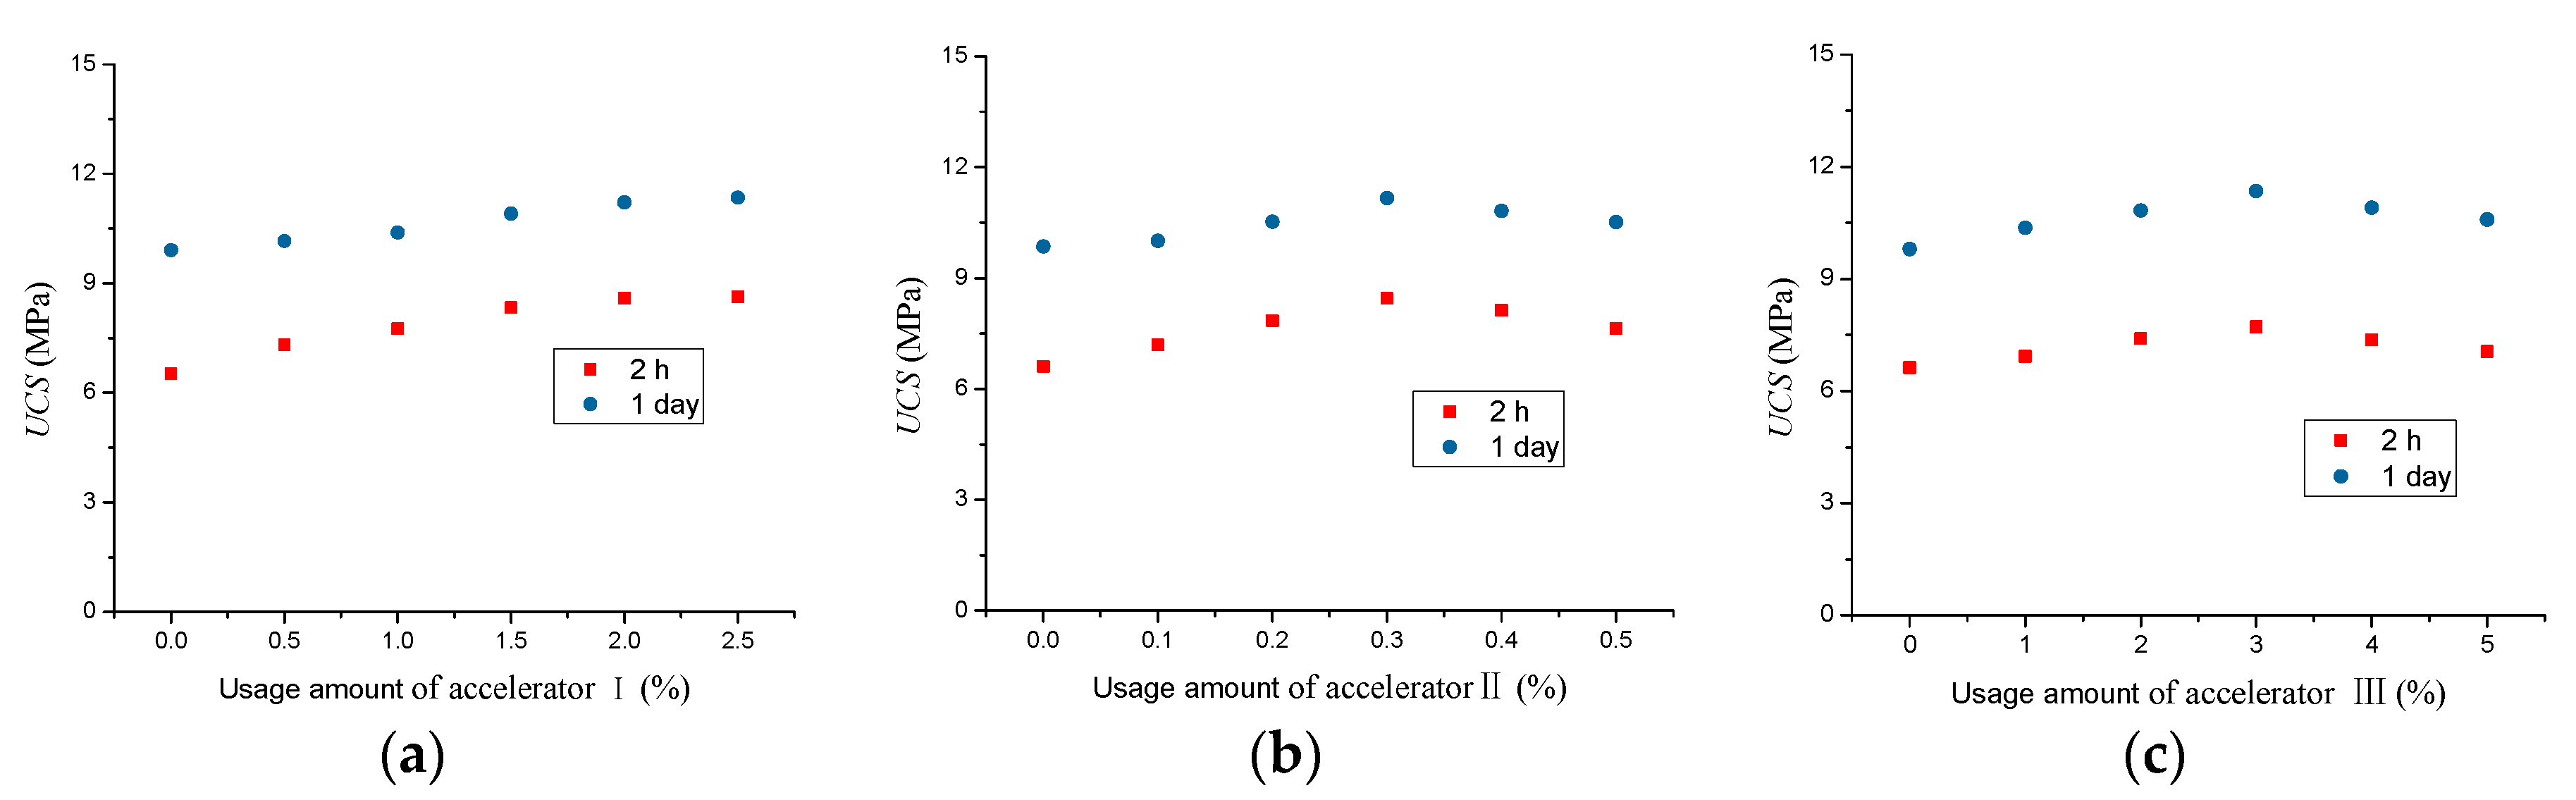
The impacts of a single addition of different types of accelerators on the compressive strength are shown in
Figure 6. As the mixing amount of accelerator I increased, the compressive strength gradually increased after 2 h of hardening of the mixture. When the amount increased to 2.0%, the increase in amplitude of the compressive strength was 45.5%. There was a large increase in early strength, and the 24 h compressive strength also had a similar trend. With the increase in the single addition of accelerators II and III, there was a large increase in early strength. With continuous increases, the compressive strength showed a decreasing trend. When the single addition of accelerators II and III increased to 0.3% and 4%, respectively, the increases in compressive strength were 39.9% and 23.8%, respectively. The 24-h compressive strength also followed the same patterns.
By studying the impacts of the single addition of different types of accelerators on the compressive strength of the mixture, we determined that the optimum single mixing amounts of accelerators I, II, and III were 2.0%, 0.3%, and 4.0% of material B, respectively.
3.3.2. The Impacts of the Mixes of Accelerators on the Compressive Strength
To further increase the early compressive strength of the mixture, a double mixing experiment was carried out. In this experiment, 2% of accelerator I was mixed with accelerators II and III, respectively. The impacts of double mixing on the compressive strength of the mixture were tested (
Figure 7).
The experimental results (
Figure 7) show that when the mixing amount of accelerator I was fixed at 2%, the compressive strength of the hardened grouting material first increased and then decreased as the mixing amount of accelerator II increased. When the mixing amount of accelerator II was 0.2%, the maximum compressive strength was observed, which was improved by 34.4% compared to the single addition of accelerator I. When the mixing amount of accelerator I was 2%, the compressive strength first increased and then decreased as the mixing amount of accelerator III increased. The maximum UCS occurred when the mixing amount of accelerator III reached 3.0%, which was an improvement of 29.7% compared to the single mixing of accelerator I. When the mixing amount of the fixed accelerator II was 0.2%, the compressive strength first increased and then decreased with increasing accelerator III. The compressive strength reached a maximum when the mixing amount of accelerator III was 3.0%, which was improved by 19.4% over the single addition of accelerator II.
In terms of the compressive strength, the combinations of 2.0% accelerator I and 3.0% accelerator III, 2% accelerator I and 0.2% accelerator II, and 0.2% accelerator II and 3.0% accelerator III achieved better effects.
3.4. Effect of Water-to-Material Ratios on the UCS
The mass proportions of fixed sulphoaluminate cement clinker, gypsum, lime, and naphthalene water reducer were 100%, 80%, 20%, and 1%, respectively. The compressive strength after one day and three days’ hardening of the grouting body was tested as the water consumption changed. The results are shown in
Figure 8.
The test results indicate that as the water-to-material ratio increased, the compressive strength after one and three days gradually decreased. To ensure better grouting effects, greater compressive strength, which results from smaller water-to-material ratios, is better.
To better compare the effects of single addition and mixed addition of various accelerators on grouting material performance, the increased range of the setting time and the compressive strength of the grouting materials were summarized. With a single addition of an accelerator, the increased range of the 2-h compressive strength was taken as the main index along with the influences of double mixing on the setting time. With a mixed addition of accelerators, the increased range of the 8-h compressive strength was taken as the main index along with the influences on setting time. The results are shown in
Table 1.
It can be seen that accelerator I had the best effects on the setting time of the mixture, followed by accelerator II and accelerator III. The increased range of the early compressive strength was the largest with accelerator I, followed by accelerator II and accelerator III. The rank of the impacts on the setting time and the rank of the impacts on compressive strength were summarized. Accelerator I ranked the first, followed by accelerator II, then accelerator III.
Table 2 shows that the combination of 2% accelerator I and 3.0% accelerator III had the best setting time, followed by the combination of 2% accelerator I and 0.3% accelerator II, and the combination of 2% accelerator II and 3.0–4.0% accelerator III. The increased range of the compressive strength was the largest with the combination of 2% accelerator I and 3.0% accelerator II, followed by the combination of 2% accelerator I and 3.0–6.0% accelerator III, and the combination of 0.2% accelerator II and 3.0–4.0% accelerator III. The ranks of the impacts on the setting time and the ranks of the impacts on the compressive strength were evaluated. The results show that with the mixed addition of accelerators, the preferred combinations of accelerators were 2% accelerator I and 0.3% accelerator II, and 2% accelerator I and 3.0% accelerator VI.
The experimental results show that the larger the ratio of water to material, the longer the setting time of the slurry and the smaller the mine pressure. The smaller the ratio of water to material, the quicker the setting and the larger the compressive strength. However, too small a ratio of water to material would cause too large a liquid viscosity, poor fluidity, short storage time, and large pumping pressure. Based on an overall consideration, the water-to-material ratios over 1.0:1 in this experiment were feasible. To ensure better grouting effects, larger compressive strength was better, so the ratio of water to material was 1.0:1 in this experiment.
3.5. Strength of Consolidated Coal
Based on the original double liquid grouting materials and previous experimental studies, the improved mix proportions of double liquid grouting materials and the admixture impacts on their properties were obtained. For this situation, the components of material A included 100 parts of sulphoaluminate clinker, 1.0 part water reducer, 0.6 parts thickener, 0.6 parts retarder, and 100 parts water consumption. The components of material B included 87.5 parts gypsum, 87.5 parts lime, 1.5 parts water reducer, 0.2 parts thickener, 1.0 part retarder, and 100 parts water consumption. On this basis, the accelerators were added and mixed evenly. Then, the mixture’s compressive strength and coal’s consolidation strength were tested, as shown in
Table 3.
Table 3 shows that the specimens’ compressive strength could reach over 9 MPa after 2 h of adding the accelerator. In particular, it reached 10.8 MPa in 2 h and 20 MPa in 28 days with the combinations of 2% accelerator I, 0.3% accelerator II, and 3.0% accelerator III. The results of the compressive strength of the consolidated coal particles in 4 h indicated that the compressive strengths of the consolidated coal with added accelerator were all more than 5 MPa larger than of organic grouting materials. Taking these three types of evenly mixing accelerators as an example, the strength of the consolidated coal was 119.3% higher than that of the organic materials.
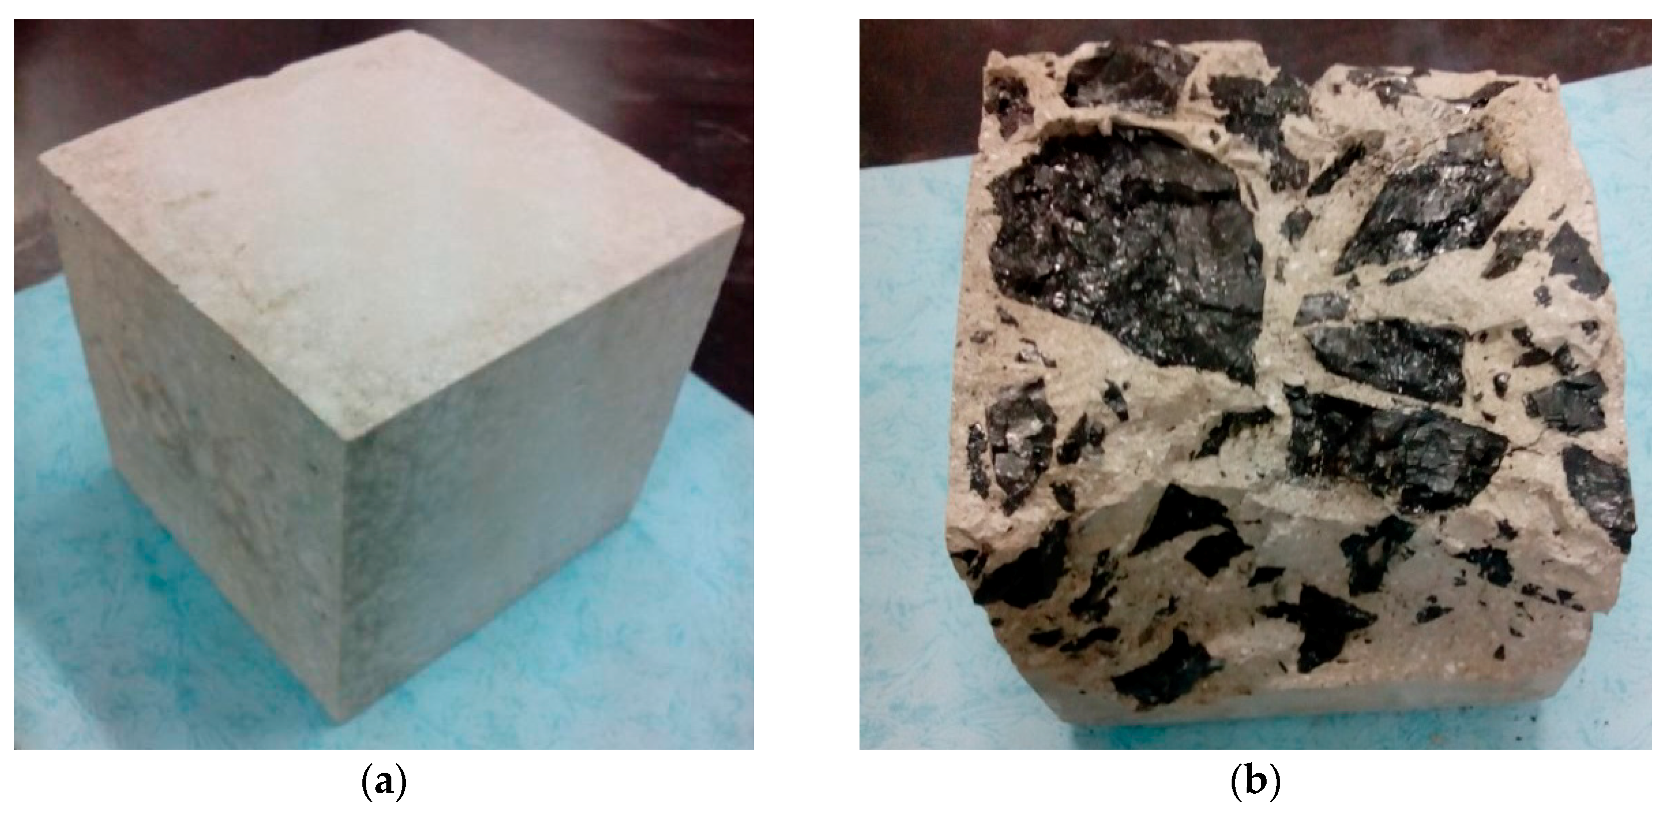
The combination of coal and slurry after compression (
Figure 9) showed that although the joint surface of the coal and slurry had the weakest structure and experienced damage first, the structure was still relatively complete due to the tightly-bonded coal and slurry.
4. Modelling Using FLAC3D
Many scholars have used FLAC3D software to study the complex mechanical behaviors involved in the advancing of the coal face, including the surrounding rock moving laws at the stope, rock mass mechanical properties, surrounding rock stress variations and so on. Remarkable results have been obtained, accounting for the shortcomings of field measurement and improving the theoretical analysis. Application practice proved that FLAC3D (version 5.0, Itasca, Consulting Group, Inc., Minneapoils, MN, USA) software is one of the most effective available numerical simulation applications in the mining engineering field [
32,
33].
4.1. Built-up Numerical Calculation Model
According to the actual geological conditions, the FLAC3D model was established based on coal seams. It was optimized according to the strata comprehensive histogram of the coal face. Finally, six layers of rock on top were selected for a total depth of 32 m. The coal seam thickness was 6.2 m. Two layers of rock on the bottom were selected for a total depth of 11 m. The schematic diagram of the calculation model is shown in
Figure 10. The displacement constraints were used for the lower boundary and two side boundaries of the model. The upper boundary was under stress boundary conditions. The stress value was the dead weight of the overlying strata. The buried depth was 388 m. The overburden load was about 9.66 MPa. The model used the Mohr-Coulomb yield criterion and large deformation modes for solutions.
Table 4 shows the physical and mechanical parameters of the coal face coal seams and overlying strata as well as the interface of the coal seam and rock strata.
4.2. Failure of the Triangular Zones after Repeated Mining Activities
4.2.1. Side Abutment Pressure Distribution after First Mining
The lateral abutment pressure is the redistributed stress on both sides of the coal face during the mining process. It concentrates and increases in a certain range and then reduces to the in situ rock stress level. The study of the distribution laws of lateral abutment pressure is important for understanding the plastic failure and range in face ends and could provide a theoretical basis for grouting.
In
Figure 11, the negative direction of the X-axis is the mining area of the previous coal face. The area in the range of 0–35 m is the coal pillar area. The 35–40 m area is the gateway of the coal face. The area of 40–55 m is the face ends of the coal face. The remaining area is the coal face area.
Figure 11 shows that when the excavation of the gateways of two coal faces was completed, the roadway excavation broke the stress equilibrium in the coal mass and caused redistribution of the rock stress surrounding the roadway. Obvious stress concentration areas were observed on both sides of the roadway. The peak stress was about 10.5 MPa about three meters away from the roadway wall. With the increase in the distance to the gateway of the previous coal face, the stress value gradually decreased to the level of the in situ rock stress. The stress value of the coal pillar area between the two roadways was 10.5 MPa, which was slightly bigger than that of the in situ rock stress. This was because the gateway of the coal face was affected by the stress superposition. Each side of the gateway had a peak the same size. These were about 10.5 MPa and were three meters away from the roadway wall.
Mining of the previous coal face disrupted the balance of the original rock stress field, resulting in the redistribution of the surrounding rock stress. Owing to the block occlusion structure of the overburden, the support pressure on the coal wall side increased dramatically. Lateral support pressure formed near the coal wall side when the stress was rebalanced. The vertical stress distribution of the surrounding rock with different excavation distances is shown in
Figure 12.
Through analyzing lateral abutment pressure after the mining of the previous coal face, the areas at the coal edges were as follows: stress increasing area, decreasing area, increasing area, decreasing area, increasing area, and invariant area. After 40–80 m of excavation of the previous coal face, three stress concentration regions formed at the stope. Two of them were distributed in the coal mass between the mining roadways of the previous coal face and the coal face, and the other was in the coal on the right of the mining roadway of the coal face, as shown in
Figure 12a–c. With 100 m excavation, there were still three stress concentration regions at the stope. The shape of the stress concentration region on the right of the previous coal face had no obvious changes, but the scope and extent of the stress concentration region on both sides of the mining roadway decreased, as shown in
Figure 12d. With excavation of 120 m, the scope and extent of the stress concentration region on the right of the previous coal face decreased, and no obvious stress concentration region was formed on either side of the mining roadway, as shown in
Figure 12e.
When the previous coal face advanced, the stress distribution law in the coal pillars could be obtained by setting measuring lines two meters above the coal mass, as shown in
Figure 13. The excavation of the previous coal face caused a strong disturbance to the surrounding coal mass. The stress in the coal mass first increased sharply to the peak value. At a distance of about six meters from the coal face, the stress value gradually decreased. At a distance of about 5 to 10 m from the side of the coal pillar in the gateway of the coal face, the stress reached a minimum and then continued to increase and reached a peak at a distance of three meters from the gateway. The stress first increased in the gateway near the coal face and reached a peak value at a distance of three meters from the coal wall. Then, it gradually decreased to the level of the in situ rock stress. The scope of influence of the lateral abutment pressure of the coal face on the face ends was about 35 m. As the previous coal face advanced, the peak stress of the coal on the side of the coal face showed an increasing trend. With the advancing of 100 m of the previous coal face, the stress reached a peak of 15.5 MPa. The influences of the gradual advancing on coal pillars and the coal face gradually intensified. Affected by the lateral abutment pressure of the previous coal face, the peak stress on the side of the coal pillar in the gateway of the coal face increased from 10.5 MPa to 13 MPa, and the peak stress at the face ends gradually increased from the initial 10.4 MPa to 12.1 MPa. When the previous coal face advanced to 80 m, the stress reached a maximum. Later, as the previous coal face continued to advance, the influences on coal pillars and face ends gradually lessened.
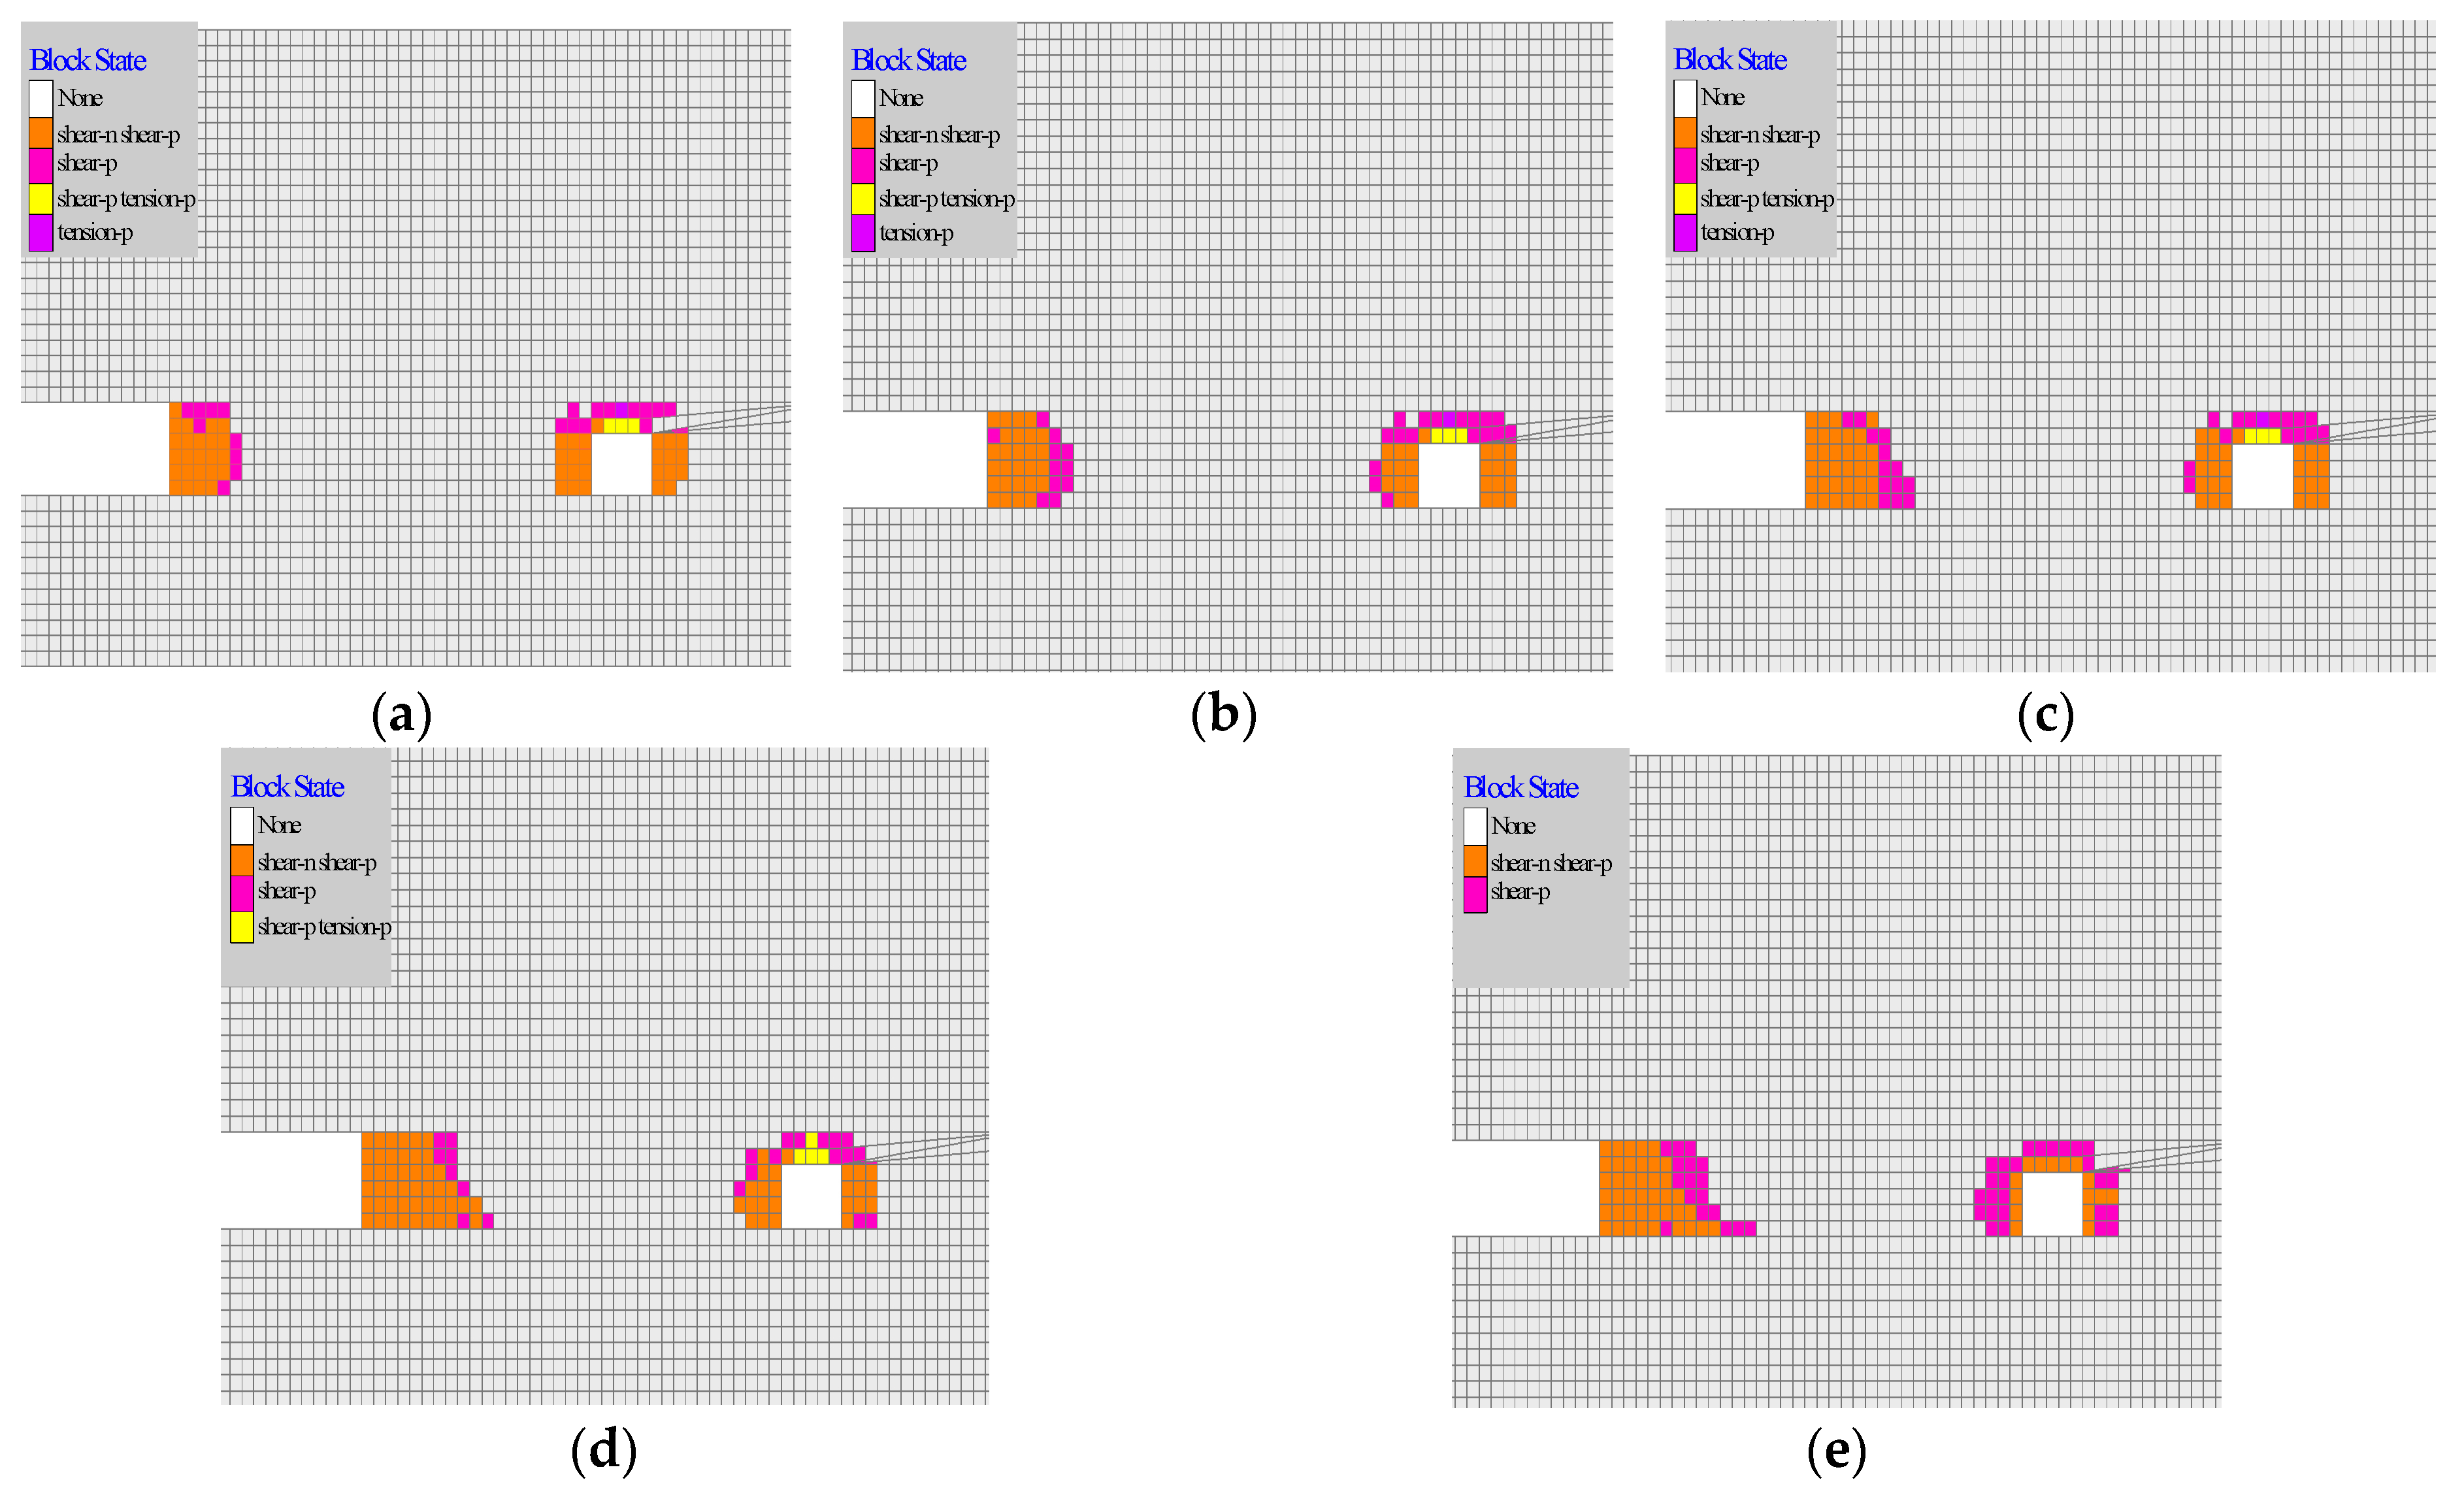
4.2.2. Plastic Failure of Face Ends after the First Mining
To some extent, the deformation and failure of the surrounding rock coal and rock mass at the stope could be depicted by the distribution of plastic zones of the rock surrounding the roadway.
Figure 14 shows the evolution and development of the plastic zones in the face ends during the mining process of the previous coal face.
The simulation results show that, when mainly subjected to the shear failure, the range of the plastic zone on ribs was three meters after excavating the previous coal face. The range in the plastic zone on the roof was two meters, which although subjected to both shear force and tensile strength simultaneously, was mainly affected by tensile strength. The coal mass in the face ends was almost unaffected. After the previous coal face was excavated 40 m, as shown in
Figure 14a, the plastic zones on the side of the coal pillars obviously increased by three meters, mainly affected by the shear stresses. The plastic zones and stress states on the ribs of the coal face were almost unchanged. After 60 m excavation (
Figure 14b), the plastic zone on the side of the coal pillar continued to shift toward the side of the coal pillar under the influences of shear stresses. The plastic zone expanded by a small degree under the influence of tensile stress on the side of the coal pillar in the gateway of the coal face. The plastic zone in the face end increased by about two meters, mainly affected by the shear force. After 80 m excavation (
Figure 14c), the plastic zone on the side of the coal pillar continued to shift toward the side of the coal pillar and presented a step shape, continuously affected by the tensile stresses. After 100 m excavation (
Figure 14d), the plastic zone on the side of the coal pillar continued to shift toward the side of the coal pillar under main influence of shear stress. At this point, the plastic zone of the coal pillar was one-third of the whole coal pillar. After 120 m excavation, as shown in
Figure 14e, the plastic zone on the side of the coal pillar continued to shift toward the side of the coal pillar, mainly affected by shear stresses. At this point, the plastic zone of the coal pillar was half of the whole coal pillar.
The results indicate that as the previous coal face advanced, the plastic zones of the gateway of the coal face increased until stabilization. When the previous coal face advanced to 60 m, the impacts on the coal pillars and the face ends were the greatest. At this time, the plastic zone on the roadway ribs was about three meters. As the coal face advanced, the plastic zone was relatively stable without large changes. During the advancing of the previous coal face, the lateral abutment pressure led to plastic failure to the face ends and coal pillars, which affected the stability of coal pillars and surrounding rocks in the face ends.
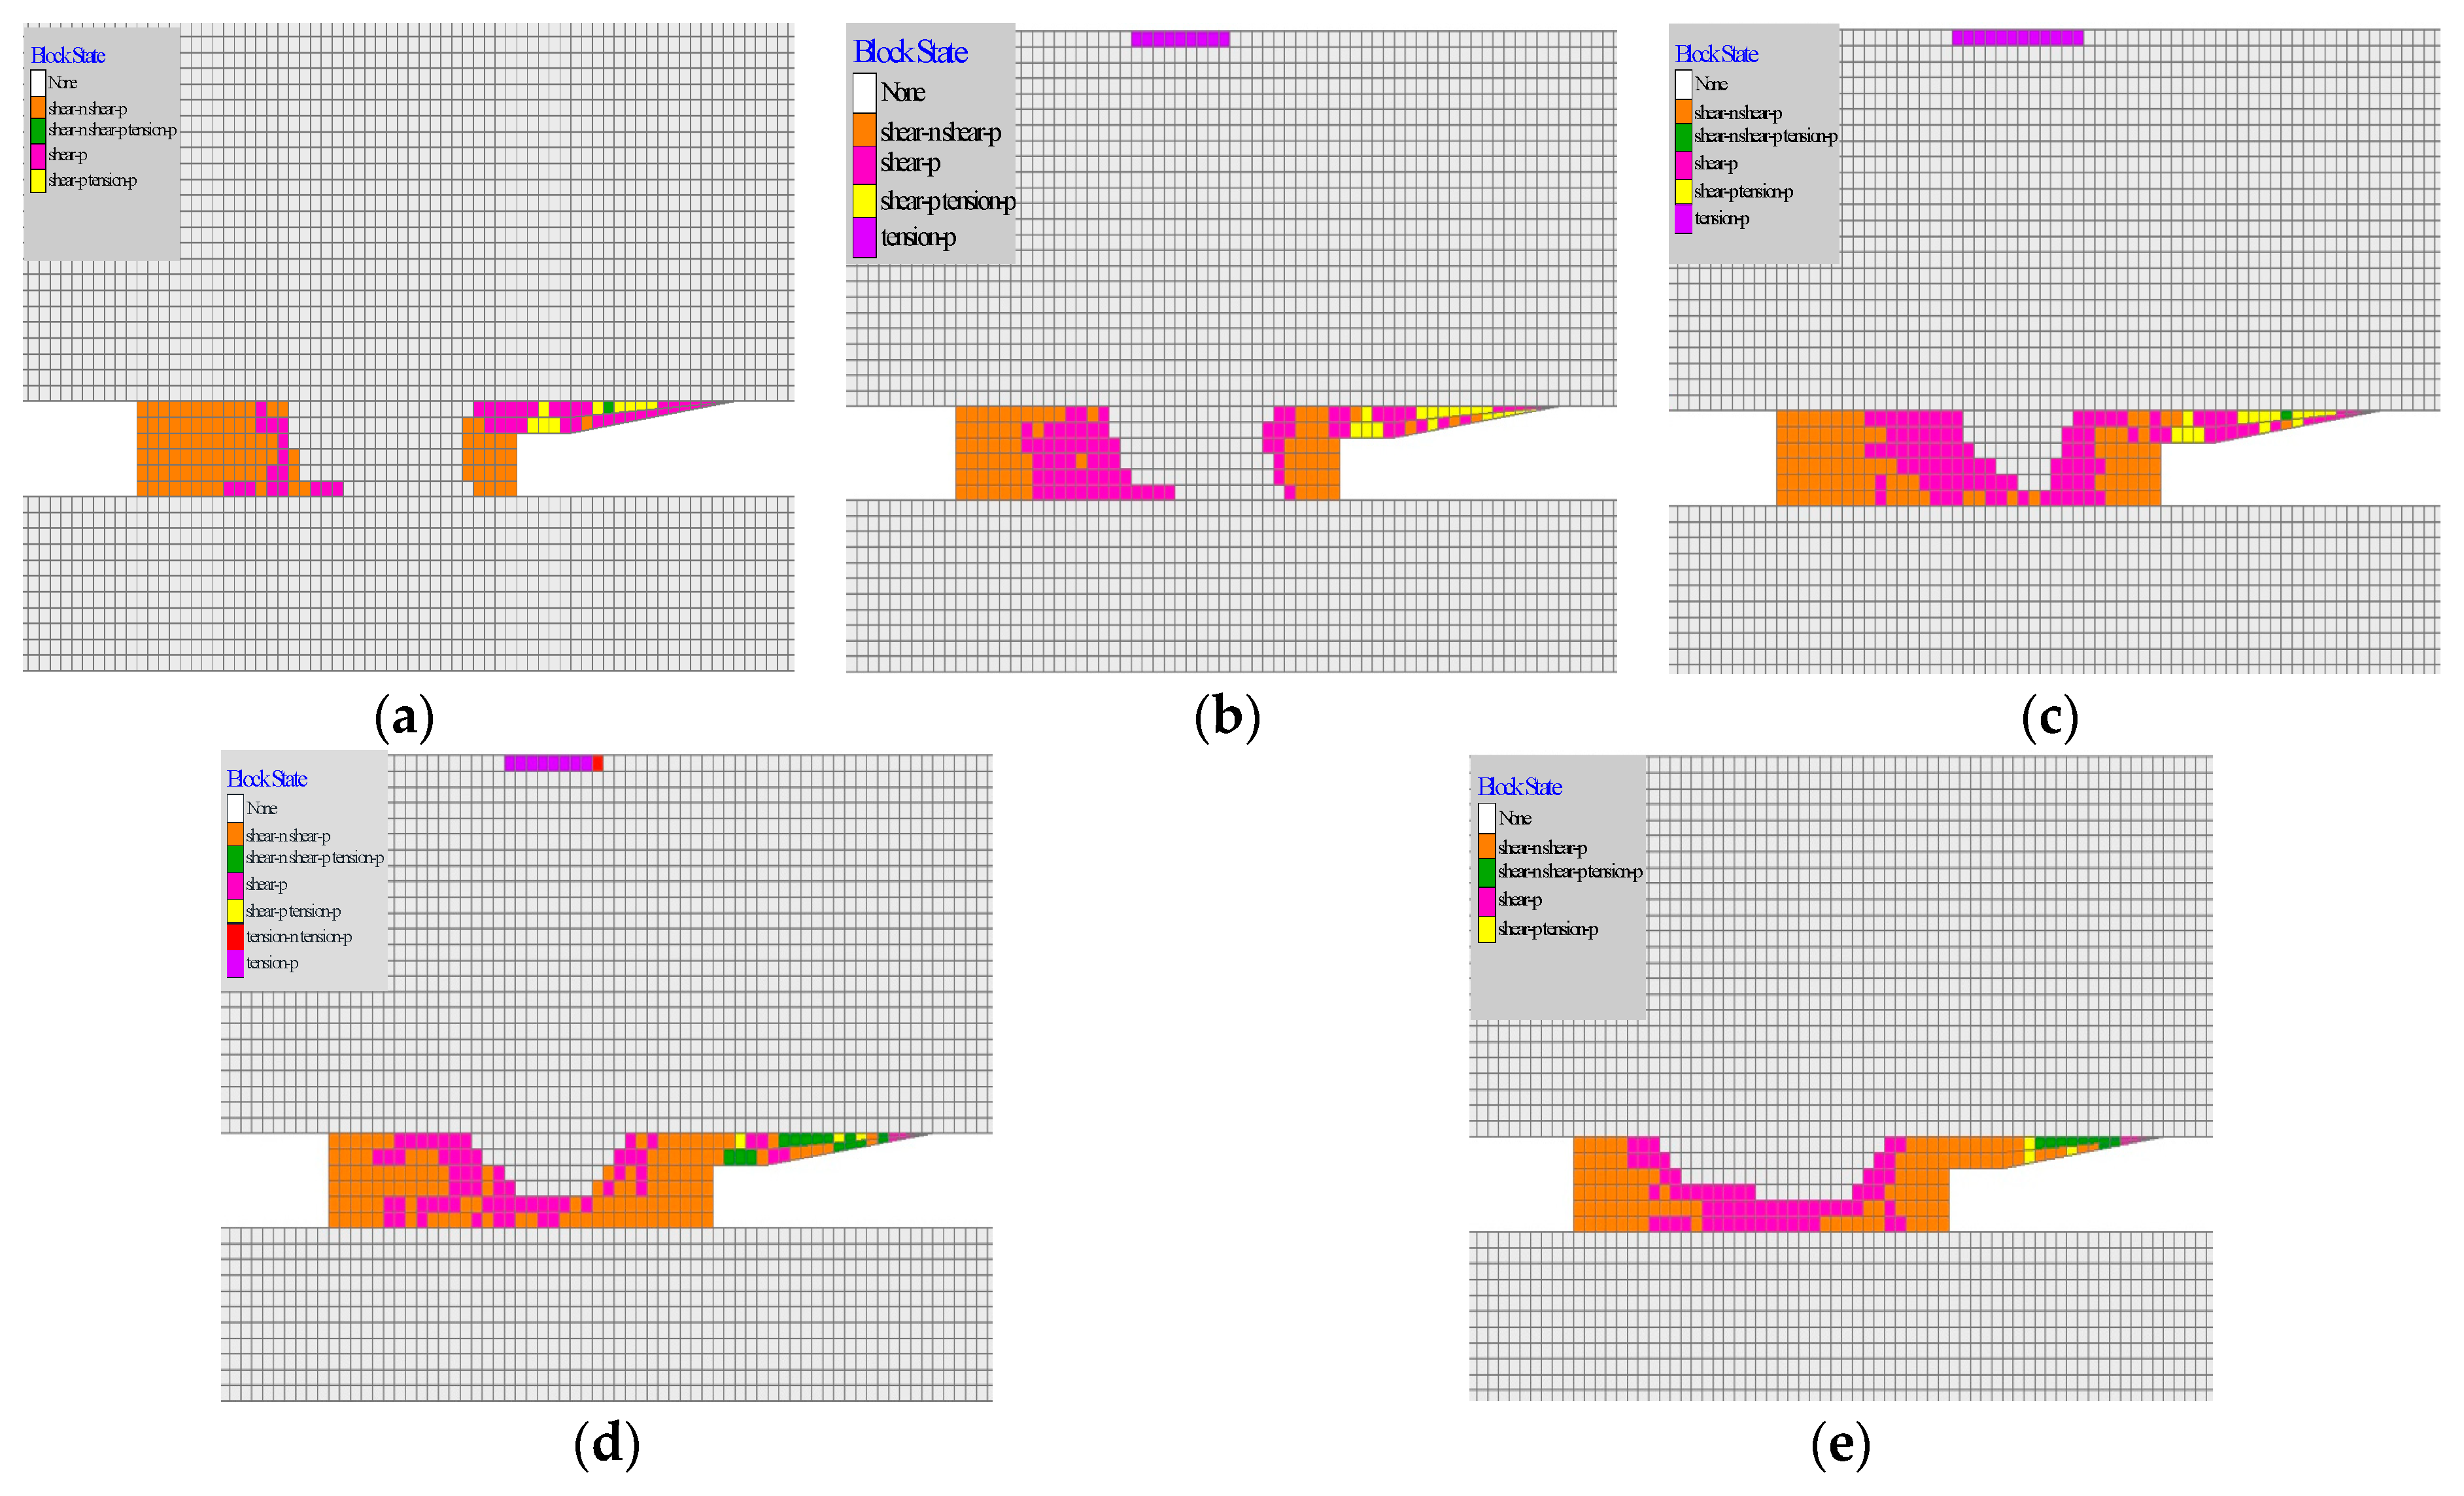
4.2.3. Failure Patterns in the Triangular Zones after Secondary Mining
When advancing the coal face, the coal and rock mass near the stope are affected by secondary mining, and the failure scope and extent of surrounding rocks is further exacerbated.
Figure 15 shows the evolution and development of plastic zones in face ends under the influences of secondary mining.
After 40 m excavation, as shown in
Figure 15a, the plastic zones on the side of the coal pillar increased sharply with the range of 20 m, which was mainly subjected to tensile stress. In addition, affected by shear stress, the scope of the plastic zones on the side of the coal pillar in the gateway of the coal face also increased. At this time, the most obvious change was in the face ends. The entire face ends were in the plastic region and the stresses were complicated, with both shear and tensile stresses. The plastic zone of the coal pillar exceeded half the whole coal pillar. After 60 m excavation (
Figure 15b), the shear stress acting on the interior coal pillar between the two coal faces gradually transformed into tensile stress, and the scope of the plastic zone showed little change. The scope of the plastic zone on the side of the coal pillar in the gateway was seven meters, mainly subjected to the shear failure. At this point, the failure in the face ends was still significant. After 80 m excavation (
Figure 15c), the plastic zone penetrated the entire bottom region of the coal pillar. The plastic failure of the coal pillars between the two coal faces indicated that the face ends still sustained serious damage. After excavation at 100 m (
Figure 15d), the bottom of the coal pillar was entirely in the plastic zone and the upper-middle region was being damaged. At this time, the face ends were mainly subjected to shear failure along with tensile stress. After excavation of 120 m, as shown in
Figure 15e, the bottom of the coal pillar was entirely in the plastic zone and the upper-middle region was being damaged. The face ends were mainly subjected to shear failure along with tensile stress, and the stress states were complicated.
Overall, after the excavation of the coal face, the mining intensity was relatively large and the strata behaviors were strong. Under the influences of mining, the right, left, and lower middle part of the coal pillar regions were in the plastic zone and the coal mass was seriously broken. Meanwhile, the stresses shifted toward the face ends and further aggravated the failure of the face ends. The stress states in the face ends were complex and the coal mass was likely damaged. It was very easy to induce roof caving and rib spalling during the advancement of the coal face, which would impact the normal extraction of the coal face. Therefore, grouting reinforcement of the coal mass in the face ends is crucial to ensure safety.
4.3. Distribution Characteristics of Front Abutment Pressure
The abutment pressure in the stope is an important part of mine ground pressure. The factors influencing its distribution mainly include thickness of coal seam, buried depth, roof-floor lithology, coal strength, and occurrence state of coal seam. The dimensions and advancing velocity during the design of the coal face are important factors affecting the distribution laws of the abutment pressure. For large mining height coal faces, the scope of the overburden failure increases after the increase in the mining height, thus changing the distribution mode and scope of the plastic zones in front of the coal walls, further influencing the peak positions and scope of the abutment pressure.
The distribution laws and characteristics of the abutment pressure of large mining height coal faces were studied through different excavation calculations in the FLAC3D numerical model. The distribution laws of the abutment pressure were obtained through data extraction and processing of the calculation results of the two coal faces with different advancing depths, as shown in
Figure 16.
The results indicate that as the coal face continued to advance, the advance abutment pressure distribution of the large mining height coal face could be divided into the typical increasing, decreasing, and stable areas. It indicated that as the coal face advanced, the abutment pressure in front of the coal face increased sharply until reaching a peak, then started to decrease sharply. After decreasing to certain values, it slowly decreased to the stress value of the in situ rock. The results also indicate that as the coal face advanced, the peak values of the advance abutment pressure continued to increase and the peak positions moved forward continuously. When the coal face advanced 80 m, the peak value of the advance abutment pressure stabilized around 22.3 MPa eight meters in front of the coal face wall. The influence of the advance abutment pressure was within 65 m of the front of the coal face, and the scope of violent influence was within 25 m. Therefore, in practice, it is necessary to enhance the support within 25 m of the front of the coal face and optimize the roadway support to ensure the stability of gateways and the adjacent roadways.
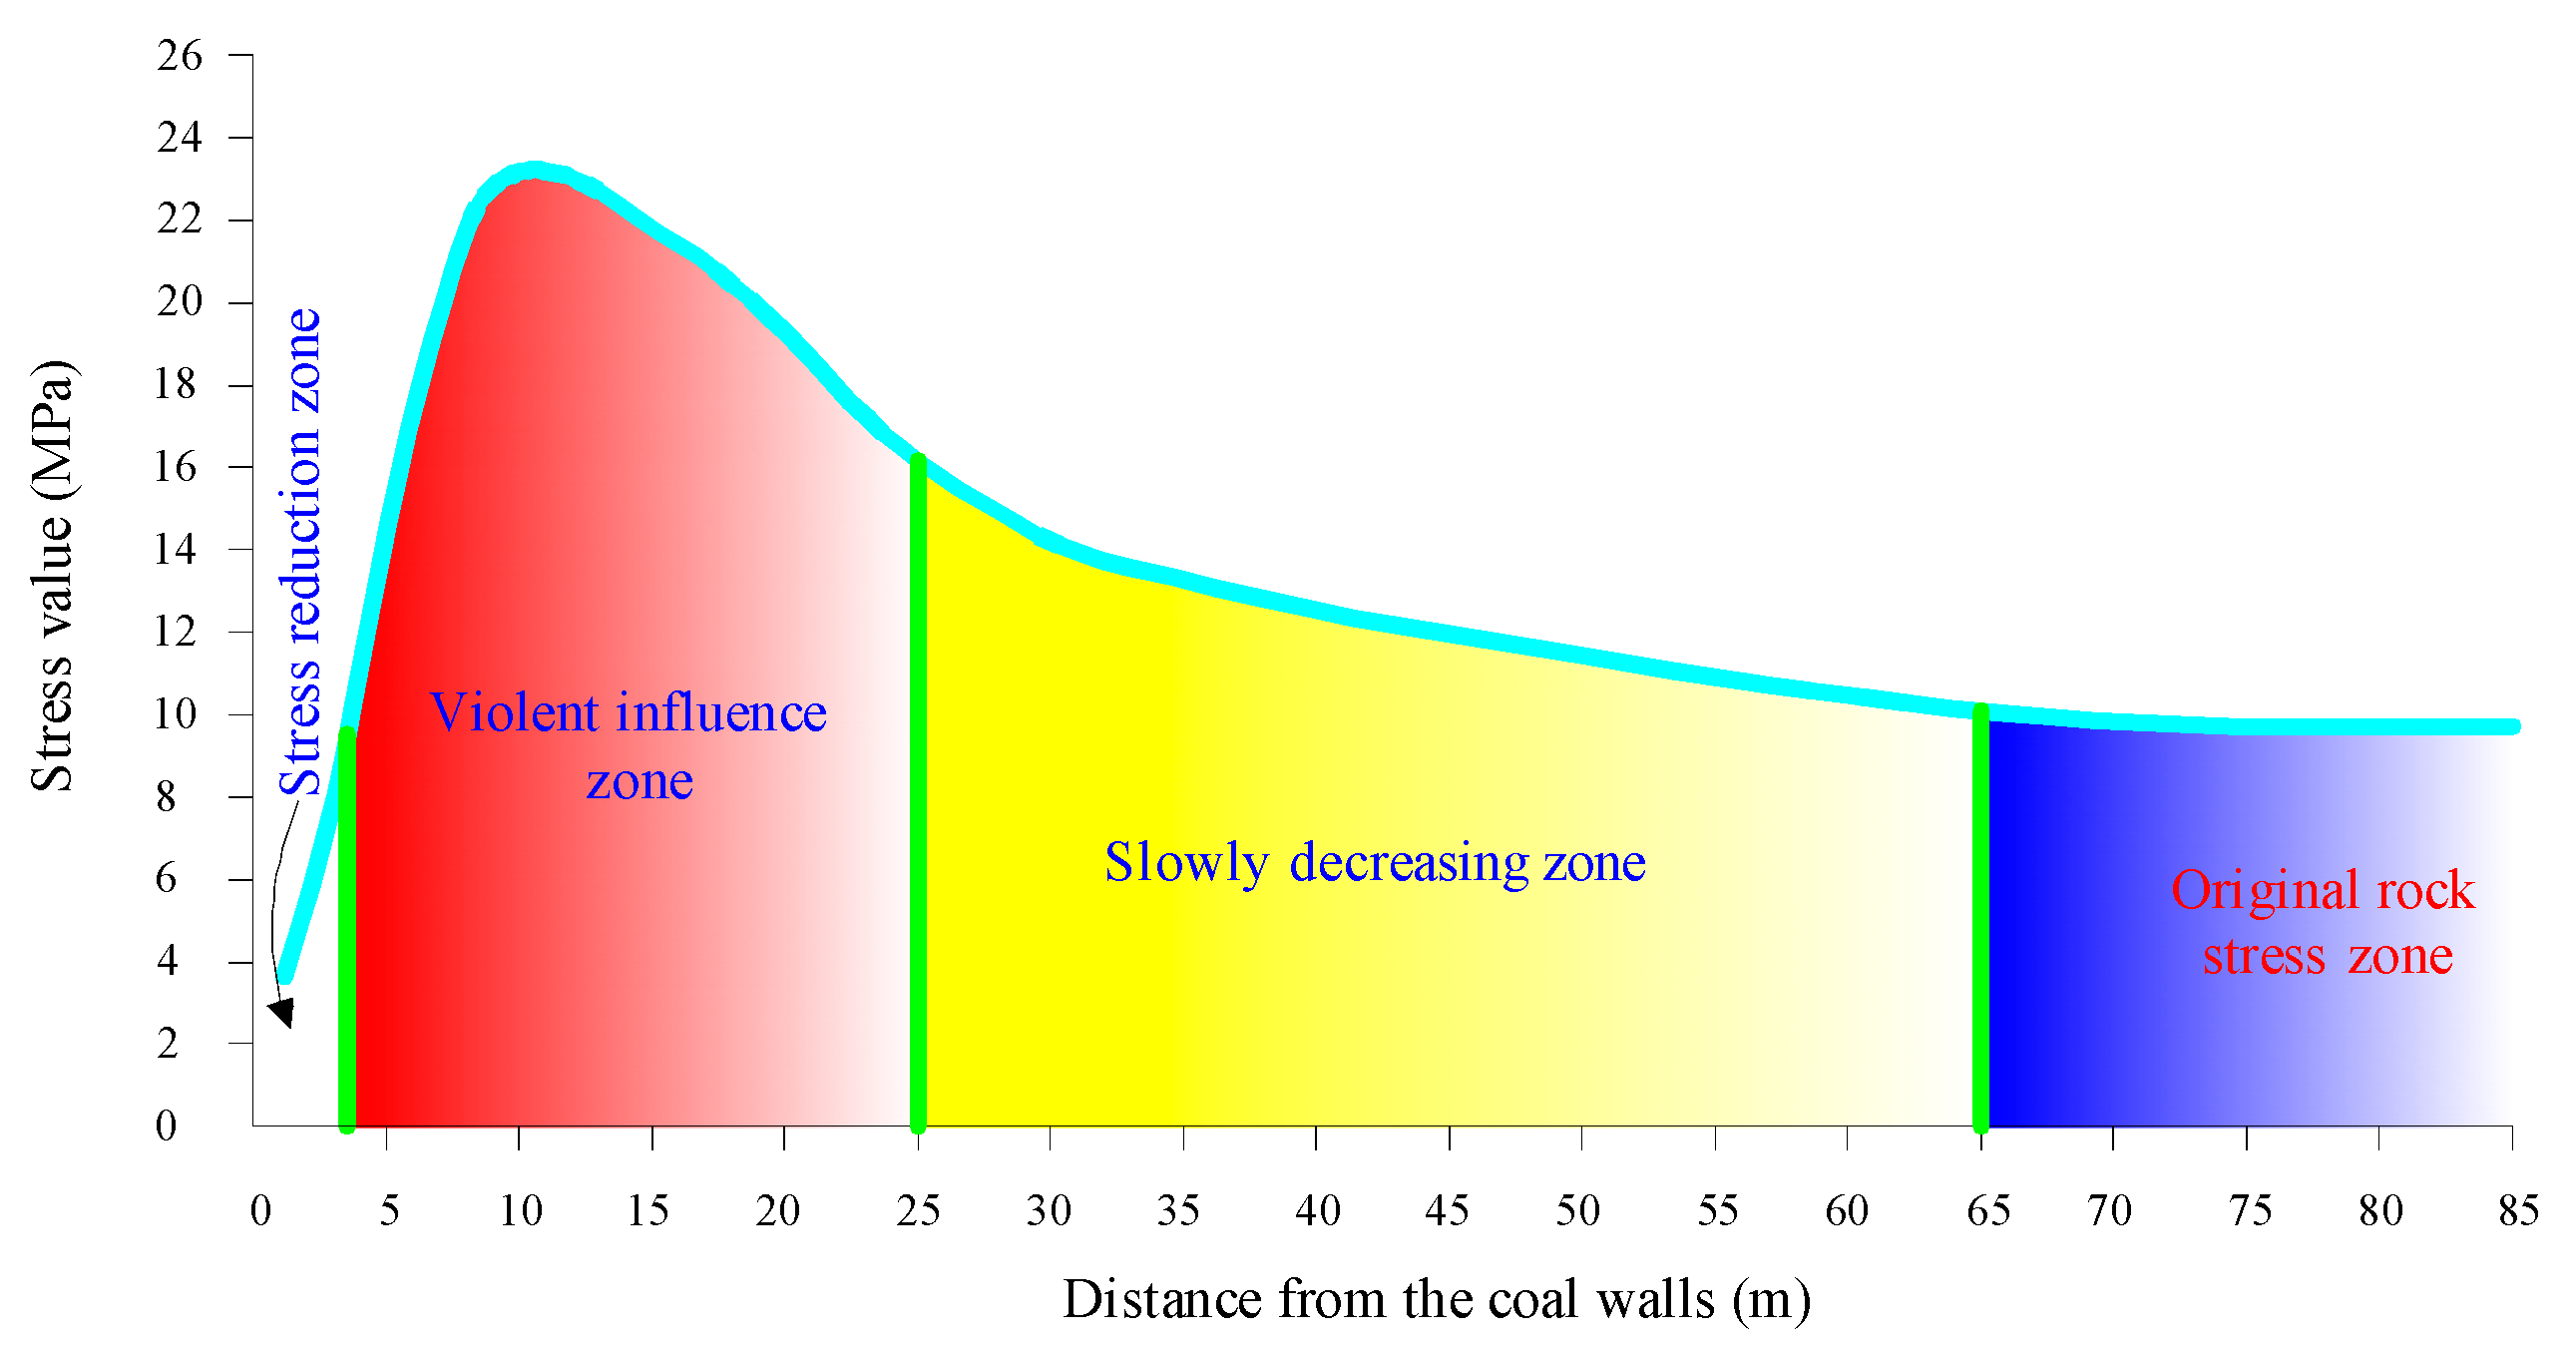
4.4. Grouting Parameters Determination and Location
Based on the analysis of the distribution laws and characteristics of the advance abutment pressure on large mining height coal faces, the scope of influence was within 65 m in front of the coal face, and the violent influence scope was within 25 m. The peak value was about 22 MPa approximately 8 m in front of the coal face.
Figure 17 shows the characteristics of the advance abutment pressure zones of the large mining height coal face.
The advance abutment pressure of large mining height coal faces could be roughly divided into four regions: stress reduction zone, violent influence area, slowly decreasing zone, and original rock stress. The stress reduction zone occurs within 0–4 m of the front of the coal face, which is the area with the most serious coal failure. The cracks in the coal body have a high degree of development and even entire rib spalling and falling occur. Therefore, this area is not suitable for the use of grouting. The violent influence area occurs within 4–25 m of the front of the coal face. In this area, the stress value increases sharply to a peak and then decreases greatly. The high stresses lead to broken coal and there is obvious fracture development, which has a beneficial effect on slurry injection and diffusion. However, the broken coal may lead to serious leakage during the grouting process. Therefore, grouting in this area is required for drilling, hole sealing and grouting, and plugging in order to ensure on-site grouting construction and effects. The slowly decreasing zone within 25–65 m of the front of the coal face is first affected by the advance abutment pressure. In this area, the roadway deformation increases slowly and the stress value decreases slowly. The development degree of the broken coal is lower than in the violent influence area. Grouting with high pressure and a large flow rate should be used to improve leakage and grouting effects. The original rock stress area occurs beyond 65 m from the front of the coal face. In this area, the coal stress value gradually decreased to the level of the in-situ stress. The coal mass has good integrity and the fractures are undeveloped, so the grouting operation was relatively hard. Therefore, grouting should not be carried out in this area.
Above all, based on the crushing situation of the coal mass in different areas under the effects of the advance abutment pressure and the degree of grouting construction difficulty, the slowly decreasing zone of the advance abutment pressure was chosen as the reasonable location for grouting construction. Considering the on-site advance support conditions in the gateway of the coal face, equipment allocation, as well as the actual operation adjustment, the zone 50–60 m in front of the coal face was finally chosen as the proper grouting location.
5. Field Observation
5.1. Grouting Drilling Arrangement and Parameters
The 24#–16# cross openings in the 53031 roadway of the Sihe coal mine were greatly influenced by mining activity. The heaving floor of the roadway, serious roof subsidence, considerable deformation of the triangular zone, and rib spalling caused difficulties for the quick and safe advance of the coal face. In this context, grouting reinforcement was conducted at 485 m.
Figure 18 shows the drilling arrangement. Two rows of boreholes had a staggered arrangement in the grouting area. The opening heights of the boreholes in the lower and upper rows were 1.5 m and 2.5 m, respectively. The spacing between the upper and lower rows of holes was 3 m. The construction of the holes in the lower row was perpendicular to the roadway rib with a hole depth of 20 m. The upward slant holes were in the upper row with an angle of 8° and hole depth of 20 m.
A 6” seamless steel pipe was used as the hole sealing pipe with a length of 6 m, connected together by three steel pipes. A polyethylene (PE) pipe with a diameter of 32 mm and a length of approximately 14 m was inserted into the rest of the hole. The two-ended jetting holes were set 5 m ahead with a diameter of 5–8 mm and a spacing of 300 mm. The deep hole drilling was completed and the grouting pipe was inserted. The grouting operation for the medium-depth holes was conducted when the distance between the borehole to be grouted and the coal face was 20 m.
5.2. Borehole Video Results
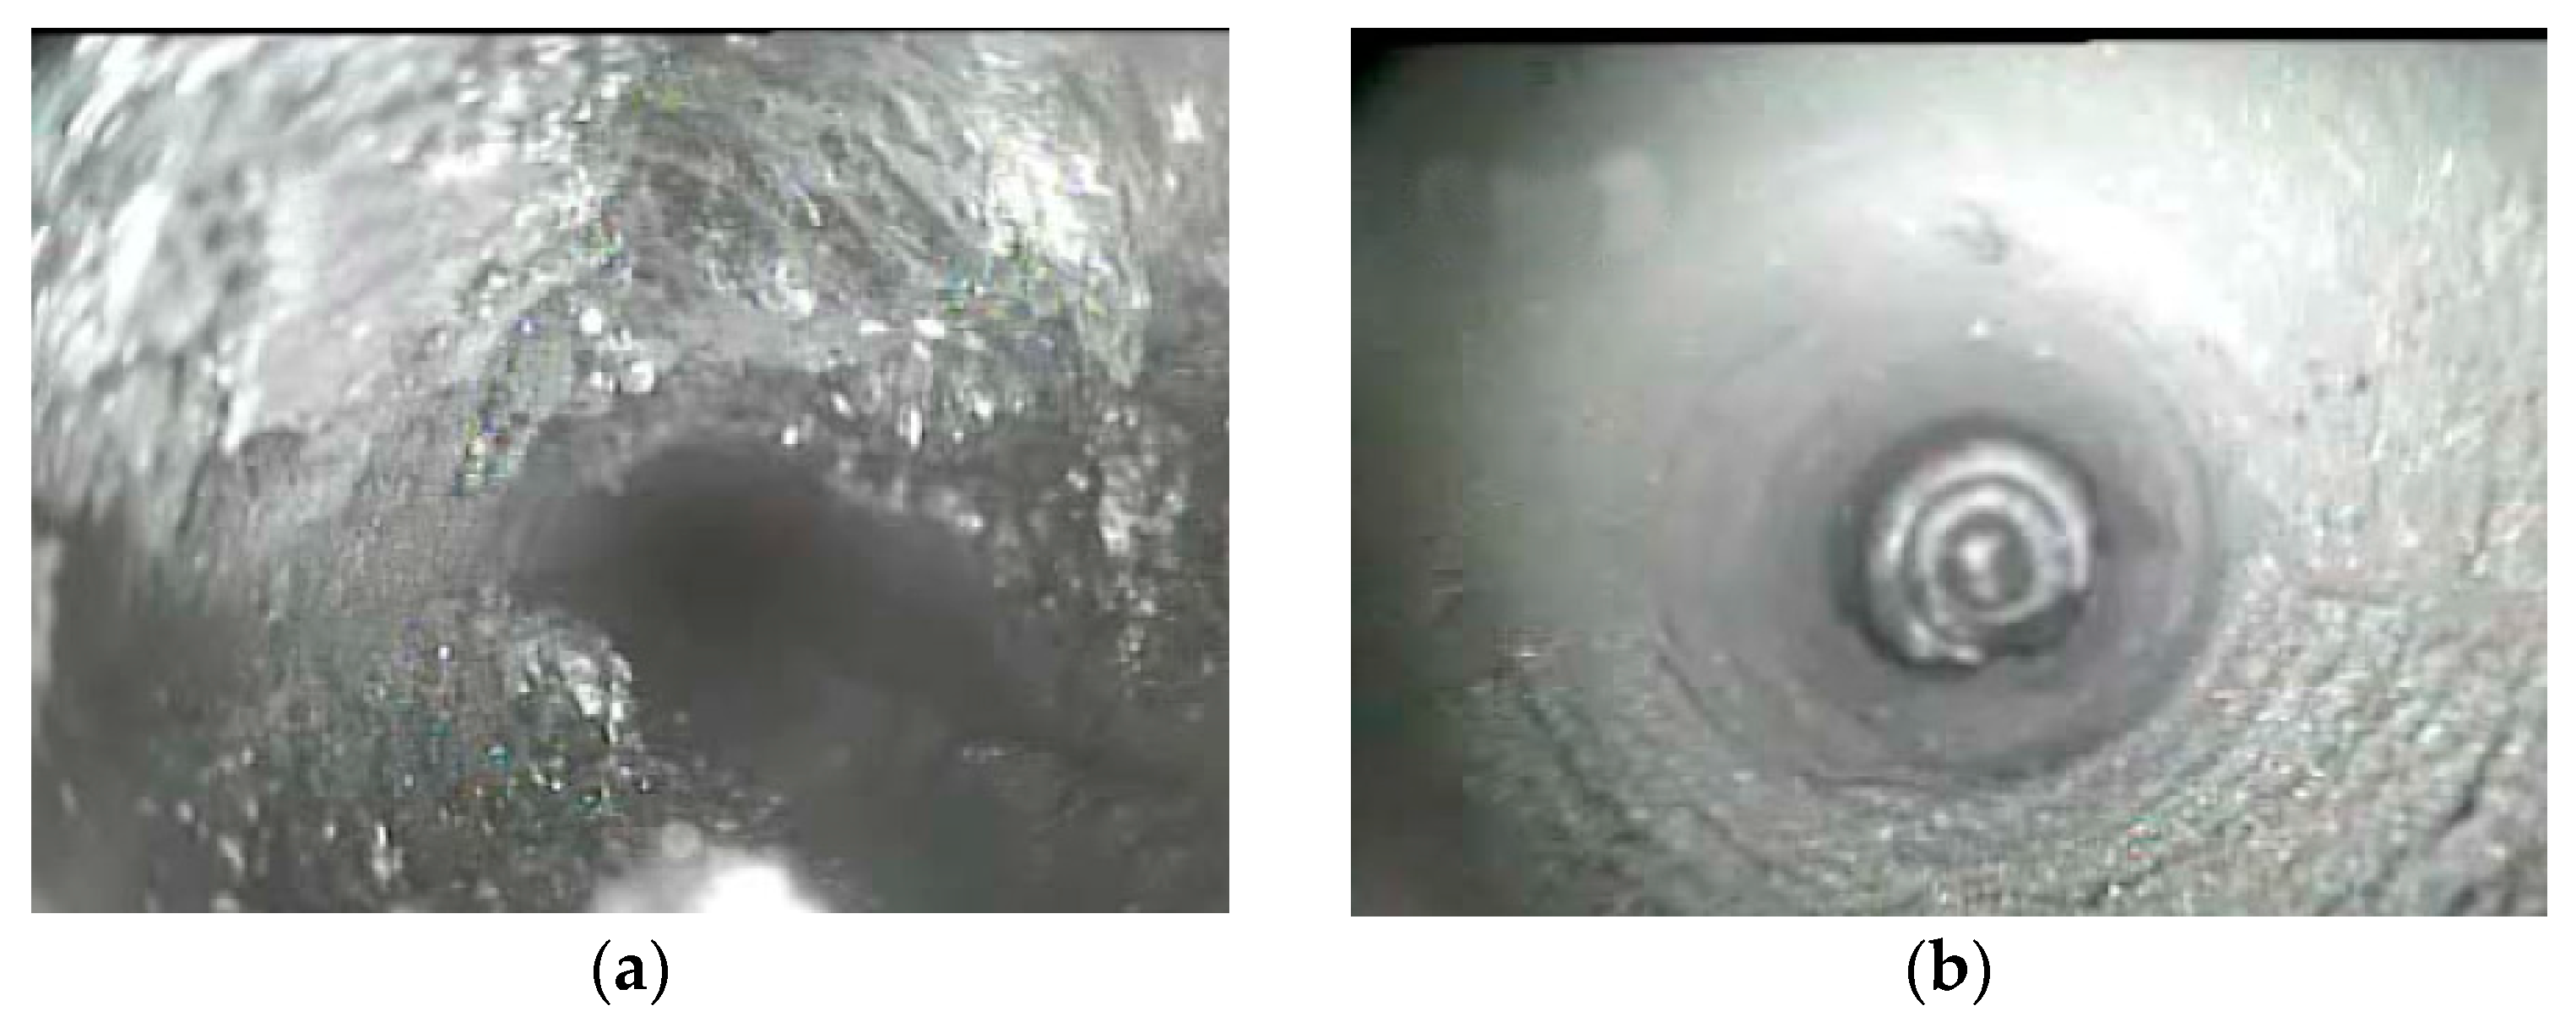
To visually observe the effects of on-site grouting reinforcement, the drilling peep method was used for the grouted and un-grouted areas to determine the fracture development and grout filling situations in the rock mass surrounding the borehole. Through comparative analysis, the on-site grouting effects were obtained. A peeping hole was set in both the un-grouted area and the grouted area. The distance between the drilling location and the grouting hole was 3.0 m. A KDVJ-400 mine electronic peephole instrument (Version 400, Tensense Geotech Instrument Equipment Co., Ltd., Wuhan, China) was used for any borehole peeping with a diameter between 35 mm and 200 mm. The borehole probe accepts images that could be directly observed by the receiver. The instrument was connected to the computer for image analyzing and processing. It could intuitively reflect the structure of the rock surrounding the roadway and understand various parts more clearly. Before borehole observation, the boreholes were drilled, cleaned, and dried. First, the probe was inserted into the borehole and connected with the receiver. Then, the drilling patterns could be observed. During the observation, the peeping instrument was slowly rotated and inserted to photograph and record situations.
Figure 19 shows the on-site drilling peep results.
Through comparative analyses, we found that before grouting, the coal mass in the borehole had poor integrity along with loose, broken, and crisscrossed fracture development. After grouting, the broken coal mass decreased markedly and the inner surrounding rock became more compact. The filling was obvious in the borehole wall and hole bottom. The coagulated slurry in the borehole presented sheets with varying thicknesses or a strip consolidated body. The complex fissures in the coal mass were filled and consolidated effectively. The voids were compacted and the integrity and stability of the coal mass were obviously enhanced. The trace of filling could be clearly observed within 3.0 m of grouting, indicating that the slurry could easily diffuse in fissures of broken coal mass. The diffusion radius was greater than 3.0 m. The expected grouting effects were met.
Overall, after grouting, the surrounding rock mass was relatively complete. There were no fissures or fractured surface during the observation process. Moreover, the grouting materials easily bonded with broken surrounding rocks, thus enhancing the integrity of the surrounding rocks to a certain extent. The bond force between the slurry and coal mass increased. The surrounding rock’s anti-deformation capacity improved, as did the grouting effects.
6. Discussion
During high-intensity mining of large mining coal faces, inorganic cement grouting reinforcement technology was introduced to solve the rib spalling problem in the triangular zone in the face ends. A laboratory experiment was carried out to study the impacts of various accelerator combinations with different water-to-material ratios on the setting time and mechanical properties of the grouting materials. Taking the setting time and the UCS as main indexes, the optimal accelerator combinations with proper water-to-material ratios were determined. The experimental results revealed the ideal physical and mechanical properties of the inorganic cement grouting materials under different influencing factors, which is useful for understanding the material characteristics and providing valuable baseline data for future research. FLAC3D numerical simulation software was applied to elaborately analyze the failure characteristics of the triangular zones in the face ends and the distribution laws of the lateral abutment pressure and advance abutment pressure. In addition, reasonable grouting scope and the corresponding grouting parameters were determined. Finally, an inorganic cement grouting reinforcement system suitable for the geological conditions of the Sihe mine was developed.
Through observation and comparison of the amounts of coal wall rib spalling before and after grouting, we found that rib spalling occurred frequently in the face ends before grouting reinforcement. The depth of the rib spalling was relatively large and the maximum depth reached was 1.5 m. After grouting reinforcement, the amount of rib spalling decreased significantly and the average depth was about 0.4 m. The rib spalling was effectively controlled, thus guaranteeing the normal mining of the coal face. The field practice results show that the broken coal mass could be effectively bonded and reinforced by arranging grouting holes at a depth of 20 m in the face ends. When the coal face advanced to the grouted area, rib spalling would not be easily induced because the broken coal mass formed a whole under the impacts of slurry consolidation. The scope of rib spalling was relatively small, and ideal effects were achieved.
Table 5 shows the coal wall rib spalling during mining after grouting of the 5303 coal face.
However, the actual field observation also showed that although the coal wall rib spalling was effectively controlled after grouting reinforcement for the face ends, the top coal that remained in the mining height transition area was relatively broken and poorly controlled due to the lagging pull support and frequent movement of the support in the face ends. Two suggestions were put forward for on-site construction to solve the problem of setting top coals. One was to enhance the support management in the face ends. Pull support could be used in time and the end support movement should be reduced as much as possible to avoid repeated compression failure of top coals. The other suggestion was to conduct proper chemical grouting in areas with serious broken top coals.
7. Conclusions
At the end of the coal face, the mining pressure is severe and the coal body is broken, so accidents such as crushing triangle zones, coal wall spalling, and falling roofs can easily occur in this area. This situation is more prominent in large and tall fully-mechanized mining faces, which seriously restricts the efficiency of fully mechanized mining production. In order to improve serious coal wall spalling in the triangular zone of the coal face end, we first analyzed the effect of accelerators and water-to-material ratios on the setting time and the UCS of inorganic cement. Then, the distribution laws of the side abutment pressure, the plastic zone, and front abutment pressure in coal face ends during repeated mining were studied. Finally, inorganic cement grouting reinforcing was carried out in the triangular zone of a highly gassy coal face with large mining height. The conclusions are as follows.
The results of the setting time and uniaxial compressive strength of grouting materials experiments indicated that with the increase in the water-to-material ratio, the initial and final setting time gradually increased. The compressive strength at one and three days showed decreasing trends. The accelerator combinations of 2% accelerator I and 0.3% accelerator II, and 2% accelerator I and 3.0% accelerator III had better effects. The strength testing indicated that the compressive strength could reach 10.8 MPa in 2 h and 20 MPa in 28 days by simultaneously adding 2% accelerator I, 0.3% accelerator II, and 3.0% accelerator III. The strength of the consolidation coal was 119.3% higher than that of the organic materials. Then, based on the specific geological conditions of the 1308 coal face in Sihe coal mine, a numerical calculation was conducted to analyze the distribution laws of the range of the plastic zone, lateral abutment pressure, and advance abutment pressure in the face ends under the influence of repeated mining. The results indicated that as the previous coal face gradually advanced, the peak stress on the side of the coal pillar in the gateway of the coal face increased from 10.5 MPa to 13 MPa. The peak stress in face ends gradually increased from the initial 10.4 MPa to 12.1 MPa. When the coal face advanced to 80 m, the stress reached a maximum and plastic failure occurred in the rock surrounding the coal pillars and gateway of the coal face, and the degree of the influence was not intense. With continuous excavation of the coal face, the impacts on the face ends reached a maximum and gradually diminished. According to the field monitoring results of the deformation laws of the gateway in tall coal faces and the numerical calculation results of the abutment pressure, the influence of the advance abutment pressure was at 65 m in front of the coal face, and the intense influence range was within 25 m. The peak of the advance abutment pressure was about 22 MPa at a distance of about 8 m from the front of the coal face. After fully considering the crushing situations of coal in different areas subjected to abutment pressure, grouting construction became difficult. Given the advance support in the gateway of the coal face, equipment allocations, and actual operation adjustment, the range of 50–60 m in front of the coal face was chosen as the reasonable grouting location. Finally, the developed inorganic cement grouting reinforcement technology was used in the triangular zone of the 5303 coal face. The practical observations and drilling peep verification found that the slurry diffusion radius was larger than 3.0 m. The integrity of the coal wall in the face ends improved significantly and could meet the requirements for rib spalling prevention, which could provide technical support for safe and efficient mining of the coal face.


