1. Introduction
Solar, wind, and other renewable energies are widely used to generate electricity in the world [
1,
2,
3,
4,
5]. For these energy forms, because of their characteristics of instability and intermittence [
6,
7], efficient energy storage technologies are required in order for a sustained and stable output [
8,
9,
10,
11,
12].
Energy storage technologies, such as bulk power management, compressed air energy storage (CAES), and pumped hydroelectricity storage (PHS) [
13,
14,
15,
16], are presently relatively mature and reliable. However, these two technical schemes [
17] are limited by geographical or hydrogeological conditions. PHS technology needs abundant water resources for support, while CAES requires high-performance natural underground reservoirs. According to the Electric Power Research Institute (EPRI), the total cost for CAES is around 1000
$/kW. It may be double this for PHS. As a result, there is a demand to develop a general, cost-effective energy storage technology, regardless of local conditions.
Liquid air energy storage (LAES) is an innovative and leading universal industrial energy storage technology [
18,
19,
20,
21]. The idea of LAES began in 1977 at the University of Newcastle, and was tested by Mitsubishi Industries Ltd. (Tokyo, Japan) in 1998 [
1]. Researchers at the University of Leeds together with the Highview Power Storage Company developed the first 350 kW/2.5 MWh pilot demonstration plant at the University of Birmingham in 2010. The data gathered from this pilot plant showed that the efficiency of the total cycle is in the range of 50–60%.
Since 2014, Viridor has selected Highview to design MW level pre-commercial, multi-MW, and conceptual Giga-Plant LAES. However the round-trip efficiency is still approximately 60%. Some literature has contributed to this topic.
The process can be divided into two parts, namely air liquefied and electric generation. As the air liquefied process needs a lower temperature, while the electric generation process needs a higher temperature, internal heat exchangers, such as regenerators, are needed to connect these two processes in order to improve the cycle efficiency.
An integrated system was put forward so as to investigate the operational parameters of the major devices effecting the cycle efficiency. Chino and Araki [
22] also proposed an air liquefaction plant integrated with a conventional combined cycle power plant. Li et al. studied a LAES system integrated with a nuclear power plant [
23]. The overall system efficiency is improved, owing to the reheating arrangement.
In this paper, more detailed effects will be discussed regarding the outlet pressure of the compressor and cryogenic pump, the efficiency of the heat exchanger, the air temperature and pressure before the throttle on the cycle efficiency, and the liquid air yield.
2. System Description
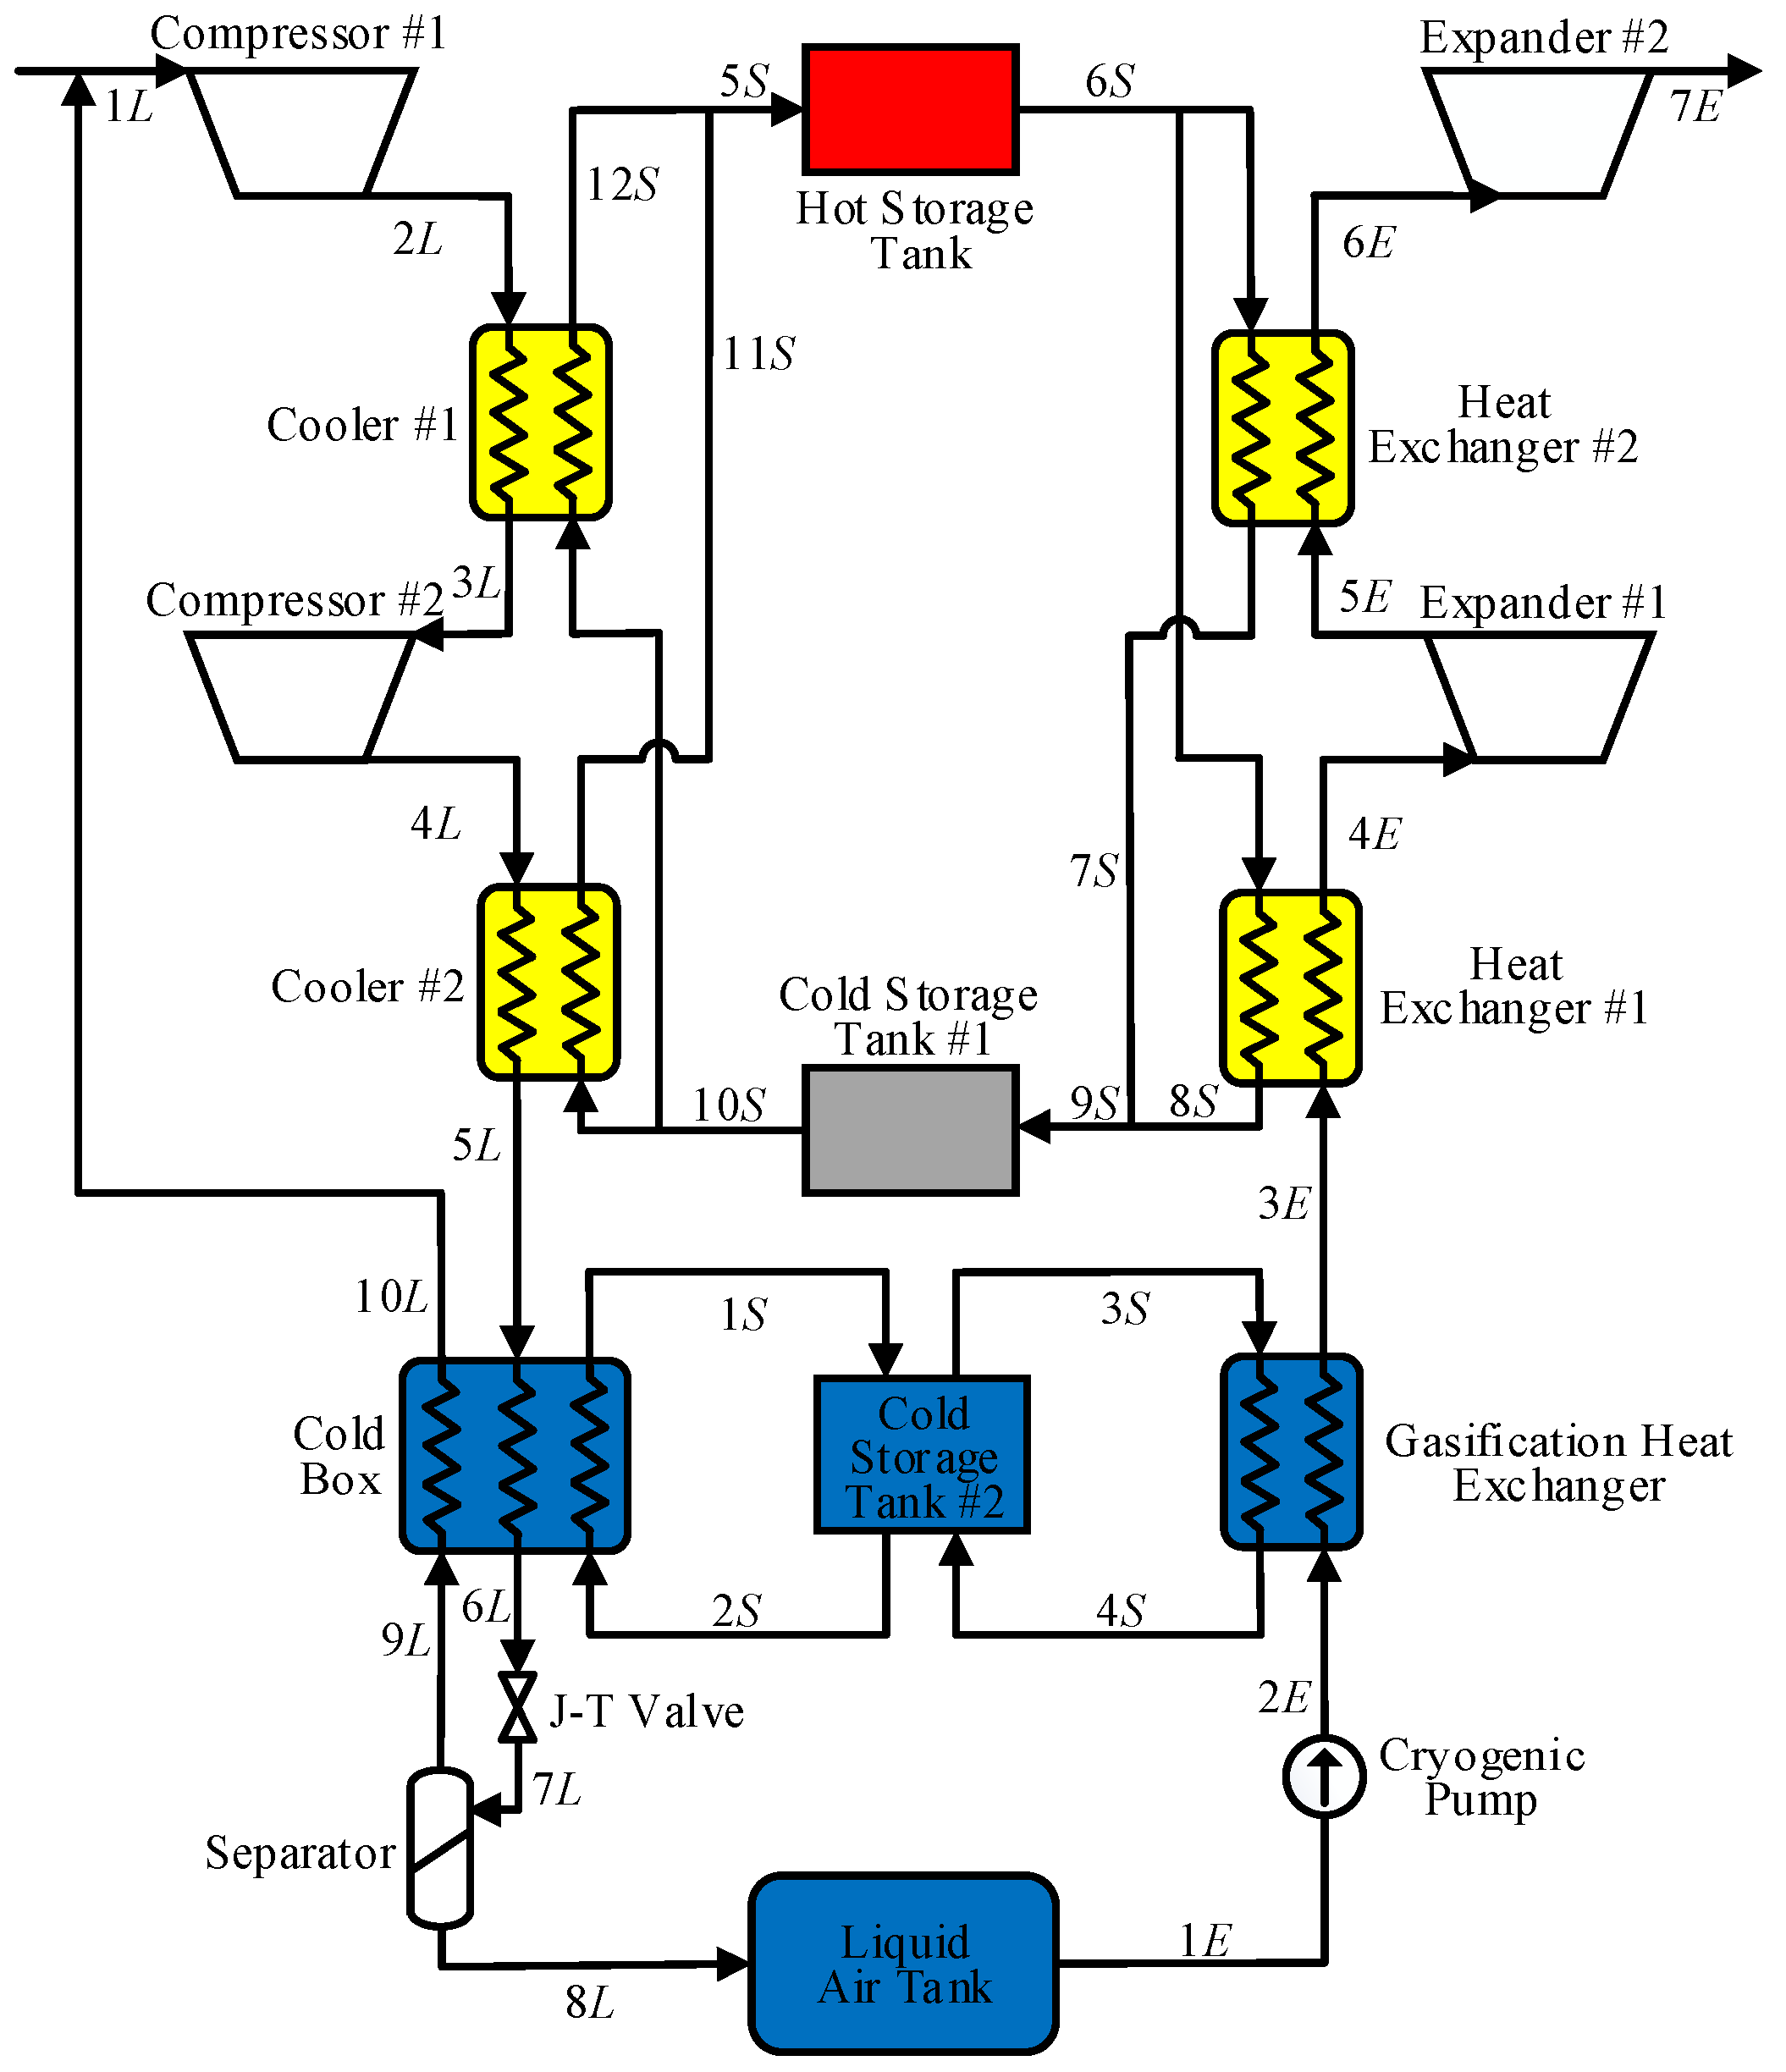
Figure 1 shows the layout of an integrated liquefied air energy storage and electricity generation system, referring to the literature [
8]. The system adopts a two-stage compression and two-stage expansion.
The left side is the air liquefying process. It contains two air compressors, a J–T valve (It is a throttle valve), a separator, a liquid air tank, and some heat exchangers. When there is surplus electricity from the renewable energy sources or from the grid, the outer air is compressed by the two air compressors, and its temperature and pressure are raised. Then, the gaseous air is cooled down and throttled in the J–T valve. The liquefied air is then collected in the separator and stored in the liquid air tank.
When there is an insufficient supply of electricity available to meet the consumers’ demands, the cryogenic pump is activated. The liquid air in the liquid air tank increases its temperature through the heat exchangers, and recovers to a gaseous state. When it reaches the set-points for the temperature and pressure, the air enters the two-stage expander in order to generate electricity. This is the electricity generation process.
There are some regenerators between the two processes. To decrease the system fluctuation, the large capacity storage method is used.
The above integrated system is modeled with the following assumptions:
3. Mathematical Models for Processes
3.1. Air Liquefying Process
The outlet pressure and inlet pressure of the air compressors are as follows:
where
pac,out is the outlet pressure of the air compressor, Pa;
pac,in is the inlet pressure of the air compressor, Pa; and
πac is the compression ratio.
The relationship between the inlet and outlet temperature of the air compressor is as follows:
where
Tac,out is the outlet temperature of the air compressor, K;
Tac,in is the inlet temperature of the air compressor, K; and
nc is the polytropic index of the compression process.
The efficiency of the compressor
ƞac can be expressed as follows:
where
κ is the adiabatic index.
The specific work,
wac, done to the compress air is as follows:
where
cair is the specific heat capacity of air, J/(kg·K).
After the two air compressors, two internal heat exchangers are used. The high-temperature and high-pressure air is cooled down to heat the low temperature cold fluid within the internal heat exchanger. Ignoring the heat dissipated to the surroundings, the outlet air temperature of the cold side,
Thex,cold,out, is as follows:
where
ε is the efficiency of the heat exchanger, and
Thex,cold,in is the inlet air temperature of the internal heat exchanger on the cold side, K.
The lower the temperature of the air entering the second compressor, the smaller the power consumption needed for compressing the air. Therefore, the cold side air from these two heat exchangers is introduced from cold storage tank #1. When leaving the heat exchanger, the cold side air discharges the absorbed heat into the hot storage tank. The heat stored in the hot storage tank per unit mass is as follows:
The hot side air continues cooling down in the cold box. The parameters of point 6
L (in
Figure 1) must be controlled to be below certain values. In the cold box, the energy balance equation must include the mass flow rate of the three working fluid streams.
Then, the air passes the J–T valve and is throttled into the two-phase region. The gaseous air is recovered to be reused. The liquefied air flows out from the bottom of the separator and is stored in the liquid air tank. The ratio of liquid air yield is as follows:
where
m8L is the mass flow rate of the liquid air that enters the liquid air tank, kg/s, and
m1L is the mass flow rate of the gaseous air being suctioned at air compressor #1, kg/s.
3.2. Electricity Generation Process
During the peak electricity demand period or in the case of a power failure, the electricity generation process is activated. The liquid air in the liquid air tank is extracted by the cryogenic pump, and the power consumption is as follows:
where
T1E is the liquid air temperature at the outlet of the liquid air tank, K;
p1E is the pressure of liquid air at the outlet of the liquid air tank, Pa; and
p2E is the pressure of air at the outlet of the cryogenic pump, Pa.
The air then absorbs heat from cold storage tank #2, turning into a gaseous state in the gasification heat exchanger. The air temperature at the outlet of the heat exchanger is as follows:
In heater #1, the air heats to
T4E, and enters expander #1 to produce work. The expansion process is also a polytropic process, where the temperature at the outlet of each expander is as follows:
where
ne is the polytropic index of the expansion process, and
πe is the expansion ratio.
The polytropic efficiency and the polytropic index of the expander is as follows:
The work produced for the unit mass working fluid expansion in the expanders is as follows:
3.3. Cyclic Performance
A complete cycle of the liquefied air energy storage system includes two stages, the liquefied energy storage and the energy released to power generation. The main parameter used to measure the system performance is the system cycle efficiency, also called the round-trip efficiency, which can be expressed as follows:
4. Performance Analysis of an Integrated System of Liquefied Air Energy Storage and Power Generation
MATLAB software is used to program the established models. Referring to the literature [
27], the basic operating parameters of the liquefied air energy storage and power generation system are shown in
Table 1.
REFPROP (Reference Fluid Thermodynamic and Transport Properties Database) is an internationally recognized physical property calculation software developed by the National Institute of Standards and Technology (NIST). The properties of the working fluid at each point labeled in the system are generated by the NIST REFPROP database. For the air liquefied process and the electric generation process, the values of these points are shown in
Table 2 and
Table 3, respectively.
4.1. Outlet Pressure of Compressor (p4L)
The work consumption of the compressor is associated with the number of compression stages and the compression mode at the identical rated isentropic efficiency of compressor, and the same heat exchanger effectiveness. Theoretically, the isothermal compression process has a minimum work consumption, while the adiabatic compression process has a maximum work consumption. The isothermal compression process can be approached if the number of compression stages is increased infinitely, and if internal coolers are put between the stages.
In fact, the number of compression stages are limited, as increasing the number will cause a more complicated system configuration and will result in greater irreversible losses, such as mechanical friction and flow resistance. According to the thermodynamic theory, for the multi-stage compression process, the compression work consumption will be at a minimum if the compressors of the different stages adopt identical pressure ratios.
For the aforementioned, two-stage compression and intermediate cooling is adopted.
Figure 2 shows the relationship between the outlet pressure of the compressor unit (
p4L) to the work of compression, work of expansion, and cycle efficiency.
In
Figure 2, with the increasing compressor outlet pressure (
p4L), the compression work and the expansion work both increase, but, the expansion work increases more slowly. However, the cycle efficiency of the system gradually decreases.
The increment of the compression work because of the increase in the compression pressure ratio. Equations (2) and (4) indicate that the greater the compression pressure ratio, the higher the compressor outlet temperature. This means that the specific compression work increases. The elevation of the compressor outlet temperature results in a higher temperature of the heat storage medium, which also increases the heating temperature of the air in the electric power generation process.
According to Equation (12), a higher inlet air temperature of the expander means a higher specific work output. However, the air cannot be liquefied completely, therefore the liquefaction rate cannot reach 100%. It can be seen from the conservation of energy, that the heat collected during the compression process is not fully used in the release phase, so the increase of the expansion work is slower than that of the compression work, resulting in a decrease in the cycle efficiency. Therefore, the outlet pressure of the compressor unit (p4L) should not be too high.
4.2. Outlet Pressure of the Cryogenic Pump
The cryogenic pump is a special pump that leads liquid air from the liquid air tank to the gasification heat exchanger for gasification. The outlet pressure of the cryogenic pump is treated as the inlet pressure of the expander, ignoring the flowing pressure loss of the air in the heat exchangers and the pipelines. The inlet air pressure and the temperature of the expander are the primary parameters that determine the expansion work with the condition of the constant air flow. Therefore, the inlet air pressure and temperature of the expander should be increased as much as possible, in order to increase the output expansion work.
According to basic thermodynamic principles, for the multi-stage expansion process, the expansion work reaches its maximum at the identical expansion ratio for each stage. Therefore, two-stage expansion and inter-stage reheating expansion modes are adopted in this paper. The inter-stage reheater is used to elevate the inlet air temperature of the next stage expander and the efficiency of the expander unit.
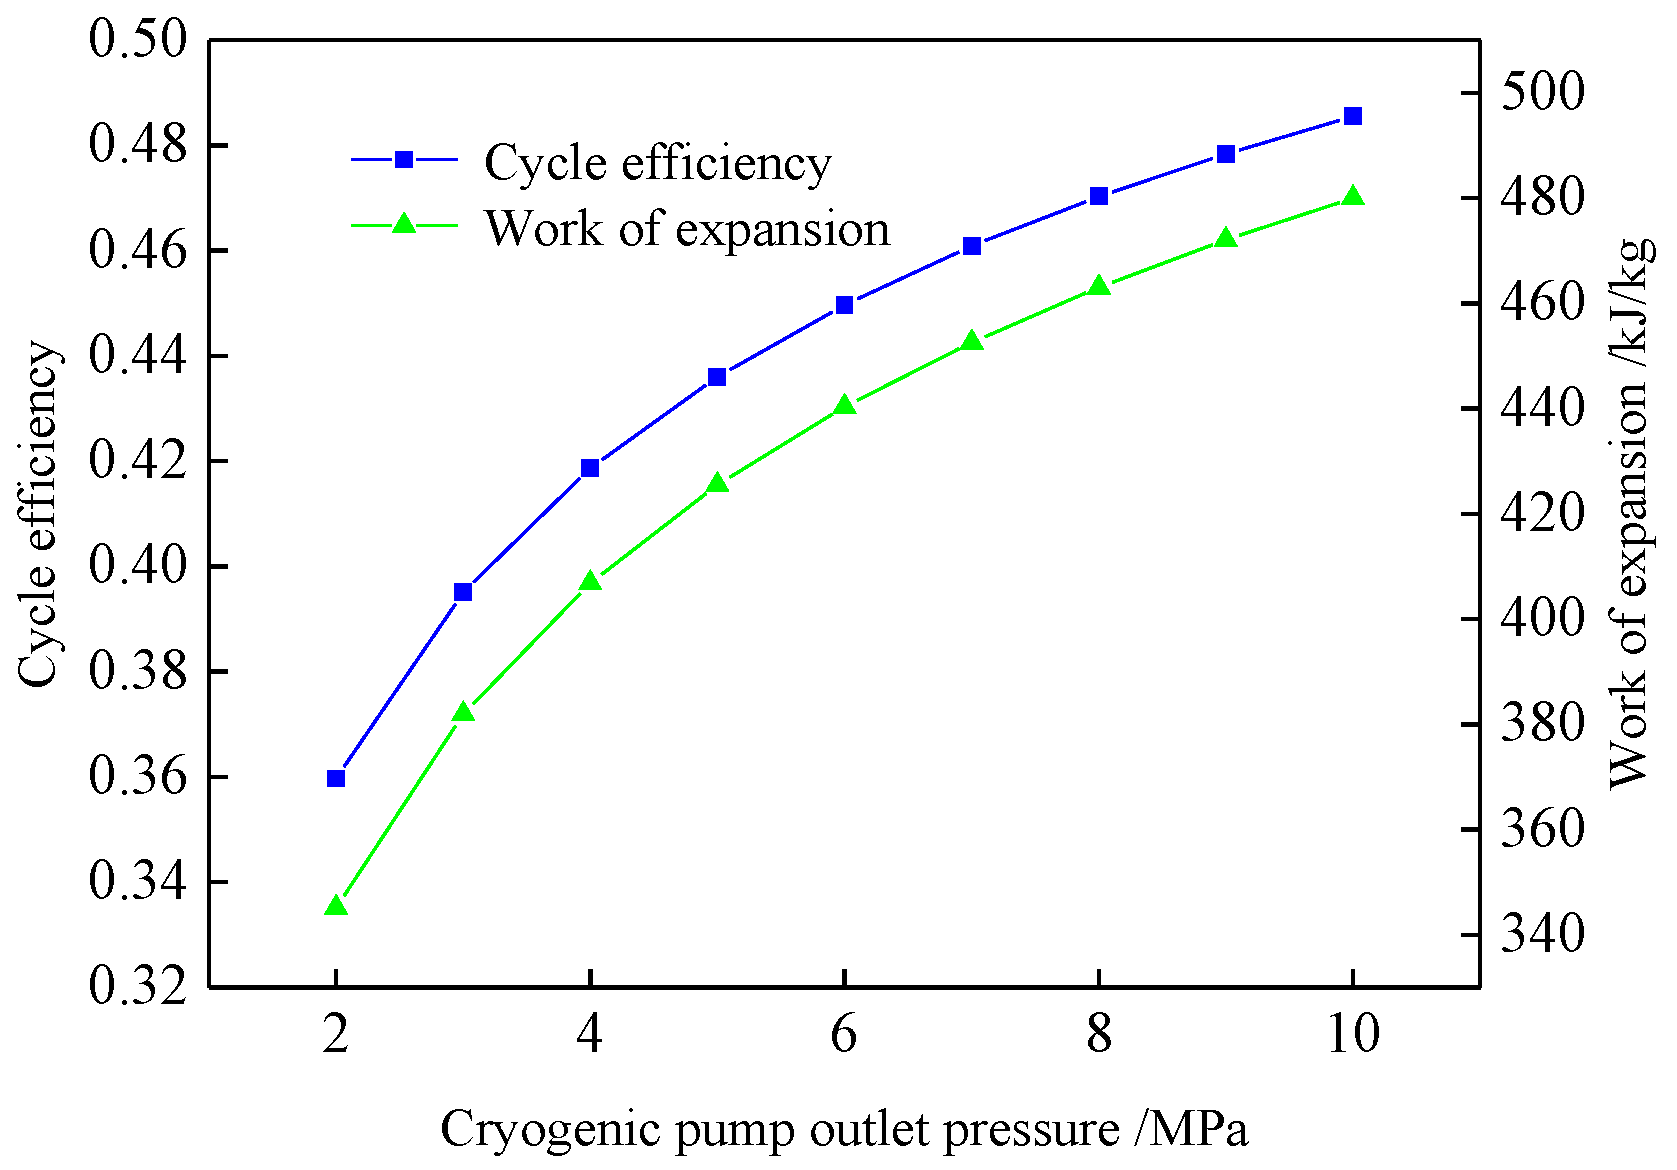
Figure 3 shows the expansion work and cycle efficiency to the outlet pressure of the cryogenic pump.
As shown in
Figure 3, the cycle efficiency and the expansion work increase in a similar way to the increase of the outlet pressure of the cryogenic pump. For example, when the outlet pressure of the cryogenic pump boosts from 2 MPa to 5 MPa, the cycle efficiency increases from 36% to 44%, and the expansion work increases from 345 kJ/kg to 425 kJ/kg.
According to the basic principles of thermodynamics, the higher the pressure and temperature before the air enters the expander, the more work is output during the expansion process. Increasing the outlet pressure of the cryogenic pump is equivalent to increasing the pressure at the inlet of the expander. Theoretically, augmenting the outlet pressure of the cryogenic pump is beneficial for improving the cycle efficiency of the system. However, in reality, the outlet pressure of the cryogenic pump is limited, considering the harm of the high pressure on the equipment.
4.3. Heat Exchanger Effectiveness
Heat storage and cold storage tanks, as well as other heat exchangers are used to guarantee the independent operation of the liquid air storage and electric power generation processes. These heat exchangers have the capacity to provide cooling or heating at any time during single or two-phase processes.
The heat exchanger effectiveness is the maximum actual heat transfer.
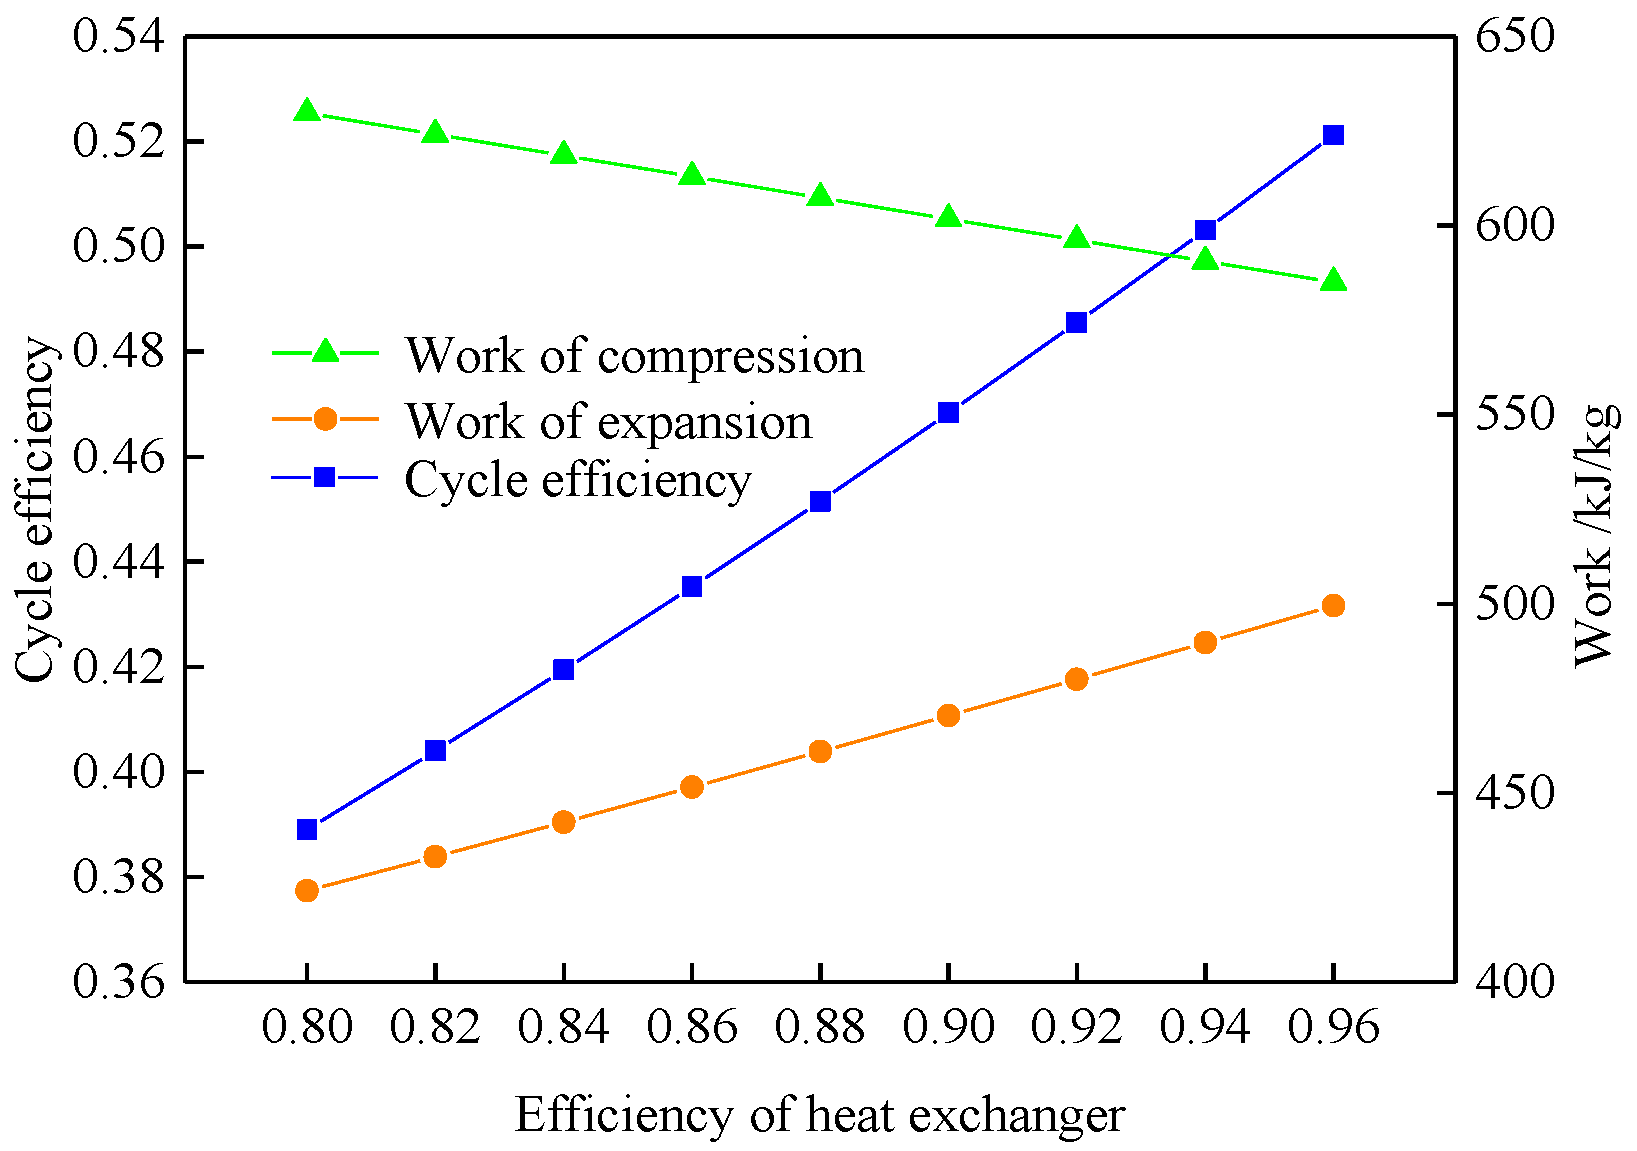
Figure 4 shows the heat exchanger effectiveness compared to the compression work, expansion work, and the cycle efficiency, supposing that heater #1, heater #2, cooler #1, and cooler #2 have an identical heat exchanger effectiveness.
With the constant outlet pressure of the compressor unit and inlet pressure of the expander unit, increasing the heat exchanger effectiveness will greatly decrease the compression work consumed, increase the expansion work, and the cycle efficiency.
In
Figure 4, when the heat exchanger effectiveness increases from 0.8 to 0.96, the compression work decreases from 630 kJ/kg to 585 kJ/kg, the expansion work increases from 425 kJ/kg to 500 kJ/kg, and the cycle efficiency increases from about 39% to around 52%.
According to the above analysis data, as the heat exchanger effectiveness increases, the compression work decreases and the expansion work increases, so the cycle efficiency of the system increases. This result also conforms to the basic principles of thermodynamics. Therefore, a larger heat exchanger effectiveness means better heat transfer effects. Where possible, a higher heat exchanger effectiveness should be applied.
4.4. Temperature and Pressure before Air Throttling
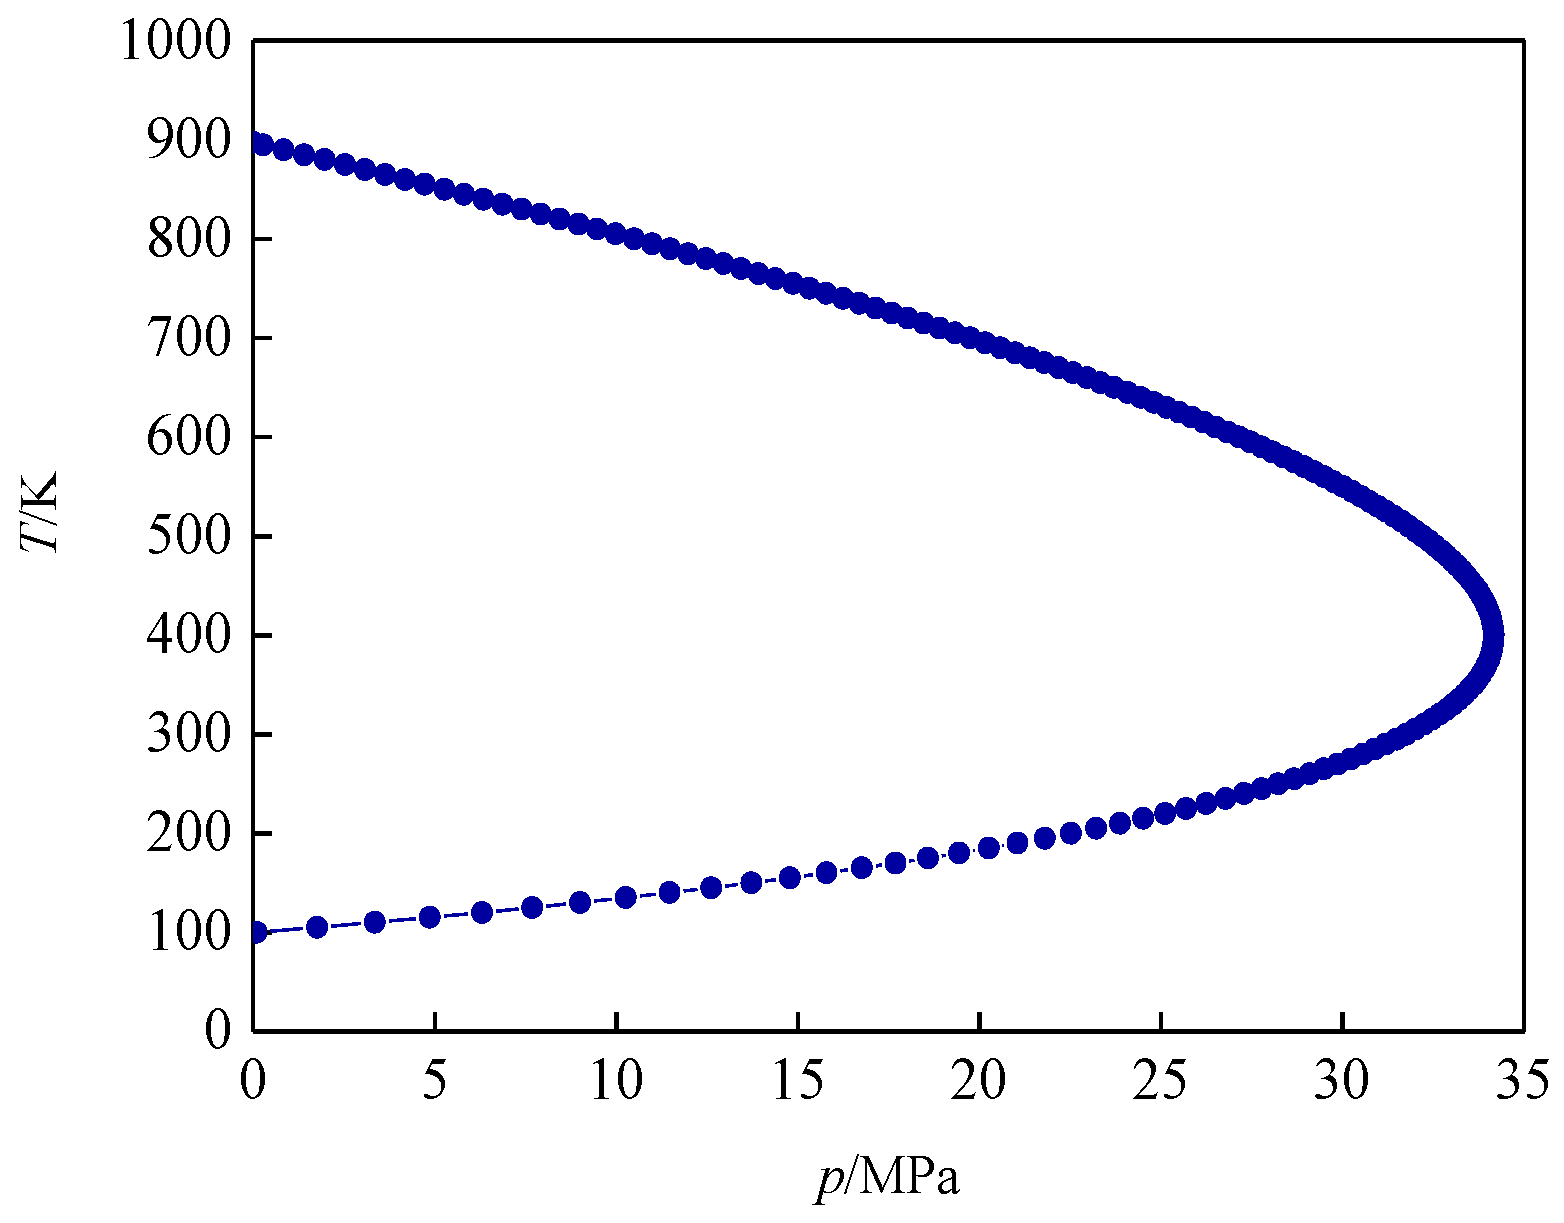
Figure 5 is the inversion curve of air. The regions of cooling and heating are clearly shown on the temperature pressure coordinates. If a maximum inversion pressure exists with an initial air pressure greater than this pressure, it will raise the temperature of the air.
Only if the initial pressure and temperature fall into the cooling zone, will the air lower its temperature by throttling. The envelope of the cooling zone is the inversion curve. In
Figure 5, the pressure of the air before throttling should be smaller than the maximum inversion pressure, which is 34.16 MPa for air.
The envelope temperature, which is larger than the corresponding temperature of the maximum inversion pressure, is the upper part of the inversion curve. The lower part of the inversion curve is the boundary of the heating and cooling regions for temperatures below the corresponding temperature of the maximum inversion pressure. The temperature of the air before throttling must be in the envelope of the upper as well as the in the lower inversion curve.
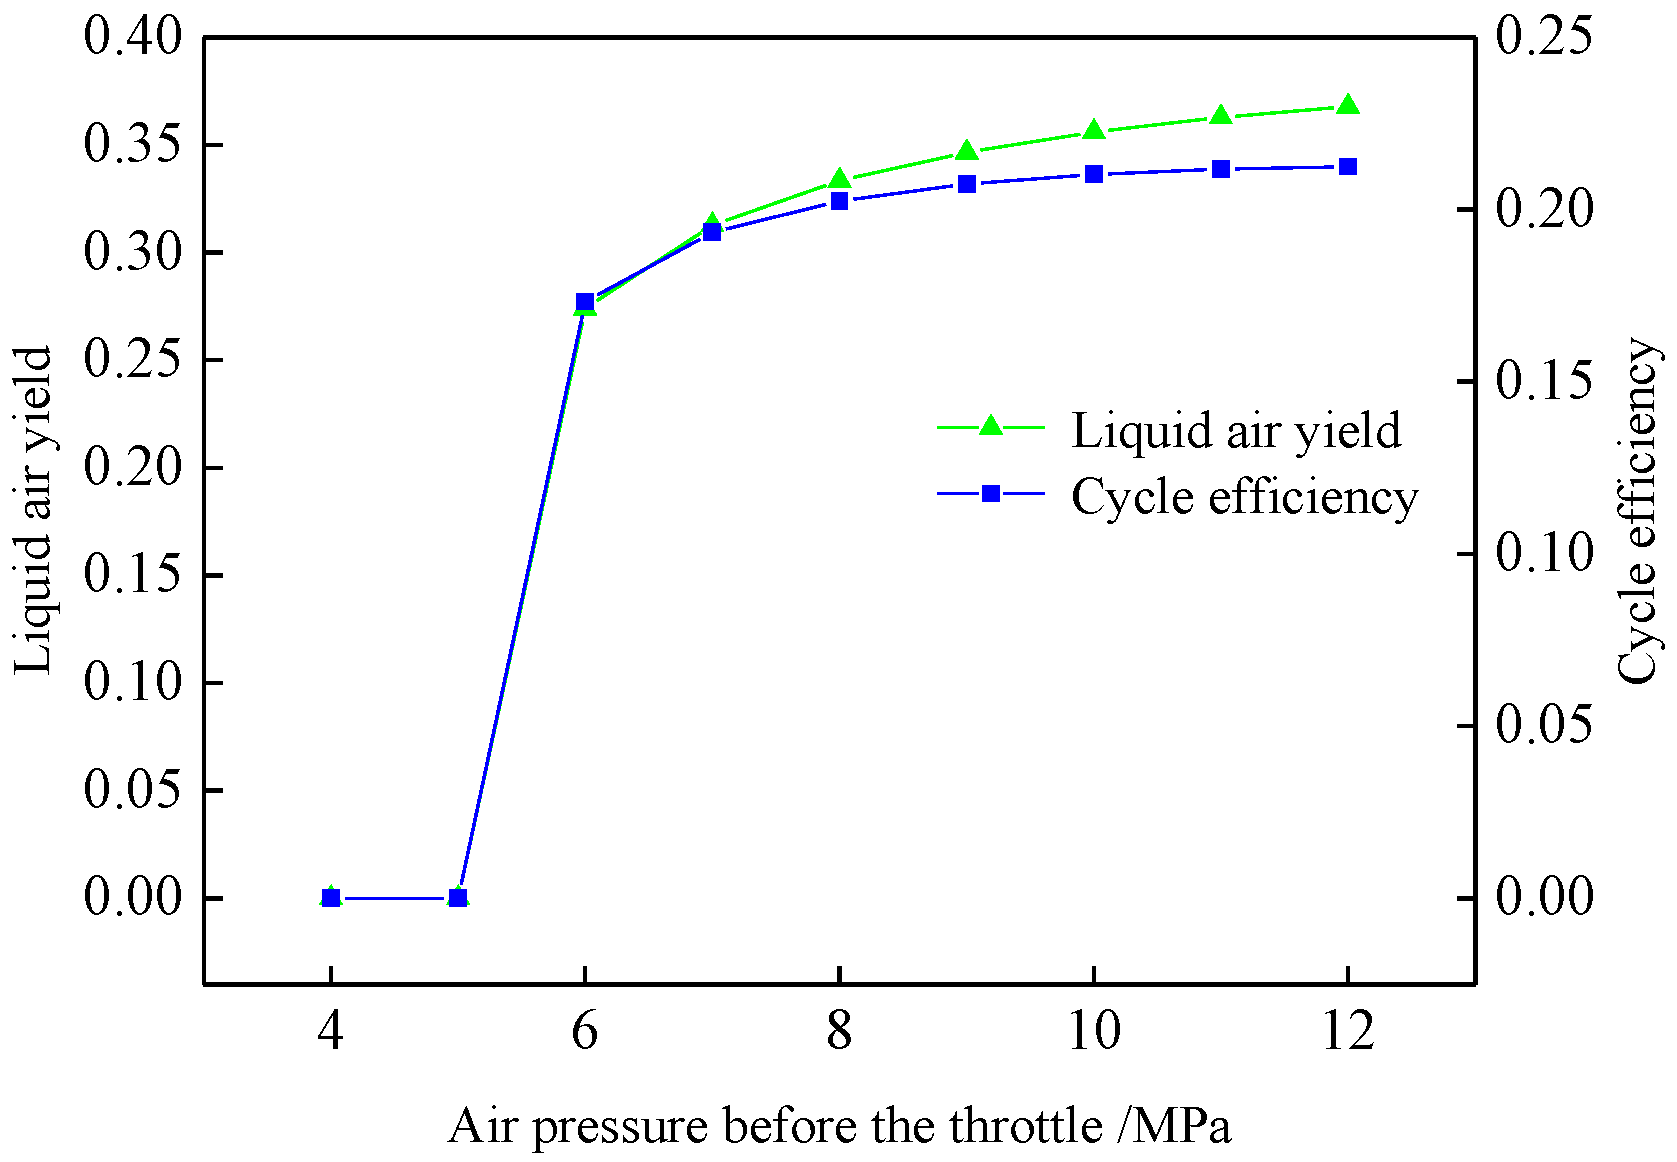
The end state of the air expansion always falls into the two-phase liquid–vapor region, which means that only a fraction of the gas expanded in this region is liquefied. The liquid air yield ratio and the system cycle efficiency with respect to the temperature and pressure of the air before throttling, are shown in
Figure 6 and
Figure 7, assuming that the air is throttled down to atmospheric pressure. The initial pressure and temperature are 10 MPa and 140 K, respectively.
In
Figure 6, when the pressure is under 10 MPa, the air temperature before air throttling is 75 K, the liquid air yield ratio is close to 100%, and the cycle efficiency is close to 60%. If the air temperature is increased from 75 K to 155 K, the liquid air yield ratio and the system cycle efficiency decrease monotonically.
Therefore, the lower the temperature before air throttling, the higher the liquid air yield ratio and the cycle efficiency after expansion. In field conditions, the air temperature before the throttling should be as low as possible.
From
Figure 7, we can see that both the liquid air yield ratio and the system cycle efficiency are 0 in the 5 MPa and 140 K initial state. When raising the pressure from 5 MPa to 6 MPa while keeping the temperature stable, the liquid air yield ratio and system cycle efficiency increase rapidly.
Then, the liquid air yield ratio and system cycle efficiency increase gradually from 6 MPa to 12 MPa. As shown in
Figure 5, the maximum inversion pressure of the air is 34.16 MPa, so the pressure before throttling must be less than the maximum inversion pressure, in order to ensure a cold effect after throttling.
From
Figure 6 and
Figure 7, for air at a temperature of 140 K, it is necessary to increase its pressure to at least 6 MPa in order for it to liquefy.
According to the above analysis, the pressure before air throttling has a significant influence on the liquid air yield ratio and the system cycle efficiency. Higher pressures and lower temperatures before air throttling are beneficial for increasing the liquid air yield ratio and the system cycle efficiency.
5. Conclusions
For an integrated system of liquefied air energy storage and electricity production, a mathematical model of the energy storage stage, energy release stage, and cycle parameter calculation has been established, based on thermodynamic principles. Using the cycle efficiency and the liquid air yield ratio as evaluation indexes, the influence of the outlet pressure of the compressor unit (p4L), the outlet pressure of the cryogenic pump, the heat exchanger effectiveness, the air temperature and pressure before throttling on the performance of integrated system of liquefied air energy storage, and electricity generation are discussed. The following conclusions have been obtained:
When raising the outlet pressure of the compressor unit (p4L), both the compression work and the expansion work are increased. However, the air is not completely liquefied. The heat collected during the compression process is not fully used in the energy release phase, so the increase of the expansion work is slower than that of the compression work, resulting in a decrease in the cycle efficiency.
After the air is taken out of the liquid air tank, the pressure is increased by the cryogenic pump. The increased air pressure of the cryogenic pump is equivalent to an increase in the air pressure at the inlet of the expander, which increases the expansion work. In this process, the consumption work of the cryogenic pump is much less than the increase in the expansion work, so the system cycle efficiency increases. A larger heat exchanger effectiveness means a better heat transfer effect. Therefore, increasing the outlet pressure of the cryogenic pump and the heat exchanger effectiveness can significantly increase the cycle efficiency of the system.
According to the air inversion curve, the maximum inversion pressure of air is 34.16 MPa, so the pressure before throttling must be less than the maximum inversion pressure, in order to ensure the cold effect after throttling. Under the premise of not exceeding the maximum air inversion pressure, the higher the air pressure and the lower the air temperature before throttling, the greater the liquid air yield ratio after throttling, and the higher the system cycle efficiency.
Author Contributions
Y.X. proposed the research direction, the adaptive method, and the system model. X.X. completed the establishment of the mathematical model of the system, programming with MATLAB, mapping with Origin, and data analysis. X.X. wrote the paper.
Funding
This research received no external funding.
Acknowledgments
This paper was supported by the Natural Science Foundation of Hebei Province (E2014502085).
Conflicts of Interest
The authors declare no conflicts of interest.
References
- Sciacovelli, A.; Vecchi, A.; Ding, Y. Liquid air energy storage (LAES) with packed bed cold thermal storage–From component to system level performance through dynamic modelling. Appl. Energy 2017, 190, 84–98. [Google Scholar] [CrossRef]
- Liu, J.; Xia, H.D.; Chen, H.S.; Tan, C.Q.; Xu, Y.J. A novel energy storage technology based on liquid air and ITS application in wind power. J. Eng. Thermophys. 2010, 31, 1993–1996. [Google Scholar]
- Otsuki, T. Costs and benefits of large-scale deployment of wind turbines and solar PV in Mongolia for international power exports. Renew. Energy 2017, 108, 321–335. [Google Scholar] [CrossRef]
- Shi, K.; Xu, P.; Wan, Z.; Zhao, D. Grid-connected dual stator-winding induction generator wind power system for wide wind speed ranges. J. Power Electron. 2016, 16, 1455–1468. [Google Scholar] [CrossRef]
- Fan, X.C.; Wang, W.Q.; Shi, R.J.; Li, F.T. Analysis and countermeasures of wind power curtailment in China. Renew. Sustain. Energy Rev. 2015, 52, 1429–1436. [Google Scholar] [CrossRef]
- Ferreira, H.L.; Garde, R.; Fulli, G.; Kling, W.; Lopes, J.P. Characterisation of electrical energy storage technologies. Energy 2013, 53, 288–298. [Google Scholar] [CrossRef]
- Pazheri, F.R.; Othman, M.F.; Al-Ammar, E.A.; Safoora, O.K. Clean and efficient power dispatch at hybrid power plant with energy storage. In Proceedings of the IEEE Power & Energy Society General Meeting, Denver, CO, USA, 26–30 July 2015; pp. 1–5. [Google Scholar]
- Guizzi, G.L.; Manno, M.; Tolomei, L.M.; Vitali, R.M. Thermodynamic analysis of a liquid air energy storage system. Energy 2015, 93, 1639–1647. [Google Scholar] [CrossRef]
- Weiji, H.; Changfu, Z.; Chen, Z.; Zhang, L. Estimation of cell SOC evolution and system performance in module-based battery charge equalization systems. IEEE Trans. Smart Grid 2018. [Google Scholar] [CrossRef]
- Zou, C.; Zhang, L.; Hu, X.; Wang, Z.; Wik, T.; Peche, M. A review of fractional-order techniques applied to lithium-ion batteries, lead-acid batteries, and supercapacitors. J. Power Sour. 2018, 390, 286–296. [Google Scholar] [CrossRef]
- Bianch, G.; Cipollone, R. Theoretical modeling and experimental investigations for the improvement of the mechanical efficiency in sliding vane rotary compressors. Appl. Energy 2015, 142, 95–107. [Google Scholar] [CrossRef]
- Marchionni, M.; Bianchi, G.; Tassou, S.A. Techno-economic assessment of Joule-Brayton cycle architectures for heat to power conversion from high-grade heat sources using CO2, in the supercritical state. Energy 2018, 148, 1140–1152. [Google Scholar] [CrossRef]
- Evans, A.; Strezov, V.; Evans, T.J. Assessment of utility energy storage options for increased renewable energy penetration. Renew. Sustain. Energy Rev. 2012, 16, 4141–4147. [Google Scholar] [CrossRef]
- Rodrigues, E.M.G.; Godina, R.; Santos, S.F.; Bizuayehu, A.W.; Contreras, J.; Catalão, J.P.S. Energy storage systems supporting increased penetration of renewables in islanded systems. Energy 2014, 75, 265–280. [Google Scholar] [CrossRef]
- Budt, M.; Wolf, D.; Span, R.; Yan, J. Compressed air energy storage—An option for medium to large scale electrical-energy storage. Energy Procedia 2016, 88, 698–702. [Google Scholar] [CrossRef]
- Klumpp, F. Potential for large scale energy storage technologies—Comparison and ranking including an outlook to 2030. Energy Procedia 2015, 73, 124–135. [Google Scholar] [CrossRef]
- Xu, Y.; Chen, H.; Liu, J.; Tan, C. Performance analysis on an integrated system of compressed air energy storage and electricity production with wind-solar complementary method. Proc. CSEE 2012, 32, 88–95. [Google Scholar]
- Brett, G.; Barnett, M. The application of liquid air energy storage for large scale long duration solutions to grid balancing. In Proceedings of the EDP Sciences, Budapest, Hungary, 27 October 2014. [Google Scholar]
- Antonelli, M.; Desideri, U.; Giglioli, R.; Paganucci, F.; Pasini, G. Liquid air energy storage: A potential low emissions and efficient storage system. Energy Procedia 2016, 88, 693–697. [Google Scholar] [CrossRef]
- Xue, X.D.; Wang, S.X.; Zhang, X.L.; Cui, C.; Chen, L.B.; Zhou, Y.; Wang, J.J. Thermodynamic analysis of a novel liquid air energy storage system. Phys. Procedia 2015, 67, 733–738. [Google Scholar] [CrossRef]
- Morgan, R.; Nelmes, S.; Gibson, E.; Brett, G. Liquid air energy storage: Analysis and first results from a pilot scale demonstration plant. Appl. Energy 2015, 137, 845–853. [Google Scholar] [CrossRef]
- Chino, K.; Araki, H. Evaluation of energy storage method using liquid air. Heat Tran. Asian Res. 2015, 29, 347–357. [Google Scholar] [CrossRef]
- Li, Y.; Cao, H.; Wang, S.; Jin, Y.; Li, D.; Wang, X.; Ding, Y. Load shifting of nuclear power plants using cryogenic energy storage technology. Appl. Energy 2014, 113, 1710–1716. [Google Scholar] [CrossRef]
- Span, R.; Lemmon, E.W.; Jacobsen, R.T.; Wagner, W.; Yokozeki, A. A reference equation of state for the thermodynamic properties of nitrogen for temperatures from 63.151 to 1000 K and Pressures to 2200 MPa. J. Phys. Chem. Ref. Data 2000, 29, 1361–1433. [Google Scholar] [CrossRef]
- Schmidt, R.; Wagner, W. A new form of the equation of state for pure substances and its application to oxygen. Fluid Ph. Equilibria 1985, 19, 175–200. [Google Scholar] [CrossRef]
- Borri, E.; Tafone, A.; Romagnoli, A.; Comodi, G. A preliminary study on the optimal configuration and operating range of a “microgrid scale” air liquefaction plant for Liquid Air Energy Storage. Energy Convers. Manag. 2017, 143, 275–285. [Google Scholar] [CrossRef]
- She, X.; Peng, X.; Nie, B.; Leng, G.; Zhnag, X.; Weng, L.; Tong, L.; Zheng, L.; Wang, L.; Ding, Y. Enhancement of round trip efficiency of liquid air energy storage through. Appl. Energy 2017, 206, 1632–1642. [Google Scholar] [CrossRef]
© 2018 by the authors. Licensee MDPI, Basel, Switzerland. This article is an open access article distributed under the terms and conditions of the Creative Commons Attribution (CC BY) license (http://creativecommons.org/licenses/by/4.0/).


