Statistics to Detect Low-Intensity Anomalies in PV Systems
Abstract
:1. Introduction
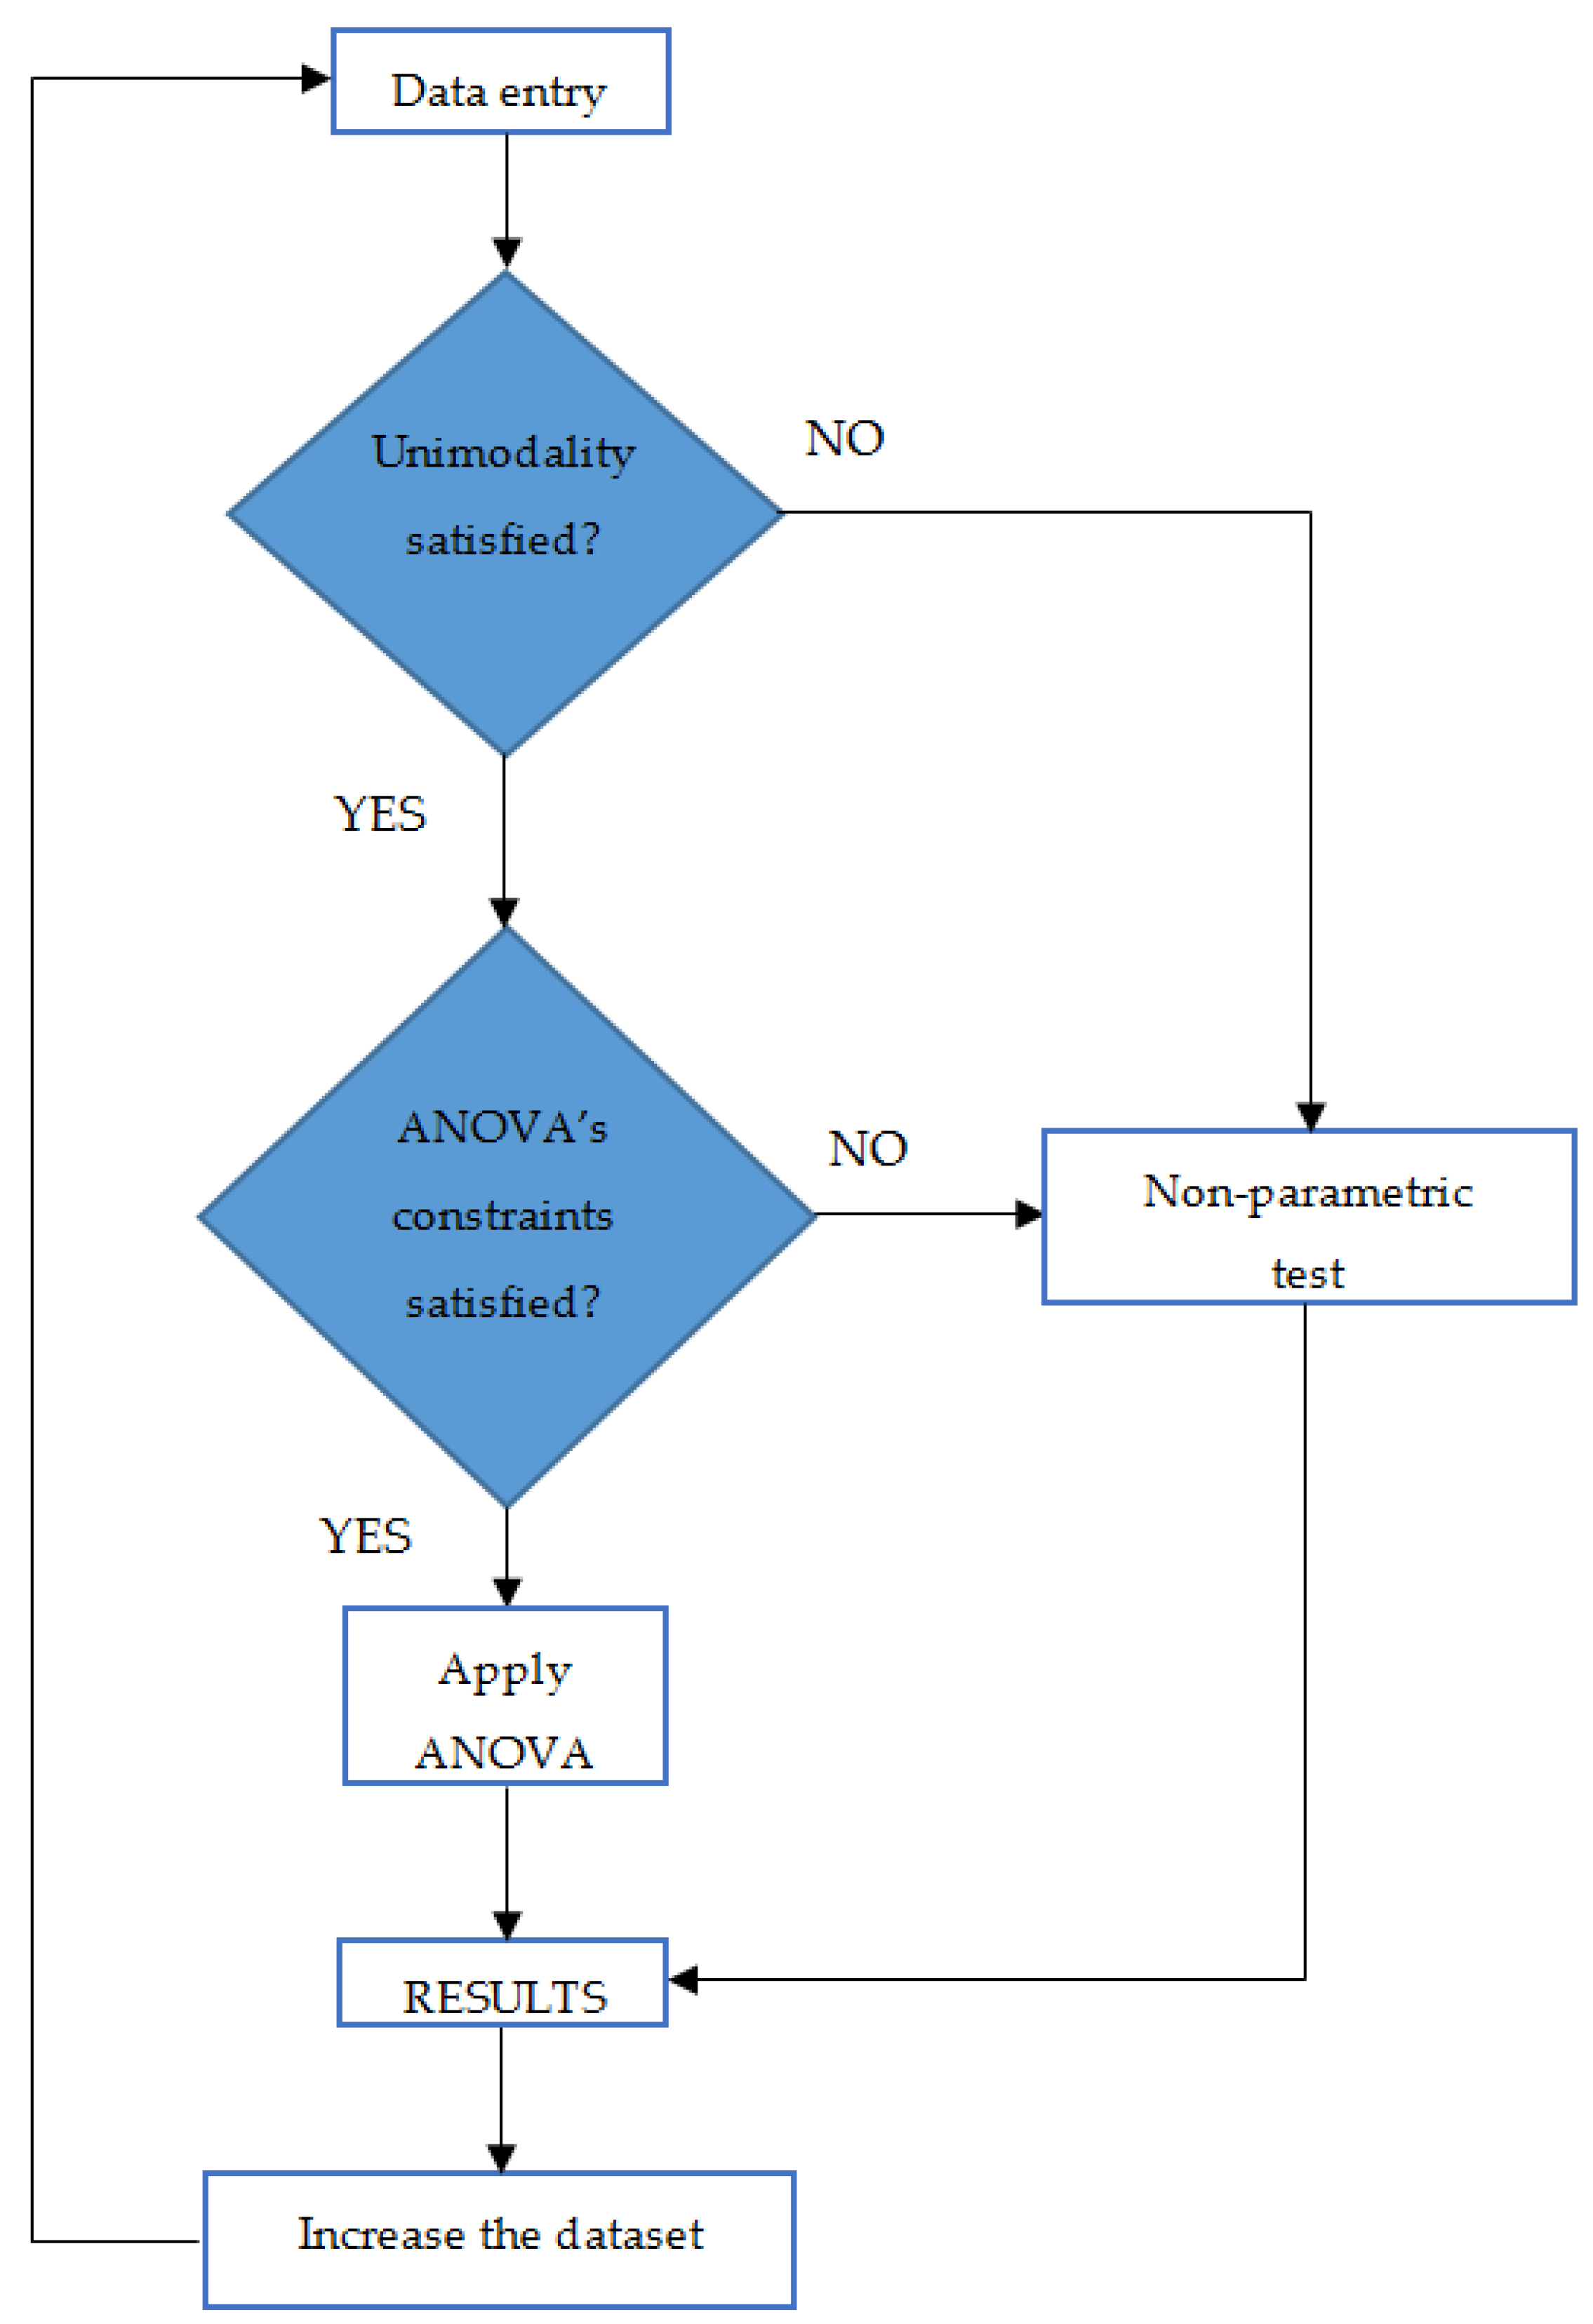
2. Statistics-Based Procedure
- (a)
- equal variance for all the distributions;
- (b)
- all the distributions are gaussian; and,
- (c)
- all of the observations are independent each other.
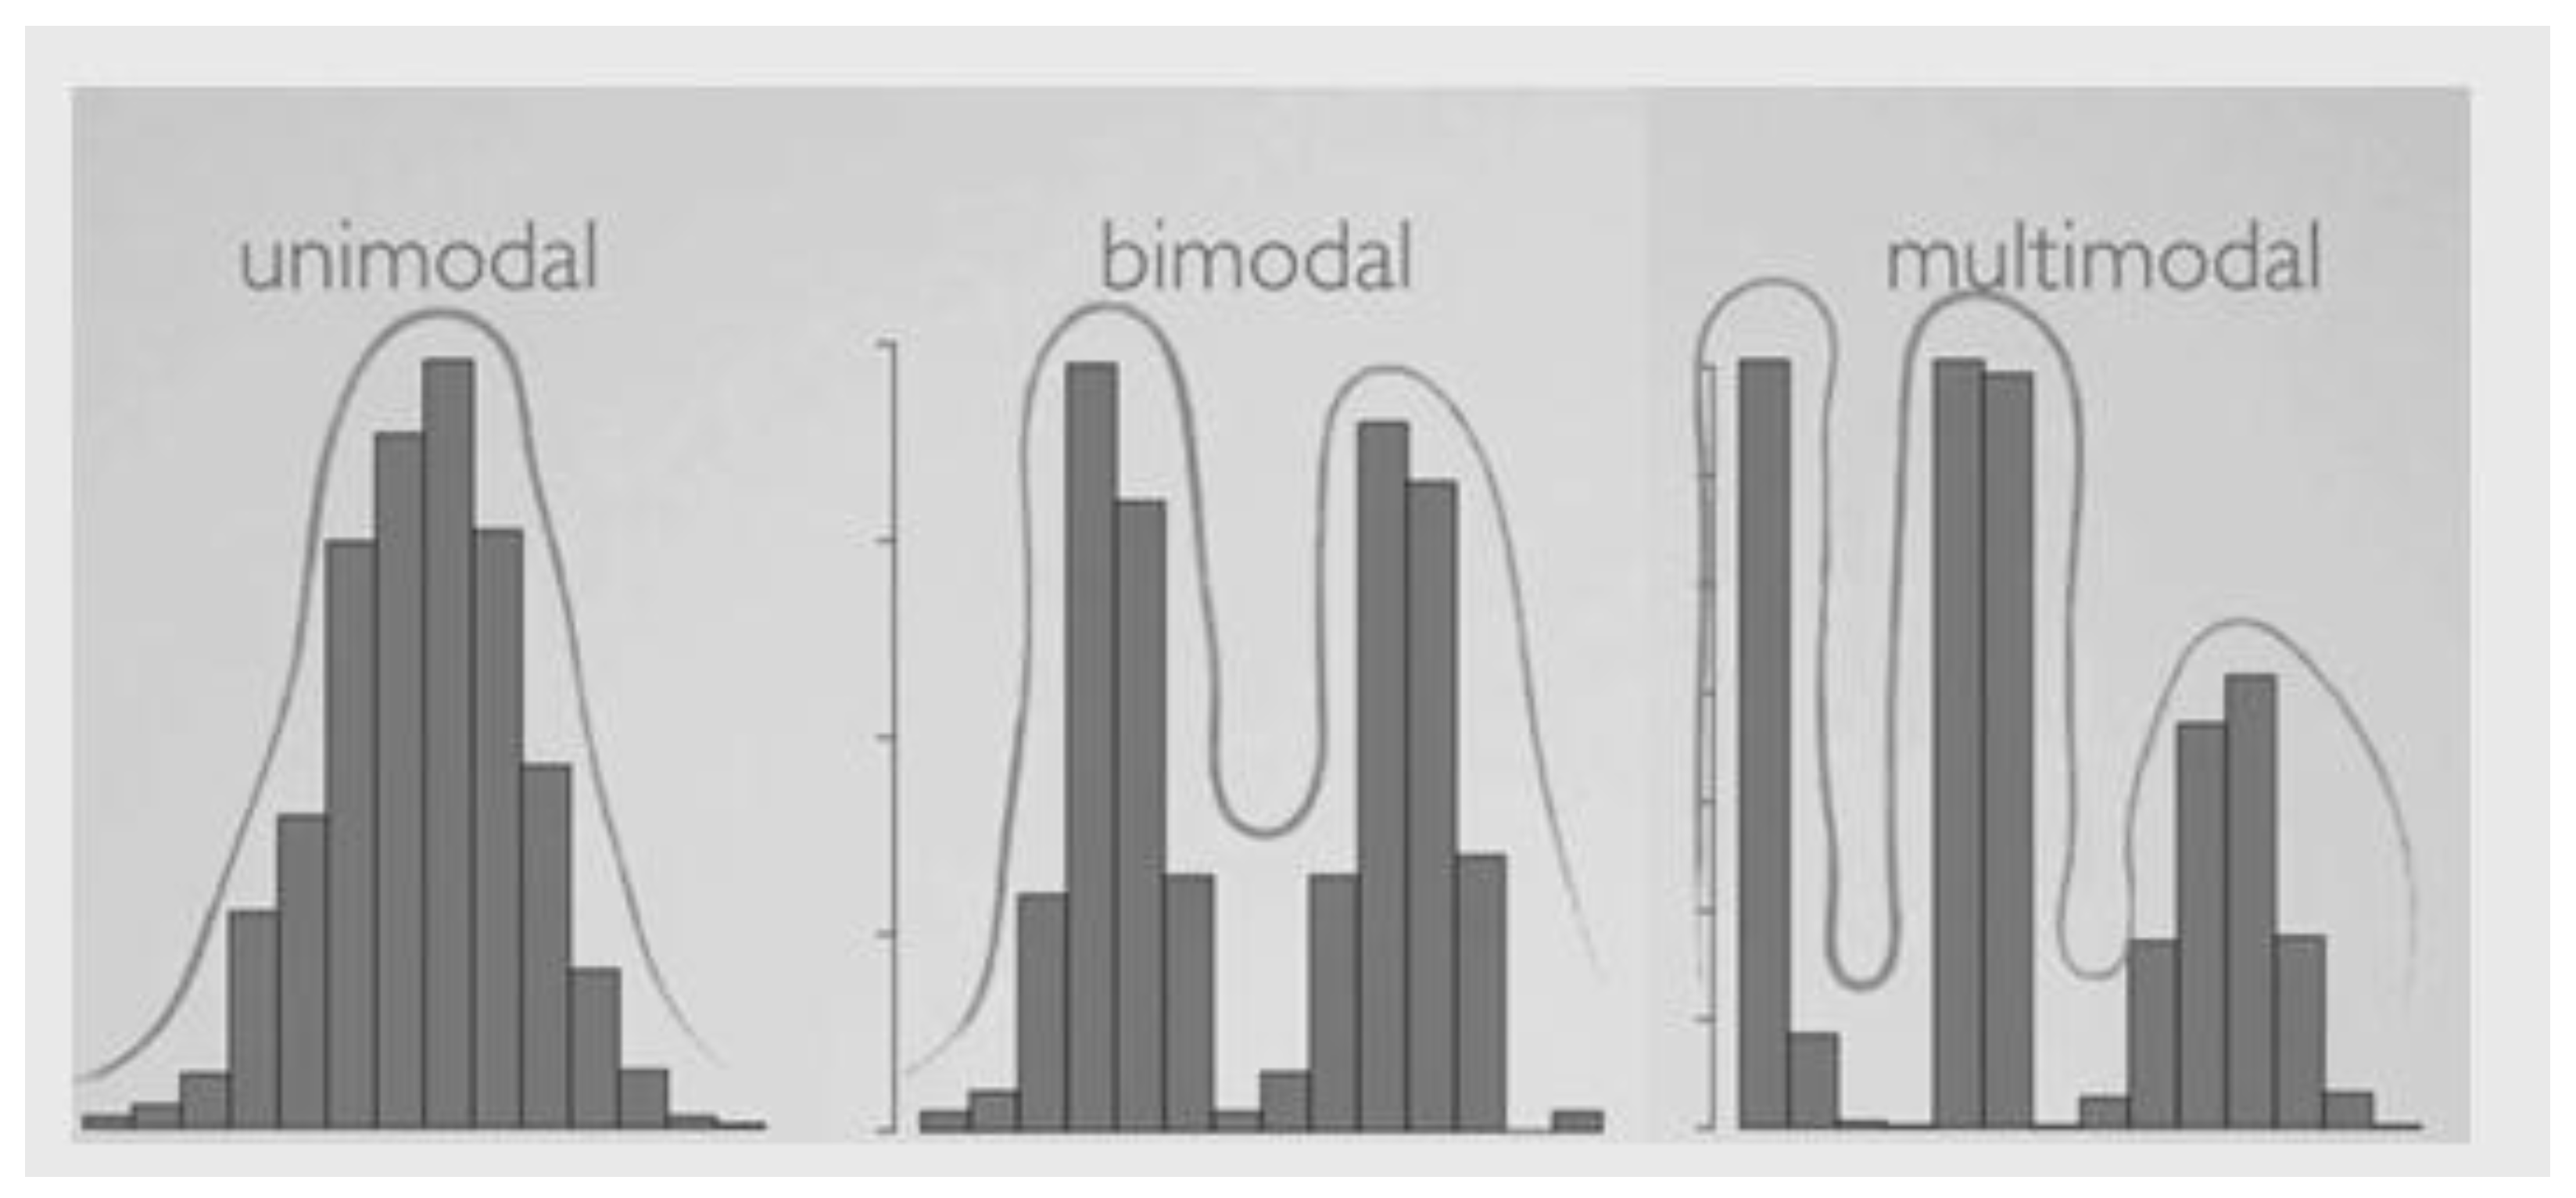
- the distribution is gaussian;
- the data are spread out more to the right of the mean than to the left; and,
- the data are spread out more to the left.
- the distribution is gaussian;
- the distribution is less outlier-prone than the gaussian one; and,
- the distribution is more outlier-prone than the gaussian one.
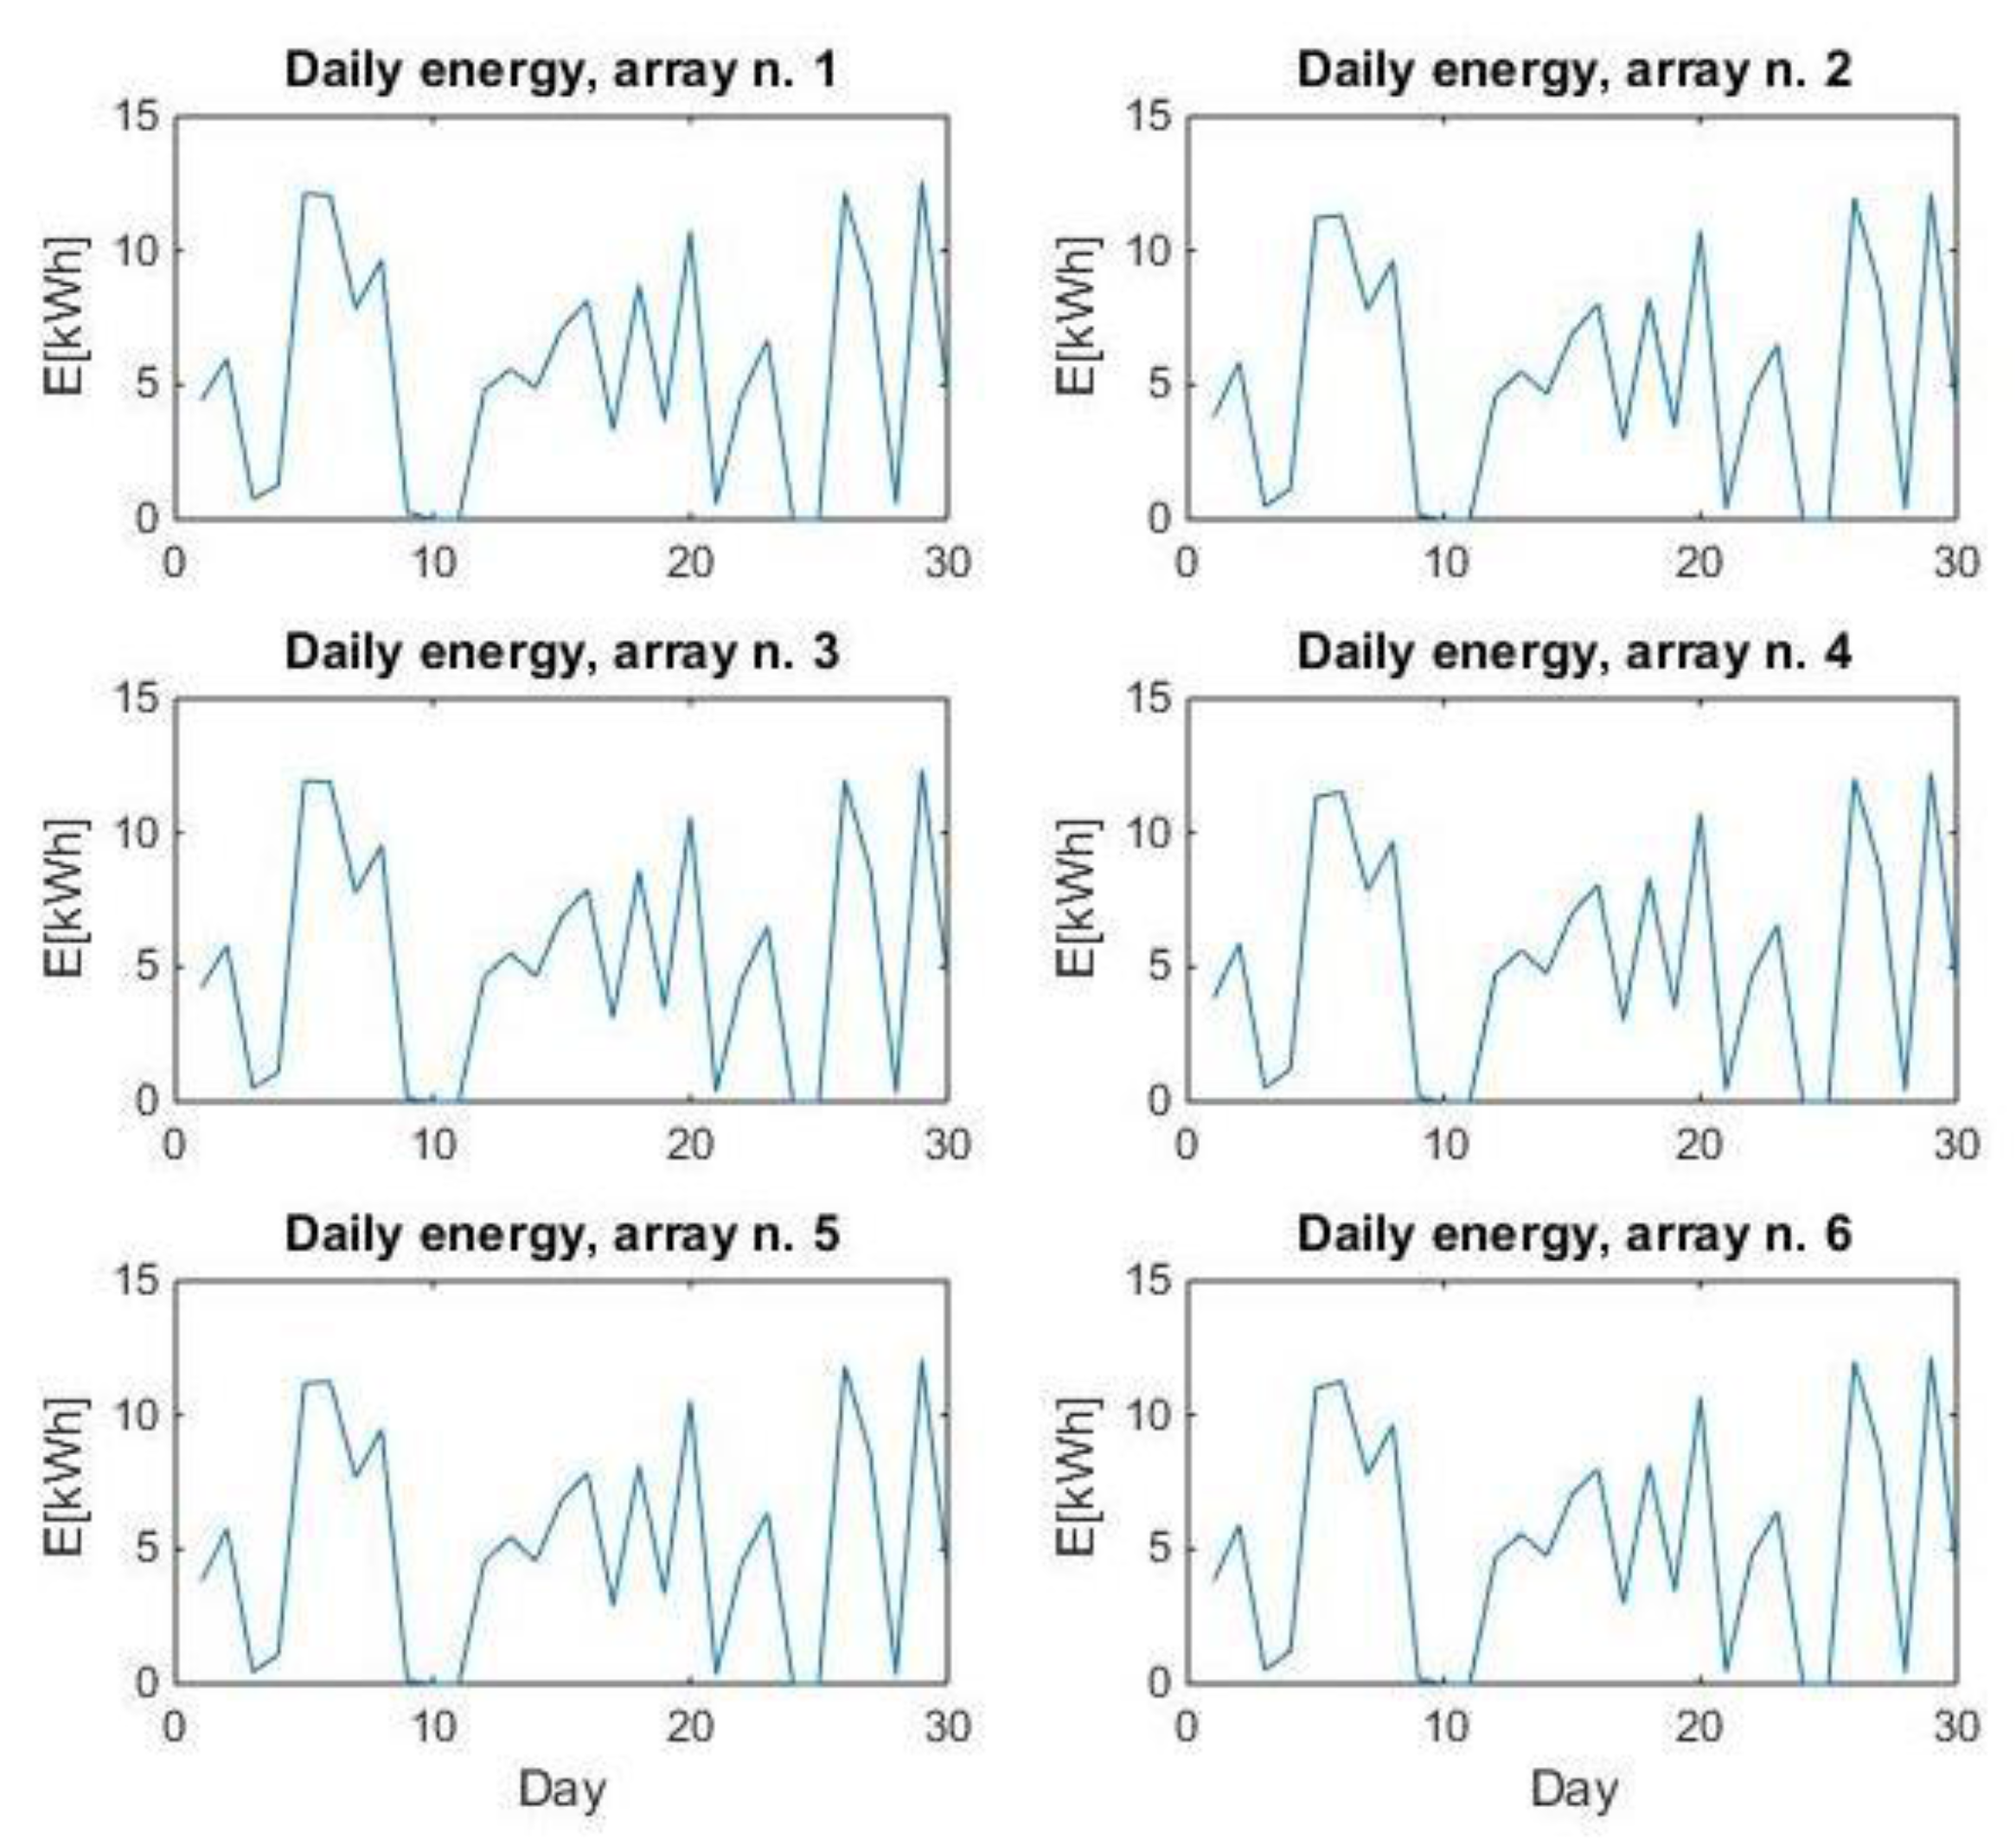
3. Case Study
4. Cumulative Statistical Analysis
- monthly analysis (January);
- quarterly analysis (January–March); and,
- yearly analysis (January–December).
- mean, median, variance and relative spreads of each array, in order to verify whether any large failure is present;
- skewness and kurtosis values, in order to evaluate the unimodality U or U* of the k distributions, and also to quantify the mismatches with respect to a gaussian distribution; and,
- p-value, as explained in Section 2, having fixed α = 0.05.
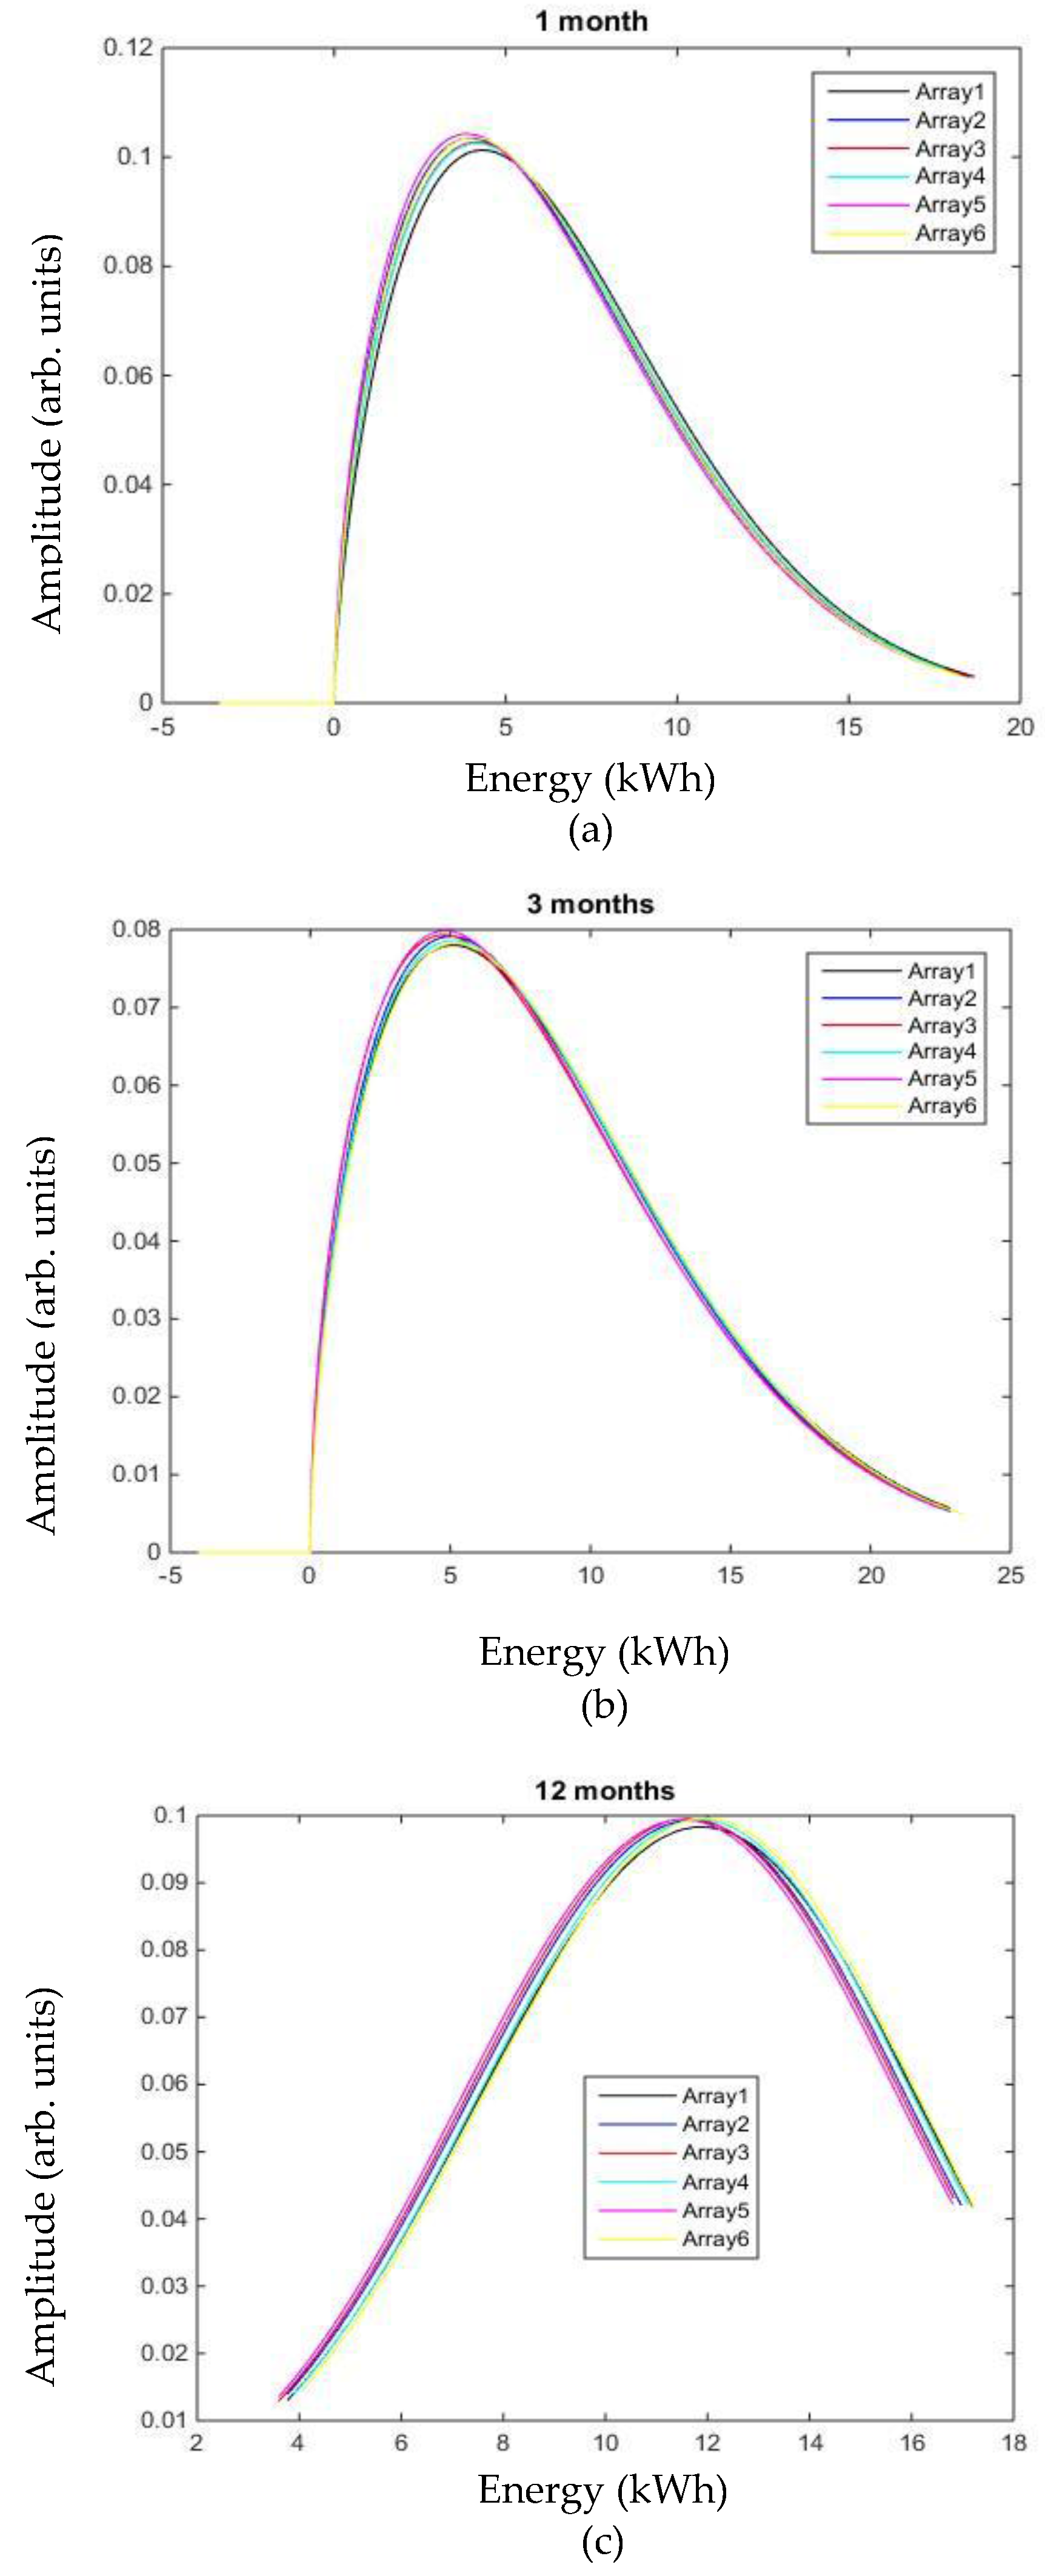
4.1. Monthly Analysis (January)
- p-value > 0.05, so the null hypothesis H0 in (1) cannot be refused; and,
- 1-p-value < 0.05, so the alternative hypothesis that at least one distribution has the mean different from the other ones has to be rejected.
4.2. Quarterly Analysis (January–March)
4.3. Yearly Analysis (January–December)
- p-value > 0.05, so the null hypothesis H0 in (1) cannot be refused; and,
- 1-p-value > 0.05, so neither the alternative hypothesis that at least one distribution has the mean different from the other ones can be rejected.
4.4. Discussion
5. Conclusions
Author Contributions
Conflicts of Interest
References
- Xiao, W.; Ozog, N.; Dundorf, W.G. Topology study of photovoltaic interface for maximum power point tracking. IEEE Trans. Ind. Electron. 2007, 54, 1696–1704. [Google Scholar] [CrossRef]
- Won, J.-M.; Nam, K.-H.; Kwon, B.-H. Photovoltaic power conditioning system with line connection. IEEE Trans. Ind. Electron. 2006, 53, 1048–1054. [Google Scholar]
- Vergura, S. A Complete and Simplified Datasheet-based Model of PV Cells in Variable Environmental Conditions for Circuit Simulation. Energies 2016, 9, 326. [Google Scholar] [CrossRef]
- Koizumi, H.; Mizuno, T.; Kaito, T.; Noda, Y.; Goshima, N.; Kawasaki, M.; Nagasaka, K.; Kurokawa, K. A novel micro controller for grid-connected photovoltaic systems. IEEE Trans. Ind. Electron. 2006, 53, 1889–1897. [Google Scholar] [CrossRef]
- Xiao, W.; Dundorf, W.G.; Palmer, P.R. Antoine Capel, Regulation of photovoltaic voltage. IEEE Trans. Ind. Electron. 2007, 54, 1365–1374. [Google Scholar] [CrossRef]
- Mutoh, N.; Inoue, T. A control method to charge series- connected ultraelectric double- layer capacitors suitable for photovoltaic generation systems combining MPPT control method. IEEE Trans. Ind. Electron. 2007, 54, 374–383. [Google Scholar] [CrossRef]
- Vergura, S. Scalable Model of PV Cell in Variable Environment Condition based on the Manufacturer Datasheet for Circuit Simulation. In Proceedings of the 2015 IEEE 15th International Conference on Environment and Electrical Engineering, Roma, Italy, 10–13 June 2015. [Google Scholar]
- Xiao, W.; Lind, M.G.J.; Dunford, W.G. Antoine Capel, Real-time identification of optimal operating points in photovoltaic power systems. IEEE Trans. Ind. Electron. 2006, 53, 1017–1026. [Google Scholar] [CrossRef]
- Vergura, S.; Pavan, A.M. On the photovoltaic explicit empirical model: Operations along the current-voltage curve. In Proceedings of the 2015 International Conference on Clean Electrical Power, Taormina, Italy, 16–18 June 2015. [Google Scholar]
- Boulanger, P.; Malbranche, P. Photovoltaic system performance statistical analysis. In Proceedings of the 3rd World Conference on Photovoltaic Energy Conversion, Osaka, Japan, 11–18 May 2003. [Google Scholar]
- Takashima, T.; Koyanagi, T.; Otani, K.; Kato, K. Estimation system of in-plane irradiance by regression functions of in-plane/horizontal irradiance ratio vs. Time. In Proceedings of the Photovoltaic Specialists Conference, Lake Buena Vista, FL, USA, 3–7 January 2005. [Google Scholar]
- Paul, D.; Mukherjee, D.; Chaudhuri, S.B. Assessing solar PV behavior under varying environmental conditions—A statistical approach. In Proceedings of the 4th International Conference on Electrical and Computer Engineering ICECE, Dhaka, Bangladesh, 19–21 December 2006. [Google Scholar]
- McSharry, P.E. Assessing Photovoltaic Performance Using Local Linear Quantile Regression. Available online: http://citeseerx.ist.psu.edu/viewdoc/download?doi=10.1.1.146.2683&rep=rep1&type=pdf (accessed on 23 December 2017).
- Takashima, T.; Yamaguchi, J.; Otani, K.; Kato, K.; Ishida, M. Experimental Studies of Failure Detection Methods in PV module strings. In Proceedings of the 2006 IEEE 4th World Conference on Photovoltaic Energy Conversion, Waikoloa, HI, USA, 7–12 May 2006; Volume 2, pp. 2227–2230. [Google Scholar]
- Breitenstein, O.; Rakotoniaina, J.P.; Al Rifai, M.H. Quantitative Evaluation of Shunts in Solar Cells by Lock-In Thermography. Prog. Photovolt. Res. Appl. 2003, 11, 515–526. [Google Scholar] [CrossRef]
- Johnston, S.; Guthrey, H.; Yan, F.; Zaunbrecher, K.; Al-Jassim, M.; Rakotoniaina, P.; Kaes, M. Correlating multicrystalline silicon defect types using photoluminescence, defect-band emission, and lock-in thermography imaging techniques. IEEE J. Photovolt. 2014, 4, 348–354. [Google Scholar] [CrossRef]
- Peloso, M.; Meng, L.; Bhatia, C.S. Combined thermography and luminescence imaging to characterize the spatial performance of multicrystalline Si wafer solar cells. IEEE J. Photovolt. 2015, 5, 102–111. [Google Scholar] [CrossRef]
- Vergura, S.; Marino, F. Quantitative and Computer Aided Thermography-based Diagnostics for PV Devices: Part I—Framework. IEEE J. Photovolt. 2017, 7, 822–827. [Google Scholar] [CrossRef]
- Vergura, S.; Colaprico, M.; de Ruvo, M.F.; Marino, F. A Quantitative and Computer Aided Thermography-based Diagnostics for PV Devices: Part II—Platform and Results. IEEE J. Photovolt. 2017, 7, 237–243. [Google Scholar] [CrossRef]
- Mekki, H.; Mellit, A.; Salhi, H. Artificial neural network-based modelling and fault detection of partial shaded photovoltaic modules. Simul. Model. Pract. Theory 2016, 67, 1–13. [Google Scholar] [CrossRef]
- Silvestre, S.; Kichou, S.; Chouder, A.; Nofuentes, G.; Karatepe, E. Analysis of current and voltage indicators in grid connected PV (photovoltaic) systems working in faulty and partial shading conditions. Energy 2015, 86, 42–50. [Google Scholar] [CrossRef]
- Dellino, G.; Laudadio, T.; Mari, R.; Mastronardi, N.; Meloni, C.; Vergura, S. Energy Production Forecasting in a PV plant using Transfer Function Models. In Proceedings of the 2015 IEEE 15th International Conference on Environment and Electrical Engineering, Roma, Italy, 10–13 June 2015. [Google Scholar]
- Vergura, S.; Acciani, G.; Amoruso, V.; Patrono, G.; Vacca, F. Descriptive and Inferential Statistics for Monitoring the Operation of PV Plants. IEEE Trans. Ind. Electron. 2009, 56, 4456–4464. [Google Scholar] [CrossRef]
- Hogg, R.V.; Ledolter, J. Engineering Statistics; MacMillan: Basingstoke, UK, 1987. [Google Scholar]
- Rohatgi, V.K.; Szekely, G.J. Sharp inequalities between skewness and kurtosis. Stat. Probab. Lett. 1989, 8, 297–299. [Google Scholar] [CrossRef]
- Klaassen, C.A.J.; Mokveld, P.J.; van Es, B. Squared skewness minus kurtosis bounded by 186/125 for unimodal distributions. Stat. Prob. Lett. 2000, 50, 131–135. [Google Scholar] [CrossRef]
- Gibbons, J.D. Nonparametric Statistical Inference, 2nd ed.; M. Dekker: New York, NY, USA, 1985. [Google Scholar]
- Hollander, M.; Wolfe, D.A. Nonparametric Statistical Methods; Wiley: Hoboken, NJ, USA, 1973. [Google Scholar]
- Chambers, J.M.; Cleveland, W.S.; Kleiner, B.; Tukey, B. Graphical Methods for Data Analysis; Wadsworth: Belmont, CA, USA, 1983. [Google Scholar]
- Heinrich, J. A guide to the Pearson type IV distribution; Technical Report; University of Pennsylvania: Philadelphia, PA, USA, 2004. [Google Scholar]


| Array Number | ||||||
|---|---|---|---|---|---|---|
| 1 | 2 | 3 | 4 | 5 | 6 | |
| Mean | 5.40 | 5.17 | 5.25 | 5.24 | 5.11 | 5.19 |
| Global mean | 5.227 | |||||
| Spread % | 3.29 | −1.04 | 0.50 | 0.23 | −2.32 | −0.66 |
| Median | 4.85 | 4.66 | 4.66 | 4.76 | 4.55 | 4.75 |
| Global mean | 4.707 | |||||
| Spread % | 2.96 | −0.94 | −0.94 | 1.23 | −3.26 | 0.96 |
| Variance | 17.67 | 16.88 | 17.53 | 17.10 | 16.60 | 16.70 |
| Global mean | 17.080 | |||||
| Spread % | 3.46 | −1.15 | 2.61 | 0.13 | −2.81 | −2.24 |
| Mode | 0.276 | 0.154 | 0.125 | 0.174 | 0.126 | 0.181 |
| 0.135 | 0.107 | 0.134 | 0.100 | 0.103 | 0.102 | |
| −0.647 | −0.675 | −0.626 | −0.667 | −0.688 | −0.644 | |
| U* | 0.665 | 0.687 | 0.643 | 0.677 | 0.699 | 0.655 |
| p-value (K-W) | 0.9999 | |||||
| Array Number | ||||||
|---|---|---|---|---|---|---|
| 1 | 2 | 3 | 4 | 5 | 6 | |
| Mean | 8.390 | 8.218 | 8.199 | 8.306 | 8.098 | 8.315 |
| Global mean | 8.254 | |||||
| Spread % | 1.65 | −0.44 | −0.67 | 0.62 | −1.89 | 0.73 |
| Median | 8.103 | 7.905 | 7.935 | 7.956 | 7.767 | 7.889 |
| Global mean | 7.926 | |||||
| Spread % | 2.23 | −0.27 | 0.11 | 0.38 | −2.00 | −0.46 |
| Variance | 32.313 | 32.241 | 32.102 | 32.617 | 31.531 | 32.801 |
| Global mean | 32.268 | |||||
| Spread % | 0.14 | −0.08 | −0.51 | 1.08 | −2.28 | 1.65 |
| Mode | 0.183 | 0.154 | 0.125 | 0.174 | 0.126 | 0.175 |
| 0.211 | 0.221 | 0.206 | 0.220 | 0.219 | 0.236 | |
| −1.095 | −1.082 | −1.103 | −1.081 | −1.090 | −1.065 | |
| U* | 1.139 | 1.131 | 1.454 | 1.130 | 1.138 | 1.121 |
| p-value (K-W) | 0.9996 | |||||
| Array Number | ||||||
|---|---|---|---|---|---|---|
| 1 | 2 | 3 | 4 | 5 | 6 | |
| Mean | 11.84 | 11.64 | 11.57 | 11.77 | 11.48 | 11.84 |
| Global mean | 11.69 | |||||
| Spread % | 1.25 | −0.41 | −1.01 | 0.66 | −1.79 | 1.30 |
| Median | 12.60 | 12.26 | 12.42 | 12.38 | 12.08 | 12.31 |
| Global mean | 12.34 | |||||
| Spread % | 2.07 | −0.63 | 0.61 | 0.32 | −2.14 | −0.22 |
| Variance | 37.63 | 37.80 | 37.01 | 38.41 | 36.97 | 39.34 |
| Global mean | 37.86 | |||||
| Spread % | −0.61 | −0.16 | −2.24 | 1.45 | −2.36 | 3.92 |
| Mode | 17.98 | 16.32 | 11.48 | 11.95 | 10.54 | 16.81 |
| −0.370 | −0.354 | −0.379 | −0.353 | −0.355 | −0.333 | |
| −1.150 | −1.168 | −1.147 | −1.168 | −1.168 | −1.185 | |
| U* | 1.287 | 1.293 | 1.291 | 1.292 | 1.294 | 1.297 |
| p-value (K-W) | 0.873 | |||||
© 2017 by the authors. Licensee MDPI, Basel, Switzerland. This article is an open access article distributed under the terms and conditions of the Creative Commons Attribution (CC BY) license (http://creativecommons.org/licenses/by/4.0/).
Share and Cite
Vergura, S.; Carpentieri, M. Statistics to Detect Low-Intensity Anomalies in PV Systems. Energies 2018, 11, 30. https://doi.org/10.3390/en11010030
Vergura S, Carpentieri M. Statistics to Detect Low-Intensity Anomalies in PV Systems. Energies. 2018; 11(1):30. https://doi.org/10.3390/en11010030
Chicago/Turabian StyleVergura, Silvano, and Mario Carpentieri. 2018. "Statistics to Detect Low-Intensity Anomalies in PV Systems" Energies 11, no. 1: 30. https://doi.org/10.3390/en11010030
APA StyleVergura, S., & Carpentieri, M. (2018). Statistics to Detect Low-Intensity Anomalies in PV Systems. Energies, 11(1), 30. https://doi.org/10.3390/en11010030


