Article

Extended Kalman Filter-Based State of Charge and State of Power Estimation Algorithm for Unmanned Aerial Vehicle Li-Po Battery Packs

1
Department of Drone System, Chodang University, Muan-gun 58530, Jeollanam-do, Korea
2
Department of Fire Administration, Chodang University, Muan-gun 58530, Jeollanam-do, Korea
*
Author to whom correspondence should be addressed.
Energies 2017, 10(8), 1237; https://doi.org/10.3390/en10081237
Submission received: 11 July 2017 / Revised: 16 August 2017 / Accepted: 18 August 2017 / Published: 21 August 2017

Abstract

:
Customer requirements for unmanned aerial vehicles (UAVs) with long flight times are increasing exponentially in the personal, commercial, and military use areas. Due to their limited payload, large numbers of on-board battery packs cannot be used and this is the main reason behind the need for battery management software (BMS) packages with state of charge (SOC) estimation functions to increase the flight time. At the same time, as the UAV application range has extended widely, the size of UAVs has increased and heavy-duty UAVs are slowly appearing. As a result, the system operating power of the UAVs has been increased tremendously and their safe system power operation has become an issue. This is the main reason for the need of BMS having state of power (SOP) estimation functions. In this work a 6 S Li-Po battery pack is simulated with two ladder equivalent circuit models (ECMs) considering an impedance effect whose parameters are found using hybrid pulse power characterization (HPPC) current patterns with parameter determination using the table-based linear interpolation (TBLI) method. Two state estimation methods, including the current integration method and the extended Kalman filter (EKF) method are developed and the estimation accuracies of SOC and SOP are compared. Results show that the most accurate SOC estimation turns out to be 0.1477% (indoor test with HPPC), 0.1324% (outdoor test with 0 kg payload), and 0.2021% (outdoor test with 10 kg payload). Also, the most accurate SOP estimation error turns out to be 1.2% (indoor test with HPPC), 3.6% (outdoor test with 0 kg payload), and 4.2% (outdoor test with 10 kg payload).

1. Introduction

With the advent of the fourth industrial revolution era, the use of unmanned aerial vehicles (UAVs) has recently emerged. Some three million personal and commercial UAVs are expected to be globally produced and distributed in 2017 [1] and so the safety of these UAVs has become an issue [2].
Rules and regulations related to UAVs are important, but not as crucial as the unmanned aerial system (UAS) itself. There are various components, and combining a UAV and a fuel system is one of the main components [3]. In general, small and medium size UAVs use either lithium ion (Li-ion) or lithium polymer (Li-Po) batteries as their energy source and large size UAVs use one of the following fuel systems: Li-ion batteries, petroleum-based fuels, and hybrid fuels (petroleum-based fuel + Li-ion, fuel cell + Li-ion, solar power + Li-ion, etc.) [4].
In accordance with the consistent increase of the specific energy (Wh/kg) of both Li-ion and Li-Po batteries, these eco-friendly energy sources are preferred for small, medium, and large size UAVs. In particular, as battery management system (BMS) technologies have matured, small, medium, and even large size UAVs have started to use light, thin, and easily deformable Li-Po batteries which provide high (dis)charging C-rates and provide high energy density.
Measurement data of the state of charge (SOC) are used as a crucial factor for the accurate assessment of the remaining battery charge level and eventually to increase flight time. Accurate state of power (SOP) estimation is important since underestimated SOP would limit rapid maneuverability and overestimated SOP would result in crashes during the takeoff phase, collision avoidance phase, etc. Also, during the battery pack charging process, underestimated SOP would result in dragging charging time and overestimated SOP would damage the cells.
The SOC of the Li-Po battery changes nonlinearly during the (dis)charging process in a relatively uniform pattern, but exact SOC estimation is affected by several phenomena, including ambient temperature, deterioration in service life, hysteresis effects, self-discharging, etc. Estimating SOP values is even more difficult since it utilizes the SOC estimation value to calculate the accurate (dis)charging power information affording the optimum operation of electrical and electronic systems. Due to the previously mentioned issues, SOC and SOP measurements of the Li-ion battery have been in the spotlight for the optimal control of the battery power management in the renewable energy industry and vehicle industry fields, including electric vehicles (EVs) and UAVs.
To understand the characteristics of Li-Po batteries, the battery equivalent circuit model (ECM) should be selected first. The ECM has been traditionally developed in three branches, including an ECM, physical electric circuit model (PECM), and electrochemical model (EM) [5]. Each battery model has evolved into various forms to accurately simulate different battery states which eventually could result in exact SOC and SOP state estimations.
The ECM has been applied to the widest range of industries to date due to the small amount of computation and estimation errors. Gao and et al. [6] used a coupled equivalent circuit and convective thermal model to estimate SOC and the temperature of the LiFePO4 by using a MATLAB (R2016a, MathWorks, Natick, MA, USA)/Simulink based algorithm. Since this paper focuses on a small size agricultural UAV whose payload is limited and which faces high crash risk, the ECM including only an impedance characteristic is chosen to quickly and exactly estimate battery SOC and SOP states.
ECMs are commonly designed with a one ladder, two ladders, and multi-ladders including parameters for hysteresis, heat transfer, impedance, etc. and the exact state estimation using an ECM is dependent on the accuracy of these parameters. To predict these parameters, open circuit voltages (OCVs) are measured by applying specific current patterns to the battery in various test environments (temperature, SOC, C-rate, etc.).
Gao et al. [7] compared six different parameter estimation methods by considering computation time, OCV residual error, and convergence time and concluded to use the nonlinear-trust region algorithm since it has the minimum OCV residual error. High performance pulse characterization (HPPC) is one of the widely used current patterns and it will be used in this paper. A numerical optimization algorithm is commonly used to extract accurate parameters from the OCV outputs, but we simply use the table-based linear interpolation (TBLI) method.
In addition, there are various SOC and SOP state estimation methods, including linear Kalman filter (LKF), extended Kalman filter (EKF), sigma-point Kalman filter (SPKF), particle filter (PF), fuzzy logic (FL), etc. Jia et al. [8] compared EKF, strong tracking EKF (STEKF), and multirate strong tracking EKF (MRSTEKF) and proved the MRSTEKF has faster computation time and more precise estimation ability. In contrast to the listed estimation methods, we adopted the fused estimation method of both the complementary filter (CF) and EKF resulting much accurate estimation accuracy.
The flow of this paper is as follows: in Section 2, battery ECM, TBLI parameter determination, SOC and SOP state estimation deviations, and EKF state estimation are described. Section 3 explains the test setup, including test environments and test cases. Section 4 shows experiment results of parameter optimization and SOC and SOP state estimations. Section 5 contains the conclusion of this paper and future works.

2. ECM and State Estimation Algorithm
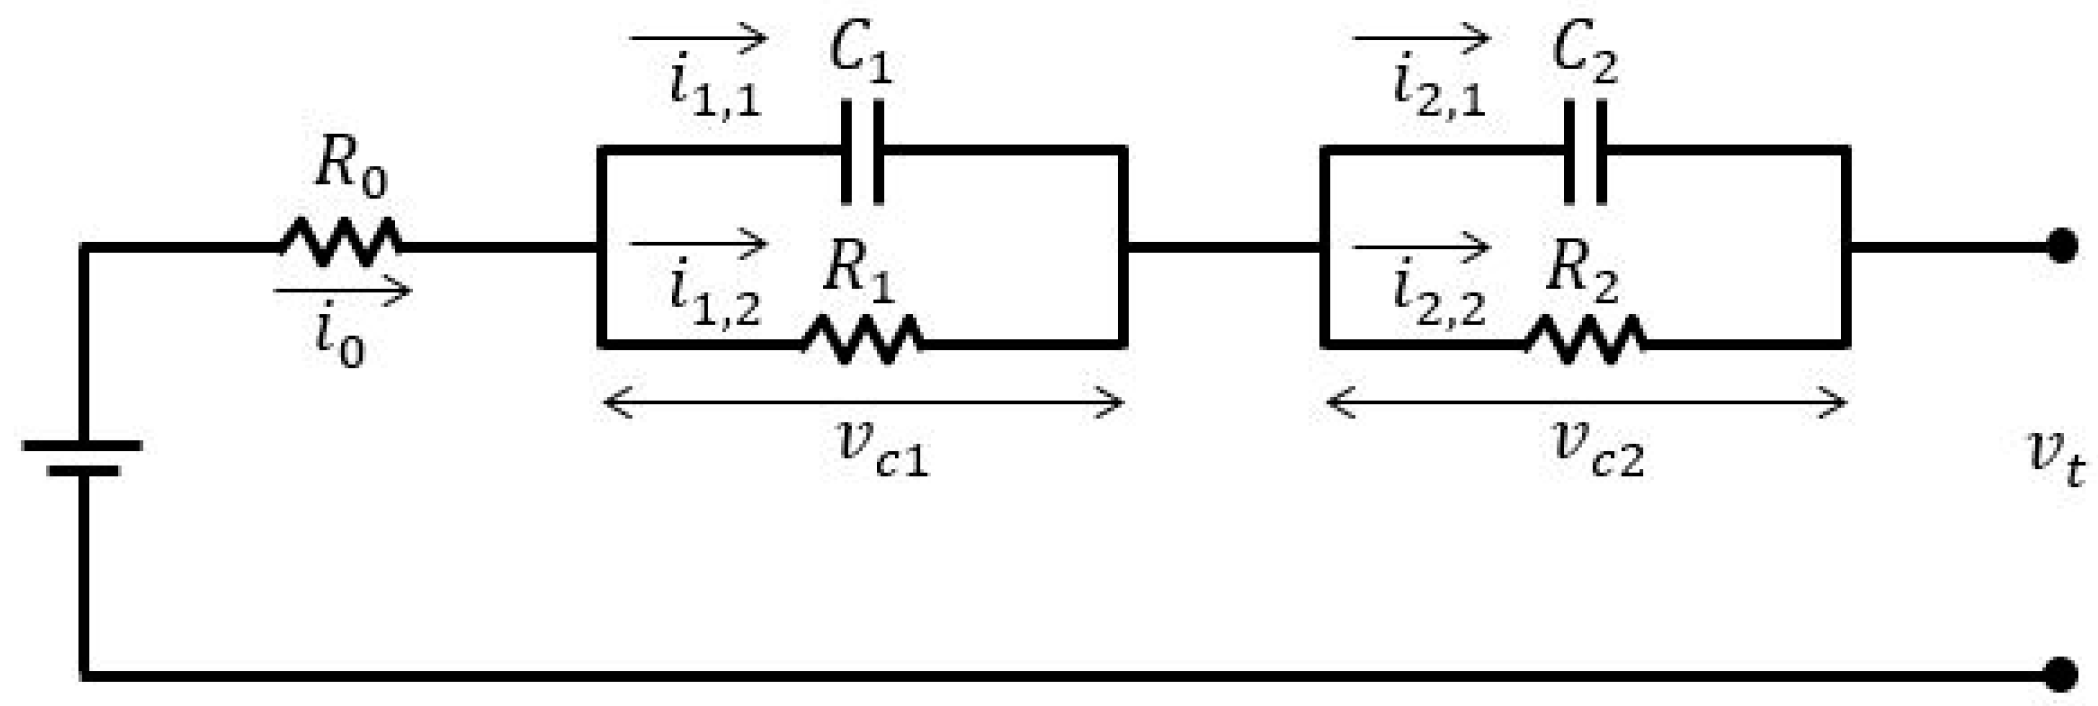
2.1. ECM

Using the two ladder battery ECM shown in Figure 1, we set governing equations as:
v t ( t ) = v ocv ( t ) i 0 ( t ) R 0 ( z , t ) v c 1 ( t ) v c 2 ( t )
where v t is the terminal voltage ( V ), v ocv is the OCV voltage ( V ), i 0 is the load current ( A ), R 0 is the resistor ( Ω ), z is the SOC ( % / 100 ), v c is the voltage across an resistor-capacitor (RC) network ( V ), and t is the time ( s ).
Equation (1) also can be rewritten as:
v t ( t ) = f ( z , t ) i 0 ( t ) R 0 ( z , t ) v c 1 ( t ) v c 2 ( t )
where f ( t ) is the function of z and t .
The term z can be calculated as:
z ( t ) = Q init + η i 0 ( t ) / Q norm ( t )
where Q init is the initial battery capacity ( Ah ), η is the battery efficiency (assumed as 1), and Q norm is the current battery capacity ( Ah ).
In Equation (2), v c can be represented by inspecting the impedance voltage response in Figure 2 [9]. Here, v 0 , 1 = i 0 R 0 , 1 and v 0 , 2 = i 0 R 0 , 2 are voltage drops caused by the resistor R 0 . Though the amount of v 0 , 1 and v 0 , 2 are slightly different, we assumed those to be equal for the simplication so that we can set v 0 = v 0 , 1 = v 0 , 2 .
The voltage across an RC-network can be calculated as:
v c ( t ) = v 0 , 1 ( t ) = i 0 ( t ) R 1 ( z , t ) ( 1 e t 1 / τ 1 ( z , t ) ) v c ( t ) = v 0 , 2 ( t ) = i 0 ( t ) R 2 ( z , t ) ( 1 e t 2 / τ 2 ( z , t ) )
where τ i is the time constant ( s ) which is calculated as τ i = R i C i in which R i is the resistor ( Ω ) and C i is the capacitor ( F ) of the i-th ladder. Here, i 1 , 1 in Figure 1 is assumed to be equal to i 0 since i 1 , 2 is neglectable after a short period of time when v 0 , 1 and v 0 , 2 occur. In addition, although t 1 and t 2 are quite different and t 2 is generally longer than t 1 , we assume t 1 = t 2 = Δ t for simplication.
By combining Equations (2) and (4), we finally obtain:
v t ( t ) = f ( z , t ) i 0 ( t ) R 1 ( z , t ) ( 1 e Δ t / τ 1 ( z , t ) ) i 0 ( t ) R 2 ( z , t ) ( 1 e Δ t / τ 2 ( z , t ) )
For the computation, we rewrite Equation (5) into discrete time state space equation as:
[ v c 1 v c 2 z ] k + 1 = [ e Δ t / τ 1 0 0 0 e Δ t / τ 2 0 0 0 1 ] [ v c 1 v c 2 z ] k + [ R 1 ( 1 e Δ t / τ 1 ) R 2 ( 1 e Δ t / τ 2 ) η Δ t / ( 3600 Q norm ) ] k i 0 , k + [ n w 1 n w 2 n w 3 ] k [ v c 1 v c 2 z ] k = [ 1 0 0 0 1 0 0 0 1 ] [ v c 1 v c 2 z ] k + [ 0 0 0 ] k i 0 , k + [ n v 1 n v 2 n v 3 ] k
where Δ t is 0.1 s and n w i and n v i are system and measurement noises ( V ) respectively. Finally, though R 0 , R 1 , C 1 , R 2 , and C 2 are functions of the SOC, C-rate, and temperature, we only consider the SOC variance effect in this paper.

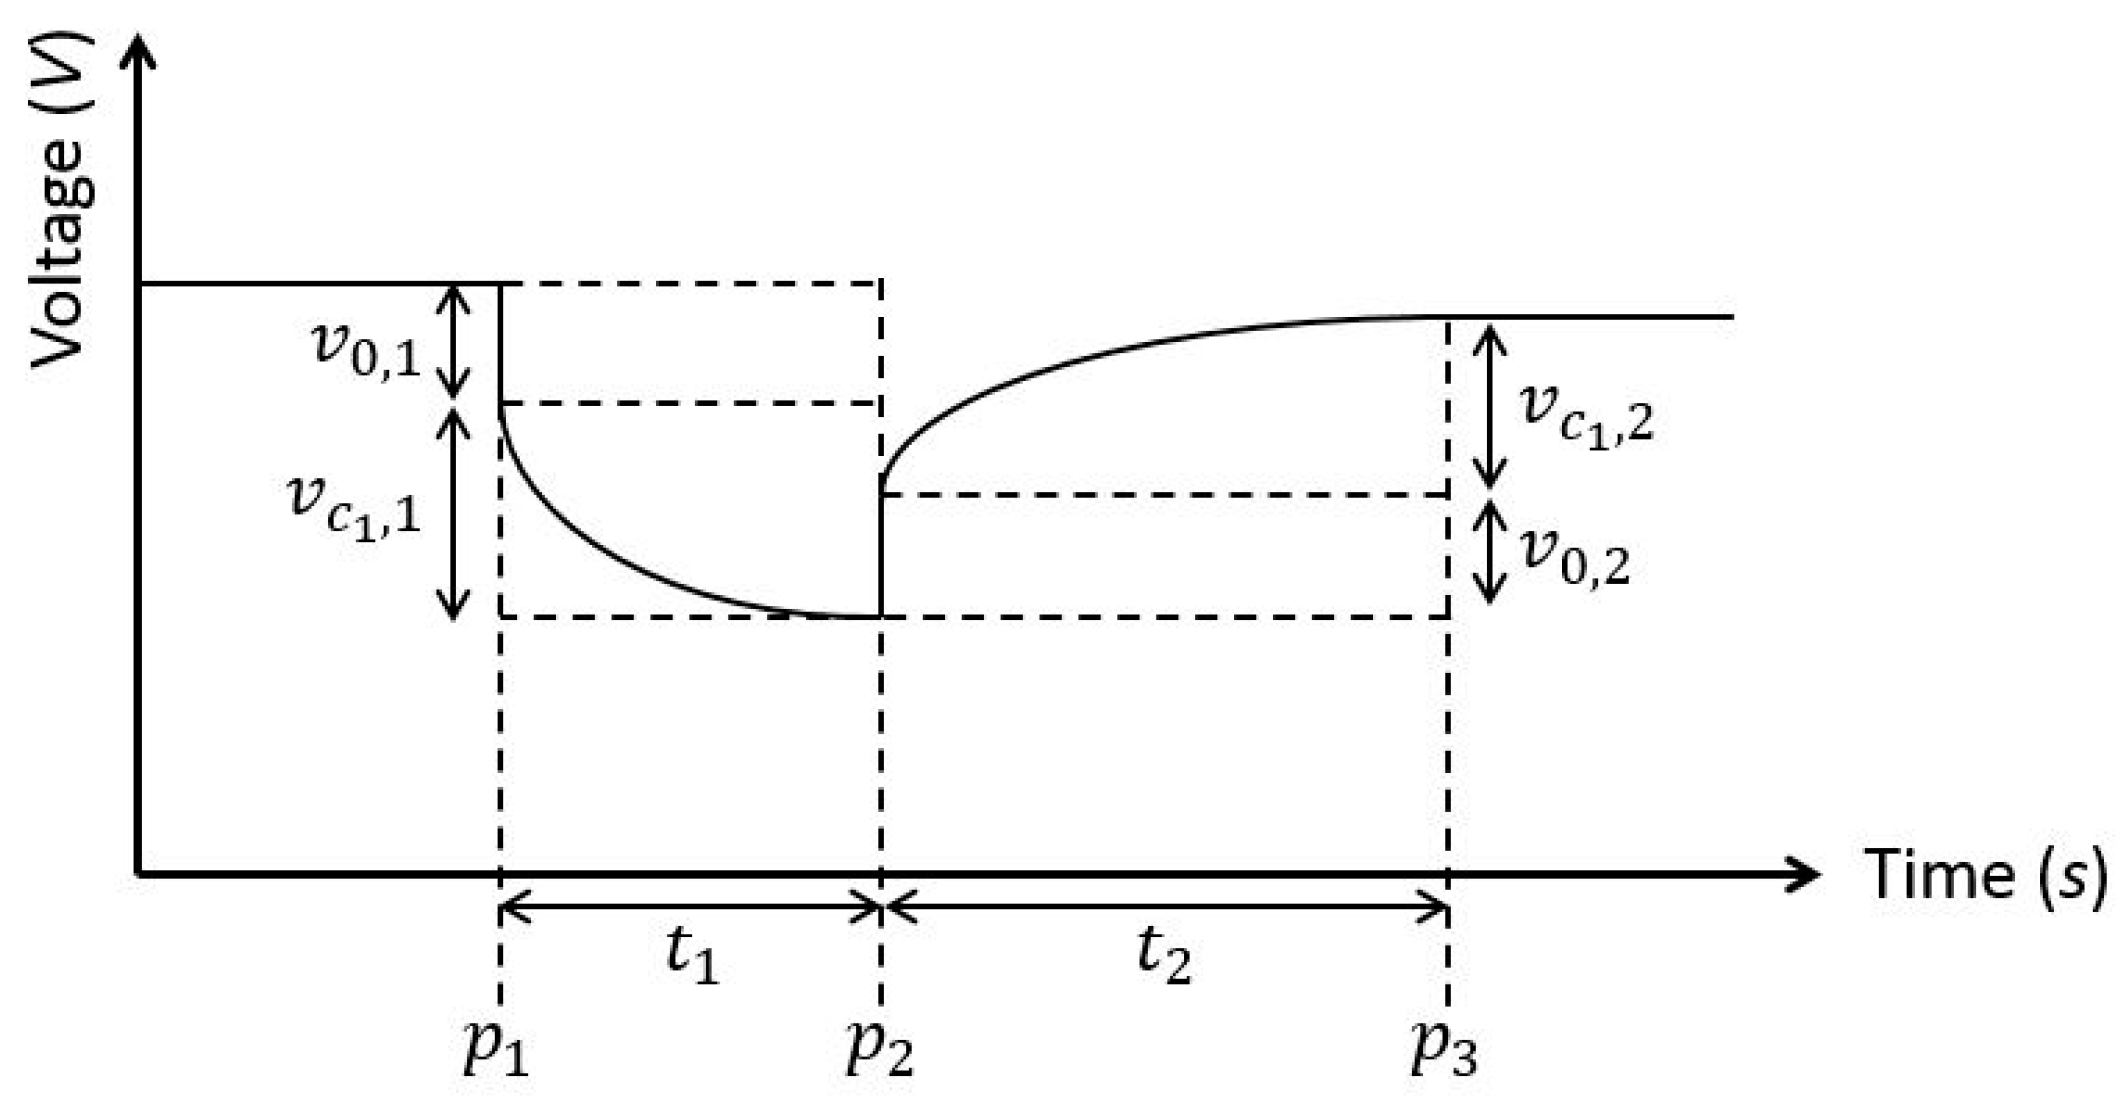
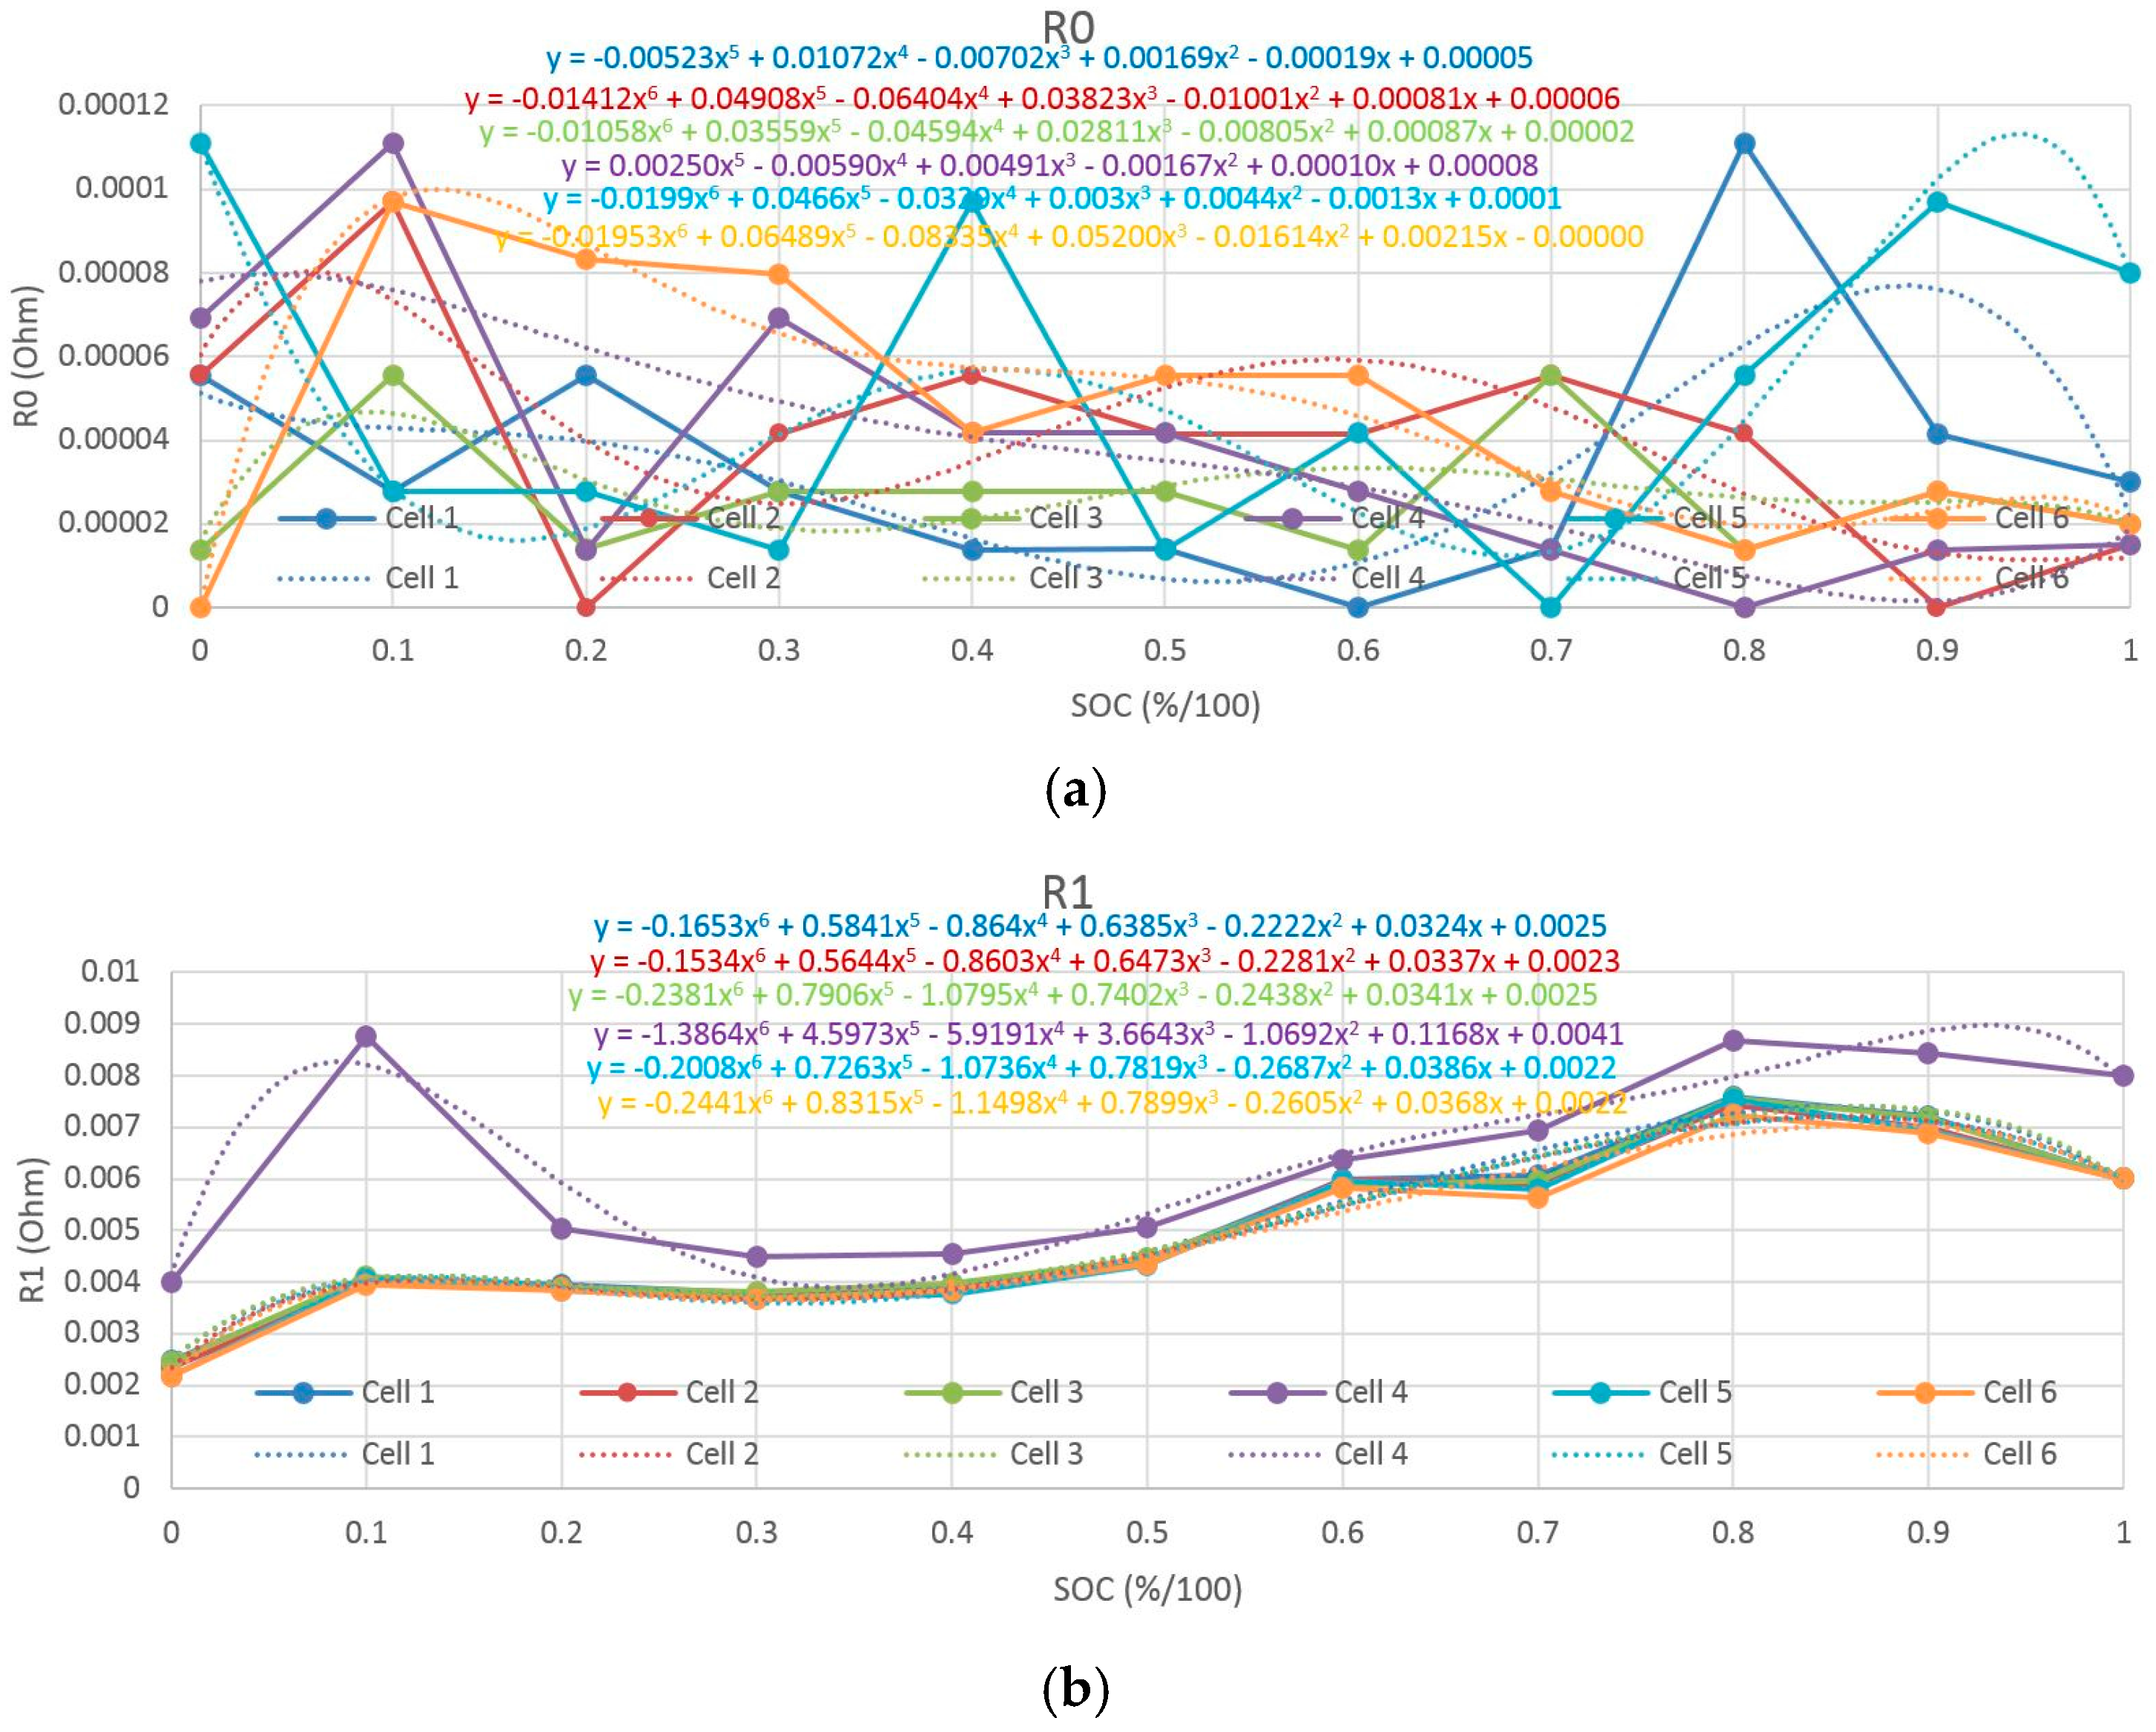
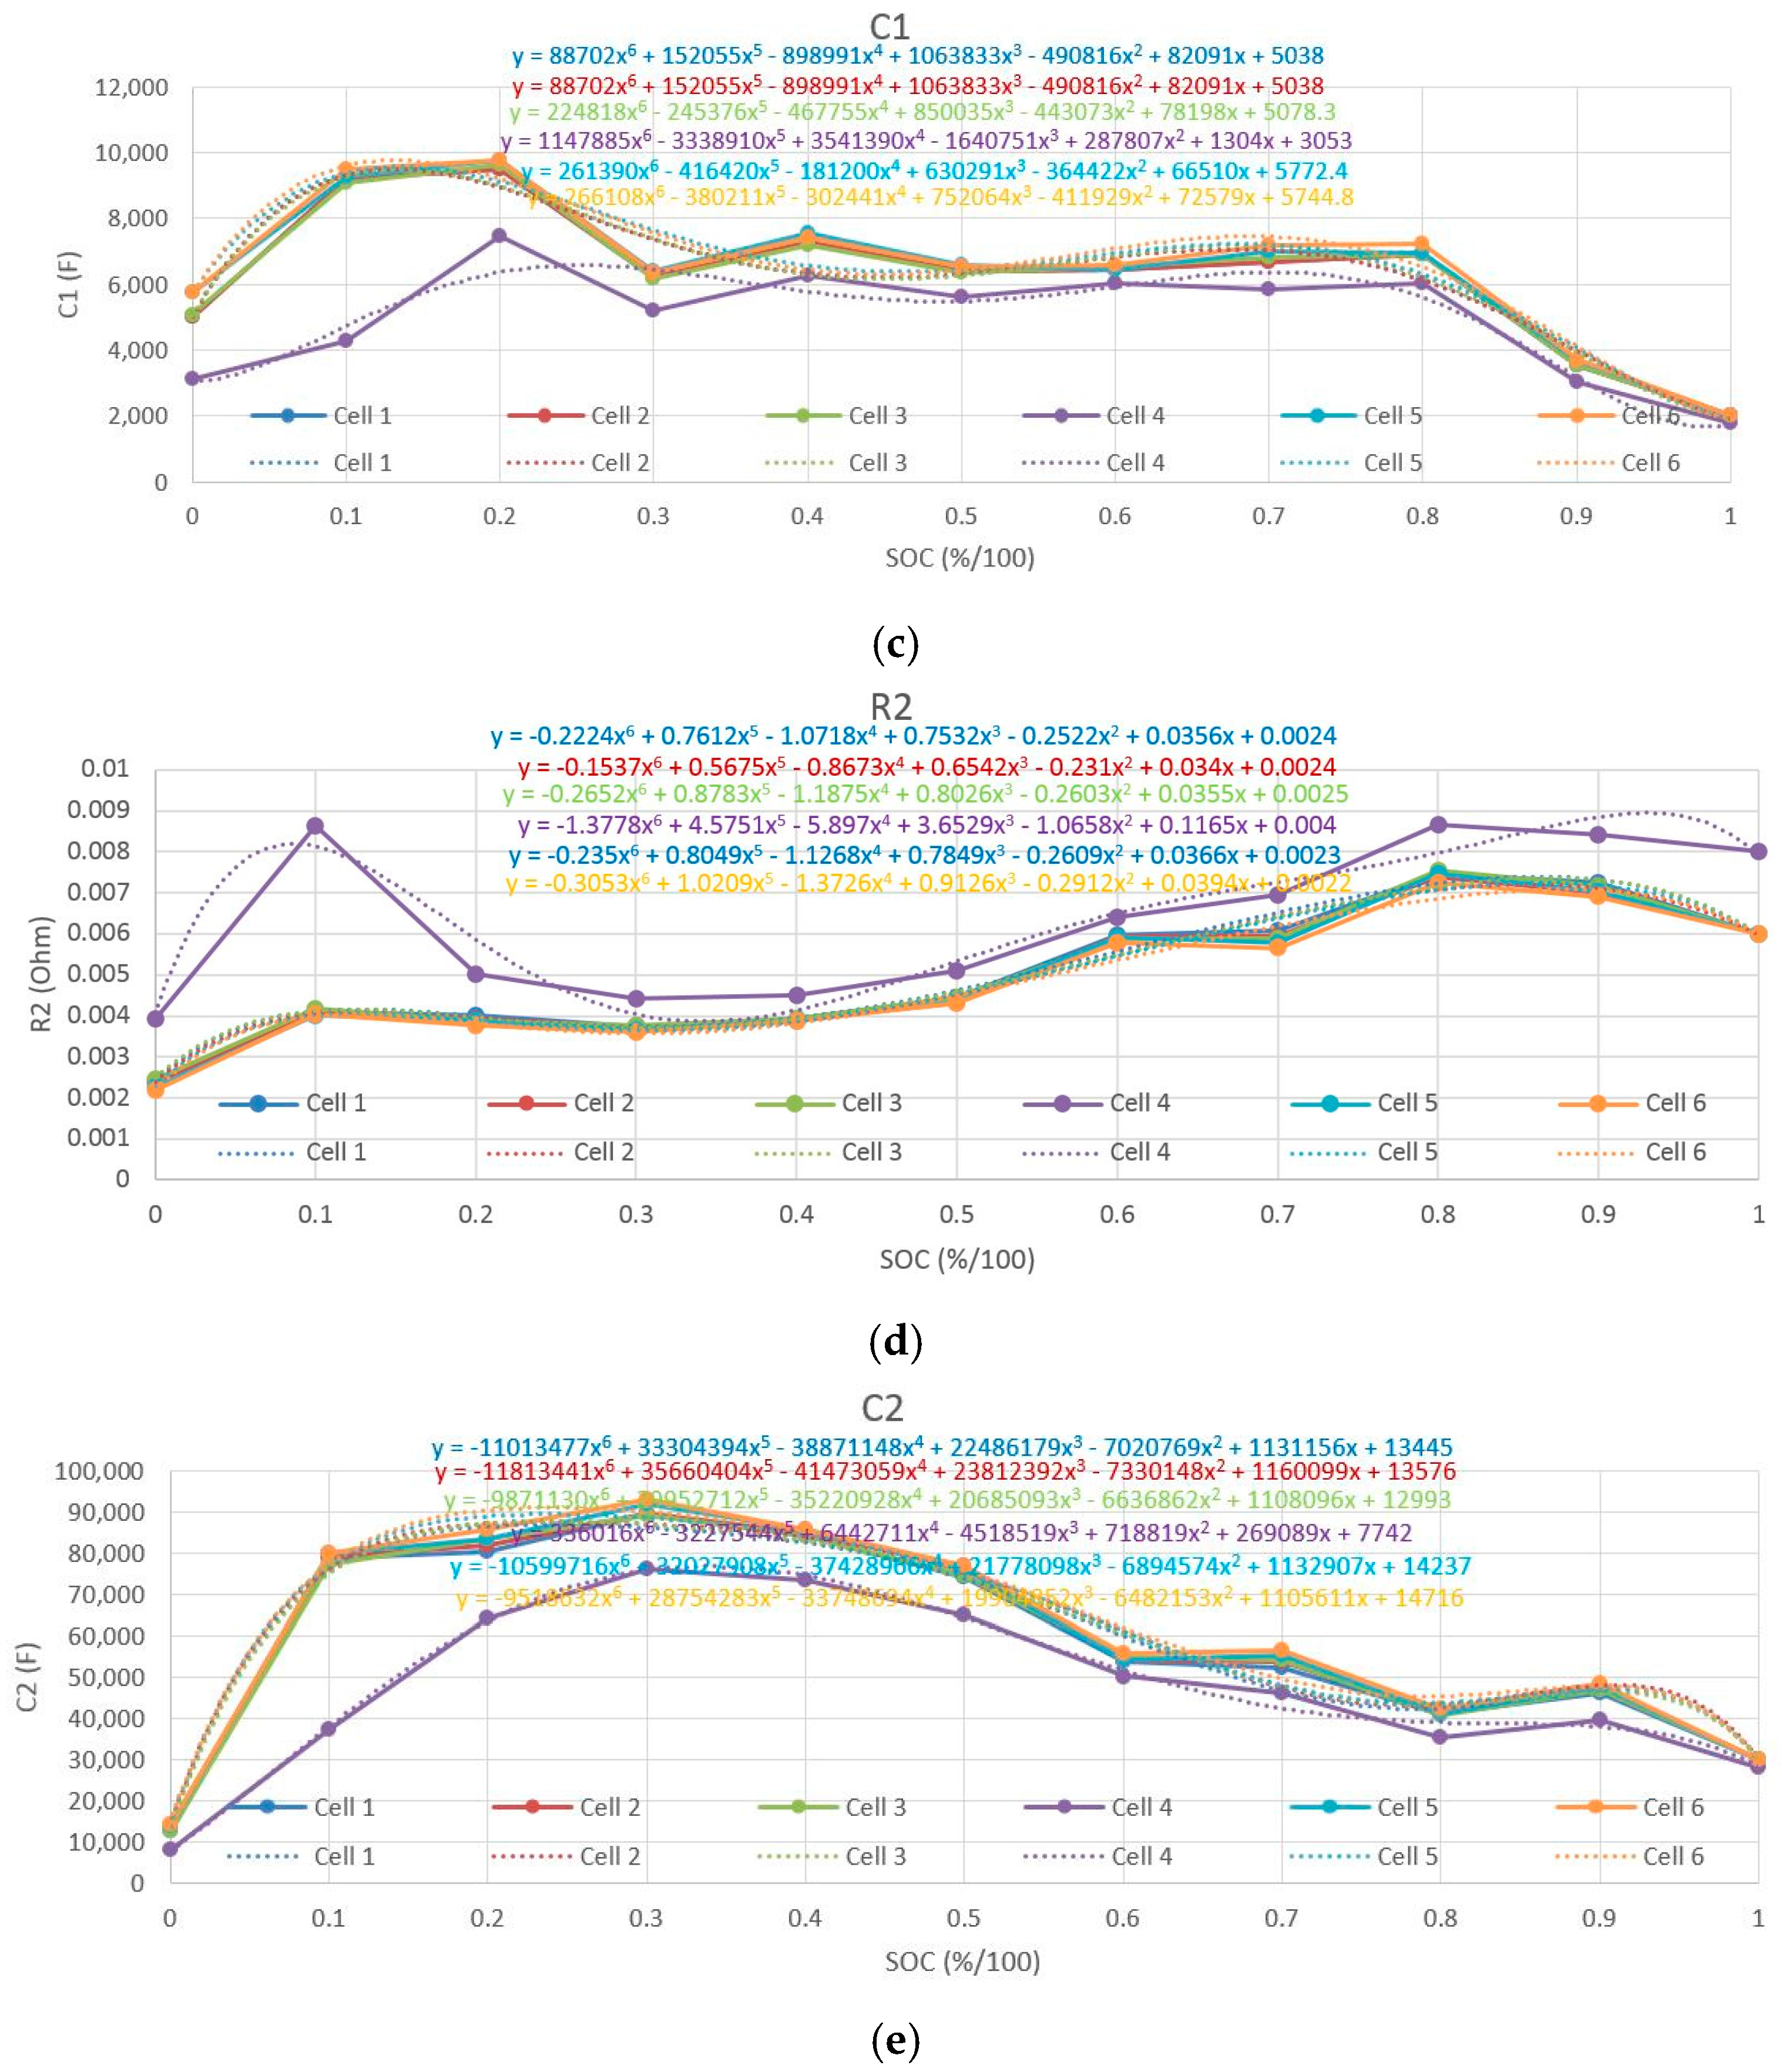
2.2. TBLI Parameter Determination

The ECM parameters, including R 0 , R 1 , C 1 , R 2 , and C 2 , are extracted at SOC 10% intervals as shown in Figure 3 [10] and the TBLI method is used to determine ECM parameters corresponding to varying SOC values.

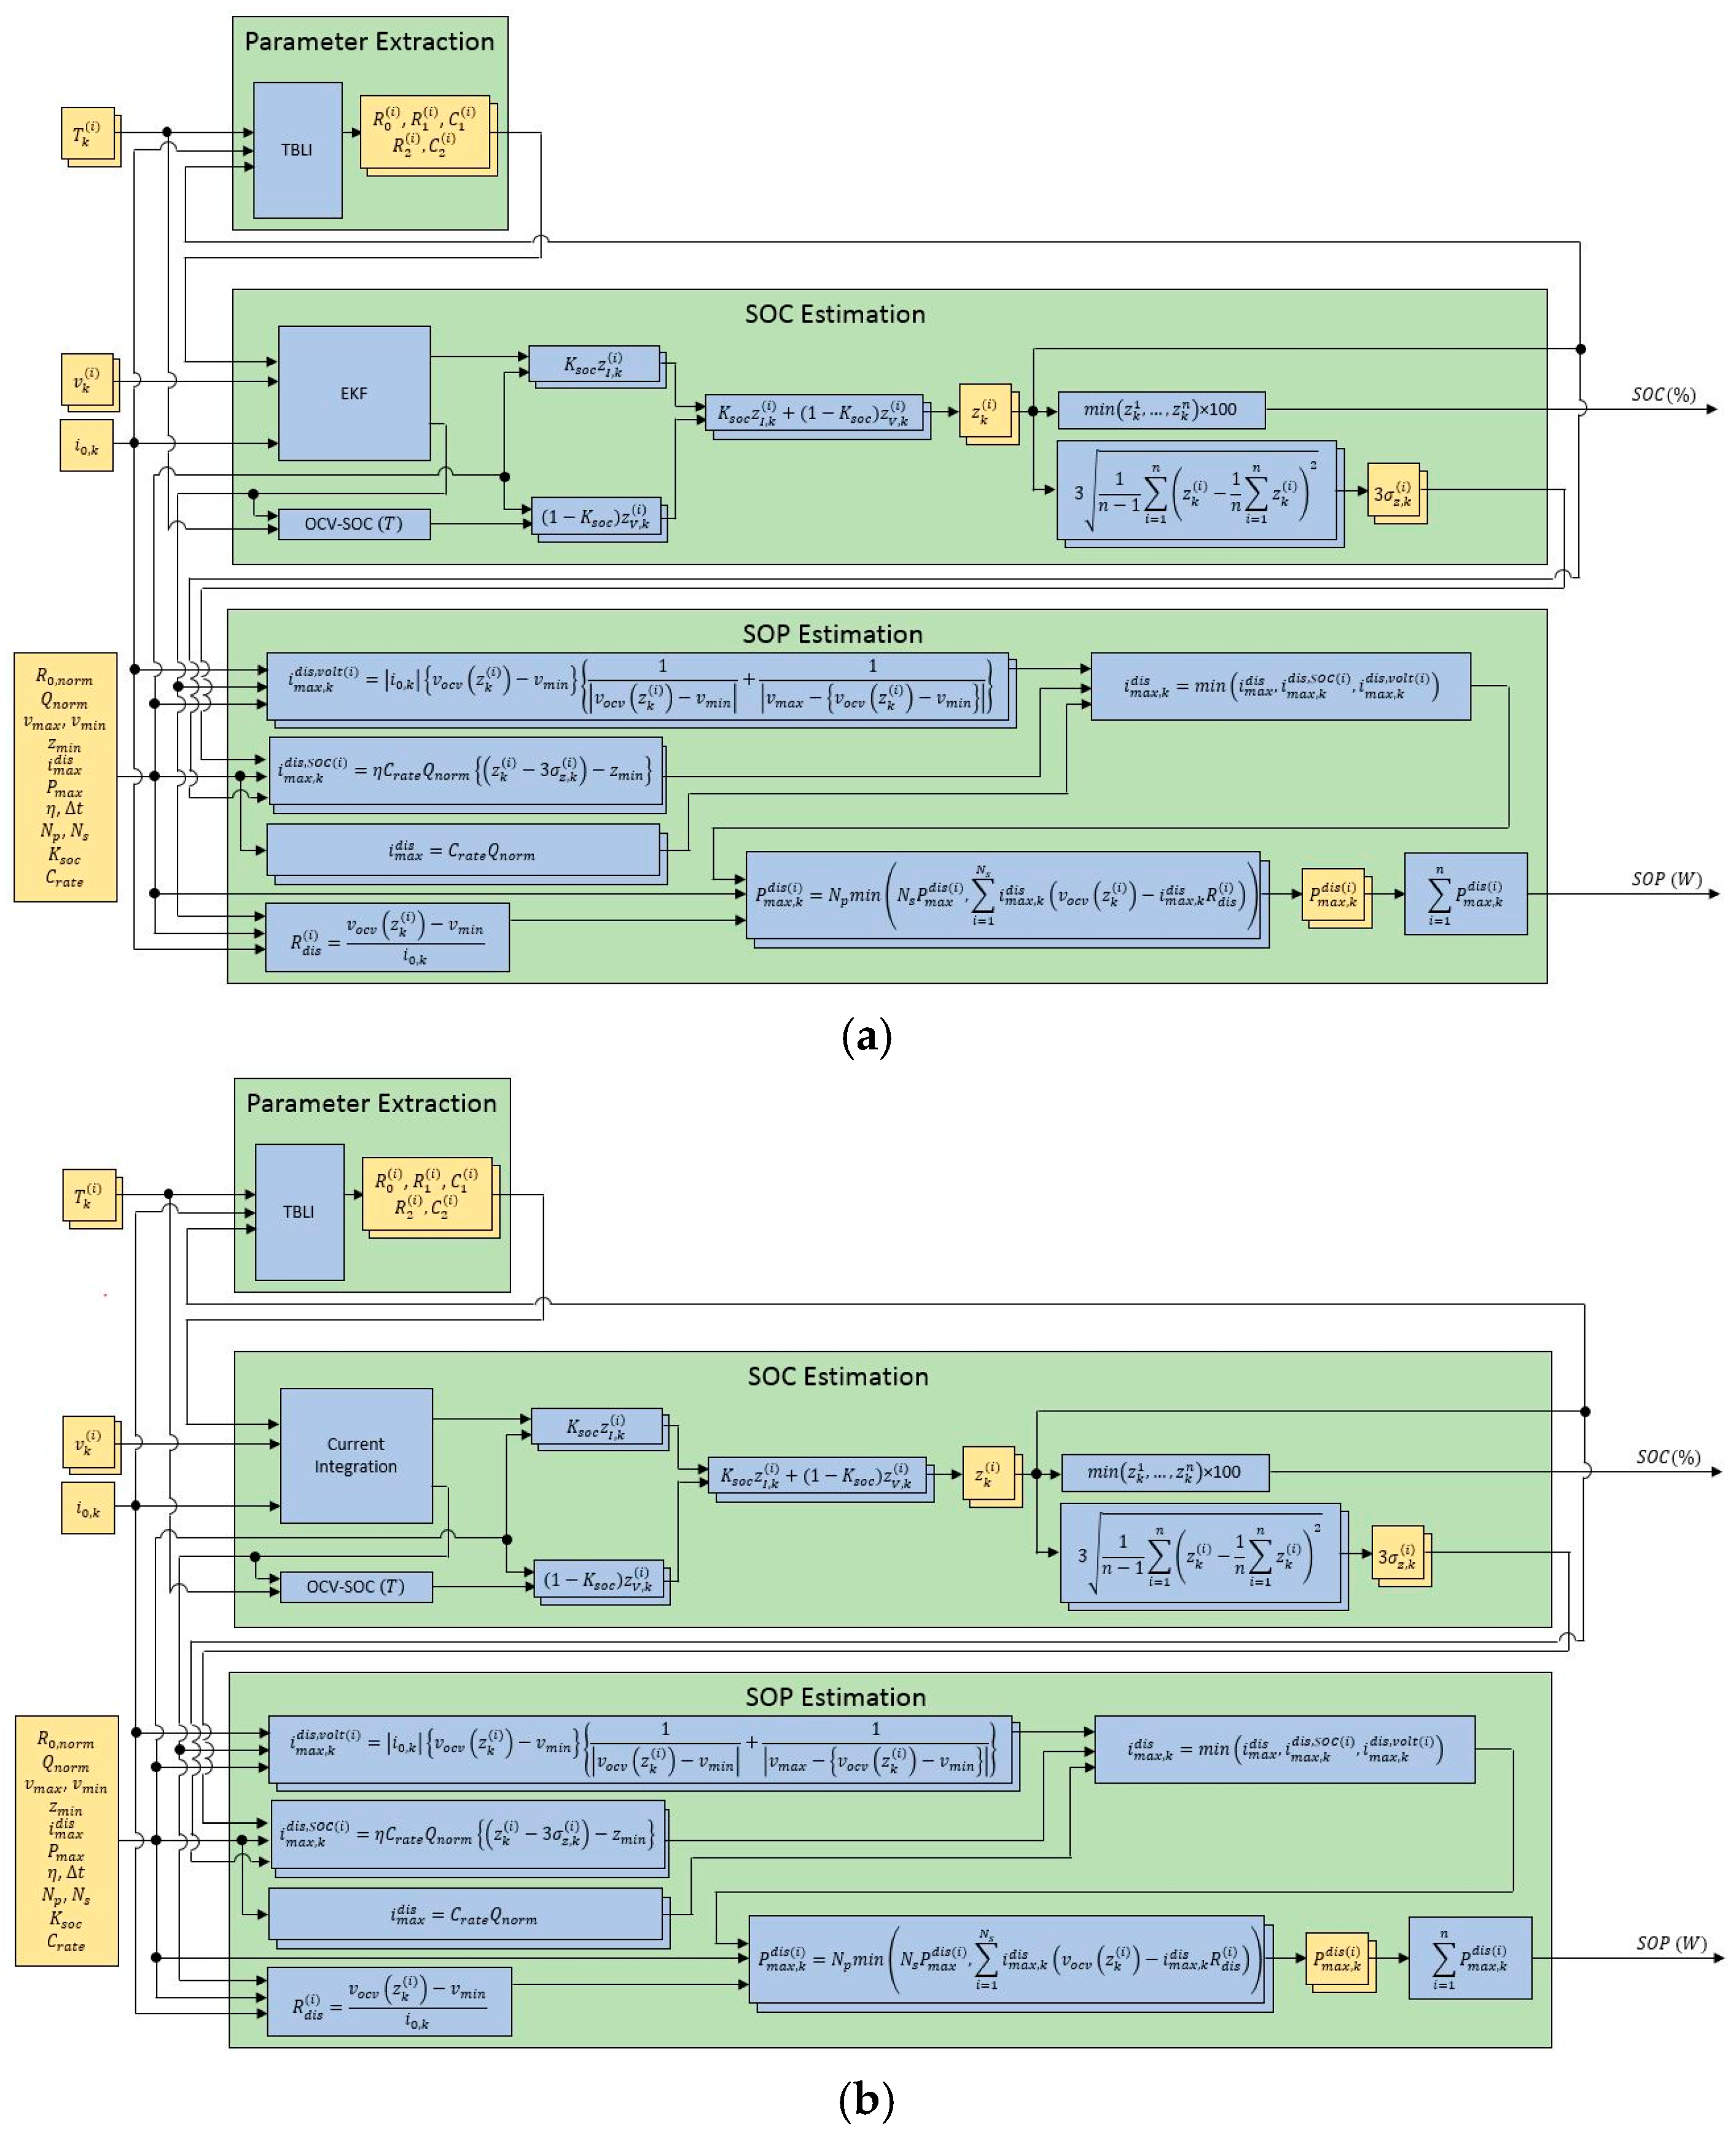
2.3. SOC Estimation Logic

Overall SOC state estimation logic is shown in Figure 4, where subscript k represents the present time index, superscript i denotes the i-th cell in a battery pack, and n denotes the total number of cells in a battery pack [5].
The SOC estimation is performed using the EKF for each cell and the final SOC value of the battery pack is conservatively chosen as the minimum value of each cell as:
SOC pack , k = min ( z k 1 , , z k n ) × 100
where SOC pack , k is the SOC (%) of a battery pack at the k-th time step.
In Figure 4, the Z I , k is the current based SOC (%) and the Z V , k is the voltage based SOC (%). Those two values can be integrated by using the CF as:
Z k = K soc Z I , k + ( 1 K soc ) Z V , k
where K soc is the CF coefficient ( 0 K soc 1 ) (no units). The choice of the K soc value is important in the CF since it determines whether SOC estimation depends more on the current integration or vice versa.

2.4. SOP Estimation Logic

Overall SOP state estimation logic is shown in Figure 4. In general, although UAVs do not have regenerative charging equipment, in contrast to EVs, various research topics have appeared regarding applicable UAV energy harvesting technologies or regenerative devices using solar panels or fuel cells, etc. Therefore, we consider both the charging and discharging parameters.
The maximum discharging current, i max dis , can be calculated as:
i max dis = C rate Q norm
where C rate is the C-rate of the cell (no unit).
The maximum discharging current considering the SOC, i max , k dis , SOC ( i ) , can be calculated as:
i max , k dis , SOC ( i ) = η C rate Q norm { ( z k ( i ) 3 σ z , k ( i ) ) z min }
where η is the battery efficiency (assumed as one), σ is the standard deviation of the cell SOCs ( % / 100 ), and z min is the minimum SOC ( % / 100 ). Here, we used 3 σ for the 99.7% confidence interval of the cell SOC estimation values.
The maximum discharging current considering the cell voltage, i max , k dis , volt ( i ) , can be calculated as:
i max , k dis , volt ( i ) = | i 0 , k | { v ocv ( z k ( i ) ) v min ( i ) } { 1 | v ocv ( z k ( i ) v min ( i ) ) | + 1 v max ( i ) { v ocv ( z k ( i ) ) v min ( i ) } }
where v ocv is the open circuit voltage (OCV) (V) and v min is the minimum cell voltage (V). Here, we used v min ( 1 ) = 3.679   V , v min ( 2 ) = 3.660   V , v min ( 3 ) = 3.663   V , v min ( 4 ) = 3.626   V , v min ( 5 ) = 3.623   V , v min ( 6 ) = 3.669   V , v max ( 1 ) = 4.171   V , v max ( 2 ) = 4.176   V , v max ( 3 ) = 4.174   V , v max ( 4 ) = 4.174   V , v max ( 5 ) = 4.173   V , v max ( 6 ) = 4.167   V , z min = 0 , C rate = 18   C , N p = 1 , N s = 6 , and Q norm = 22   Ah .
With the previously found i max dis , i max , k dis , SOC ( i ) , and i max , k dis , volt ( i ) , we can calculate i max , k dis as:
i max , k dis = min ( i max dis , i max , k dis , SOC ( i ) , i max , k dis , volt ( i ) )
and can calculate P max , k dis ( i ) as:
P max , k dis ( i ) = i max , k dis { v ocv ( z k ( i ) ) i max , k dis | v ocv ( z k ( i ) ) v min i 0 , k | }
Then, we calculate the maximum power which each cell could perform, P max dis ( i ) , as:
P max dis ( i ) = v max ( i ) i max dis
and compare it with the maximum power which each cell performs during the discharging process, P max , k dis ( i ) , as:
P max , k dis ( i ) = N p min ( N s P max dis ( i ) , i = 1 N s i max , k dis ( v ocv ( z k ( i ) ) i max , k dis R dis ( i ) ) )
where the total initial resistance of each cell, R dis ( i ) , can be calculated as:
R dis ( i ) = v ocv ( z k ( i ) ) v min i 0 , k

2.5. EKF State Estimation
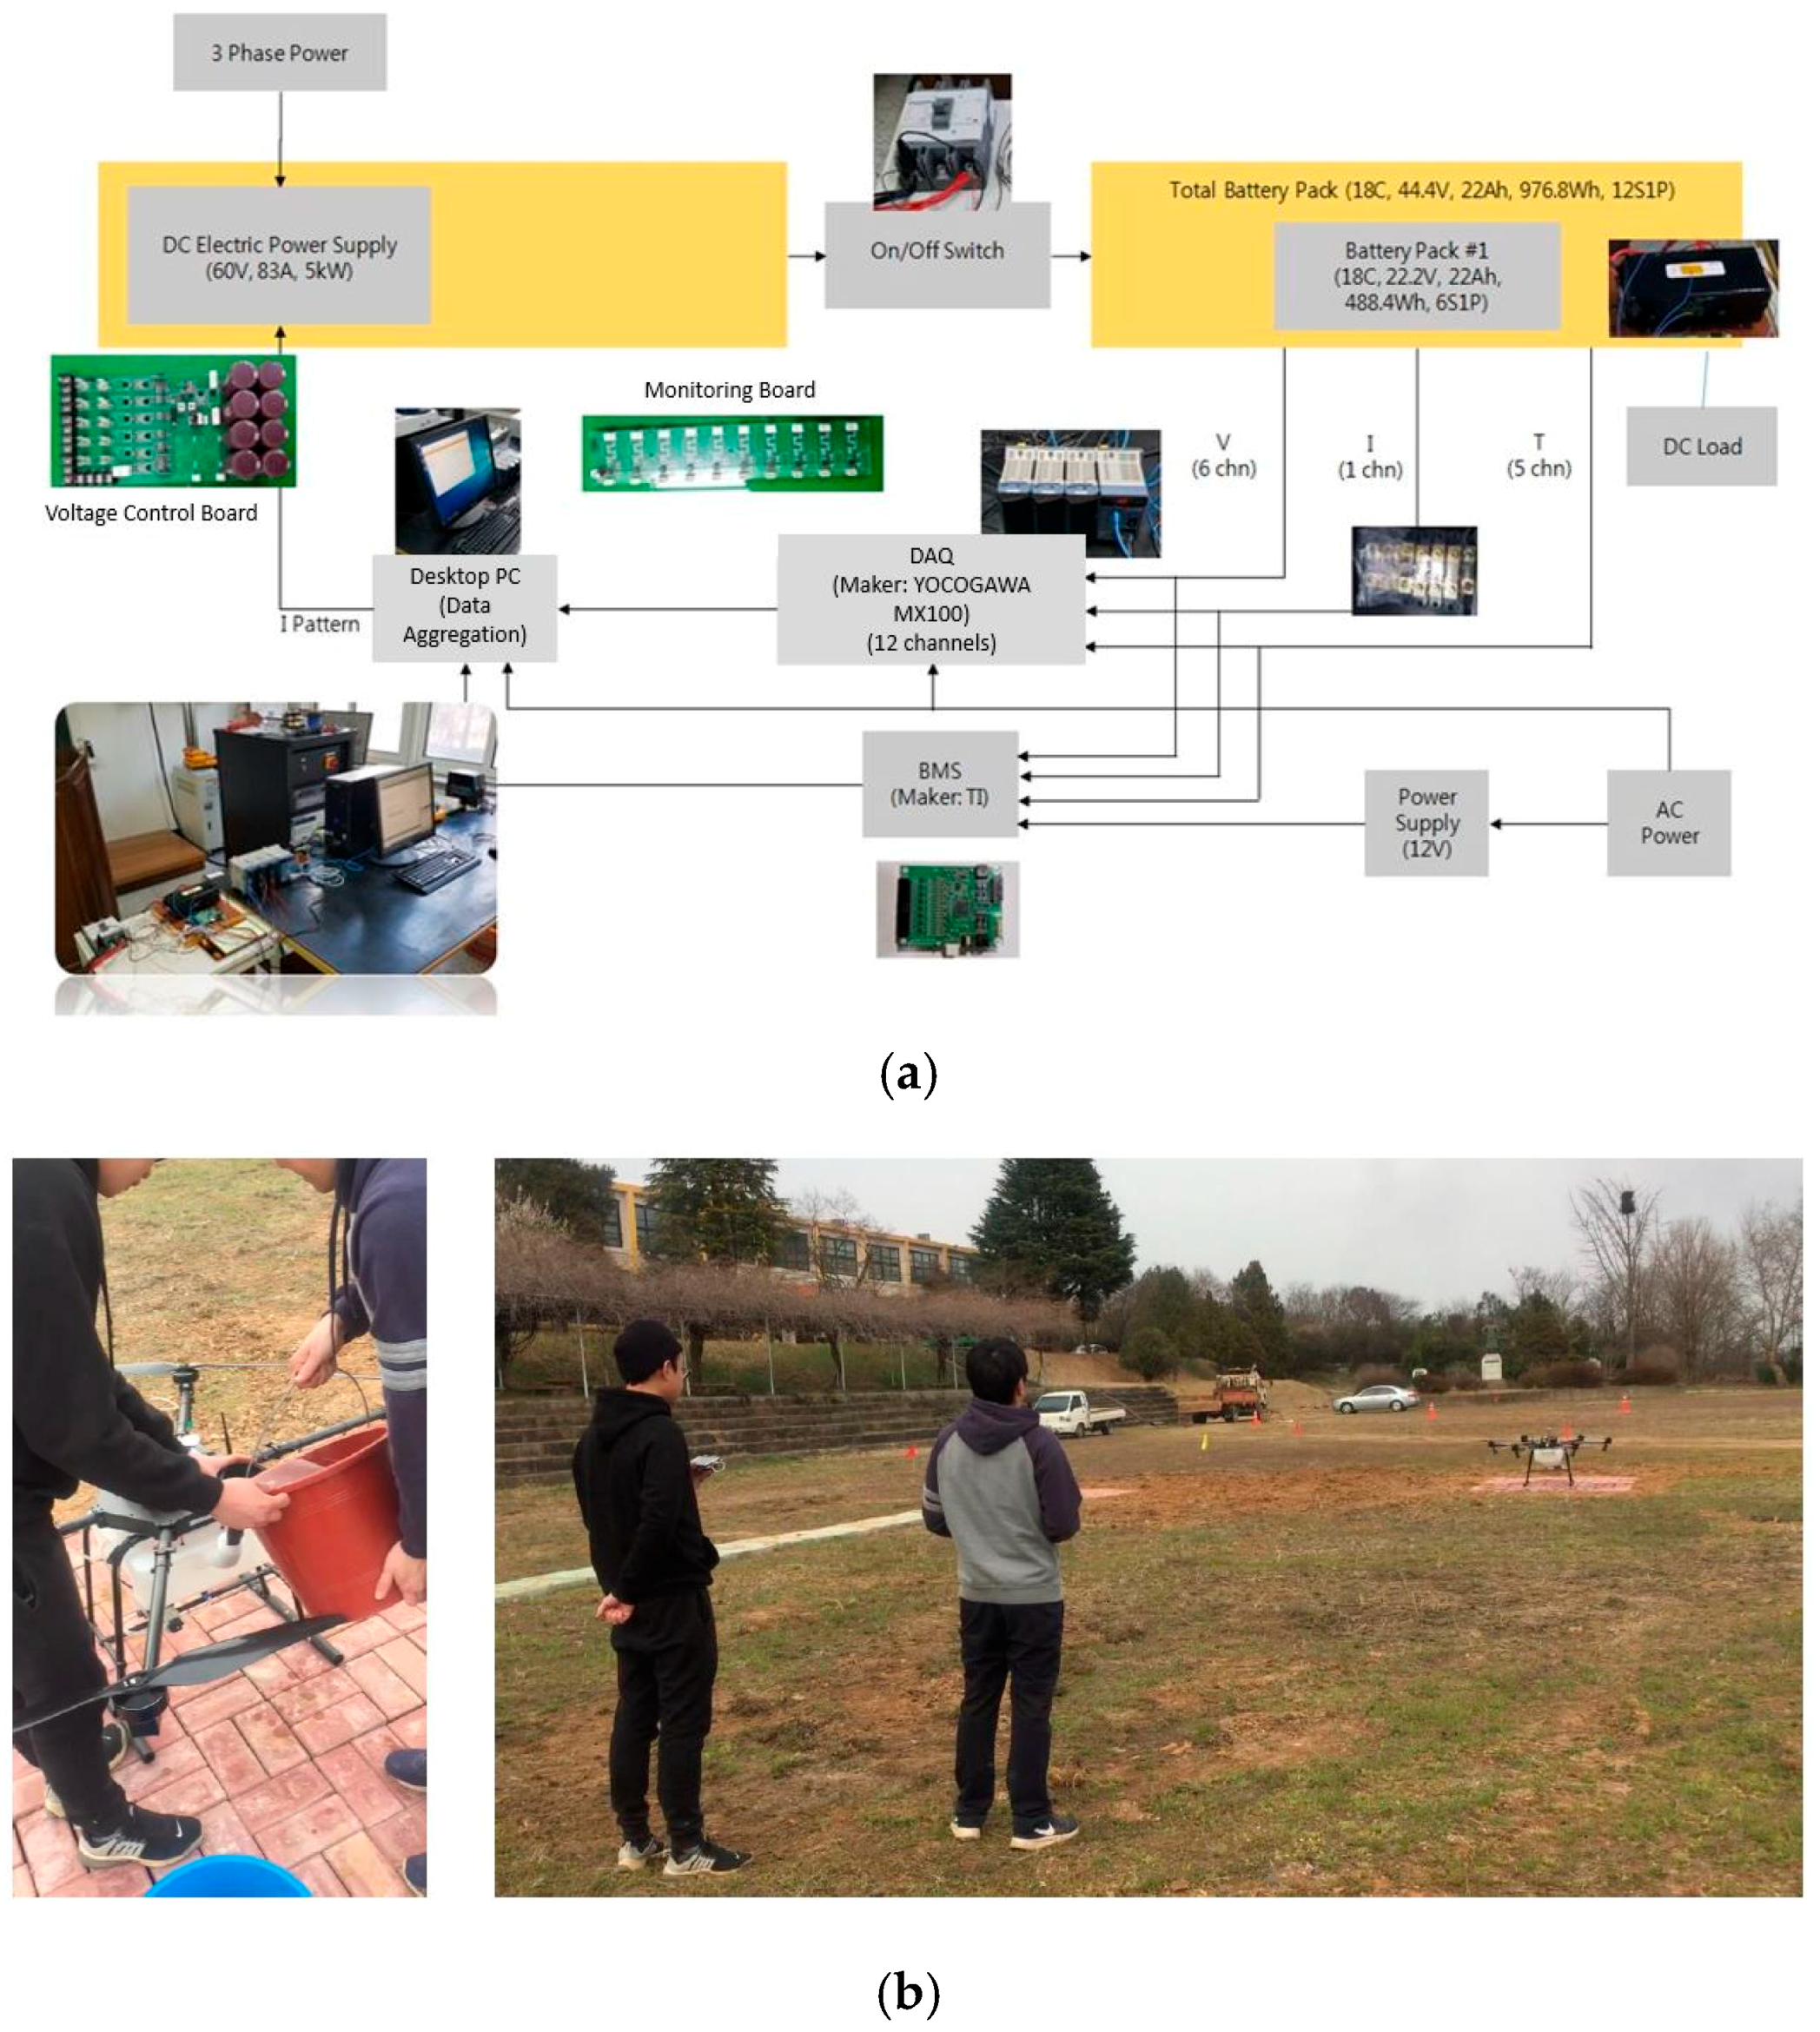
In the nonlinear system model shown in Equation (6), initial states of each cell are set as [ v c 1 ,     v c 2 ,     z ] = [ 0 ,   0 ,   1 ] to use the EKF algorithm. Detailed derivations of the estimation vector and covariance vector propagation of the EKF algorithm are omitted in this paper since it is a general method [11].

3. Test Setup

3.1. Test Environment
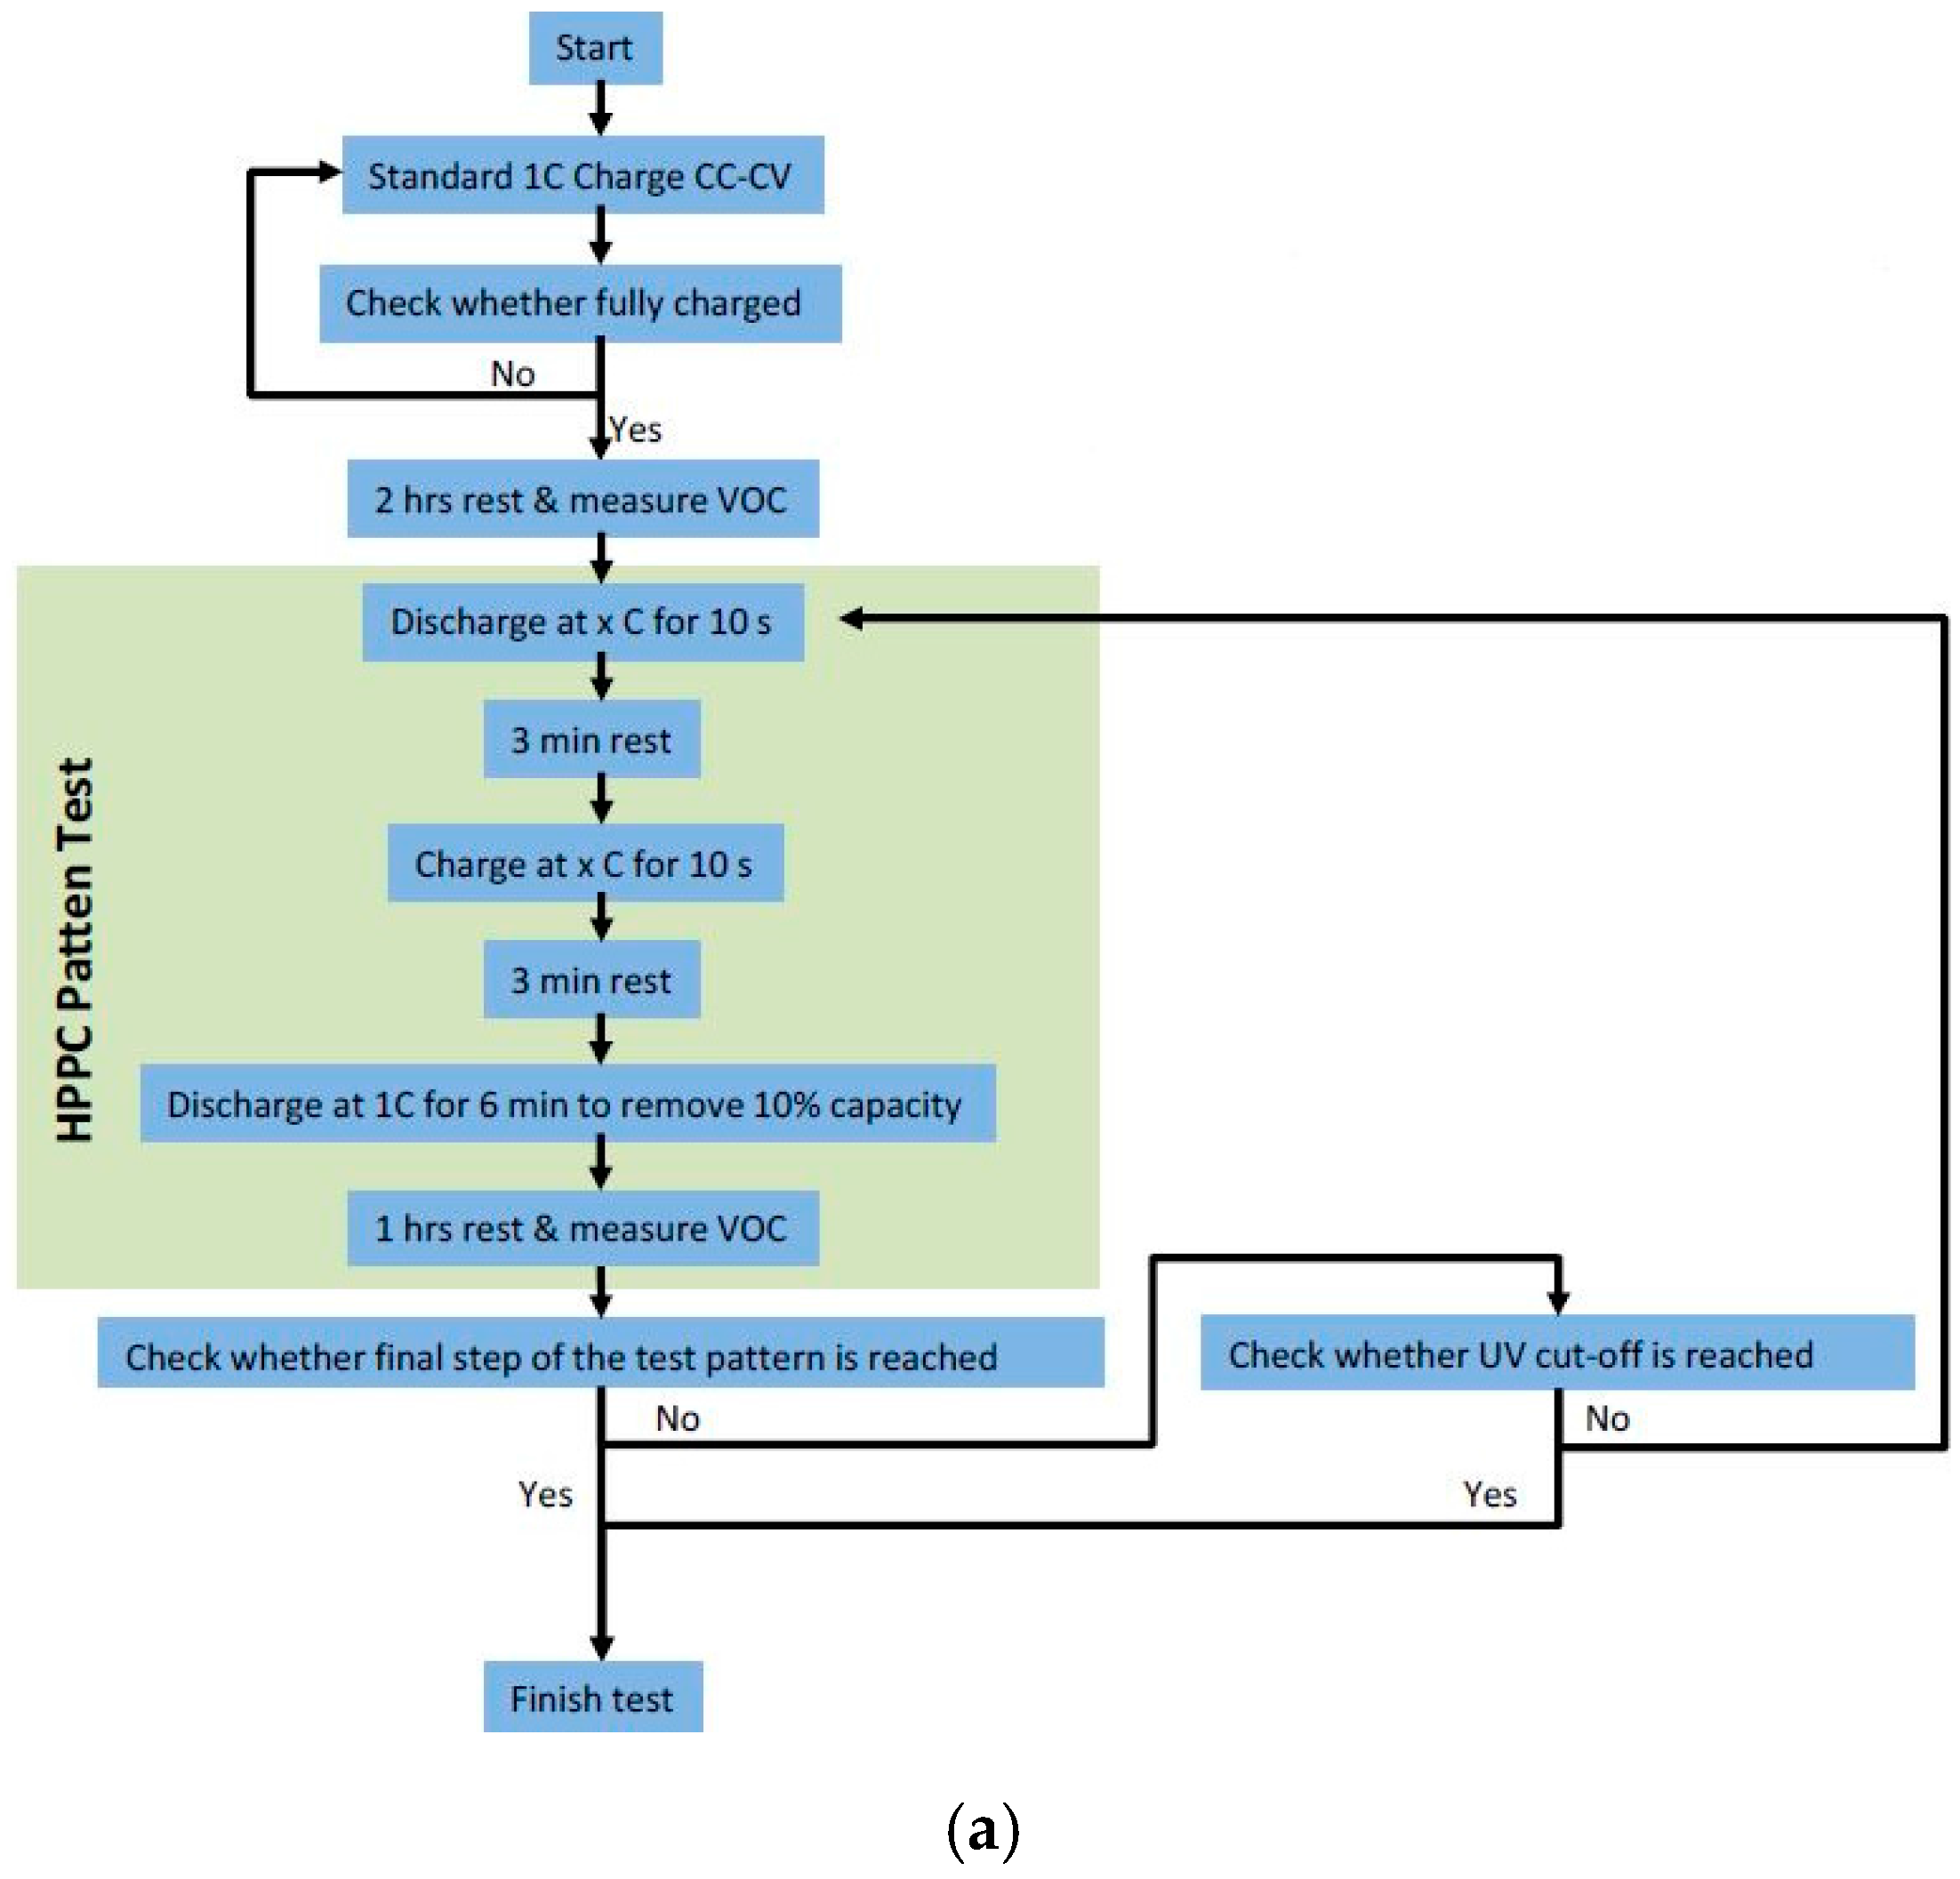
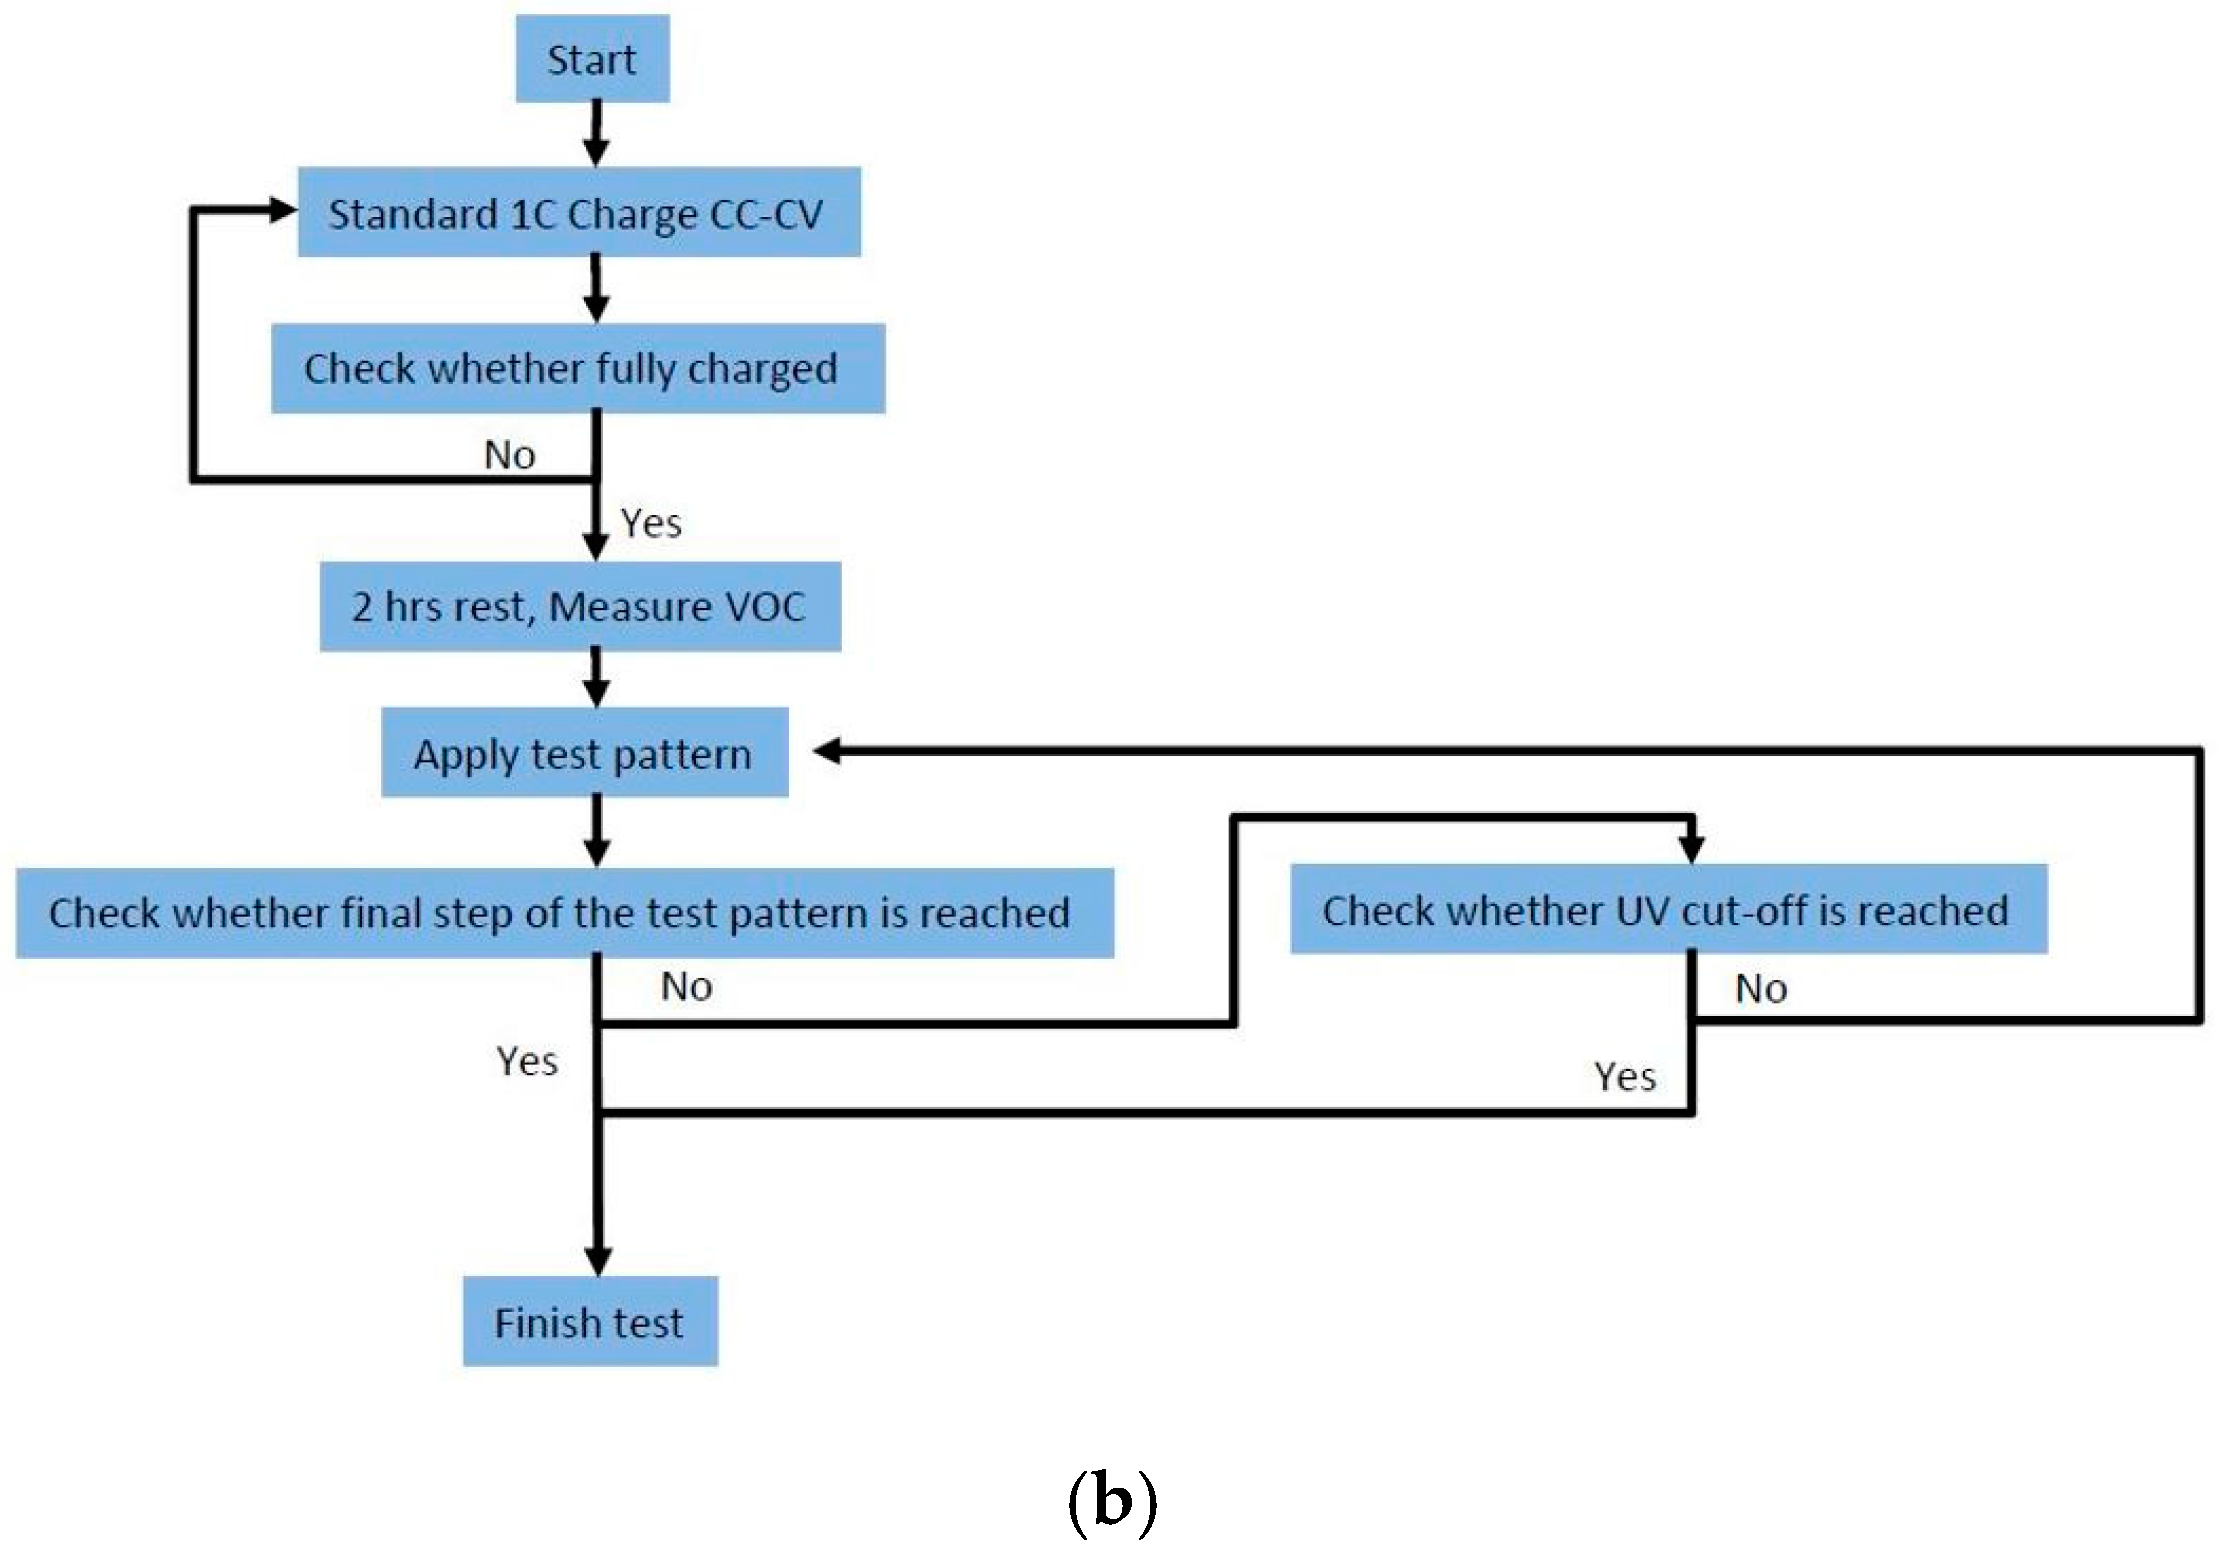
The indoor test environment and outdoor test environment are shown in Figure 5.

3.2. Test Case

Tests are divided into two branches, including HPPC tests and discharging tests, as shown in Figure 6.

4. Experimental Results

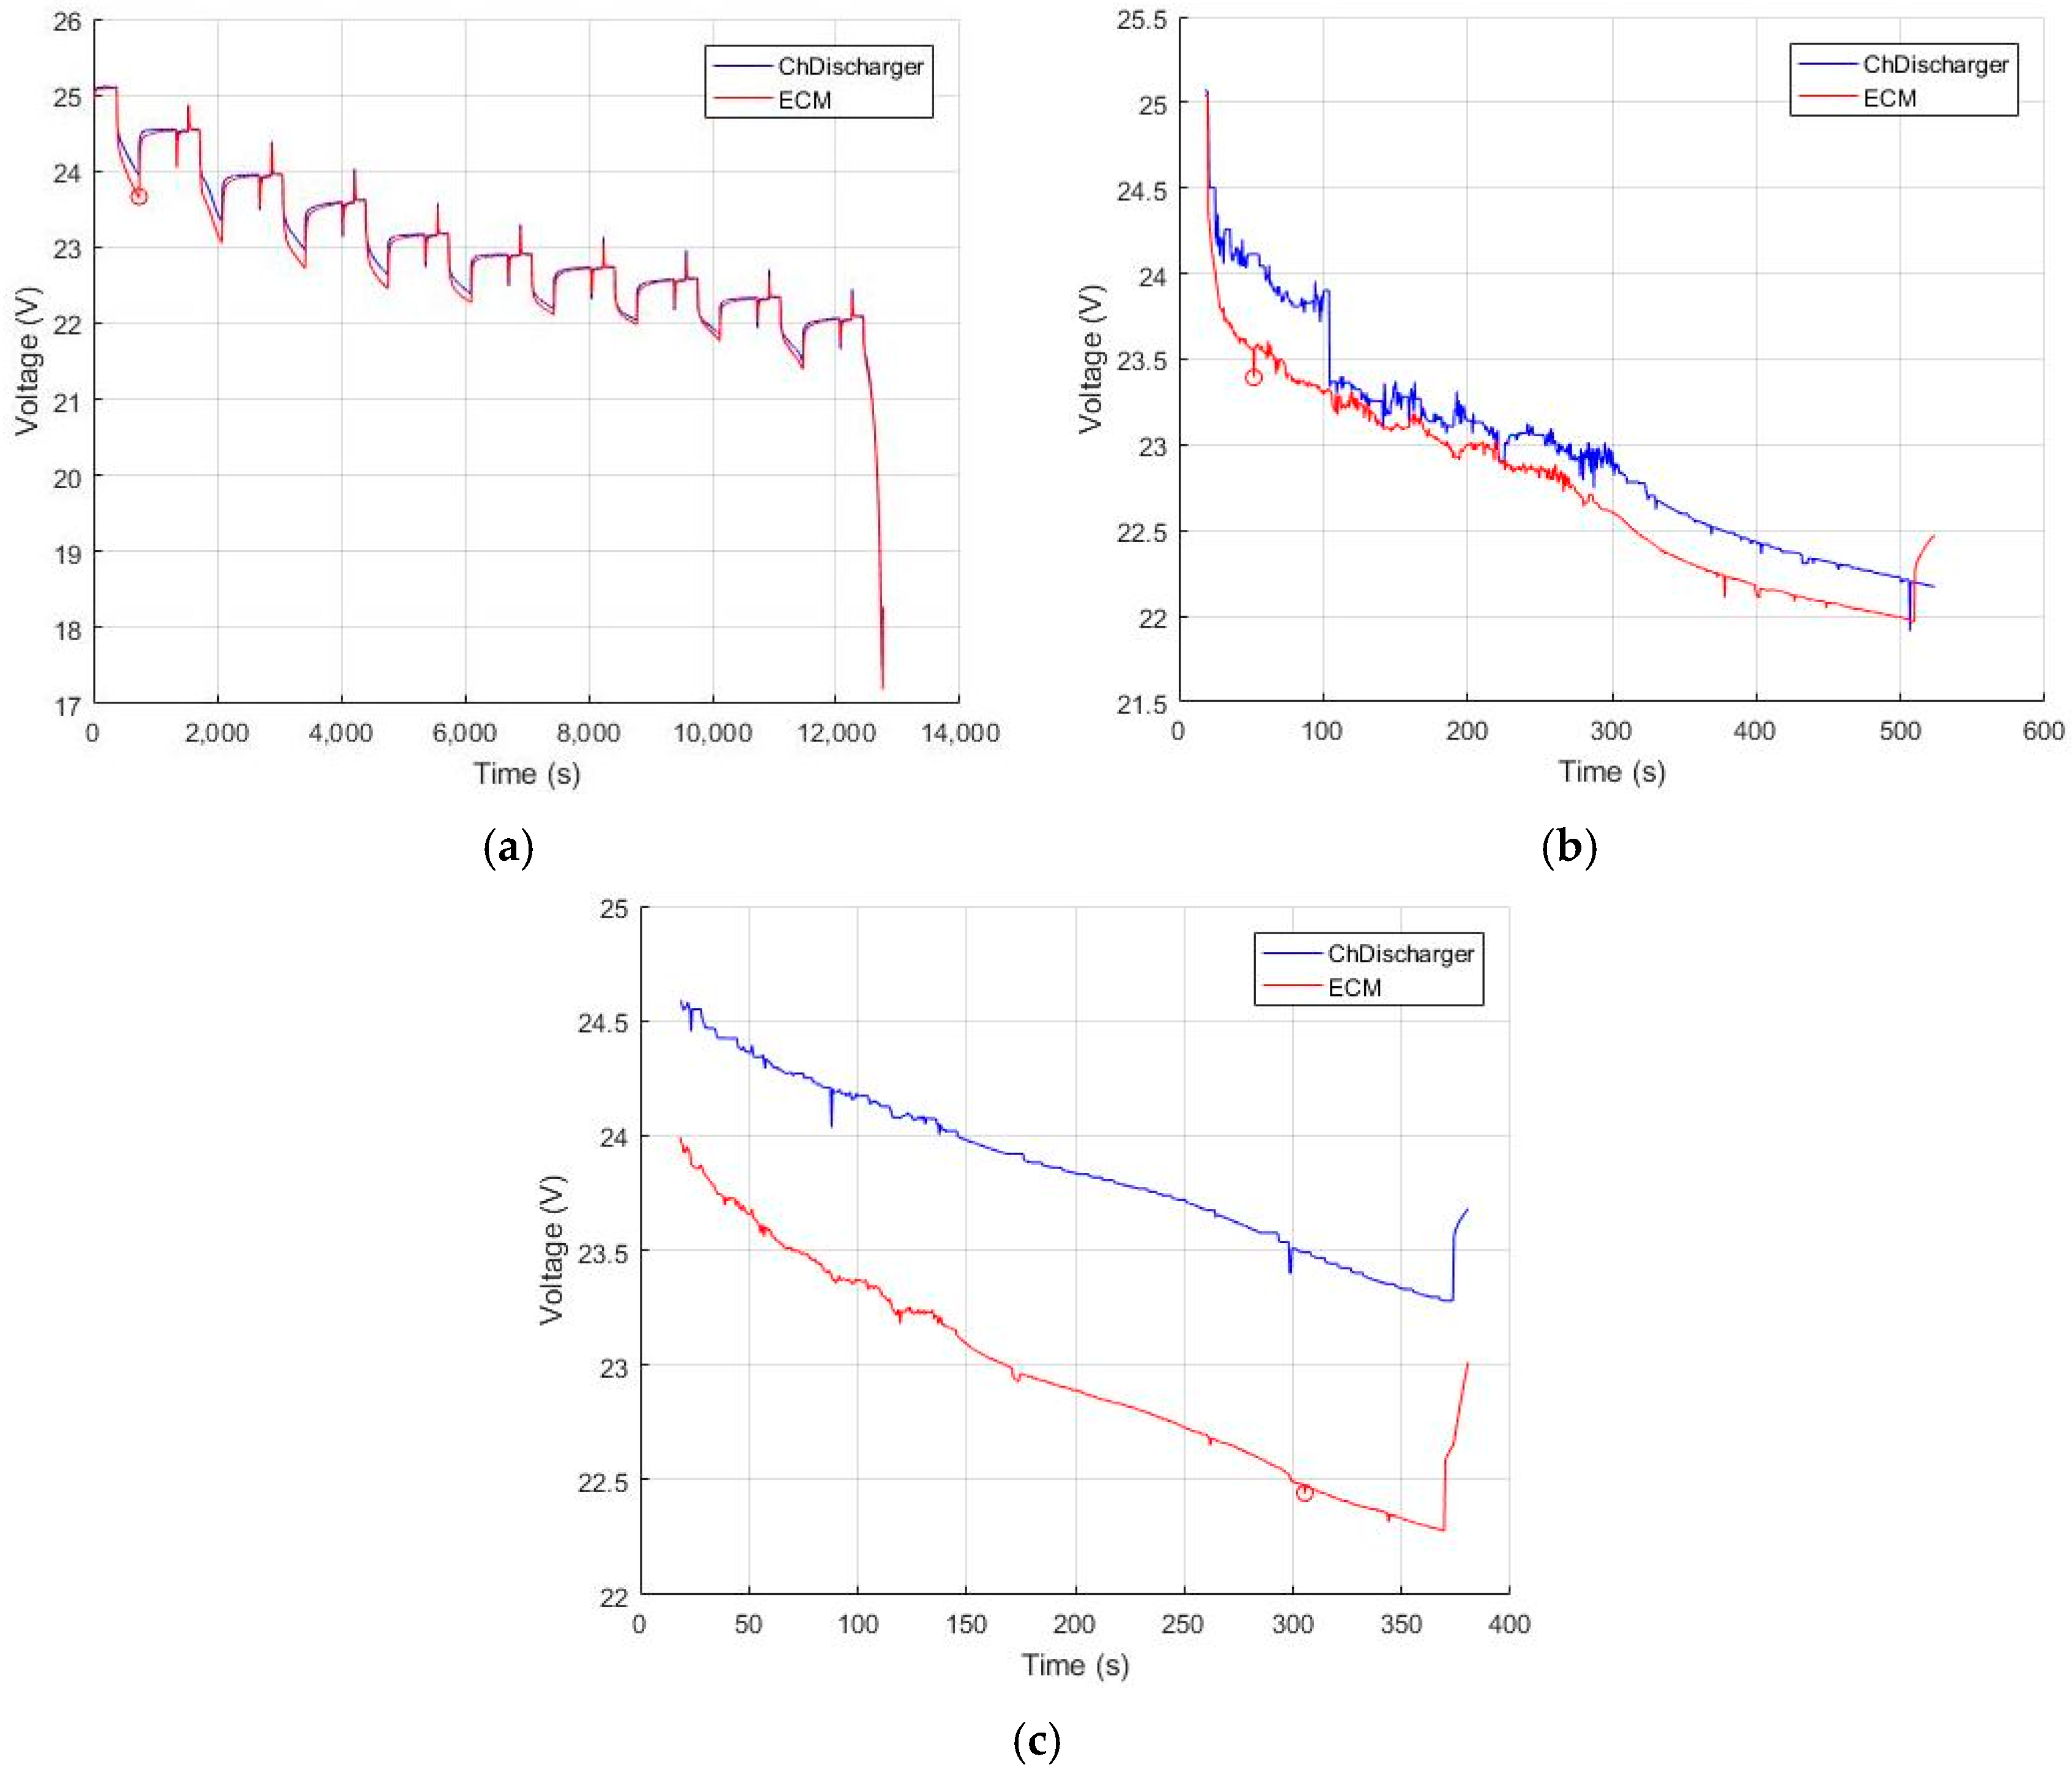
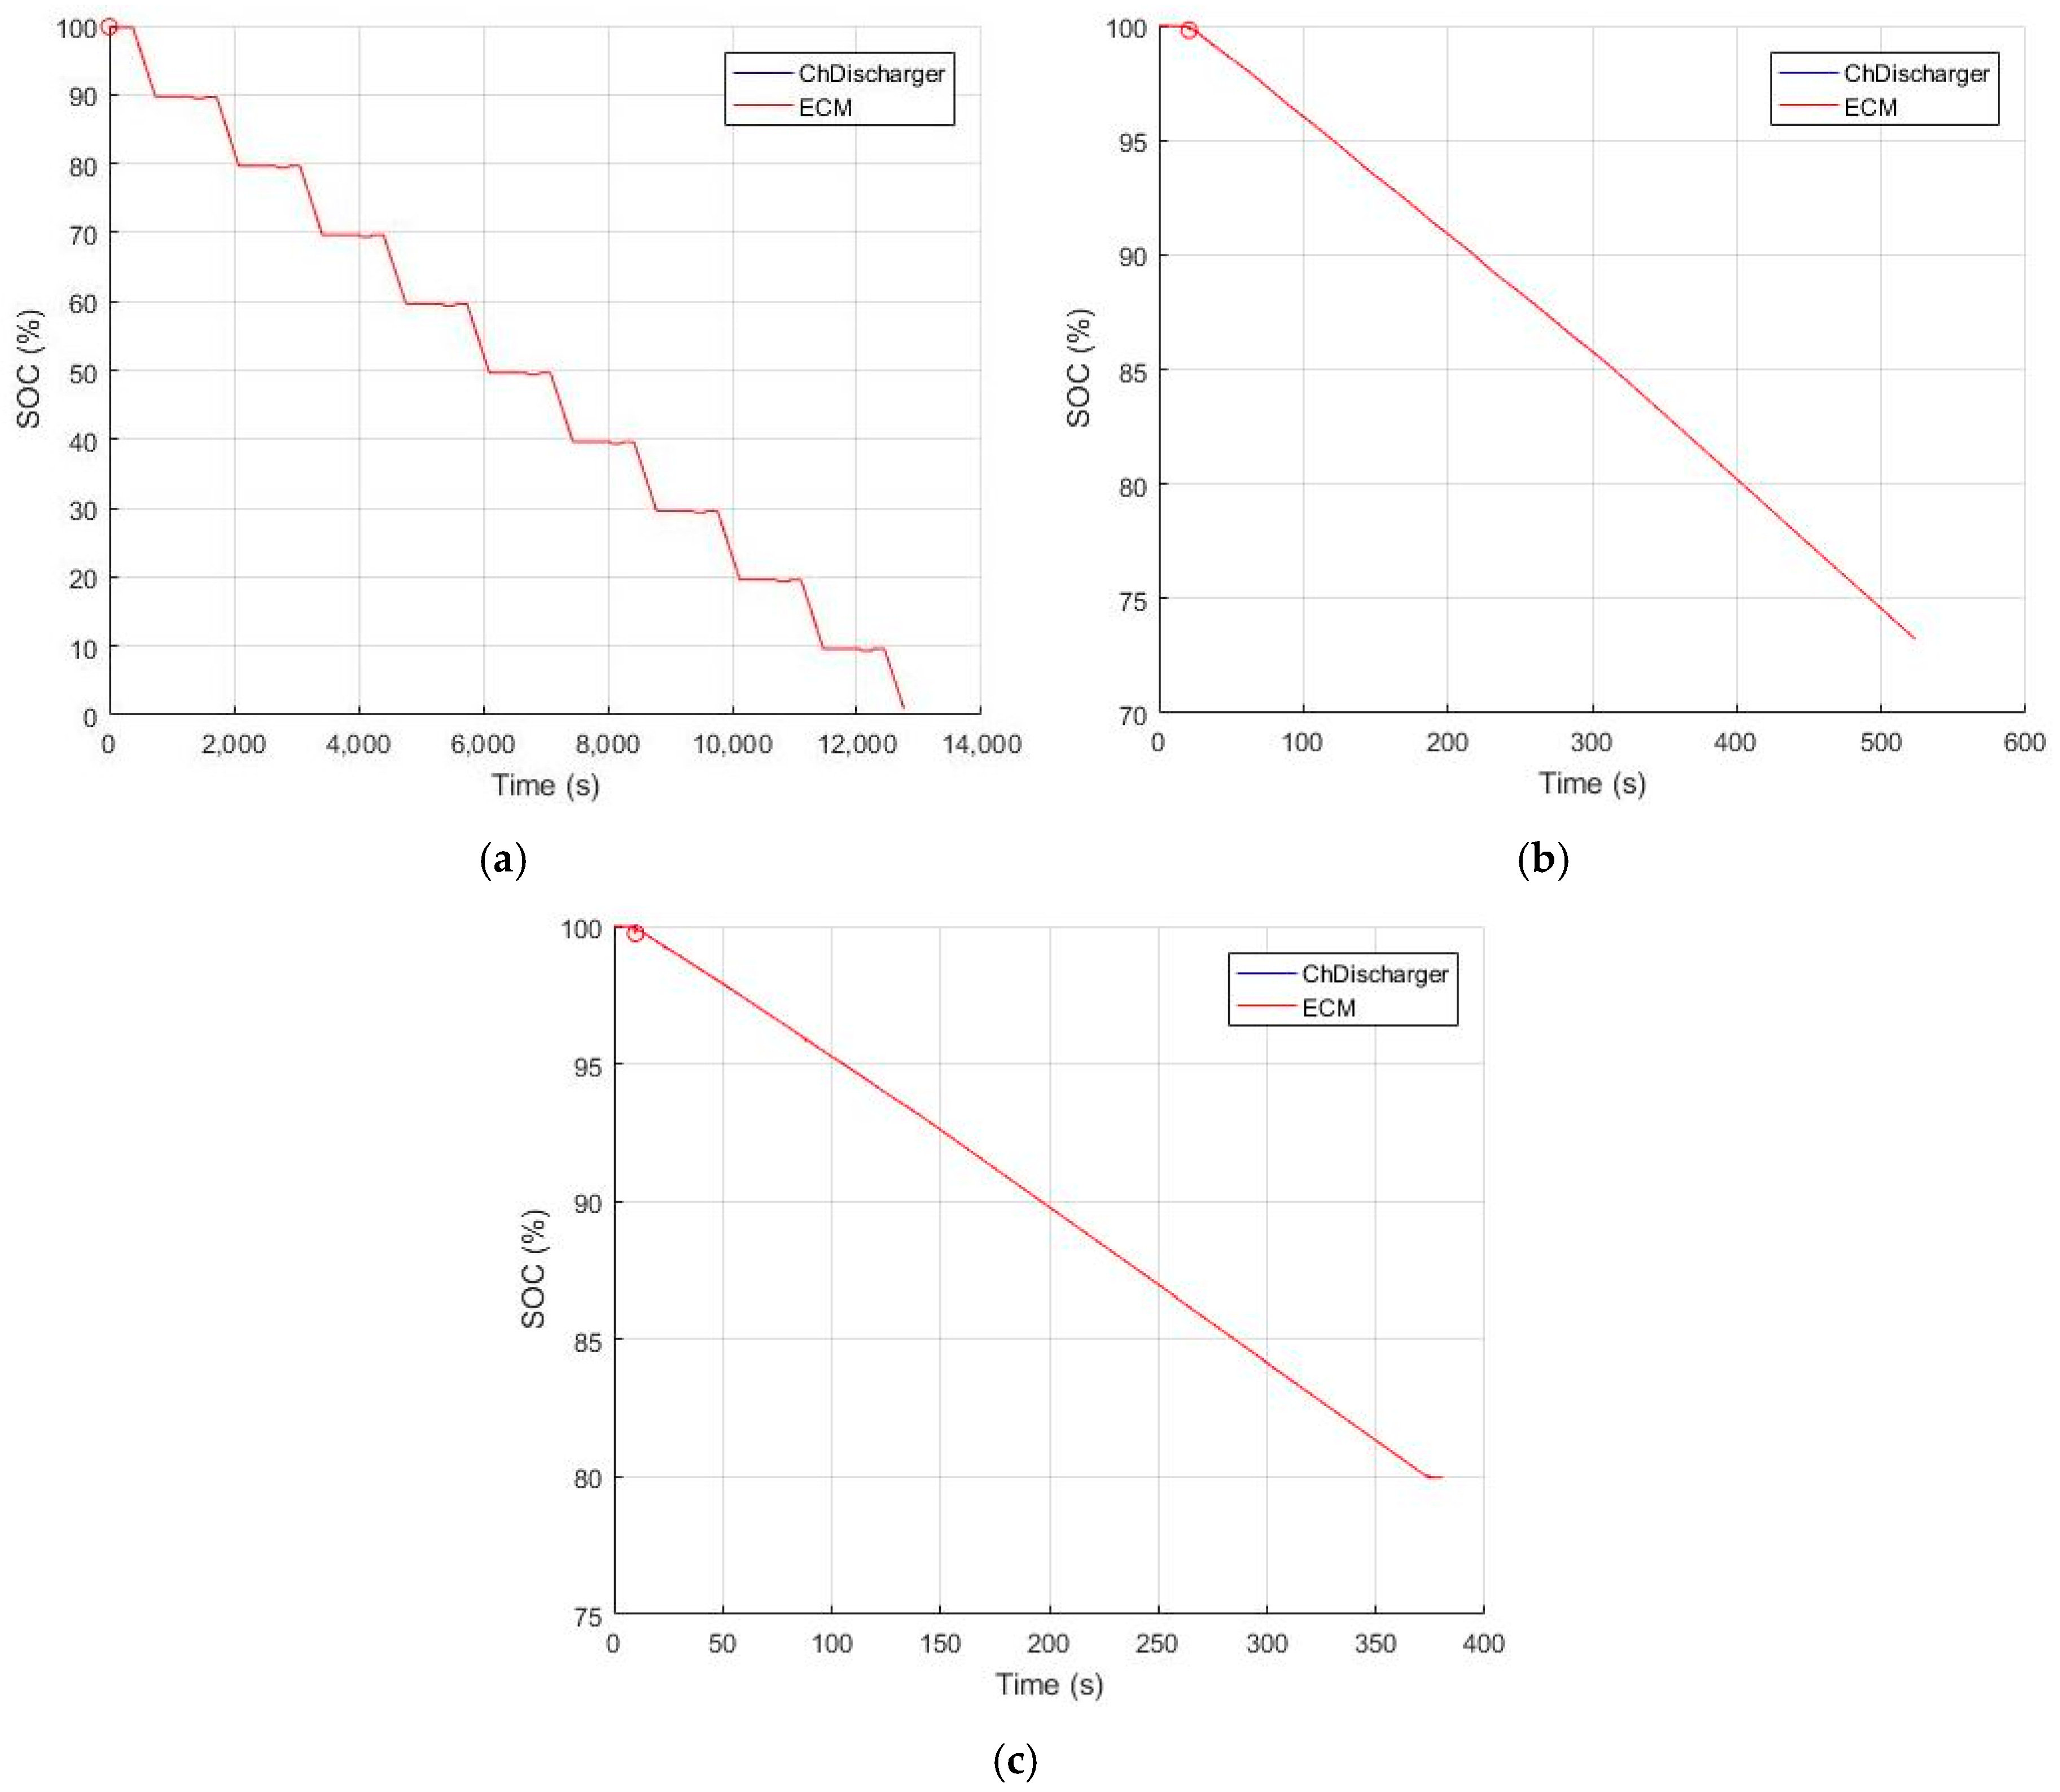
4.1. SOC Estimation Result

By varying K soc in Figure 4, the maximum and root mean square (RMS) errors of the v ocv and SOC are compared as shown in Table 1, Table 2 and Table 3 and Figure 7 and Figure 8. Here, the upper value represents the maximum v ocv error and the lower value represents the SOC error.

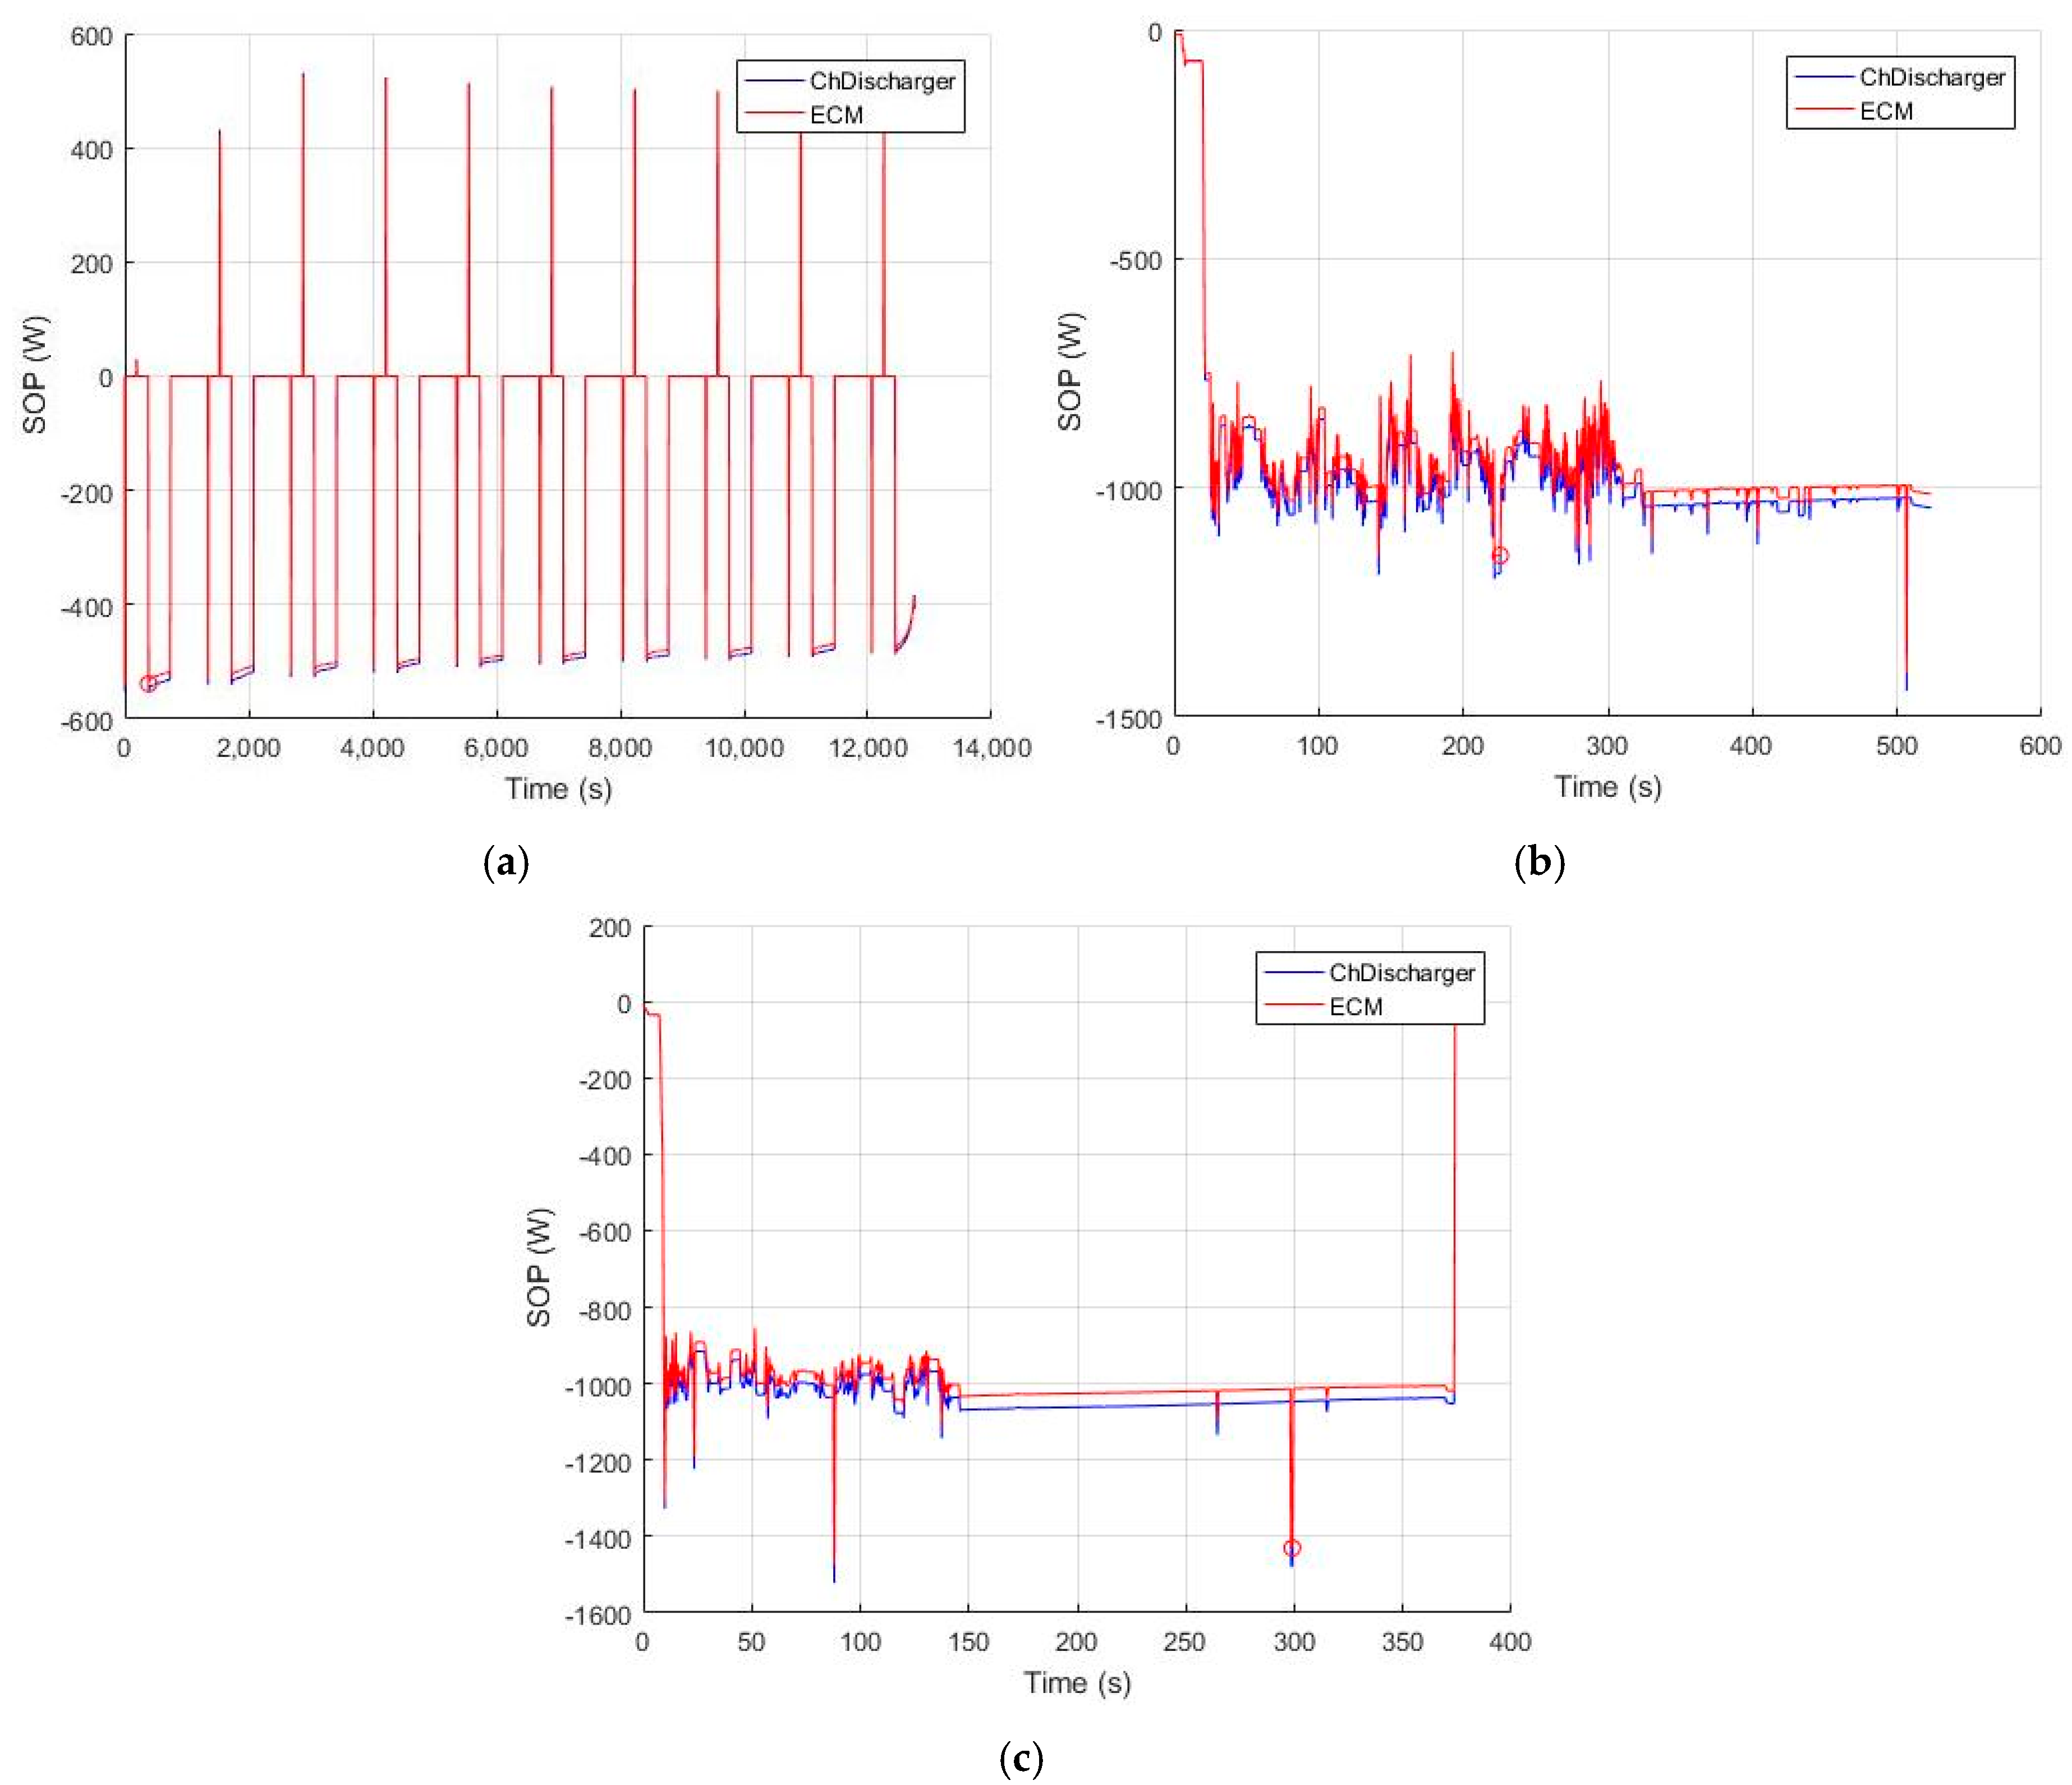
4.2. SOP Estimtion Result

By varying K soc in Figure 4, the maximum and root mean square (RMS) errors of the SOP are compared as shown in Table 4, Table 5 and Table 6 and Figure 9. Here, the upper value represents the maximum SOP error (W) and the lower value represents the RMS SOP error (W).

5. Conclusions

EKF-based battery SOC and SOP estimation methods are described. According to the indoor and outdoor test results, the most accurate v ocv and SOC estimations occur when the EKF is applied with K soc = 1 , but the most accurate SOP estimation occurs when the EKF is not applied with K soc = 1 . Analysis results show that the maximum SOC estimation error turns out to be 0.1477% (indoor test with HPPC), 0.1324% (outdoor test with 0 kg payload), and 0.2021% (outdoor test with 10 kg payload). Also, the maximum SOP estimation error turns out to be 1.2% (indoor test with HPPC), 3.6% (outdoor test with 0 kg payload), and 4.2% (outdoor test with 10 kg payload). These results show that, in contrast to the SOC calculation, the EKF method is not as beneficial as the current integration method in the case of calculating the SOP.
One of the novel contributions of this paper is the development of the SOC and SOP estimation logics, including the accompanying equations and algorithms shown in Section 2.3 and Section 2.4. In particular, we have demonstrated unique methods to find the maximum discharging current considering the individual cell voltage that is necessary to calculate the maximum discharging power which each cell could perform. We also used both the CF and EKF for the state estimation in contrast to the existing research papers in which only one of those was adopted. Compared to other research works, we used a real agricultural quadrotor UAV carrying 10 kg of pesticides to achieve the real-life discharging current data. With the field data, we could design more suitable parameters of the SOC and SOP estimation algorithms compared to the other researches in the sense of the estimation accuracy. In the future, we will adopt the enhanced self-correcting (ESC) ECM and unscented Kalman filter (UKF) method to improve the SOP estimation.

Acknowledgments

This work was supported by the national research foundation of Korea (NRF) through the project (2017018040).

Author Contributions

Sunghun Jung is credited with the majority of the paper, including overall research direction, theoretical formulation, simulation, experiments, data analysis, and writing paper; Heon Jeong prepared the software tool for the indoor experiments and idea provision.

Conflicts of Interest

The authors declare no conflict of interest.

References

  1. Drone Market to Hit 3 Million Units in 2017 with $6 Billion in Revenue, Says Gartner. Available online: https://goo.gl/H9SRkx (accessed on 11 July 2017).
  2. Clothier, R.A.; Walker, R.A. Determination and evaluation of UAV safety objectives. In Proceedings of the 21st International Unmanned Air Vehicle Systems Conference, Bristol, UK, 3–5 April 2006. [Google Scholar]
  3. Siebery, S.; Teizer, J. Mobile 3D mapping for surveying earthwork projects using an unmanned aerial vehicle (UAV) system. Autom. Constr. 2014, 41, 1–14. [Google Scholar] [CrossRef]
  4. Dempsey, M.E. Eyes of the Army—U.S. Army Roadmap for Unmanned Aircraft Systems Roadmap 2010–2035; U.S. Army UAS Center of Excellence: Fort Rucker, AL, USA, 2010; Volume 9, pp. 1–140. [Google Scholar]
  5. Plett, G.L. Battery management systems. In Equivalent-Circuit Methods, 2nd ed.; Artech House Publishers: Norwood, MA, USA, 2014; Volume 2. [Google Scholar]
  6. Gao, Z.; Chin, C.S.; Woo, W.L.; Jia, J. Integrated equivalent circuit and thermal model for simulation of temperature-dependent LiFePO4 battery in actual embedded application. Energies 2017, 10, 85. [Google Scholar] [CrossRef]
  7. Gao, Z.; Chin, C.S.; Woo, W.L.; Jia, J.; Toh, W.D. Lithium-ion battery modeling and validation for smart power system. In Proceedings of the IEEE International Conference on Computer, Communications, and Control Technology, Sabah, Malaysia, 21–23 April 2015. [Google Scholar]
  8. Jia, J.; Lin, P.; Chin, C.S.; Toh, W.D.; Gao, Z.; Lyu, H.; Cham, Y.T.; Mesbahi, E. Multirate strong tracking extended kalman filter and its implementation on lithium ion phosphate (LiFePO4) battery system. In Proceedings of the IEEE 11th International Conference on Power Electronics and Drive Systems, Sydney, Australia, 9–12 June 2015. [Google Scholar]
  9. Sharma, O.P. Analysis and parameter estimation of Li-ion batteries simulations for electric vehicles. In Proceedings of the American Control Conference, Sam Francisco, CA, USA, 29 June–1 July 2011. [Google Scholar]
  10. Thanagasundram, S.; Arunachala, R.; Makinejad, K.; Teutsch, T.; Jossen, A. A cell level model for battery simulation. In Proceedings of the European Electric Vehicle Congress, Brussels, Belgium, 19–22 November 2012. [Google Scholar]
  11. Plett, G.L. Extended Kalman filtering for battery management systems of LiPB-based HEV battery packs —Part 3: State and parameter estimation. J. Power Sources 2004, 134, 277–292. [Google Scholar] [CrossRef]
Figure 1. Two ladder battery ECM.
Energies 10 01237 g001
Figure 2. Impedance voltage response.
Energies 10 01237 g002
Figure 3. ECM parameter values: (a) R 0 ; (b) R 1 ; (c) C 1 ; (d) R 2 ; and (e) C 2 .
Energies 10 01237 g003aEnergies 10 01237 g003b
Figure 4. Overall SOC and SOP state estimation logic: (a) without EKF; and (b) with EKF.
Energies 10 01237 g004
Figure 5. Test environments: (a) indoors; and (b) outdoors.
Energies 10 01237 g005
Figure 6. Test schedules: (a) HPPC test; and (b) discharging test.
Energies 10 01237 g006aEnergies 10 01237 g006b
Figure 7. The v ocv comparison result (w/EKF and K soc = 1 ): (a) HPPC; (b) 0 kg payload; and (c) 10 kg payload.
Energies 10 01237 g007
Figure 8. The SOC comparison result (w/EKF and K soc = 1 ): (a) HPPC; (b) 0 kg payload; and (c) 10 kg payload.
Energies 10 01237 g008
Figure 9. The SOP comparison result (w/o EKF and K soc = 1 ): (a) HPPC; (b) 0 kg payload; and (c) 10 kg payload.
Energies 10 01237 g009
Table 1. Indoor test result (HPPC).
Indoor Test K s o c
00.51
v o c v (V)SOC (%) v o c v (V)SOC (%) v o c v (V)SOC (%)
w/o EKF0.757839.93620.742418.60680.73400.0069
0.16239.46530.16055.18730.16930.0038
w/EKF0.645829.98230.673515.21180.67950.1477
0.105410.60690.10925.44020.12030.0030
Table 2. Outdoor test result (0 kg payload).
Outdoor Test 1 K soc
00.51
v o c v (V)SOC (%) v o c v (V)SOC (%) v o c v (V)SOC (%)
w/o EKF0.499769.70820.499929.14480.48560.0197
0.232639.00100.184915.96140.14830.0129
w/EKF0.688152.03180.766529.39090.72080.1324
0.210336.88500.228721.14770.27640.0097
Table 3. Outdoor test result (10 kg payload).
Outdoor Test 2 K soc
00.51
v o c v (V)SOC (%) v o c v (V)SOC (%) v o c v (V)SOC (%)
w/o EKF1.079360.98820.611020.11750.78270.0198
0.505325.81710.469111.72990.65900.0133
w/EKF0.791042.09990.928825.99211.04850.2021
0.679431.03690.810818.36910.90320.0133
Table 4. Indoor test result (HPPC).
Indoor Test K soc
00.51
SOP (W)
w/o EKF498.5191487.428813.5058
23.320611.76254.9253
w/EKF490.4252210.212816.2359
14.17845.54375.2790
Table 5. Outdoor test result (0 kg payload).
Outdoor Test 1 K soc
00.51
SOP (W)
w/o EKF64.002546.834739.6367
34.381727.346928.9584
w/EKF43.044448.146161.0896
30.853435.006440.3603
Table 6. Outdoor test result (10 kg payload).
Outdoor Test 2 K soc
00.51
SOP (W)
w/o EKF49.529046.536247.9866
31.855828.940732.2639
w/EKF58.215863.052466.8031
35.272640.031843.3475

