Article

Quantifying Cathode Water Transport via Anode Relative Humidity Measurements in a Polymer Electrolyte Membrane Fuel Cell

1
Chemical and Biological Engineering Department, Montana State University, Bozeman, MT 59717, USA
2
Department of Chemical and Biological Engineering, University of Saskatchewan, Saskatoon, SK S7N 5A9, Canada
3
Energy Research Institute, Montana State University, Bozeman, MT 59717, USA
*
Author to whom correspondence should be addressed.
Energies 2017, 10(8), 1222; https://doi.org/10.3390/en10081222
Submission received: 6 July 2017 / Revised: 11 August 2017 / Accepted: 15 August 2017 / Published: 17 August 2017

Abstract

:
A relative humidity (RH) measurement based on pressure drop analysis is presented as a diagnostic tool to experimentally quantify the amount of excess water on the cathode side of a polymer electrolyte membrane fuel cell (PEMFC). Ex-situ pressure drop calibration curves collected at fixed RH values, used with a set of well-defined equations for the anode pressure drop, allows for an estimate of in-situ relative humidity values. During the in-situ test, a dry anode inlet stream at increasing flow rates is used to create an evaporative gradient to drive water from the cathode to the anode. This combination of techniques thus quantitatively determines the changing net cell water flux. Knowing the cathodic water production rate, the net water flux to the anode can explain the influence of liquid and vapor transport as a function of GDL selection. Experimentally obtained quantified values for the water removal rate for a variety of cathode gas diffusion layer (GDL) setups are presented, which were chosen to experimentally vary a range of water management abilities, from high to low performance. The results show that more water is transported to the anode when a GDL with poor water management capabilities is used, due to the higher levels of initial saturation occurring on the cathode. At sufficiently high concentration gradients, the anode removes more water than is produced by the reaction, allowing for the quantification of excess water saturating the cathode. The protocol is broadly accessible and applicable as a quantitative diagnostic tool of water management in PEMFCs.

1. Introduction

Polymer electrolyte membrane fuel cells (PEMFCs) are energy conversion devices featuring zero local greenhouse emissions, high power density, low operating temperature, and a rapid start up, making them attractive candidates for integration into vehicular and mobile applications [1]. Although there remain technical challenges related to hydrogen storage and distribution, as well as the robustness and durability of PEMFCs, the attractive benefits of widespread fuel cell adoption have driven continued research into this technology for the past few decades. One of the key issues affecting the short-term performance and the long-term durability of PEMFCs is water management [2]. Water is produced in an electrochemical reaction at the cathode, and to obtain maximal PEMFC efficiency, the membrane electrode assembly (MEA) must be kept within a window of optimal hydration. In order to obtain optimal cell performance, the water content within the cell must be maintained at a level such that the catalyst coated membrane (CCM) is well hydrated, so as to promote the ionic conductivity, yet to not reach a point where water accumulation begins to block or restrict the mass transport of the reactant gases to the catalyst sites. Either one of these extreme cases of overall cell hydration can cause degradation of key cell components, or even result in total cell failure [3,4]. Due to these reasons, proper water management is an extremely important aspect of fuel cell operation.
To this end, multiple strategies and material improvements have been made to help optimize water management within PEMFCs. Research groups have investigated reactive control strategies via signal analysis and the manipulation of operating conditions [5]. Hussaini et al. [6] demonstrated a dynamic external intermittent humidification scheme using a single serpentine flow field, as well as a multiple, parallel channel flow field. Song et al. [7] investigated the connection between the hydrogen pressure drop with the development of cathode flooding within a fuel cell and proposed a hydrogen purge scheme, along with humidification modification, as a water management scheme for an operating PEMFC. Damour et al. [8] developed a control scheme for an air flow controller to regulate membrane humidity and optimize PEMFC performance. Pahon et al. [9] proposed a signal-based fault diagnostic approach using relative wavelet energy to analyze signals from a 40-cell stack to identify abnormal or healthy operation. These signal-based approaches are based on reacting to a change in the voltage or pressure signal to identify the beginning of the flooding condition, and then modifying the flow conditions, namely the relative humidity (RH) of the flow streams, to move the fuel cell away from the flooded state. Research has also been done on the modification of material properties and structure of various PEMFC components. Alink et al. [10] investigated the effects on water management from machined and laser modifications to the porous layer and found that selective perforations to the cathode microporous layer (MPL) helped improve performance in both flooding and dry conditions. Chen et al. [11] studied the effect of different MPL compositions in relation to different air RH, and found that the MPL composition should be optimized in relation to the operating RH of the cathode in order to maximize performance. Finally, Li et al. [12] investigated four different cathode types with varying structures and properties to study the relationship between their water management capabilities and electrochemical performance. They showed that a hydrophobic CCM and MPL assisted in membrane hydration while avoiding cell flooding. In addition, multiple models have been created with the aim to better understand the two-phase transport of water within the porous layer [13,14,15], at the catalyst layer and across the membrane [16,17], and within the gas flow channels [18,19]. Attempts have been made to model the relation between the cell water content to cell performance, showing that oversaturation or flooding on the cathode side leads to lower performance [20,21,22]. Understanding the water transport characteristics of the various PEMFC elements allows for the creation of more accurate numerical models, as well as the intelligent design of key components to help to intrinsically manage water accumulation within the cell. Numerous studies have investigated the water transport characteristics of these elements using a variety of methods. Yau et al. [23] determined that water crossover rates of MEAs placed in a non-operating fuel cell using a specially designed setup, which included infrared sensors and specific considerations for post fuel cell gas processing. Morgan and Datta [24] investigated how different gas diffusion layer (GDL) characteristics can effect diffusivity, as well as performance by using a specially designed water vapor diffusivity measurement tool. Chevalier et al. [25] were able to perform in-situ measurements of the effective diffusivity of a GDL using synchrotron X-ray radiography (Canadian Light Source facility, Saskatoon, SK, Canada).
One of the challenges facing both the experimental design space and modeling efforts is the accurate quantification of water within the cell, both in terms of where the water is accumulating and how it is transporting through various components of the cell. Methods to visualize liquid water within a PEMFC have been performed in-situ with X-ray radiography and neutron beam radiography, as well as a number of optical visualization experiments taken using a modified fuel cell structure [26]. Specifically, using synchrotron X-ray tomography Krüger et al. [27] qualitatively demonstrated the increasing GDL saturation that accompanies higher current density operation. Additionally, soft X-ray tomography was used by Deevanhxay et al. [28] to visualize the additional flooding between the GDL and the CCM when a MPL was not applied to the cathode GDL. Recently, Banerjee et al. [29] transiently visualized the increase in porous layer liquid water saturation accompanying the higher current densities. They found that the saturation level increased to a certain threshold, after which increasing the current density no longer increased the liquid water saturation. Owejan et al. [30] used neutron beam radiography to investigate water transport and accumulation in a 7% polytetrafluoroethylene (PTFE) hydrophobic treated GDL and found that the GDL could become 44% saturated before water began to be pushed into the gas channels. Using a modified fuel cell structure, Hussaini et al. [31] optically visualized cathode channel flooding to investigate two-phase flow properties and qualitatively showed voltage degradation under conditions that promoted flooding and oversaturation of the GDL. Owejan et al. [32] investigated the liquid and vapor transport mechanisms related to MPL characteristics ex-situ and studied how they affected performance in-situ.
In all cases, the studies either required highly specialized equipment, or the modification of the fuel cell architecture. Some efforts have been made to determine ‘flooding’ conditions in realistic fuel cells without the need for advanced techniques. One such protocol, Anode Water Removal (AWR), was previously shown to qualitatively identify poor cell performance due to cathode GDL flooding [33,34]. This method relies on the manipulation of an evaporative gradient created by running the fuel cell with a dry anode stream at systematically increasing flow rates. In situations prone to the accumulation of water on the cathode, a voltage increase was noted as the concentration gradient between the cathode and anode increased. However, that work did not quantify the amount of water transported out of the fuel cell and no quantitative link could be determined between the amount of excess water on the cathode and the cell’s performance. This was most likely not previously performed due to the difficulty in accurately measuring the anode RH within the highly specialized fuel cell environment. This paper addresses this challenge through the development of a novel pressure drop analysis to determine the anode RH.
In the present work, a combination of experimental techniques allows for the in-situ quantification of water removal from the cathode. The presented methodology provides a diagnostic tool to investigate and compare different GDL materials, allowing for the in-situ measurement and quantification of general water management capabilities, as well as providing insight into various water flux parameters. The AWR protocol is adapted to remove excess fuel cell water and then extended to quantify the amount of water that the protocol removes from the cell. A new method is presented where an anode pressure drop calibration curve is used to determine pertinent flow parameters, allowing for the calculation of the RH of the anode stream. Although not as precise as previously discussed measurement techniques, the major advantage of the proposed method is the broad accessibility and quick-to-implement procedure, which allows for a rapid estimate of quantified water transfer and accumulation values. This is novel from other signal-based approaches, which generally investigate the in-situ pressure drop signal for patterns to identify flooding behavior. By monitoring the anode pressure drop during the AWR protocol, the resulting anode RH is calculated, leading to a determination of the rate of water removal from the cathode. The experimental setup, RH calculation, and data analysis procedures are detailed. Quantified water removal rates for three different MEA setups are presented along with the effect of temperature. The experimental data shows that this method is robust and reproducible.

2. Materials and Methods

This section details the experimental setup for PEMFC testing and the procedures for polarization curve testing, anode water removal tests, and the calibration of ex-situ pressure drops for use in the data analysis of in-situ pressure drops. Experimental tests for this study were all performed using a single TP50E Research PEM Fuel Cell (Tandem Technologies Ltd., Ludlow, MA, USA); specifications for this cell can be found in Table 1.
Fuel cell operating conditions were controlled via the FCATS G20 Single Cell Test Station (Model G20HF, Greenlight Innovation, Burnaby, BC, Canada). The G20 test station allowed for the continuous collection of voltage, pressure drop, and temperature data during all testing. The station controls set points and provides measurements for current or voltage (120 A, 50 V, 300 W), pressure (5–300 kPaG), temperature (up to 110 °C), inlet gas dew point (22–90 °C), hydrogen flow rate (0.05–5 NLPM), and air flow rate (0.1–10 NLPM). The variables measured for this study were voltage, pressure drop, and temperature. For these three variables the stations reported accuracy is ±0.005 V, ±2 kPa, and ±2 °C. All testing was performed using a Nafion NR-212 CCM (Ion Power, New Castle, DE, USA), which features a reported 0.3 mg cm−2 platinum loading on both anode and cathode sides. All GDLs investigated were from the Sigracet 25 line, specifications for which can be found in Table 2. Importantly, literature has shown the GDLs selected have a measurable effect on the saturation of the layer, making them useful benchmarks for this study [35].
Although the majority of fuel cell flooding intrinsically occurs on the cathode side, where the water is formed, and not on the anode, unless subjected to outside factors such as abnormally low temperature operating conditions [36,37], the anode GDL was universally tested with the 25 BC in order to ensure anode flooding did not confuse the cathode analysis.

2.1. Polarization Curve

The polarization curve was collected by increasing the current density from 0 to 1800 mA cm−2, while maintaining the required flow rates for a constant cathode and anode stoichiometry of 2 and 1.5, respectively. The stoichiometry, λ, is defined as the ratio of reactant gas supplied to the cell to the needed amount for the electrochemical reaction to occur. The temperature was set at 75 °C and the inlet pressure was maintained at 206.9 kPaG. Specifically, the system monitors the inlet pressure and controls it using a backpressure regulator. The anode and cathode gases were both fully humidified (RH = 100%) before entering the fuel cell. The voltage at each current density point was determined by time averaging the voltage data collected over 10 min. Before collecting the polarization curve data, the membranes were conditioned at 75 °C and 206.9 kPaG for eight hours where the current density was increased from 600 mA cm−2 up to 1000 mA cm−2, while maintaining cell voltage above 0.5 V.

2.2. Anode Water Removal

The basic testing protocol for AWR was adapted from previously published methods that focused on a qualitative analysis [38]. A brief summary is provided here. Initially, the cell was operated at a fixed current density (1000 mA cm−2) with cathode and anode stoichiometry set at 2 and 1.5. The temperatures, inlet pressure, and inlet RH for both anode and cathode were Tcell = Tgas,inlet = 75 °C or 85 °C, Pinlet = 206.9 kPaG, and RHinlet = 100%. To initiate the AWR procedure, the anode flow stream was switched to 0% RH via a manual control valve. The flow rate was systematically increased every two minutes, the time period required for the voltage to reach a steady state, by increasing the anode stoichiometry set point. The duration of each set point was also consistent with the previously established protocol [33,34]. The test started with the standard anode stoichiometry set point of 1.5, and the first flow rate increase was to a stoichiometric value of two. The flow rate was then increased by one stoichiometric factor, up to a maximum value of 10. During PEMFC operation, water can accumulate within the GDL layer, or between the porous layer and the CCM, causing the voltage to drop. A schematic visualizing the different water fluxes present during this test can be seen in Figure 1. The applied concentration gradient causes a net water flux to the anode, highlighted via the arrow.
In between every AWR test, a reconditioning protocol was performed to re-establish a consistent initial voltage, and rehydrate the CCM. This reconditioning protocol is similar to the polarization procedure described above; however, the current densities used were limited to 300 mA cm−2 through 1200 mA cm−2.

2.3. Anode Pressure Drop Calibration Curve

Collecting data for the pressure drop calibration curves was performed using a similar protocol to the AWR protocol. The entire experimental setup remained the same, but the system was non-reacting. The CCM was replaced by a polyimide film of comparable thickness in order to prevent water vapor crossover from humidified gas flows. A GDL was placed on both sides of that film to represent accurate ‘zero-saturation’ behavior. The cathode flow rate was held steady while the other was raised systematically. The increases in flow rate for the anode stream were based on the stoichiometry factors as if the cell were operating at 1000 mA cm−2. These tests were repeated at varying set RH values, specifically 0%, 25%, 50%, 75%, and 100% RH. This set of data was then used to calculate set-up specific parameters related to the pressure drop, detailed below.

3. Quantification of In-Situ Data to Determine Average Anode Relative Humidity and Net Cell Water Flux

To determine the net water flux from cathode to anode, the experimentally measured pressure drop was used in conjunction with a set of equations for the pressure drop that are a function of the flow rate and RH.

3.1. Ex-Situ Determination of Set-up Specific Parameters Related to Pressure Drop

A detailed description of the assumptions and requirements for the implementation of the following equations has been thoroughly investigated by Barbir [39], and all of the equations presented in this section are from that reference. The pressure drop along the flow field channel from inlet to outlet (ΔP) for both the anode and cathode can be calculated using the equation for incompressible flow in a pipe:
Δ P = f F L D H ρ v ¯ 2 2 + K L ρ v ¯ 2 2
where fF is the friction factor, L is the channel length, DH is the hydraulic diameter, ρ is the fluid density, v ¯ is the average velocity, and KL is the loss coefficient. This coefficient accounts for the effects of the channel bends in the serpentine configuration. The friction factor was calculated from the following equation for laminar flow within a rectangular channel:
f F = 55 + 41.5 e x p ( 3.4 w c d c ) R e
where wc and dc are the channel width and depth, and Re is the Reynolds number, which was found to be laminar for all cases tested. The Reynolds number was calculated as
R e = ρ v ¯ D H μ m i x
where µmix is the mixed fluid viscosity, calculated from
μ m i x = μ 1 1 + ψ 1 ( M 2 M 1 ) + μ 2 1 + ψ 2 ( M 1 M 2 )
with
ψ 1 = 2 4 ( 1 + ( μ 1 μ 2 ) 0.5 ( r 2 r 1 ) 0.25 ) 2 ( 1 + r 1 r 2 ) 0.5
and
ψ 2 = 2 4 ( 1 + ( μ 2 μ 1 ) 0.5 ( r 1 r 2 ) 0.25 ) 2 ( 1 + r 2 r 1 ) 0.5
where µ1 and µ2 are the viscosities of the pure gases, r1 and r2 are their respective volume fractions, and M1 and M2 are their molecular weights. The equation used to calculate µ1 and µ2 was
μ = μ 0 ( T 0 + C T + C ) ( T T 0 ) 3 / 2
with µ0 as a known viscosity at temperature T0 and C being a fluid specific coefficient, with values of which can be found in the Appendix A Table A1. The fluid density was calculated as
ρ = ( P Ø · P v s ) M w H 2 + ( Ø · P v s ) M w H 2 O R T
where P is the absolute pressure of the system (Pa), Ø is the relative humidity (0–1), Pvs is the saturated vapor pressure (Pa) and MwH2 and MwH2O are the molecular weights of the hydrogen and water. The average velocity was calculated from the volumetric flow rate
Q = I 2 F λ H 2 r H 2 R T ( P Ø gas · P v s )
where I is the current (A), F is Faraday’s constant (C mol−1), λH2 is the stoichiometric flow rate value, and rH2 is the volume fraction of hydrogen. The volume fraction of water in a gas stream is calculated by
r H 2 O , V o l = Ø gas · P v s P
where the saturated vapor pressure is calculated by using the following equation, valid between 0 and 100 °C, with coefficients for which can be found in the Appendix A Table A2. It should be noted that a number of the above equations relate specifically to the geometry of the fuel cell used, and would require slight modification before their implementation to different systems. Generally, one would have to use whichever appropriate hydraulic diameter, as well as the specific experimental determination of KL using the protocol outlined below.
P v s = exp ( a T 1 + b + c T + d T 2 + e T 3 + f ln ( T ) )
Since several of these terms depend on the RH, this set of equations allowed for the pressure drop across the channel to serve as a quantitative estimate of the RH of the gas. The experimental ex-situ data collected at varying flow rates and relative humidities was then used to solve for the loss coefficient KL, found in Equation (1). The determination of the local resistance term from the ex-situ data then allowed for the calculation of the RH of each flow stream in the in-situ cases, thereby allowing for the quantification of the water leaving the fuel cell via the anode (as detailed in the following sections).

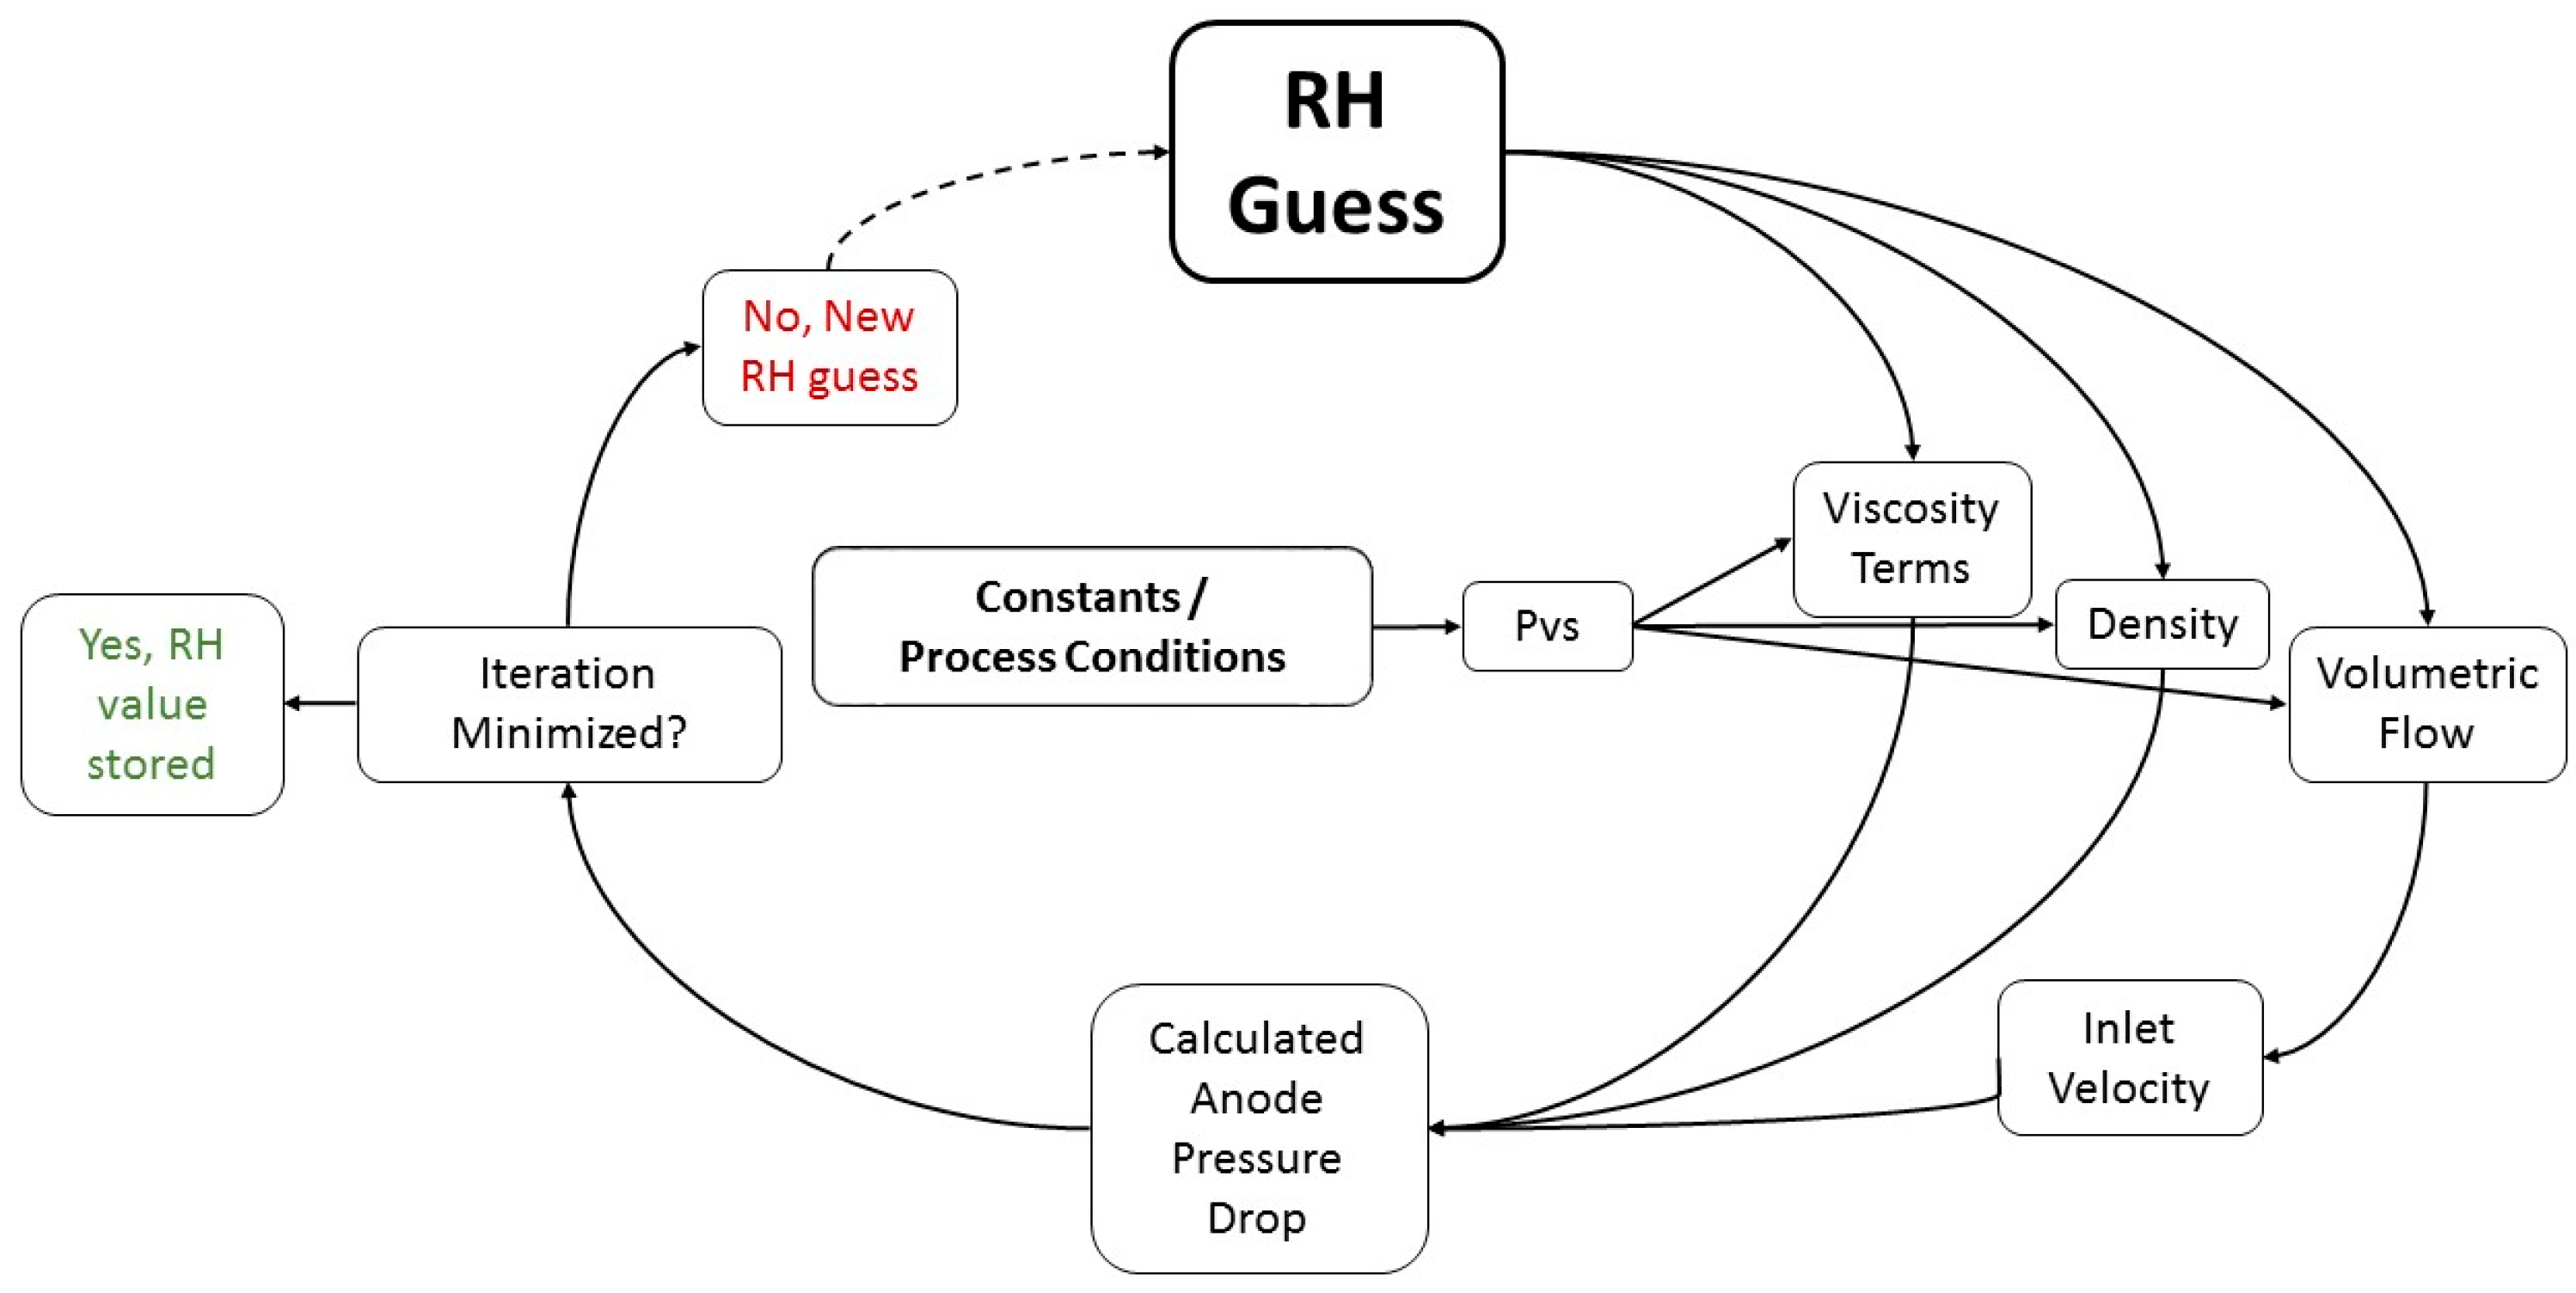
3.2. Quantification of In-Situ Data to Determine Anode Relative Humidity

Quantification of the in-situ pressure data was performed by solving for the anode RH; a summary of the steps taken by the solver can be seen in Figure 2. The routine functions by modifying the RH value until it has minimized the error between the calculated pressure drop and the experimentally measured value. This process is repeated for each stoichiometric set point on the anode, calculating the average RH value for each step. Specifically, the RH guess is used to update the viscosity terms (Equations (4)–(7)), fluid density (Equation (8)), and volumetric flow rate (Equation (9)). These are then used to calculate the Reynolds number (Equation (3)) and friction factor (Equation (2)), in order to determine the overall anode pressure drop (Equation (1)). The only modification to the equations presented above was the substitution of an averaged stoichiometric term into the volumetric flow rate in Equation (9). The average stoichiometric term is defined as the average of the inlet and outlet stoichiometric values, which accounts for the reduction in the mass flow rate due to the consumption of the reactant in the reaction.

3.3. Quantification of Net Cell Water Flux

Once the anode RH values had been determined, the water flux out of the cell from the anode stream could then be calculated, based on its set flow rate and pressure drop. The net cell water flux was determined by combining the anode, cathode, and reaction fluxes,
M ˙ n e t , w a t e r = M ˙ r e a c t i o n , w a t e r M ˙ a n o d e , w a t e r M ˙ c a t h o d e , w a t e r
The reaction flux was calculated based on Faraday’s law
M ˙ r e a c t i o n = I 2 F M w H 2 O
resulting in a constant value for all anode flow rates. The anode water flux was calculated by first calculating the mixing ratio, x (g water vapor/g hydrogen) of water vapor to dry gas from
x = B   ( Ø gas · P v s ) ( P Ø gas · P v s )
where B is the constant 8.94 (g water vapor/g hydrogen). The mixing ratio can then be used with the outlet mass flowrate to determine the rate of water leaving the cell,
M ˙ κ , w a t e r = x M ˙ κ , o u t l e t
where κ indicates the anode or cathode. Since the excess water in the fuel cell is located on the cathode side, it was assumed that the cathode stream remained fully saturated at 100% RH. Due to the cathode pressure drop, this assumption leads to an additional water removal term. Although the magnitude of this contribution was less than 10% than that of the anode, it was included in the overall water balance calculation. The analysis was also performed without the cathode term, and was found to have no effect on the overall analysis. The net cell flux was thus calculated from the balance between the calculated exit anode water flux, estimated exit cathode flux, and the produced water from the reaction. For the purpose of this study, a positive net cell water flux indicates that the cell is producing more water via the reaction than is being removed as vapor by the cathode and anode gas streams. A negative net cell water flux indicates that the water vapor being removed by the anode and cathode gas streams is greater than the amount of water being produced by the reaction, indicating an additional source of water on the cathode, namely excess water accumulation.

4. Experimental Results and Discussion

This section presents the experimental results based on the above methods. The polarization curve data and qualitative AWR results are shown first to benchmark the system and corroborate the inherently different water management capabilities of the three GDLs. Specific values determined from the ex-situ pressure drop calibration tests are provided. Finally, results from the in-situ experiments are presented, including the different voltage responses, the calculated net cell water fluxes, the cathode pressure drop signals, and finally the total water removed as compared to the voltage gain.

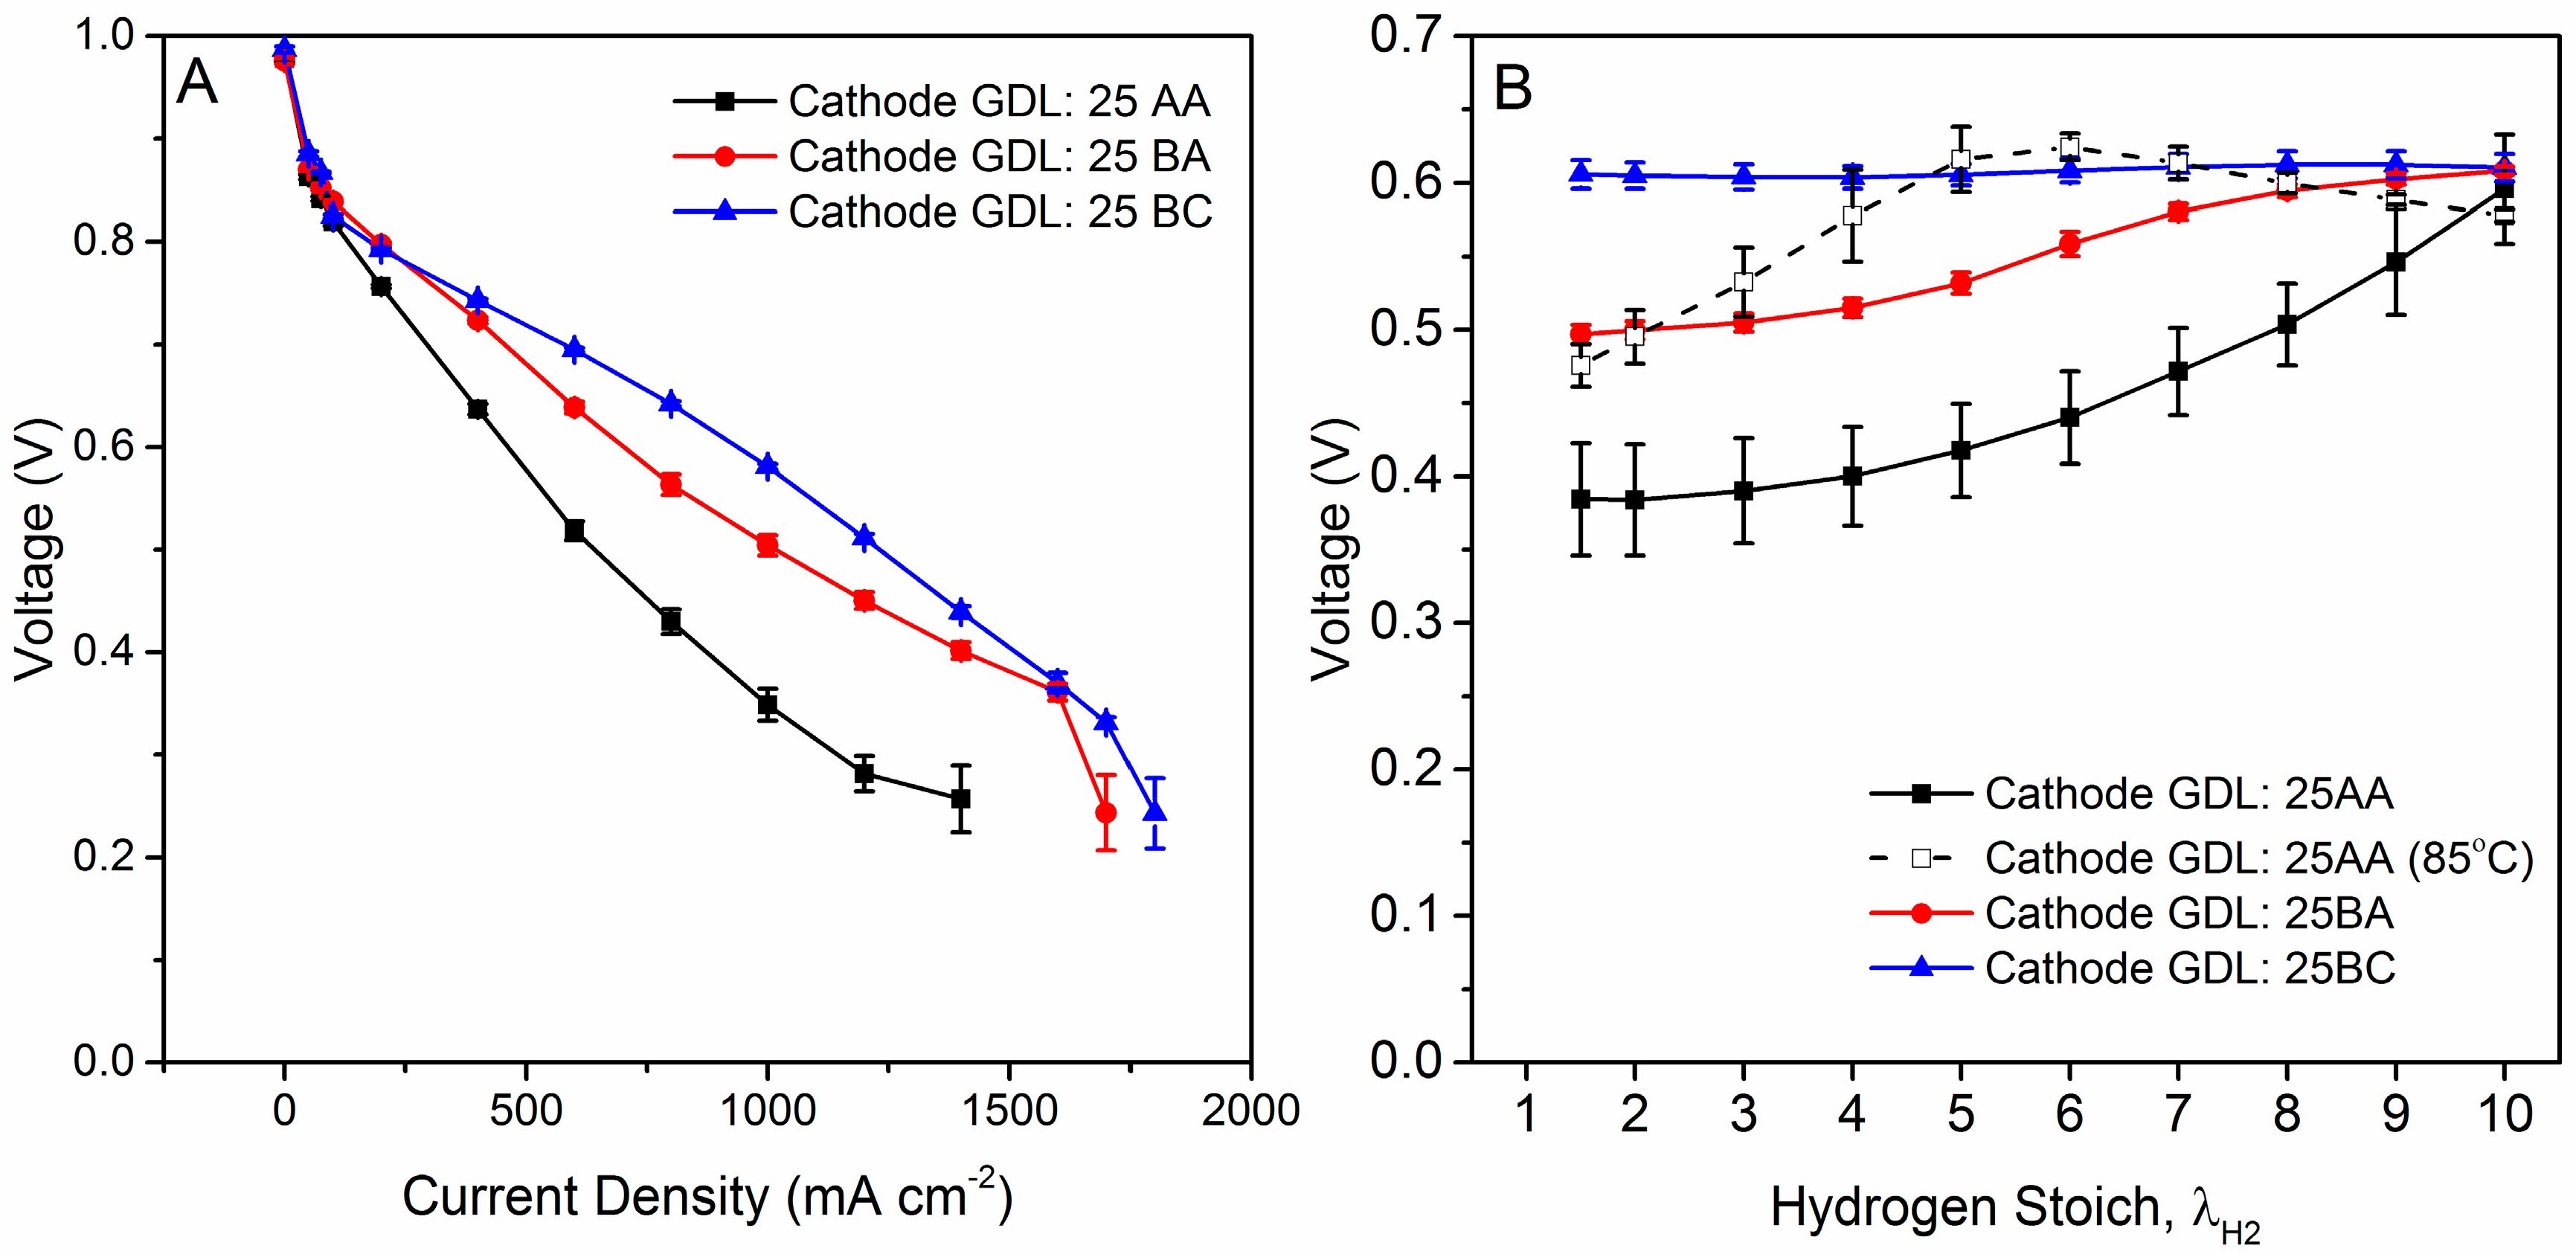
4.1. Polarization Curves and Qualitative AWR Results

Three different MEA setups were investigated to compare operating characteristics. Polarization curve data was collected for MEAs, with a 25 BC, 25 BA, and 25 AA GDL on the cathode side, and the results found in Figure 3A. For all three MEAs investigated the anode featured a 25 BC GDL to ensure no water accumulation on the anode.
As expected, the MEA with a cathode 25 BC GDL performed the best, due to its hydrophobic treatment (5% PTFE) and MPL, which both assist with water management in terms of liquid and vapor [32] transport. The 25 AA GDL performed the worst, due to the lack of MPL and any sort of hydrophobic treatment (0% PTFE).
The basic AWR procedure was applied to these three same MEA setups at standard operating conditions of 75 °C and 206.9 kPaG of backpressure. In addition, the 25 AA MEA setup was tested at 85 °C to investigate the effect that temperature had on the test. Results of these four tests can be seen in Figure 3B. For all tests, the current density was fixed at 1000 mA cm−2. The increase of the cell voltage in the 25 BA and 25 AA setups demonstrate that the reduction in voltage seen in the polarization curve was due to poor water management on the cathode. The drop in voltage above the anode stoichiometry of five for the 85 °C, 25 AA case indicates that the membrane has started to dehydrate, thus resulting in an increase in ionic resistance. These results indicate that the GDLs perform as expected based on literature [35], making them ideal template GDLs to use in this quantitative study.

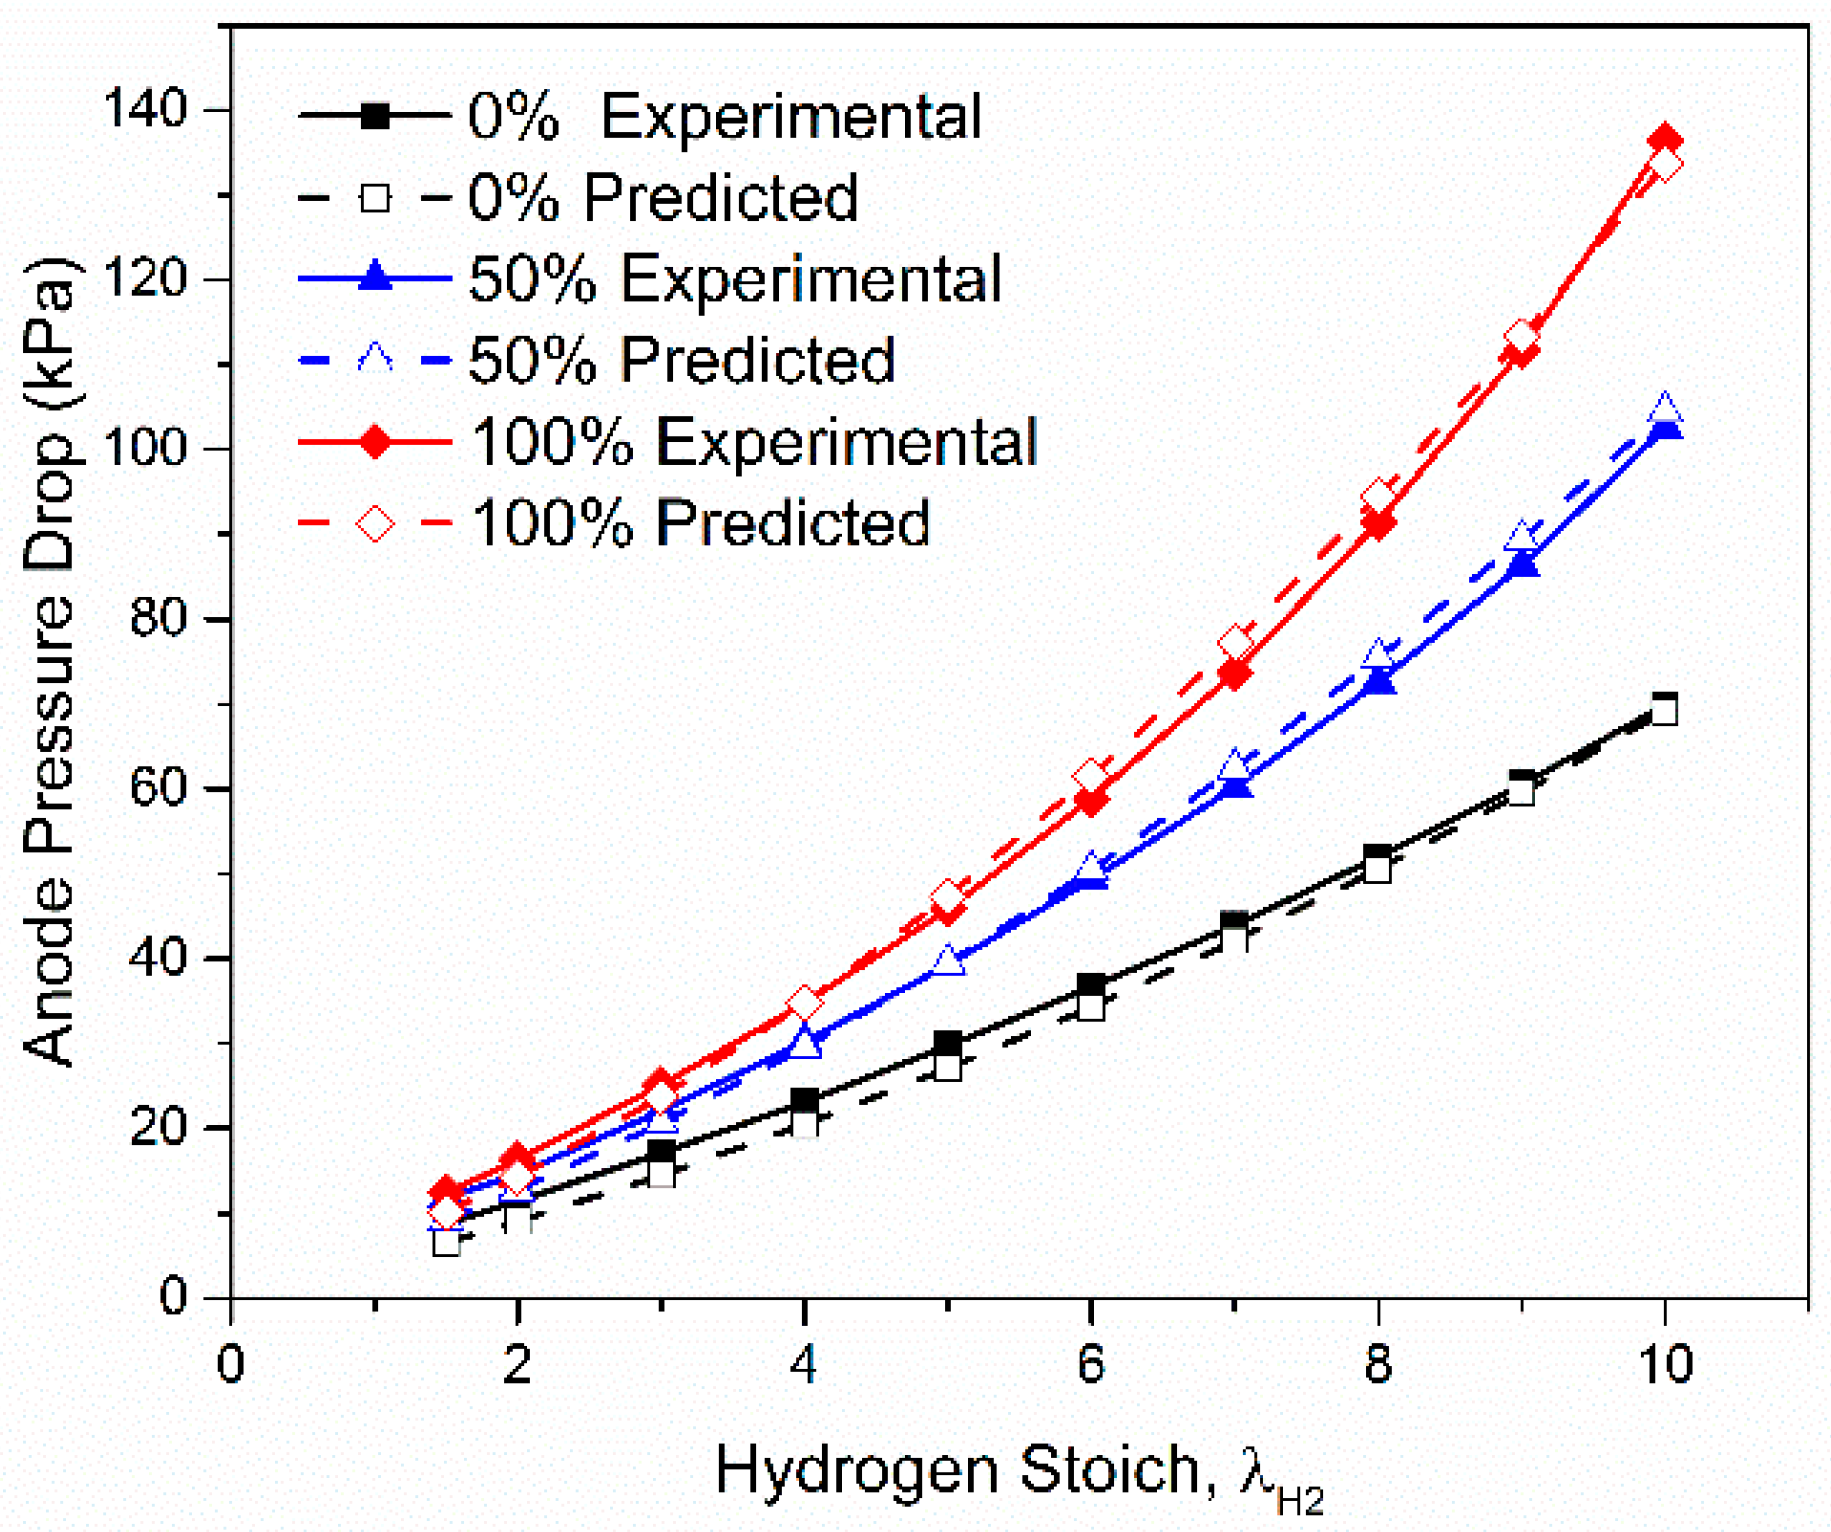
4.2. Ex-Situ System Parameters in Pressure Drop Analysis

The ex-situ anode pressure drop data was collected with the anode stream at set RH values of 0%, 25%, 50%, 75%, and 100%, at the operating condition used for the in-situ testing. For both of these operating cases, 75 °C and 85 °C, an overall KL value was then calculated. The KL value calculated for 75 °C was 7.7, with a 7% average error value, and for 85 °C was 8.3, with a 7.2% average error value. Percent error was calculated between experimental pressure drop values measured and the predicted values determined from Equation (1). Figure 4 demonstrates the strong fit found between the predicted and ex-situ experimental pressure drop values using the determined KL value. It should be noted that most of the divergence between experimental and predicted pressure drops were found to occur at lower flow rates, likely due to the fact that the RH term is located within the exponential in Equation (1), causing it to be more dominant in the higher flow regimes. However, at these low flow rates the maximum potential amount of water that can be removed by the anode is one order of magnitude lower than the amount being produced by the reaction, thus this potential error does not affect the analysis.

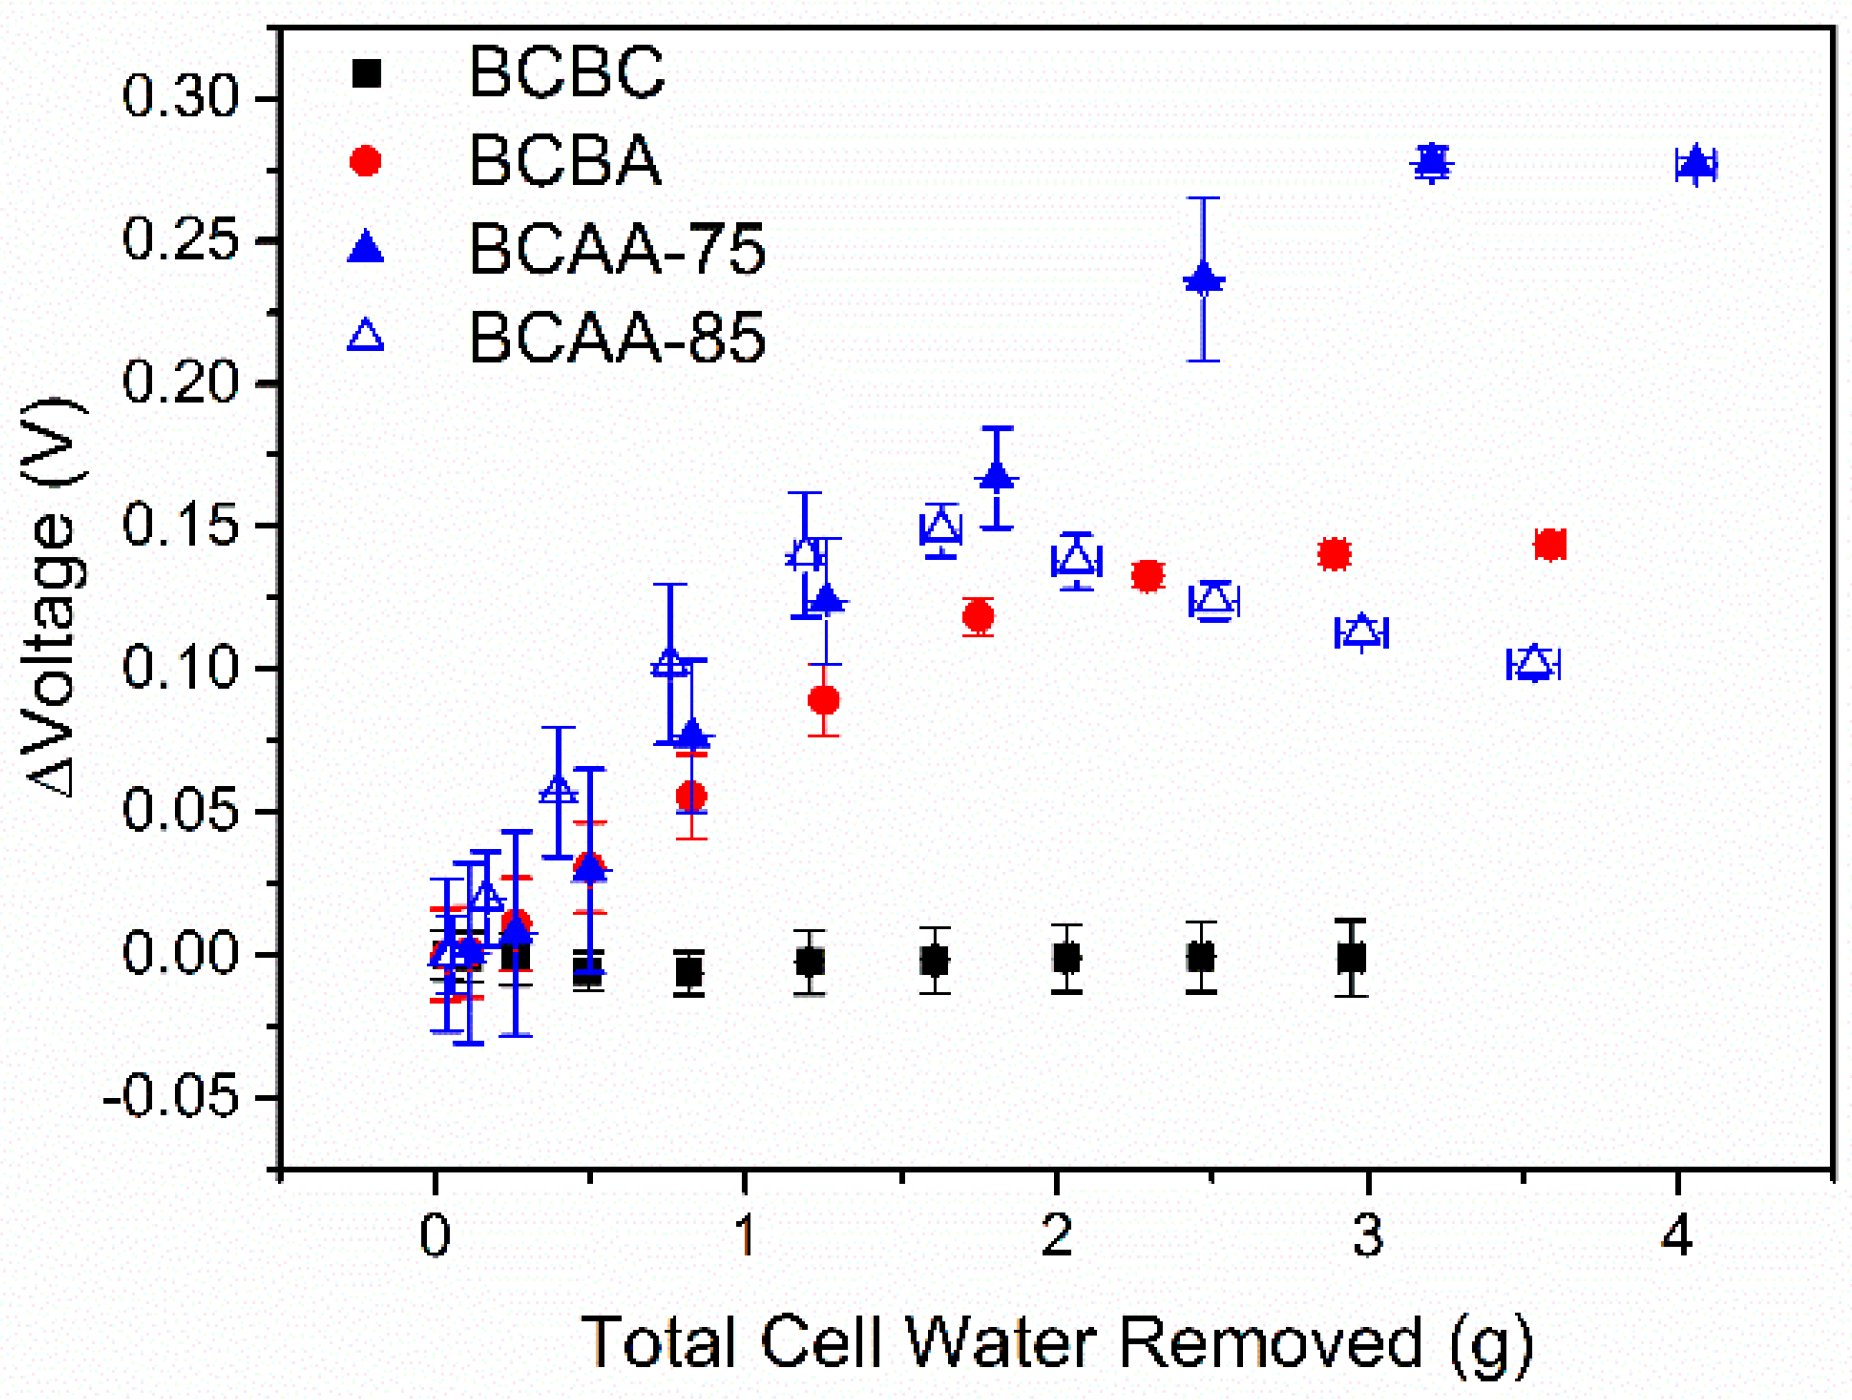
4.3. Quantification of Water Removed

Using the experimentally determined KL values, average anode RH values were calculated for each stoichiometric set point step within the AWR tests. By first converting the RH data into a mixing ratio, Equation (14), and then combining it with the outlet mass flow rate, Equation (15), an average water removal rate was then calculated for each set point. An example of the results of these calculations for the three trials performed on the 25 AA GDL is presented in Table 3.
A negative net cell water flux indicates that the anode is removing more water than the amount generated by the reaction, as the contribution to the cathode gas flow is minimal in order to maintain the fully humidified condition. Since the amount of water being produced by the reaction is known, the cases with a negative net cell flux indicate the removal of additional excess liquid water that has accumulated on the cathode side. As these calculations depend on the anode pressure drop measurement, a calculation of the range of the net cell water flux for a single trial was performed using the potential range of the anode pressure drop, based on the standard deviation found for each stoichiometric point. The result of this calculation shows that the average possible range for the net cell water flux was ±0.006 g/min, with a maximum range of ±0.02 g/min found at the highest stoichiometric flow rate. For the following figures, the error presented is the standard deviation between the three trials performed at each investigated operating condition, which was found to more accurately convey the potential error of this experimental system.
These calculations were repeated for the other nine trials, performed on the other three MEA and operating condition setups. A summary of the voltage changes as they relate to the changing net cell water flux for the four setups is displayed in Figure 5.
The effect of the MPL is clearly noted as no voltage change occurs for the 25 BC GDL. It has been reported that one of the potential functionalities of the MPL is to help control for the accumulation of water between the GDL and the CCM [28,32]. It therefore makes sense that the reduction of water vapor on the cathode side did not have a noticeable effect on the voltage response, since the MPL was already helping to control the concentration of water vapor near the CCM. The net cell water flux is never negative, indicating that no excess water had accumulated in this case with an MPL. In the cases without an MPL, the major change in voltage occurs before the anode is able to remove more water vapor than what is being produced by the reaction. This result indicates the mass transport limitation that causes the initial reduction in voltage is improved via more efficient transport of vapor away from the cathode catalyst layer, as well as the removal of the accumulated liquid water. Additionally, in the case of the 25 AA GDL, a large, negative net cell water flux is measured above an anode stoichiometry of seven. The negative net cell water flux indicates accumulated liquid water on the cathode in addition to vapor transport. The larger water removal displayed by the 25 AA GDL when compared to the 25 BA GDL agrees with the results from Figure 3, as well as previously published studies [35], since the 25 AA GDL does not have any PTFE treatment.
These results are also consistent with the cathode pressure drop results. In Figure 6 the average cathode pressure drops from each operating point are plotted versus the stoichiometric set points.
In all cases, there is a reduction in pressure drop consistent with water being removed from the cathode. In the case of the 25 BC GDL, where mass transport effects are already minimized, the reduction in pressure drop is consistent with a lower total mass flow rate in the cathode flow field channels, due to water produced by the reaction moving to the anode instead. In the case of the 25 AA GDL, the pressure drop reduces throughout the test but remains higher than the 25 BC and 25 BA GDLs. The final voltages are similar in all cases, indicating that any mass transport limitations have been removed in the 25 AA case, but the higher pressure drop indicates residual channel water on the surface of this hydrophilic GDL.
This analysis is quantitatively supported by the average net voltage change, and total water removed by the anode stream, as reported in Figure 7. First, the case which demonstrates both a negligible voltage change and also has the lowest water removed on the anode is the setup with the 25 BC GDL, as expected. In this case, there was still a reduction in the cathode pressure drop, seen in Figure 6, however this reduction in cathode water vapor did not have any noticeable effect on the voltage signal.
The most drastic change in voltage is observed with the 25 AA GDL at 75 °C, from an initial voltage of 0.34 V, to a peak voltage of 0.62 V. This case is also observed to remove the most amount of water throughout the test. Although this setup has a lower evaporative potential than the 85 °C case, the lower operating temperature promotes the largest amount of initial excess cathode water. This larger amount of available water allows for the largest net cell water flux out of the cell, seen in Figure 5C. The voltage response in Figure 5C shows a consistent increase in signal, showing that all the water being removed by the anode is negatively affecting the power of the fuel cell. Additionally, the cathode pressure drop in Figure 6 is seen to consistently decay, indicating a steady removal of the reaction product water vapor through the anode, from the increasing evaporative gradient.
The 85 °C 25 AA and 75 °C 25 BA cases display very similar results. From Figure 5B,D, it is seen that they start at a similar initial voltage, indicating a similar performance reduction related to mass transport, despite differing PTFE content and temperatures. The main difference between the two tests is demonstrated by their respective voltage responses, seen in Figure 5B,D. The 85 °C 25 AA case demonstrate a sharp initial increase in voltage, from 0.47 V to 0.62 V over 5 stoichiometric set points, followed by a gradual decline in voltage, indicating the dehydration of the membrane. Interestingly, this sharp voltage increase aligns with the sharp decrease in the cathode pressure drop, as seen in Figure 6. This cathode pressure drop reduction is a function of the reduction of water on the cathode side, and the drastic increase in voltage indicates the removal of water that is negatively impacting the voltage. The 75 °C, 25 BA case displays a more gradual increase in voltage, not reaching peak voltage until the final stoichiometric set point. This gradual increase points to the important differences in evaporative potential between the 75 °C and 85 °C operating conditions. From the voltage signal in Figure 5D, it is seen that in the 85 °C case the voltage change occurs earlier in the test, qualitatively agreeing with the higher evaporative potential that would be present at this higher temperature.
A similar analysis could be conducted by those studying operating conditions or engineered gas diffusion layers. By analyzing the amount of water removed via the anode, one has quantified the amount of water in the cathode and its impact on performance. Thus, a quantitative measure of the effect of mass transport limitations is determined. As detailed before, this analysis could also be extended to alternative flow field configurations, after the modification of the applicable equations. Future work is needed to verify that the assumptions used in this study are valid for interdigitated or multi-channel flow fields, but the analysis could be used to study the initial water saturation promoted by these different configurations or to determine their effect on the water flux through the cell.

5. Conclusions

A new diagnostic tool is presented to experimentally determine water flux rates into an initially dry anode stream, thus quantifying the amount of water being removed from the cathode. When the anode flow rate is sufficiently raised, this flux can overcome the water production rate of the reaction, identifying additional excess cathode water. These results were obtained via an RH measurement, based on the pressure drop of the gas streams, where the anode pressure drop is calibrated to the anode RH. In this procedure, the flow rate of a dry anode stream is increased to cause an evaporative potential from the cathode to the anode. By measuring the anode pressure drops, the amount of water being removed by the anode can be calculated. The combination of this removal rate along with the water production rate from the reaction, allows for the calculation of an overall net cell water flux. The analysis of this value, along with its relation to the changing voltage of the fuel cell, allows for an investigation of water movement throughout the cell and a quantitative determination of excess water within the cell. This study investigated four different operating setups, featuring three different cathode GDLs, as well as two operating temperatures (75 °C and 85 °C), demonstrating the wide applicability of the approach. Net voltage gains, as well as the total water removed for each case were presented. In GDLs without an MPL, large voltage gains are noted as more cathode water is removed, which is indicative of a reduction of mass transport limitations in the cell. A main strength of the protocol is the ability to quantitatively calculate the RH of the anode stream without the need of expensive equipment. The technique hinges on the manipulation of operating conditions and knowledge of basic details of the specific fuel cell architecture, and can thus be applied to a wide assortment of fuel cell setups, providing an accessible and easy-to-implement protocol for a variety of PEMFC applications.

Acknowledgments

This material is based upon work supported by the National Science Foundation under Grant Number 1444198. Any opinions, findings, and conclusions or recommendations expressed in this material are those of the authors and do not necessarily reflect the views of the National Science Foundation. The authors further thank Montana State University for funds related to these efforts. The authors also thank Erick Johnson from Montana State University and the continued technical support from Greenlight Innovation and Tandem Technologies Ltd.

Author Contributions

Ryan Anderson, Logan Battrell, and Lifeng Zhang conceived and designed the experiments; Logan Battrell, Aubree Trunkle, and Erica Eggleton performed the experiments; Logan Battrell and Ryan Anderson analyzed the data; Ryan Anderson contributed reagents/materials/analysis tools; and Logan Battrell wrote the paper. All authors assisted with editing and revision of the paper.

Conflicts of Interest

The authors declare no conflict of interest.

Appendix A. Constants Used in Equations

Table A1. Viscosity values and coefficients for Equation (7) (T0 = 25 °C) [39].
Fluidµ0C
Air1.81 × 10−5120
Hydrogen0.92 × 10−572
Water Vapor1.02 × 10−5660
Table A2. Coefficients used in saturated vapor pressure Equation (11) [39].
Coefficients for Vapor Pressure Equation
a =−5800.2206
b =1.3914493
c =−0.0486402
d =0.41764768 × 10⁻⁴
e =−0.14452093 × 10⁻⁷
f =6.5459673

References

  1. United States Department of Energy. Full Cell Technologies Office Multi-Year Research, Development, and Demonstration Plan; United States Department of Energy: Washington, DC, USA, 2012; pp. 1–58.
  2. Wang, Y.; Chen, K.S.; Mishler, J.; Cho, S.C.; Adroher, X.C. A review of polymer electrolyte membrane fuel cells: Technology, applications, and needs on fundamental research. Appl. Energy 2011, 88, 981–1007. [Google Scholar] [CrossRef]
  3. Yousfi-Steiner, N.; Moçotéguy, P.; Candusso, D.; Hissel, D.; Hernandez, A.; Aslanides, A. A review on pem voltage degradation associated with water management: Impacts, influent factors and characterization. J. Power Sources 2008, 183, 260–274. [Google Scholar] [CrossRef]
  4. Ous, T.; Arcoumanis, C. Degradation aspects of water formation and transport in proton exchange membrane fuel cell: A review. J. Power Sources 2013, 240, 558–582. [Google Scholar] [CrossRef]
  5. Pei, P.; Li, Y.; Xu, H.; Wu, Z. A review on water fault diagnosis of pemfc associated with the pressure drop. Appl. Energy 2016, 173, 366–385. [Google Scholar] [CrossRef]
  6. Hussaini, I.S.; Wang, C.Y. Dynamic water management of polymer electrolyte membrane fuel cells using intermittent RH control. J. Power Sources 2010, 195, 3822–3829. [Google Scholar] [CrossRef]
  7. Song, M.; Pei, P.; Zha, H.; Xu, H. Water management of proton exchange membrane fuel cell based on control of hydrogen pressure drop. J. Power Sources 2014, 267, 655–663. [Google Scholar] [CrossRef]
  8. Damour, C.; Benne, M.; Grondin-Perez, B.; Chabriat, J.-P.; Pollet, B.G. A novel non-linear model-based control strategy to improve pemfc water management—The flatness-based approach. Int. J. Hydrogen Energy 2015, 40, 2371–2376. [Google Scholar] [CrossRef]
  9. Pahon, E.; Yousfi Steiner, N.; Jemei, S.; Hissel, D.; Moçoteguy, P. A signal-based method for fast pemfc diagnosis. Appl. Energy 2016, 165, 748–758. [Google Scholar] [CrossRef]
  10. Alink, R.; Haußmann, J.; Markötter, H.; Schwager, M.; Manke, I.; Gerteisen, D. The influence of porous transport layer modifications on the water management in polymer electrolyte membrane fuel cells. J. Power Sources 2013, 233, 358–368. [Google Scholar] [CrossRef]
  11. Chen, H.-H.; Chang, M.-H. Effect of cathode microporous layer composition on proton exchange membrane fuel cell performance under different air inlet relative humidity. J. Power Sources 2013, 232, 306–309. [Google Scholar] [CrossRef]
  12. Li, A.; Chan, S.H. Understanding the role of cathode structure and property on water management and electrochemical performance of a pem fuel cell. Int. J. Hydrogen Energy 2013, 38, 11988–11995. [Google Scholar] [CrossRef]
  13. Lemoine-Nava, R.; Hanke-Rauschenbach, R.; Mangold, M.; Sundmacher, K. The gas diffusion layer in polymer electrolyte membrane fuel cells: A process model of the two-phase flow. Int. J. Hydrogen Energy 2011, 36, 1637–1653. [Google Scholar] [CrossRef]
  14. Qin, C.; Rensink, D.; Fell, S.; Majid Hassanizadeh, S. Two-phase flow modeling for the cathode side of a polymer electrolyte fuel cell. J. Power Sources 2012, 197, 136–144. [Google Scholar] [CrossRef]
  15. Fazeli, M.; Hinebaugh, J.; Fishman, Z.; Tötzke, C.; Lehnert, W.; Manke, I.; Bazylak, A. Pore network modeling to explore the effects of compression on multiphase transport in polymer electrolyte membrane fuel cell gas diffusion layers. J. Power Sources 2016, 335, 162–171. [Google Scholar] [CrossRef]
  16. Kalidindi, A.R.; Taspinar, R.; Litster, S.; Kumbur, E.C. A two-phase model for studying the role of microporous layer and catalyst layer interface on polymer electrolyte fuel cell performance. Int. J. Hydrogen Energy 2013, 38, 9297–9309. [Google Scholar] [CrossRef]
  17. Meng, H.; Han, B.; Ruan, B. Numerical modeling of liquid water transport inside and across membrane in pem fuel cells. Asia-Pac. J. Chem. Eng. 2013, 8, 104–114. [Google Scholar] [CrossRef]
  18. Qin, Y.; Du, Q.; Yin, Y.; Jiao, K.; Li, X. Numerical investigation of water dynamics in a novel proton exchange membrane fuel cell flow channel. J. Power Sources 2013, 222, 150–160. [Google Scholar] [CrossRef]
  19. Wang, Y.; Chen, K.S. Advanced control of liquid water region in diffusion media of polymer electrolyte fuel cells through a dimensionless number. J. Power Sources 2016, 315, 224–235. [Google Scholar] [CrossRef]
  20. Grötsch, M.; Mangold, M. A two-phase pemfc model for process control purposes. Chem. Eng. Sci. 2008, 63, 434–447. [Google Scholar] [CrossRef]
  21. Berning, T.; Odgaard, M.; Kær, S.K. A study of multi-phase flow through the cathode side of an interdigitated flow field using a multi-fluid model. J. Power Sources 2010, 195, 4842–4852. [Google Scholar] [CrossRef]
  22. Ding, Y.; Bi, X.; Wilkinson, D.P. 3D simulations of the impact of two-phase flow on pem fuel cell performance. Chem. Eng. Sci. 2013, 100, 445–455. [Google Scholar] [CrossRef]
  23. Yau, T.C.; Cimenti, M.; Bi, X.T.; Stumper, J. Water transport and schröder’s paradox in fuel cell membrane electrode assemblies. J. Power Sources 2013, 224, 285–289. [Google Scholar] [CrossRef]
  24. Morgan, J.M.; Datta, R. Understanding the gas diffusion layer in proton exchange membrane fuel cells. I. How its structural characteristics affect diffusion and performance. J. Power Sources 2014, 251, 269–278. [Google Scholar] [CrossRef]
  25. Chevalier, S.; Lee, J.; Ge, N.; Yip, R.; Antonacci, P.; Tabuchi, Y.; Kotaka, T.; Bazylak, A. In operando measurements of liquid water saturation distributions and effective diffusivities of polymer electrolyte membrane fuel cell gas diffusion layers. Electrochim. Acta 2016, 210, 792–803. [Google Scholar] [CrossRef]
  26. Bazylak, A. Liquid water visualization in pem fuel cells: A review. Int. J. Hydrogen Energy 2009, 34, 3845–3857. [Google Scholar] [CrossRef]
  27. Krüger, P.; Markötter, H.; Haußmann, J.; Klages, M.; Arlt, T.; Banhart, J.; Hartnig, C.; Manke, I.; Scholta, J. Synchrotron X-ray tomography for investigations of water distribution in polymer electrolyte membrane fuel cells. J. Power Sources 2011, 196, 5250–5255. [Google Scholar] [CrossRef]
  28. Deevanhxay, P.; Sasabe, T.; Tsushima, S.; Hirai, S. Effect of liquid water distribution in gas diffusion media with and without microporous layer on pem fuel cell performance. Electrochem. Commun. 2013, 34, 239–241. [Google Scholar] [CrossRef]
  29. Banerjee, R.; Ge, N.; Lee, J.; George, M.G.; Chevalier, S.; Liu, H.; Shrestha, P.; Muirhead, D.; Bazylak, A. Transient liquid water distributions in polymer electrolyte membrane fuel cell gas diffusion layers observed through in-operando synchrotron X-ray radiography. J. Electrochem. Soc. 2017, 164, F154–F162. [Google Scholar] [CrossRef]
  30. Owejan, J.P.; Trabold, T.A.; Jacobson, D.L.; Baker, D.R.; Hussey, D.S.; Arif, M. In situ investigation of water transport in an operating pem fuel cell using neutron radiography: Part 2—Transient water accumulation in an interdigitated cathode flow field. Int. J. Heat Mass Transf. 2006, 49, 4721–4731. [Google Scholar] [CrossRef]
  31. Hussaini, I.S.; Wang, C.Y. Visualization and quantification of cathode channel flooding in pem fuel cells. J. Power Sources 2009, 187, 444–451. [Google Scholar] [CrossRef]
  32. Owejan, J.P.; Owejan, J.E.; Gu, W.; Trabold, T.A.; Tighe, T.W.; Mathias, M.F. Water transport mechanisms in pemfc gas diffusion layers. J. Electrochem. Soc. 2010, 157, B1456–B1464. [Google Scholar] [CrossRef]
  33. Anderson, R.; Blanco, M.; Bi, X.; Wilkinson, D.P. Anode water removal and cathode gas diffusion layer flooding in a proton exchange membrane fuel cell. Int. J. Hydrogen Energy 2012, 37, 16093–16103. [Google Scholar] [CrossRef]
  34. Battrell, L.; Trunkle, A.; Eggleton, E.; Zhang, L.; Anderson, R. Investigation of water transport within a proton exchange membrane fuel cell by diffusion layer saturation analysis. In Proceedings of the 2016 14th International Conference on Fuel Cell Science, Engineering and Technology, Charlotte, NC, USA, 26–30 June 2016; p. V001T005A002. [Google Scholar]
  35. Cindrella, L.; Kannan, A.M.; Lin, J.F.; Saminathan, K.; Ho, Y.; Lin, C.W.; Wertz, J. Gas diffusion layer for proton exchange membrane fuel cells—A review. J. Power Sources 2009, 194, 146–160. [Google Scholar] [CrossRef]
  36. Li, H.; Tang, Y.; Wang, Z.; Shi, Z.; Wu, S.; Song, D.; Zhang, J.; Fatih, K.; Zhang, J.; Wang, H.; et al. A review of water flooding issues in the proton exchange membrane fuel cell. J. Power Sources 2008, 178, 103–117. [Google Scholar] [CrossRef]
  37. Kim, M.; Jung, N.; Eom, K.; Yoo, S.J.; Kim, J.Y.; Jang, J.H.; Kim, H.-J.; Hong, B.K.; Cho, E. Effects of anode flooding on the performance degradation of polymer electrolyte membrane fuel cells. J. Power Sources 2014, 266, 332–340. [Google Scholar] [CrossRef]
  38. Voss, H.H.; Wilkinson, D.P.; Pickup, P.G.; Johnson, M.C.; Basura, V. Anode water removal: A water management and diagnostic technique for solid polymer fuel cells. Electrochim. Acta 1995, 40, 321–328. [Google Scholar] [CrossRef]
  39. Barbir, F. Pem Fuel Cells: Theory and Practice; Academic Press: Cambridge, MA, USA, 2012. [Google Scholar]
Figure 1. Experimental schematic showing liquid water accumulation and the main water vapor fluxes in the Anode Water Removal (AWR) procedure. As the anode flow rate increases, more water from the cathode is driven to the anode.
Energies 10 01222 g001
Figure 2. Iteration tree to determine the in-situ anode Relative Humidity (RH). An initial RH guess is used to determine all fluid physical properties and calculate the anode pressure drop. These are compared to the measured pressure drop and the iteration continues until the difference between the measured and calculated pressure drops is minimized.
Energies 10 01222 g002
Figure 3. (A) Polarization curve data for different membrane electrode assembly (MEA) configurations varying the cathode GDL at 75 °C for all setups, and (B) Comparison of AWR results for different MEA configurations varying the cathode GDL.
Energies 10 01222 g003
Figure 4. Comparison of experimentally measured anode pressure drop values and values predicted from Equation (1) at corresponding stoichiometric values for the fuel cell operating at 75 °C and Pinlet = 206.9 kPaG.
Energies 10 01222 g004
Figure 5. Comparison of voltage and net cell water flux for the operating conditions of (A) 75 °C; cathode GDL 25 BC (B) 75 °C; cathode GDL 25 BA (C) 75 °C; cathode GDL 25 AA and (D) 85 °C; cathode GDL 25 AA.
Energies 10 01222 g005
Figure 6. Average cathode pressure drop for each MEA configuration. Open symbols represent the tests performed at 85 °C.
Energies 10 01222 g006
Figure 7. A plot of the increase in voltage versus the total water removed by the anode stream.
Energies 10 01222 g007
Table 1. TP50E Research Cell Specifications.
CriteriaDescription
Active Area50 cm2
Cathode Channel Dimensions1.57 mm (w) × 0.99 mm (d)
Anode Channel Dimensions1.27 mm (w) × 0.51 mm (d)
Compression Pressure100 kPaG
Flow Field DesignSingle serpentine channel
Flow Field PatternSemi Co-Flow
Table 2. Sigracet 25 Gas Diffusion Layer (GDL) Line Specifications.
Sigracet Gas Diffusion Layer% PolytetrafluoroethyleneMicroporous LayerThickness (µm)Porosity
25 BC5%Yes2350.80
25 BA5%No1900.88
25 AA0%No1900.88
Table 3. Comparison of voltage, Anode Relative Humidity, and net cell water flux for three individual trials with a 25 AA cathode GDL at 75 °C and Pinlet = 206.9 kPaG.
StoichTrial 1Trial 2Trial 3
VoltageAnode RHNet Cell Water Flux (g/min)VoltageAnode RHNet Cell Water Flux (g/min)VoltageAnode RHNet Cell Water Flux (g/min)
1.50.37100.00%0.250.31100.00%0.250.36100.00%0.25
20.37100.00%0.230.30100.00%0.230.37100.00%0.23
30.38100.00%0.190.30100.00%0.190.38100.00%0.19
40.40100.00%0.150.33100.00%0.150.39100.00%0.15
50.44100.00%0.100.39100.00%0.100.44100.00%0.10
60.48100.00%0.050.44100.00%0.050.49100.00%0.05
70.52100.00%−0.010.50100.00%0.000.52100.00%0.00
80.59100.00%−0.070.5798.90%−0.070.5895.86%−0.06
90.6395.70%−0.130.6289.19%−0.100.6283.01%−0.07
100.6291.82%−0.200.6285.59%−0.160.6275.72%−0.10

