Article

Effect of Summer Ventilation on the Thermal Performance and Energy Efficiency of Buildings Utilizing Phase Change Materials

1
Guangdong Provincial Key Laboratory of Durability for Marine Civil Engineering, College of Civil Engineering, Shenzhen University, Shenzhen 518060, China
2
School of Architecture and Built Environment, University of Newcastle, Callaghan, NSW 2308, Australia
3
School of Civil Engineering and Architecture, Xi’an University of Technology, Xi’an 710055, China
*
Author to whom correspondence should be addressed.
Energies 2017, 10(8), 1214; https://doi.org/10.3390/en10081214
Submission received: 30 May 2017 / Revised: 10 August 2017 / Accepted: 12 August 2017 / Published: 16 August 2017
(This article belongs to the Section D: Energy Storage and Application)

Abstract

:
To analyze the effect of summer ventilation on the thermal performance and energy efficiency of buildings utilizing phase change materials (PCMs), this paper simulated the indoor temperature variation and energy saving performance of buildings constructed with PCM under different ventilation conditions from June to September. With EnergyPlus and degree-day method, 48 ventilation schemes, including eight ventilation periods (3 h per period) and six ventilation quantities (0.5 ac/h to 3 ac/h), were modeled and simulated in five cities located in different climate regions in China. According to the results, it is believed that the simultaneous use of PCM and ventilation can significantly improve the indoor thermal comfort and offer a good energy saving performance in summer. Considering the economic benefits, different optimal ventilation schemes (including ventilation periods and ventilation quantities) were suggested for different climate regions.

1. Introduction

Due to the dual actions of outdoor air temperature wave and intense solar radiation on building envelopes, the indoor thermal load increases greatly in summer, which affects indoor thermal comfort considerably [1,2,3]. Nowadays, fans and air conditioners (AC) have become practically essential for staying comfortable at home during the day or the night. However, even the most efficient, newest models always occupy the top of the home energy consumption pyramid. Statistics show that in developed countries the most energy used in a typical home is for heating and cooling, which is 38% of the total energy use [4,5,6] and the energy demand for heating and cooling will continue to increase due to population growth, extreme weather conditions and thermal comfort levels [4]. Given the high demand on electricity, there is an increased risk that many cities/suburbs will be subject to periods of low power or outages affecting essential facilities and services, including health, security and so on. Undoubtedly, the energy efficiency of buildings has become a prime objective for energy policy at regional, national and international levels [6].
Thermal energy storage techniques, using latent heat of phase change materials (PCM) to store and release thermal energy, are an effective and reliable means to enhance the energy efficiency of buildings [7,8]. Heat is absorbed or released when the material changes from solid to liquid or vice versa. It is believed that composites incorporated with PCM are capable of reducing energy costs, peaks and fluctuations of indoor temperature [9,10,11]. They can also contribute to reducing CO2 emissions associated with heating and cooling. However, when selecting a desirable PCM for a particular application, the operating temperature of heating or cooling should be matched to the transition temperature of the PCM. Some PCMs suitable for building applications and in the temperature range of 18 °C to 40 °C were reviewed by Memon [12]. Nevertheless, the effectiveness of PCMs is strongly dependent on the local weather and none of the current PCMs is equally effective throughout the year [13]. Especially in some areas where the temperature difference between day and night is small, the amount of heat released by a PCM at night is less than its heat absorbed during the day. In other words, when the temperature at night is still higher than the melting temperature of PCM, the PCM is not able to fully crystallize and the phase change is incomplete, which affects the expected thermal function of PCM for next day, and consequently reduces the energy efficiency of PCM in buildings [14,15].
It is believed that the efficiency of PCM can be greatly enhanced if the building can be properly ventilated to release some of the heat gains during the night-time in summer, especially when the air temperature is close to the PCM melting temperature [16]. Typically, buildings can be ventilated in three different ways: natural, mechanical and mixed modes. Natural ventilation can be driven either by wind pressure or thermal pressure as shown in Figure 1 [17]. Buoyancy or wind-driven ventilation can remove heat gains of up to about 30 to 40 W/m2 [18]. However, the natural ventilation is affected by meteorological conditions and a constant amount of ventilation over a prolonged period cannot be maintained [19]. In some large buildings, as a result of longer ventilation path and bigger air flow resistance, the natural ventilation by wind pressure and/or thermal pressure is also not sufficient to meet the indoor ventilation demands. In addition, the direct natural ventilation may bring in polluted air and noise from outside to affect the indoor environment. In this case, using mechanical means to assisted ventilation can ensure good indoor air quality [20]. In places where the cooling load exceeds 40 W/m2 mechanical ventilation can also increase air flow locally and enhance heat transfer. Similarly, the mechanical ventilation can be used to speed up the heat releasing of PCM at night and the efficiency of PCM on thermal energy storage can be improved considerably. It is believed that the application of PCM on building envelops with proper ventilation may be one of the most effective measures to reduce building energy consumption [17].
Nowadays, the performance of PCM in buildings can be simulated using numerical modelling. In previous numerical studies, the phase change effect has been taken into account through several methods such as enthalpy method and heat capacity method, or using building simulation software such as TRNSYS, ESP-r and EnergyPlus [13,21]. Among them, EnergyPlus has been shown to accurately predict the thermal performance of buildings with PCMs if several guidelines are met [22]. Hence, EnergyPlus has been adopted as the investigation tool in the present study. Cui et al [23,24] have carried out a series of experimental and numerical studies with room models to verify the energy efficiency of PCMs in building envelopes. The authors’ outdoor test research [25] was carried out in Shenzhen in the south of southern China’s Guangdong Province, situated directly north of Hong Kong. For the research, a room model having dimensions of [545 mm (length) × 545 mm (width) × 560 mm (height)] was used to monitor the indoor temperature and humidity. The walls of the room model were made up of normal concrete. In order to have a better understanding of the effect of macro-encapsulated PCM on the indoor temperature and humidity levels, three room models with PCM placed in different positions (externally bonded, laminated within and internally bonded) were constructed (Figure 2). For Type I, the four faces of the room model were externally bonded with 20 mm stainless steel boxes encased with paraffin. In Type II, the stainless steel boxes were placed between the 40 mm concrete walls while in Type III, 20 mm stainless steel boxes were internally bonded with 40 mm concrete walls of the room model. For comparison, another room model (Control model without PCM) of similar size was also constructed. The ceiling of all the room models was covered with 15 mm wooden plate and 30 mm insulating material having low thermal conductivities while the gaps were sealed with silicon sealant. The test results showed that, in comparison to the control model, the models with PCM can improve the thermal performance of building. In addition, by shifting the loads away from the peak demand times, energy can be purchased at lower cost during the off-peak periods. The models with PCM showed higher values of minimum temperature. From this study, it can be concluded that the model with internally bonded PCM is much more effective. The model also showed its effective even when the relative humidity values remained 100% for longer duration. This feature can particularly be beneficial for buildings located in coastal cities where high moisture content existing in indoor environment can affect the durability of the building.
Based on the authors’ research experiences on practical room model tests [25,26], this paper aims to analyze the indoor thermal performance (by EnergyPlus) and energy saving performance (by degree day method) of buildings constructed with PCM under different ventilation conditions (including ventilation periods and ventilation quantities). The effect of ventilation on thermal performance and energy efficiency of buildings utilizing a PCM in different climate regions were also investigated. For a reliable comparison, only mechanical ventilation was utilized in this study. The ventilation was designed in accordance with the requirements of GB50736-2012 [27]. It is generally accepted that ventilation has an impact on charging-discharging of PCMs in building envelopes and the building energy performance; however, such impact has not been studied quantitatively. The main novelty as well as the significant scientific contribution of this research is to examine the effects of different ventilation schemes on the thermal performance and energy efficiency of buildings utilizing PCMs by means of numerical simulations.

2. Methodology

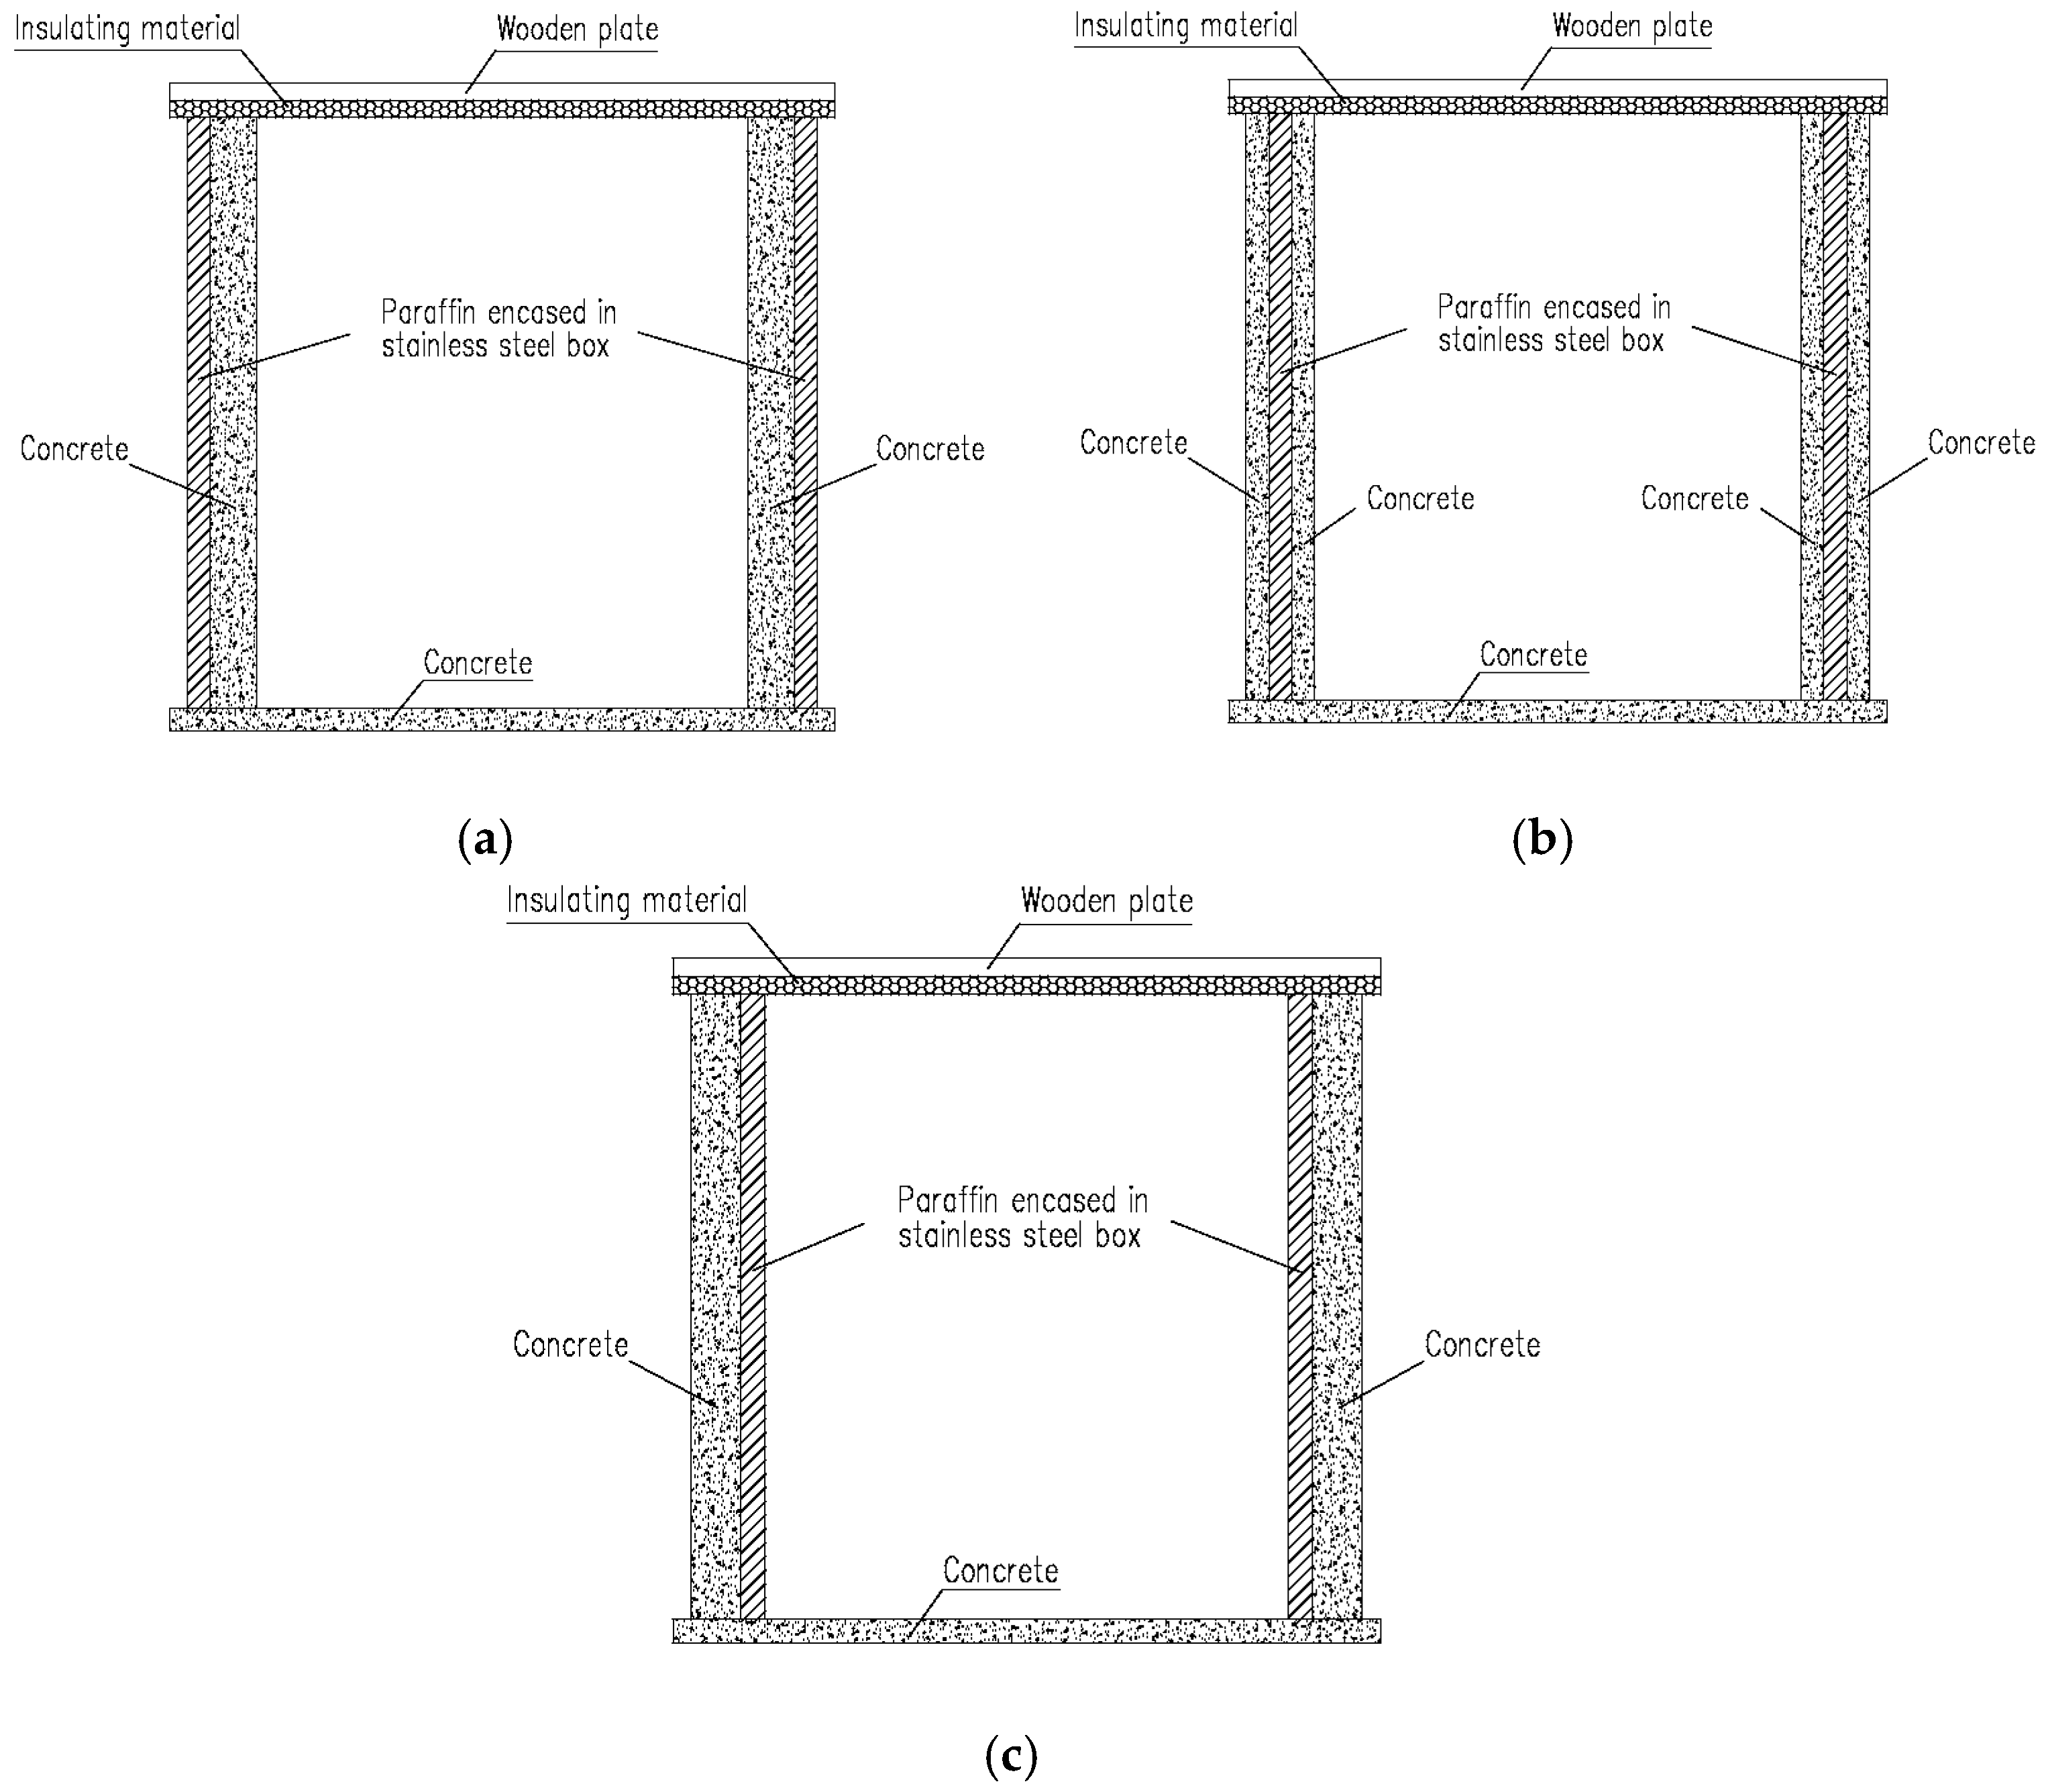
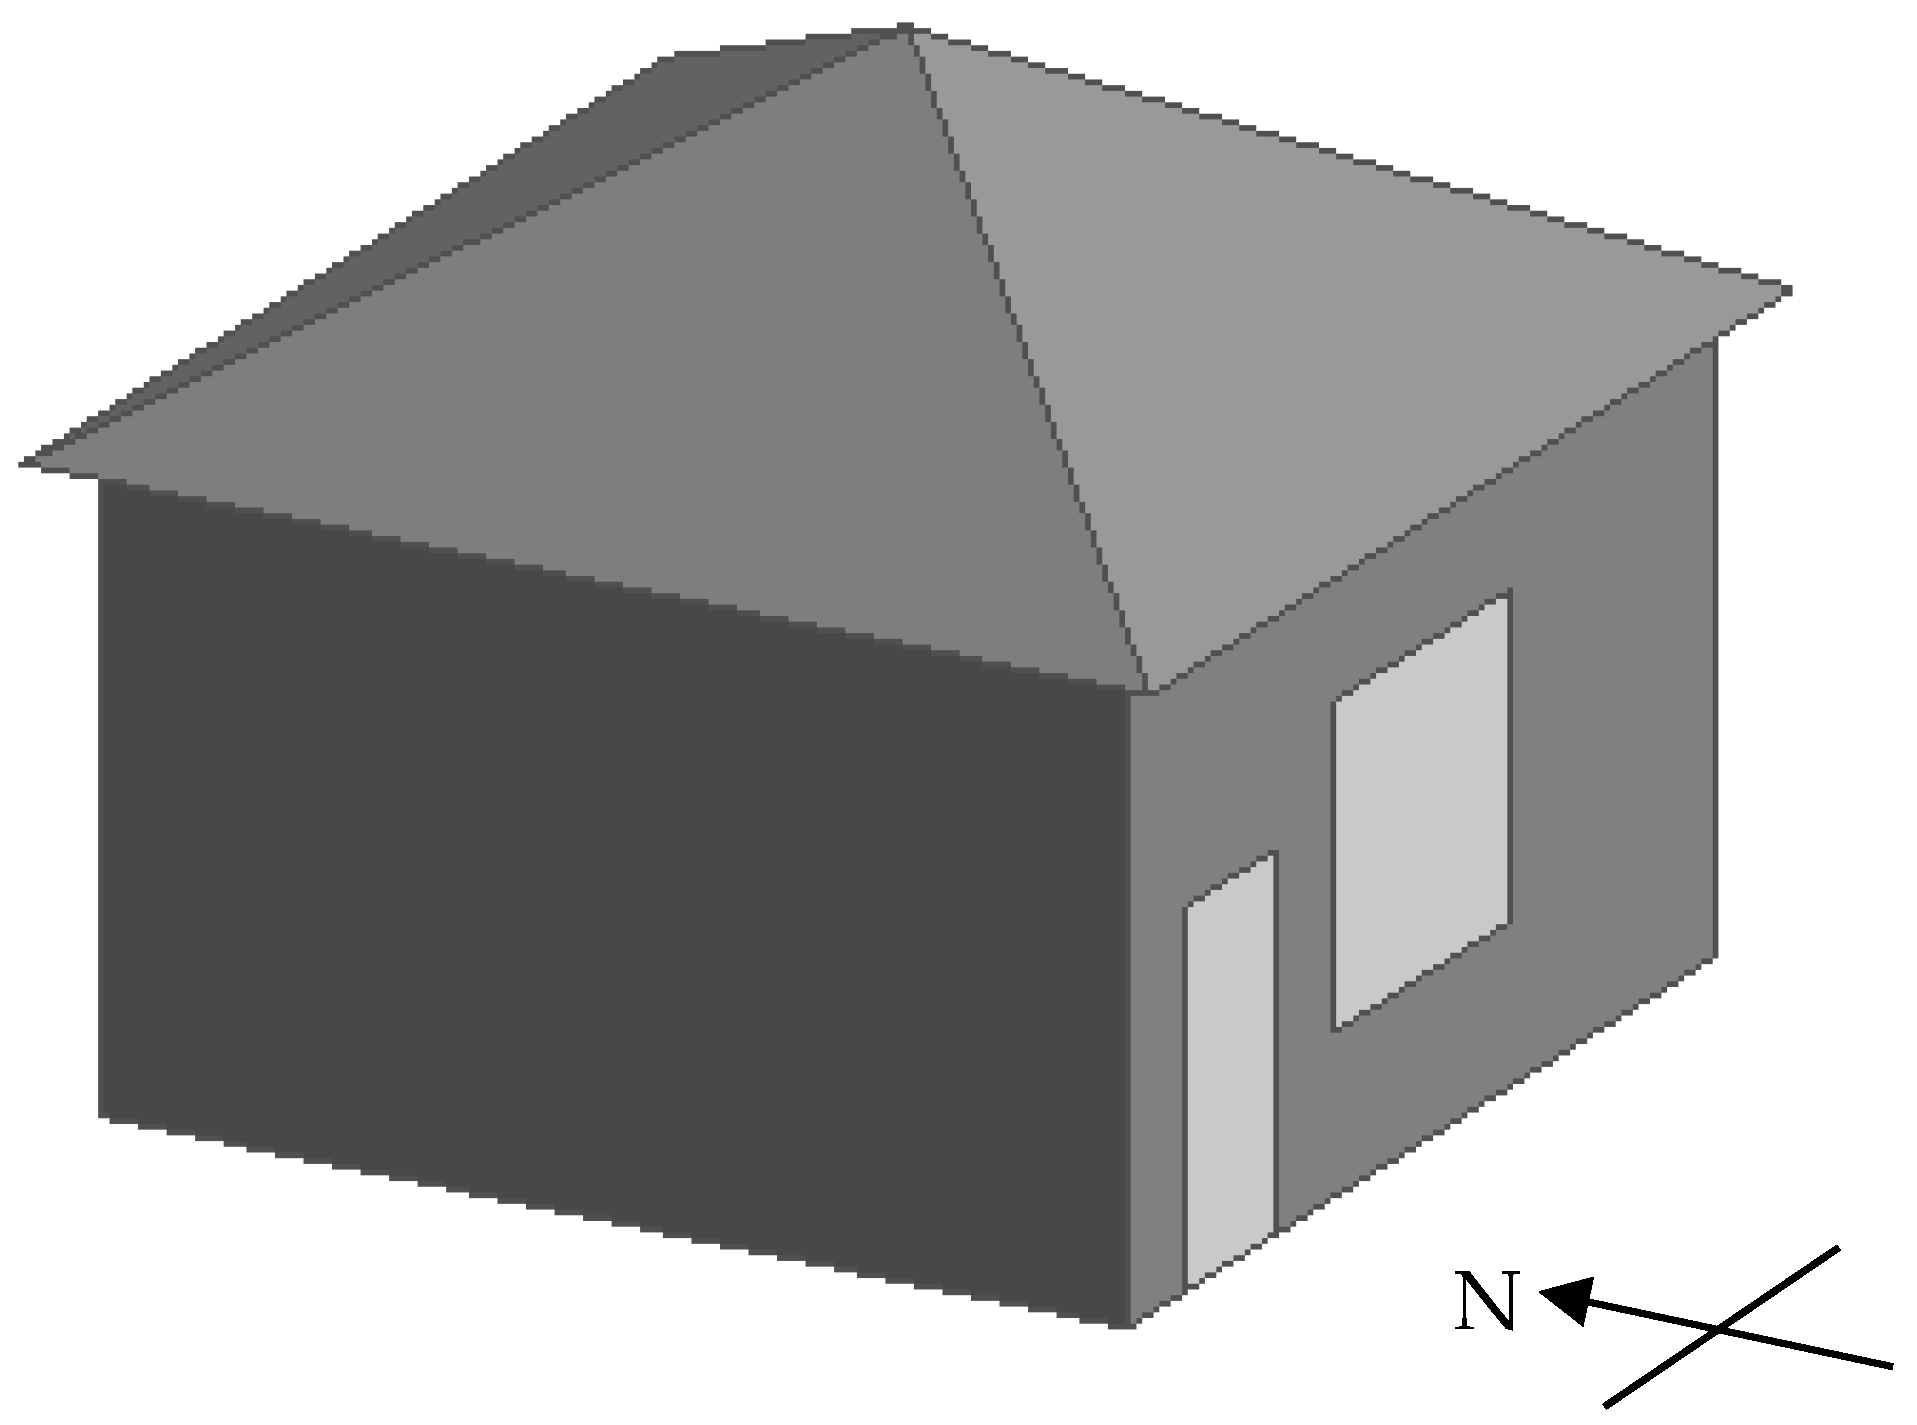
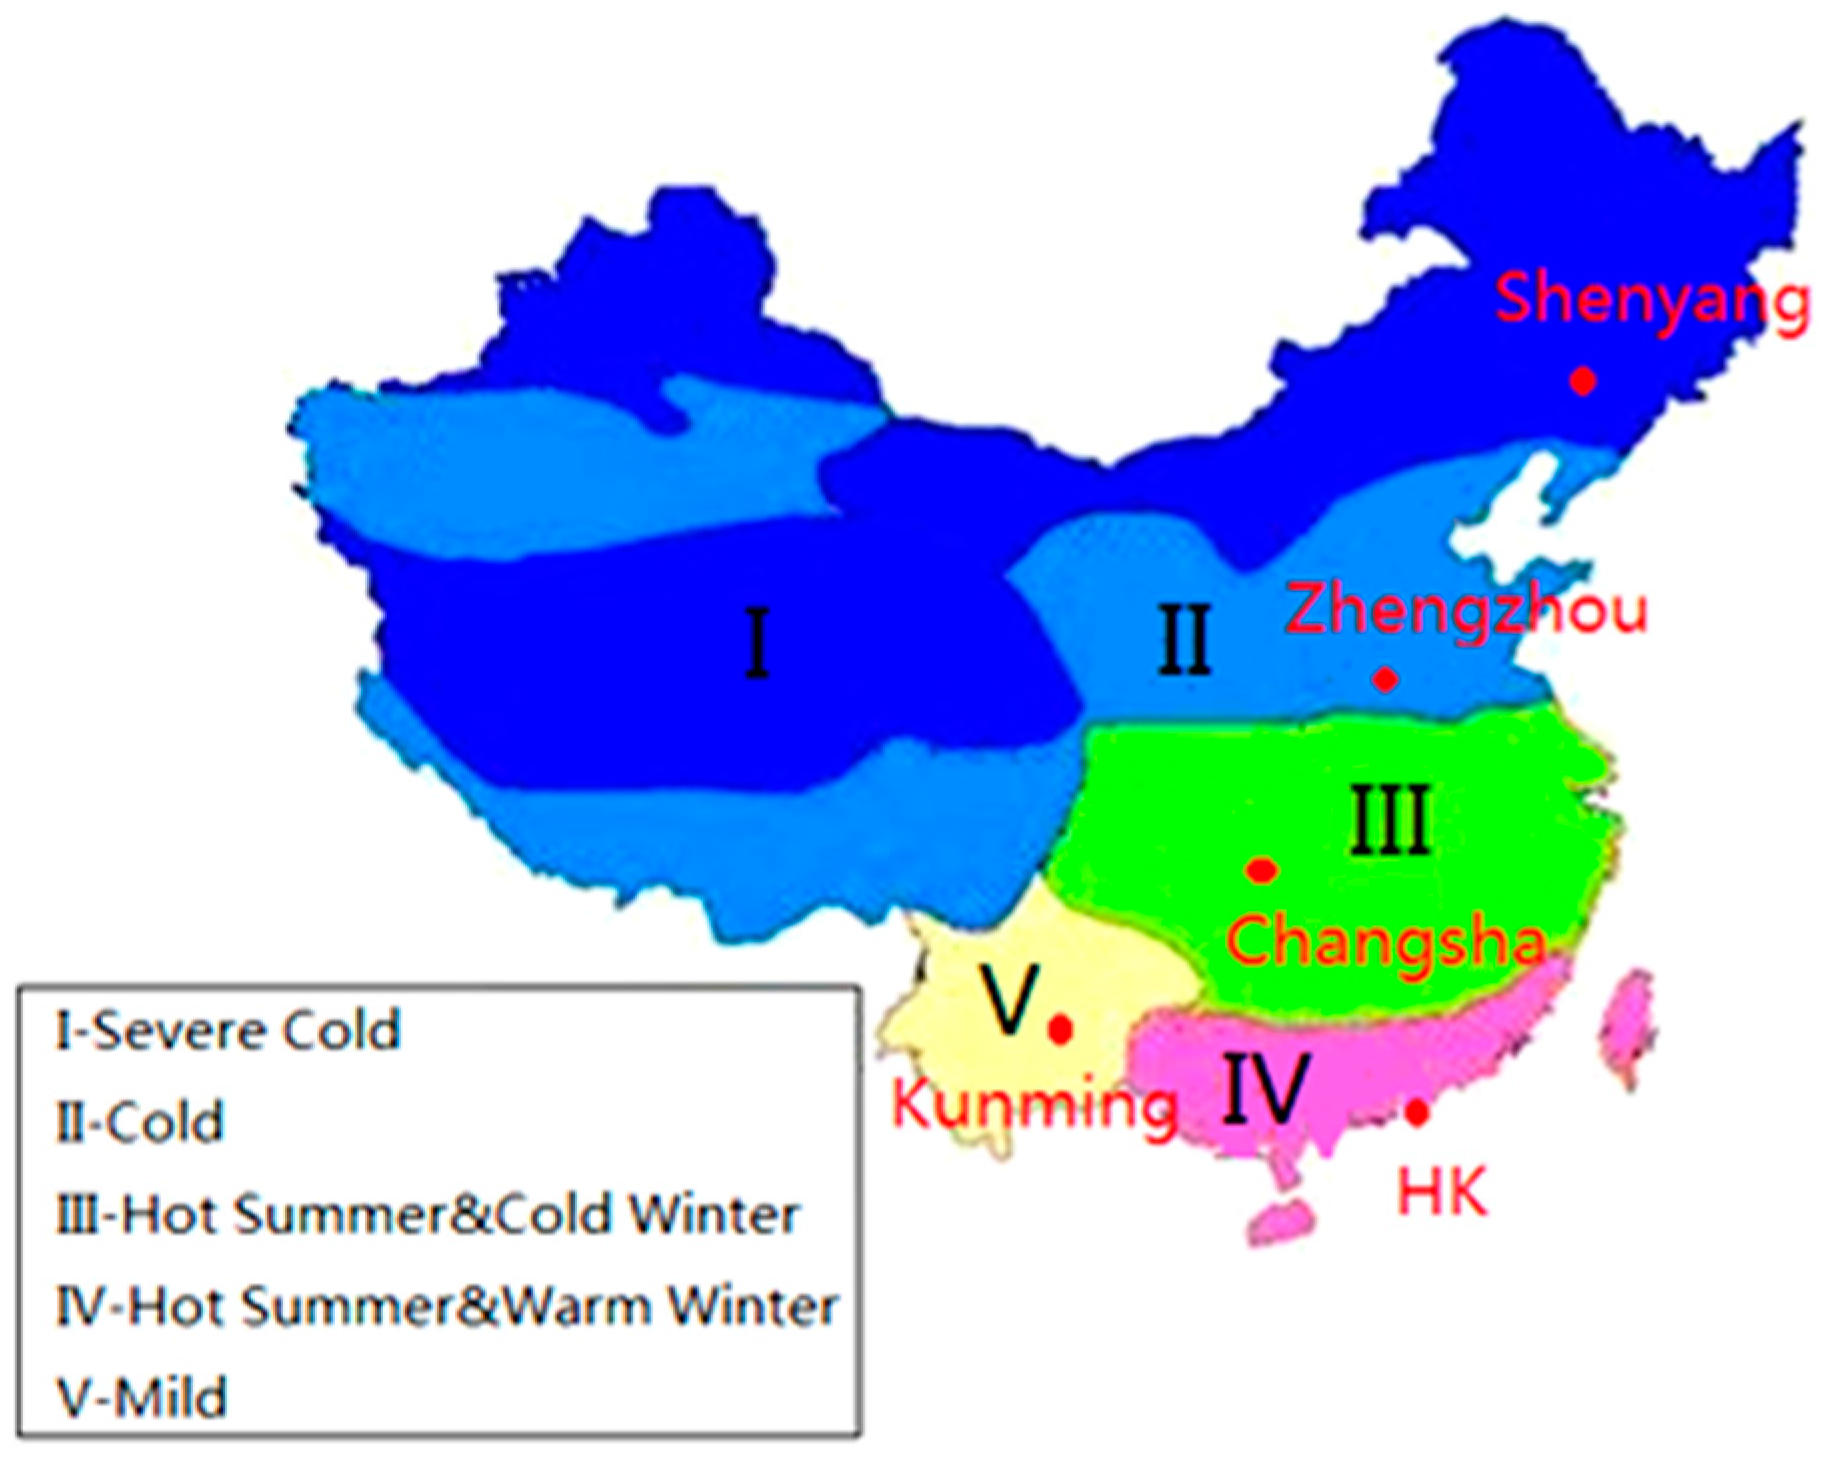
2.1. Modeling and Climate Regions

To understand the effect of PCM on thermal performance of complex buildings, numerical simulations need to be carried out purposefully. It should be stressed that numerical simulation on a relatively simple geometry of room model is a widely acceptable approach to assess certain parameters on performance of building. In this study, a single-story building with a dimension of 6 m (length) × 6 m (width) × 3.6 m (height) was considered for the simulation as shown in Figure 3. It is believed that the findings of this study can serve as meaningful direction for future research work on PCM application in complex buildings. The floor area and volume of the building were 36 m2 and 129.6 m3, respectively. There was one south facing door with size of 0.9 m × 2.1 m and one 1.8 m × 1.8 m window on each of the south and north walls. The U-heat transfer coefficient of door and window were 2.8 W/m2 K and 3.2 W/m2 K, respectively. The window-wall ratio was 18%. The four external walls of the building were constructed with reinforced concrete and extruded polystyrene (XPS) insulation board. China is located in northern hemisphere, so the south and west walls of buildings are normally expected to receive the most solar radiation. Considering the magnitude of solar radiation, in this study, a 10 mm PCM enhanced wall board was mounted on the west and south walls of building to optimize the thermal storage function of building. The roof was of hip type with 15 degree pitch and 0.9 m long eaves on all four sides. The detail constructions and thermal physical properties of all building materials are shown in Table 1. The PCM used in this paper was paraffin with a melting temperature of 27 ± 1 °C and latent heat of 153 kJ/kg based on the corresponding experimental tests. In fact, the PCM melting temperature plays a significant role in thermal control and energy saving performance of PCM. In our previous studies, PCM with melting temperature of 26–28 °C usually gave the best performance for buildings in most climate regions of China, so the PCM with a melting temperature of 27 ± 1 °C was chosen in this paper.
Simulations were carried out using building simulation software EnergyPlus 7.2 for five different cities of China located in five different climate regions (Severe Cold region, Cold region, Hot Summer & Cold Winter region, Hot Summer & Warm Winter region, and Mild region) as shown in Figure 4. The mean temperatures in the coldest and hottest months in different climate regions according to Chinese national thermal design code for civil building [28] are provided in Table 2. The cities chosen were Shenyang, Zhengzhou, Changsha, Kunming and Hong Kong (HK). The typical meteorological data of these cities included dry bulb temperature, humidity, horizontal/vertical radiation, and wind velocity etc between June 1 and September 30 were obtained from EnergyPlus official website and used for the simulation studies [29]. The influence of ventilation on indoor thermal comfort and energy consumption of PCM buildings in different climate regions were investigated.
By taking the meteorological conditions into account, the indoor air temperature and energy consumption of building models in representative cities of five climate zones during June 1 to September 30 were simulated, and the effects of ventilation on indoor temperature variation and energy saving performance of building constructed with PCM was evaluated. Table 3 and Table 4 shows the test cases used in the simulation studies along with PCM, ventilation quantities and ventilation periods in five cities.

2.2. Determination of Energy Consumption for Building Cooling

In this research, the degree-day method was used to calculate the energy consumption for cooling the building. Based on the assumption that the thermostat set point temperature of air conditions (AC) and indoor heat gain are both constant, and considering the long-term average effect of heat transfer, it can be known that the solar radiation energy and indoor heat gain will be offset by the building heat loss, the room thermal environment keeps the balance when the average outdoor temperature is equal to a specific value, noted as balance-point temperature (Tbal). If the thermostat set point temperature of AC is equal to Tbal (say 28 °C), the actual energy consumption will be proportional to the difference between the outdoor air temperature and 28 °C as expressed in Equation (1).
E c = K tot η c hours ( T i T bal ) + = U i A i η c hours ( T i T bal ) +
where Ec: Cooling energy consumption, (kW); Tbal: Balance-point temperature (°C); Ti: outdoor air temperature, (°C); ηc: AC cooling efficiency(cop), which was assumed 3.0 in this paper; Ktot: Building heat loss coefficient, K tot = U i × A i (kW/°C); Ui: Heat transfer coefficient of building envelopes kW/m2, (°C), as shown in Table 1; A: Surface area of building envelopes, (m2), as mentioned in Section 2.1; The ( ) + in Equation (1) refers to the absolute value of the temperature difference between Ti and Tbal.
Given the fact that Tbal was a constant value which may affect the accuracy of results, a modified degree day method and a variable-based degree day method were proposed. The modified degree day method was basically the degree day method but the equation was multiplied by a coefficient CD. In this paper, the value of Tbal was revised considering the variations of heat gains from equipment, people and solar radiation due to the differences of climate conditions, building constructions and material properties in various regions. In the variable-based degree day method, Tbal was no longer a constant value, and it was calculated by the following Equations (2) and (3) [17], as shown in Table 5 and Table 6:
k ( T R T bal ) q = 0
T bal = T R q K tot
where, TR: Thermostat set point temperature, (°C), 28 °C was used in this paper; q: Average hourly solar radiation and indoor heat gain, (kW), as shown in Table 5.
Although the variable-based degree day method is a static method, it has been commonly used for determining heat transfer of buildings, in particular for residential buildings where the heat transfer primarily take place at their building envelopes. It has been stated that the variable-based degree day method can provide accurate forecast for summer energy consumption of buildings [17]. In this paper, the values of thermostat set point temperature in different cities were determined using the variable-based degree method, as shown in Table 6. Summer cooling energy consumption was calculated by the variable-based degree day method with modified Tbal.
In order to calculate the ventilation energy consumption, the following Equation (4) was quoted from Chan’s study [30]:
Q = G × Δ P × 10 3 3600 η
where, Q: Ventilator power, kW; G: Ventilation quantity, G = t × n × V, (m3); n: Ventilation times per hour, (ac/h), which was 0.5~3 ac/h in this paper; t: Ventilation operating time, (h); V: Effective volume of enclosure, (m3); ∆P: Air pressure of ventilators, (Pa), which was 800 Pa in this paper; η: Ventilation efficiency, which is 90% in this paper.

3. Results and Discussion

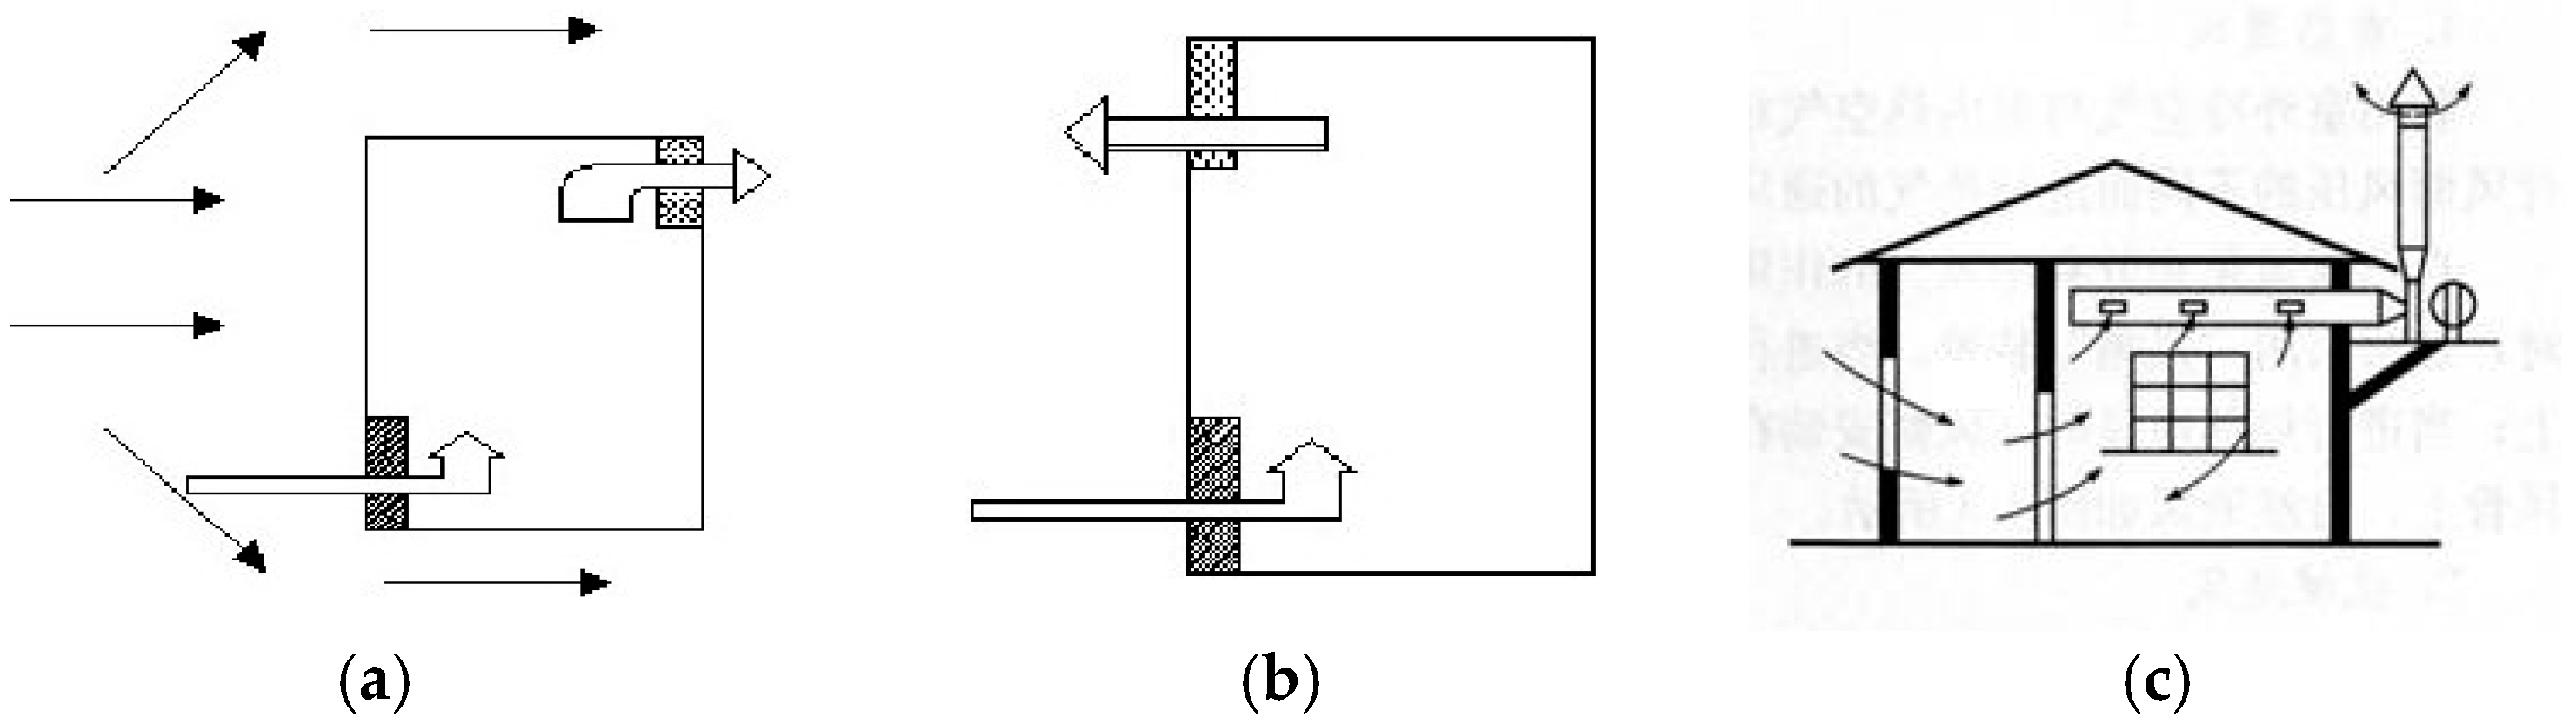
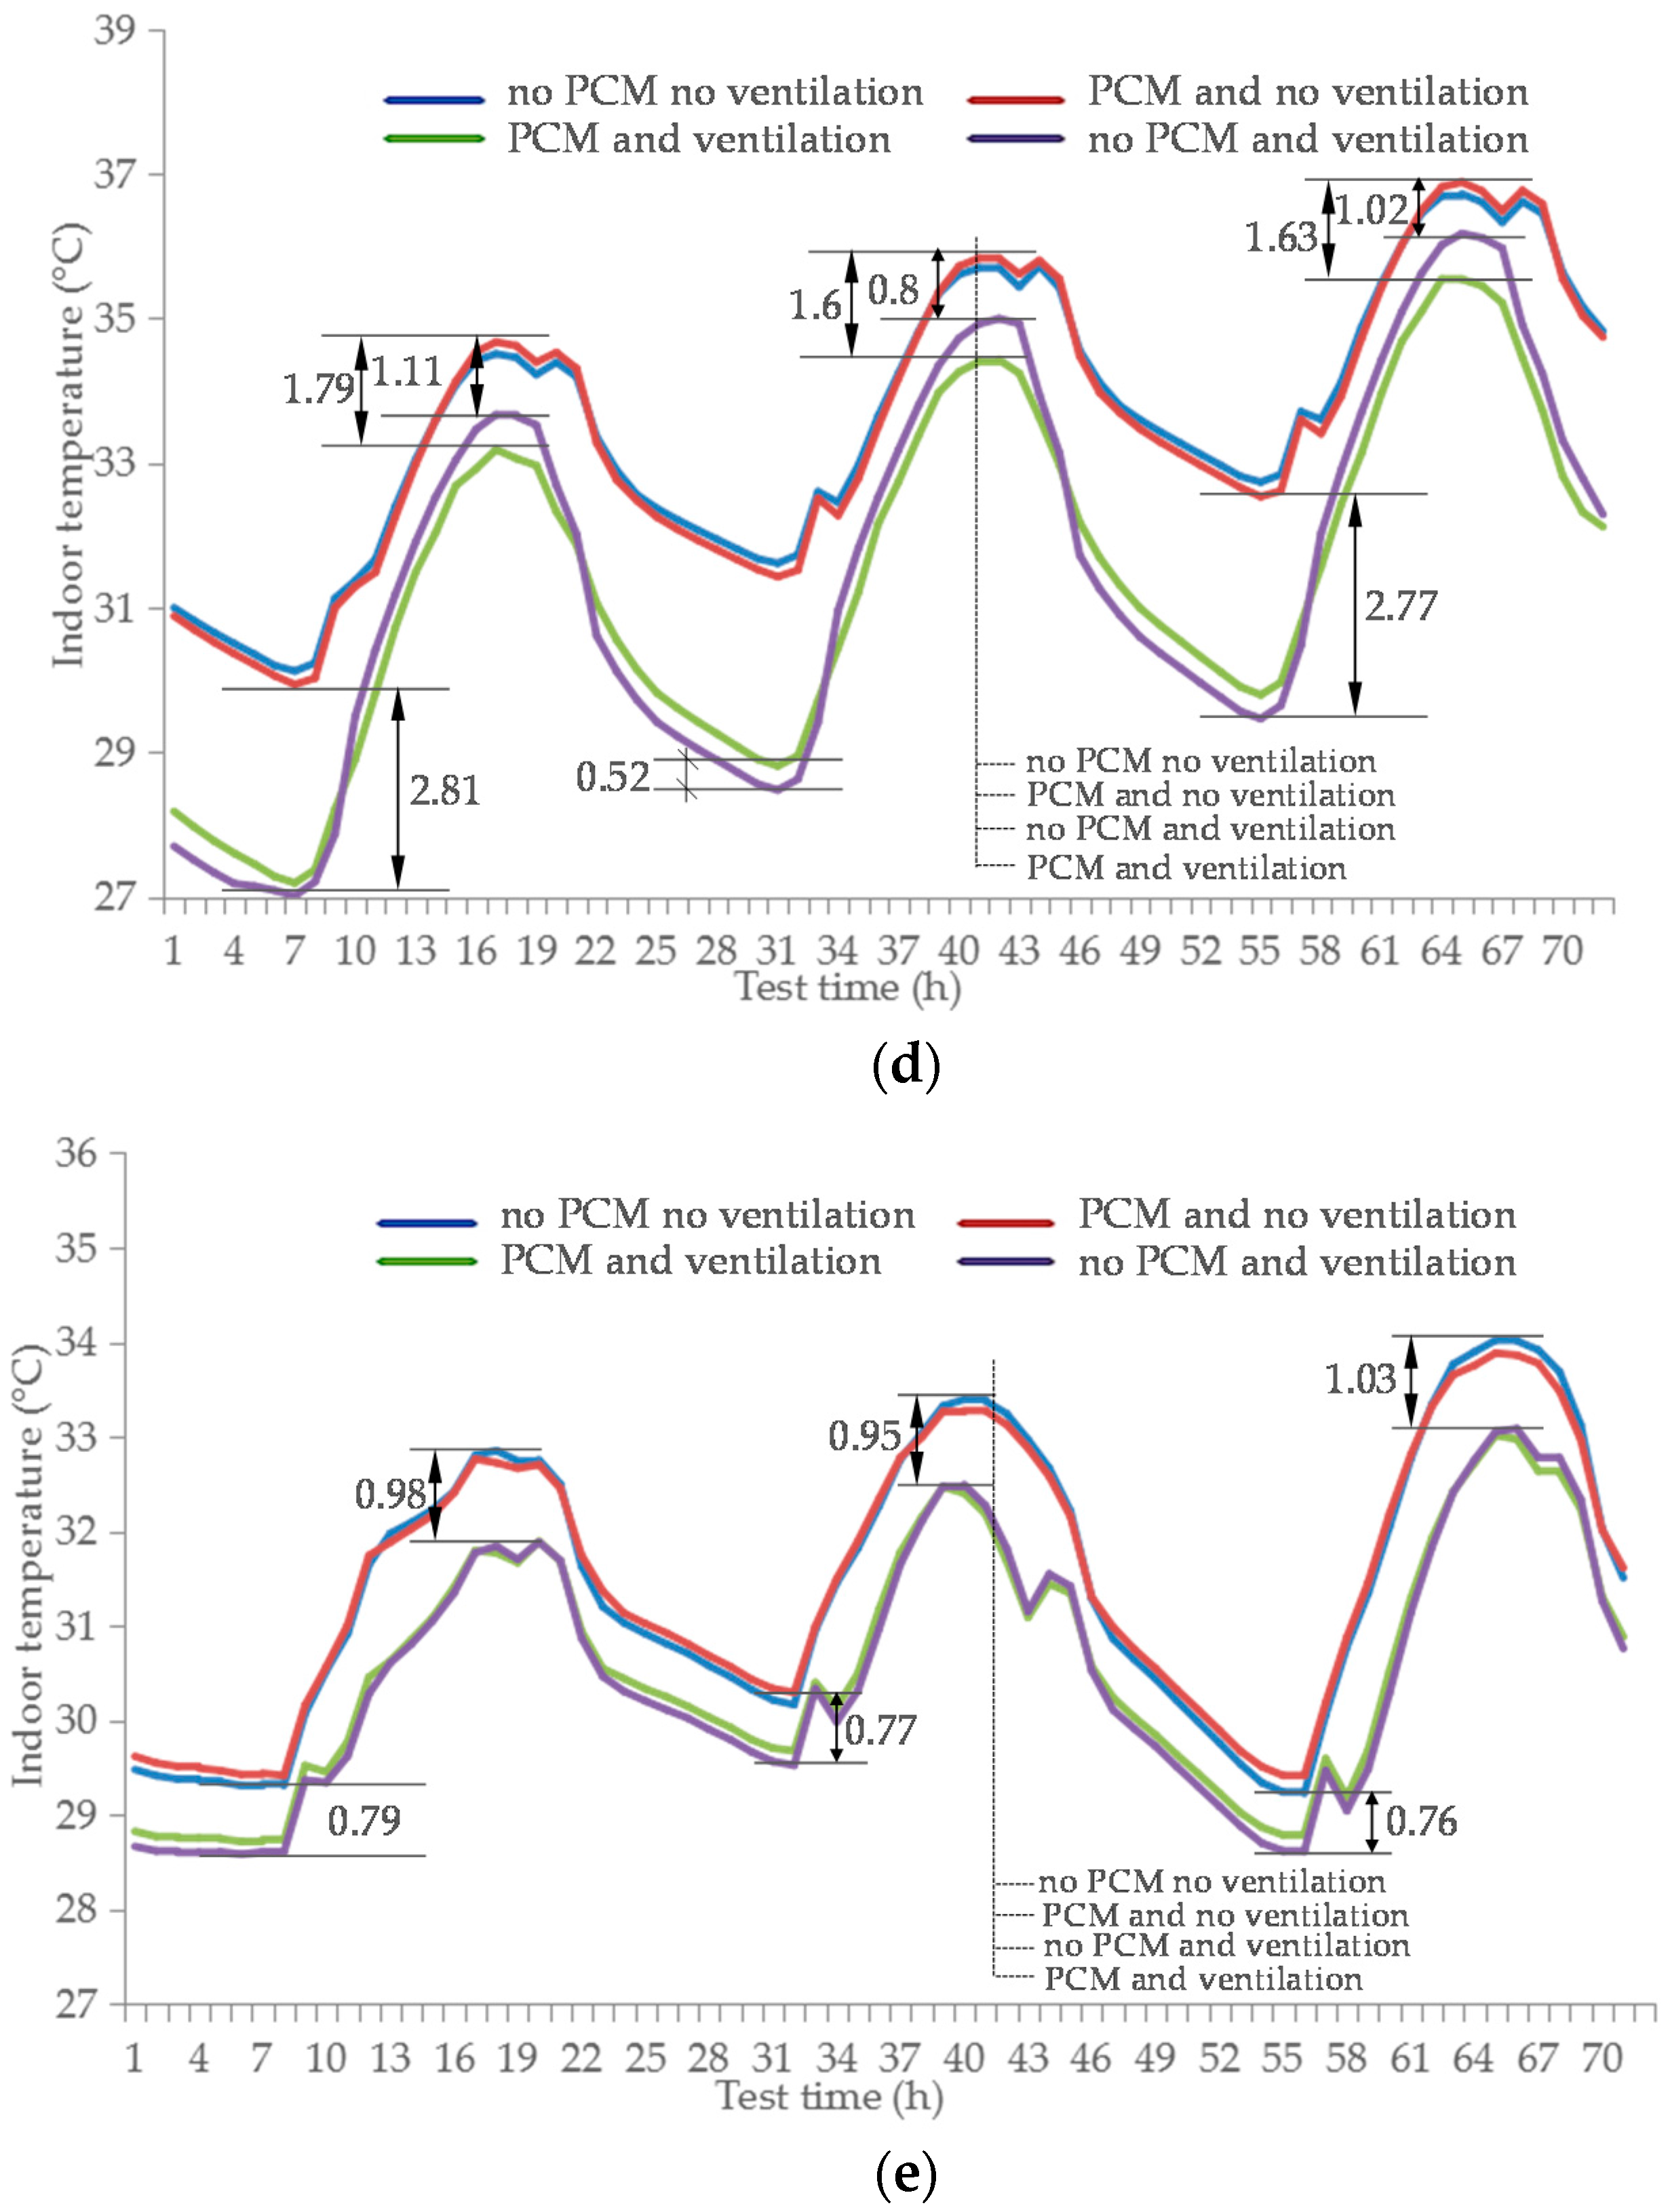
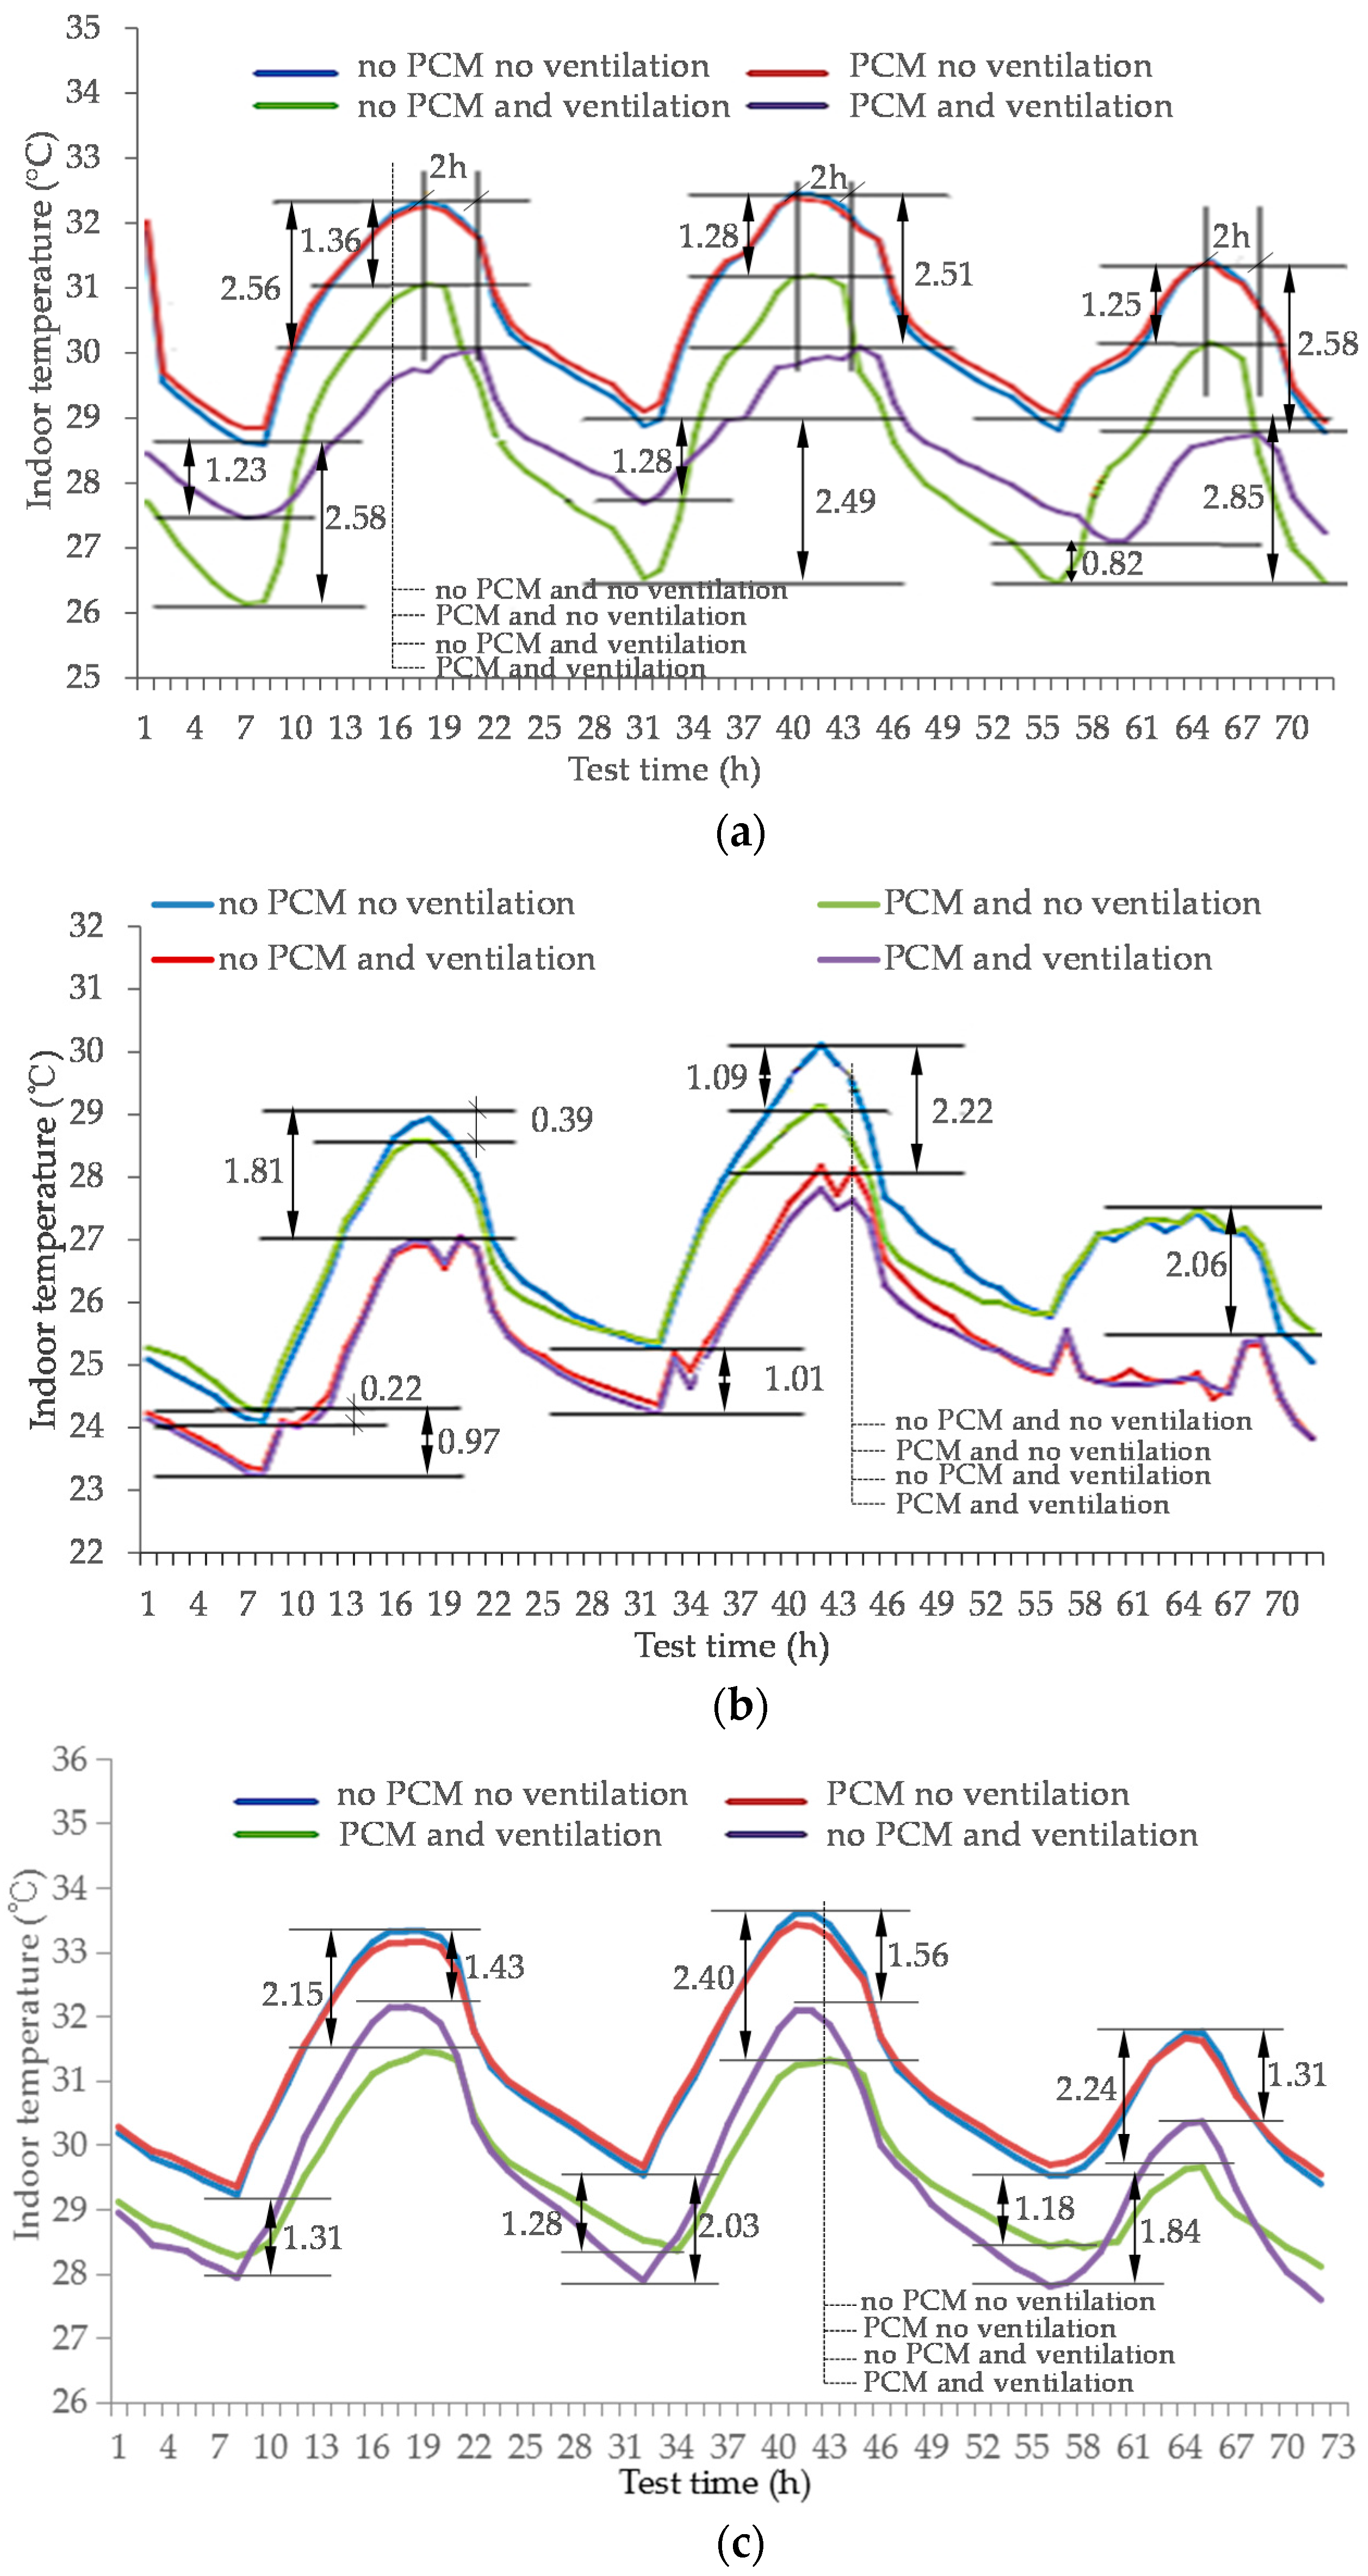
3.1. The Effect of Ventilation on Indoor Temperature

Figure 5 shows the results of indoor temperature of building models in different cities subjected to different ventilation and PCM conditions in the period between July 1 and July 3. It can be clearly seen that the indoor temperature could be reduced effectively with the use of ventilation, and a more significant reduction was observed for the building models containing PCM. However, when the ventilation was not provided, there was no significant difference in indoor temperature between the building models with and without PCM, except the models in Kunming. The reason is mainly due to the summer outdoor temperature in all cities studied (except Kunming) was very high and the temperature during most of the time was well above 30 °C. With such high temperatures, the PCM still remained in liquid state long after sunset. As a result, the phase transition of PCM was not effective and thus the energy storage function efficiency of the PCM was limited. Conversely, with the provision of mechanical ventilation, the indoor temperature observed in most cities decreased considerably, especially the buildings in cities located in mild climate regions, such as Kunming, Zhengzhou and Shenyang. The indoor temperature of buildings in the above-mentioned cities dropped to the range of the PCM melting temperature. Under the same ventilation condition (ventilation quantity was 1 ac/h and ventilation period was from 8:00 to 18:00), the building models with PCM showed lower indoor temperatures than that of models without PCM during the daytime, but their indoor temperatures during night-time were higher. Apparently the use of PCM could help shifting the peak indoor temperatures as shown in Figure 5. For those models in Kunming, the effect of PCM on indoor temperature was insignificant. This is probably due to the fact that Kunming is in mild climate region, where the phase transition of PCM was not effective, because in Kunming the highest temperature in the hottest months (see Table 2) is still lower than the phase change temperature of PCM which is 27 °C in this study.
An indicator, aggregate discomfort degree for indoor temperature, IDCT (°Ch) originally proposed by Lin et al. [31] was used to better evaluate the effect of PCM on indoor temperature in this study, which is expressed as follows:
I DCT = 0 24 ( t in t d ) dt , t in > t d
where tin: Indoor air temperature, °C; td: A comfortable temperature setting that usually ranged between 26 °C and 28 °C, and 28 °C was used in this paper.
The smaller IDCT means the better indoor thermal comfort. Figure 6 shows the results of summer IDCT of building models in different cities with PCM and ventilation or not under the same ventilation quantity (1 ac/h) and ventilation period (8:00~18:00). The building models with ventilation showed lower IDCT values compared to that of building models without ventilation, and the values further decreased when PCM and ventilation were both applied. In general, the ventilation played a significant role in IDCT values as the building models with ventilation showed much lower IDCT compared to the models without ventilation, even the PCM was in place. In areas with constantly high temperature in summer like Changsha and Hong Kong, if there was no ventilation, the summer IDCT decreasing by PCM was almost negligible (78.41 in Changsha and 164.5 in Hong Kong). This is in line with the analysis results of the indoor temperature under different ventilation conditions.

3.2. The Effect of Ventilation Period on Indoor Temperature and Energy Consumption

It is well known that the outdoor temperature fluctuates with time and the amount of solar radiation absorbed by buildings is affected by the solar radiation angle, so that the heat load of building invariably varies with time throughout the day. Therefore, the values of summer IDCT and cooling energy consumption would be different at most of the times. To understand the effect of ventilation period on PCM thermal efficiency and energy saving performance, in this study, a day was divided into eight periods (3 h each period) and the corresponding values of summer IDCT and building energy consumption of building models at different periods were determined accordingly. The ventilation quantity was fixed at 1 ac/h. Table 7 and Table 8 show the results of summer IDCT and building cooling energy consumption at different ventilation periods during summer.
As shown in Table 7 and Table 8, the values of summer IDCT and building cooling energy consumption observed for building models with PCM using ventilation at night in four cities like Hong Kong, Zhengzhou, Shenyang and Changsha, are significantly lower, which means the combination of ventilation at night-time and PCM can effectively improve the building indoor thermal environment. Because the outdoor air temperature was very high at daytime in summer, so only part of the indoor heat gained was released by the ventilation, and the PCM still remained in liquid state. However, the outdoor air temperature at night was relatively low, so the use of ventilation at night could help release most of the heat stored by PCM and thus not only solving the heat accumulation problem of PCM, but also making the PCM to work fully effective as the phase transition during 24-h time periods was complete. According to the data shown in Table 7 and Table 8, the best ventilation periods with the least summer IDCT and cooling energy consumption of building models were 15:00–18:00 in Kunming and 0:00–3:00 in other cities. Considering the duration of ventilation period, it is believed that only a 3-hour ventilation periods may be not long enough to allow the PCM to release the heat gained at night, so the duration between 0:00 and 9:00 was selected as a good ventilation period for buildings located in Hong Kong, Zhengzhou, Shenyang and Changsha areas.
Based on the results, the effect of daytime ventilation on summer IDCT of building models in Kunming was more pronounced compared to that of building models in other cities. The reason is also that the summer indoor thermal environment is relatively mild in Kunming. Considering the economic benefits, it is believed that appropriate natural ventilation instead of using PCM or mechanical ventilation is sufficient to ensure the indoor thermal comfort for buildings in Kunming, so the effect of ventilation quantity on indoor temperature and energy consumption in Kunming was not further studied in this research.

3.3. The Effect of Ventilation Quantity on Indoor Temperature and Energy Consumption

3.3.1. The Influence of Ventilation Quantity on Indoor Thermal Comfort of Buildings with PCM

Previous sections have shown that if ventilation was provided at different periods, the effect of PCM on indoor temperature and cooling energy consumption would be dissimilar. Apparently the impact on indoor thermal comfort the ventilation provided at night-time is greater than that provided during the daytime. In daytime, the phase change energy storage properties of PCM could improve the thermal inertia of building envelopes and thus keeping the indoor temperature from rising too fast and high. Whereas, the provision of ventilation at night brings in the outdoor cold air to release the indoor hot air as well as the heat stored by PCM. It is believed that the simultaneous use of PCM and ventilation would greatly reduce the summer indoor thermal load, and the cooling energy consumption could be effectively reduced. In order to study how ventilation quantity improve the performance of PCM on indoor temperature and energy consumption under different climate regions, the effect of ventilation quantity (i.e., air changes per hour) on IDCT in summer was studied, with the above-mentioned good ventilation period (0:00~9:00).
The relationship between IDCT and the change of ventilation quantity is shown in Figure 7. It can be clearly shown from the figure that IDCT generally decreased with the increasing of air changes, but the decrease became insignificant when the ventilation quantity was 2 or higher. The study found that although the values of IDCT were so different among the four climate cities, the trend of their IDCT with ventilation quantity is broadly similar. Because there was nothing with large heat storage function in the room apart from the PCM in the building envelopes. When the ventilation quantity at night-time increased, the indoor temperature was soon close to the outdoor temperature, so the influence of ventilation on indoor temperature became insignificant.

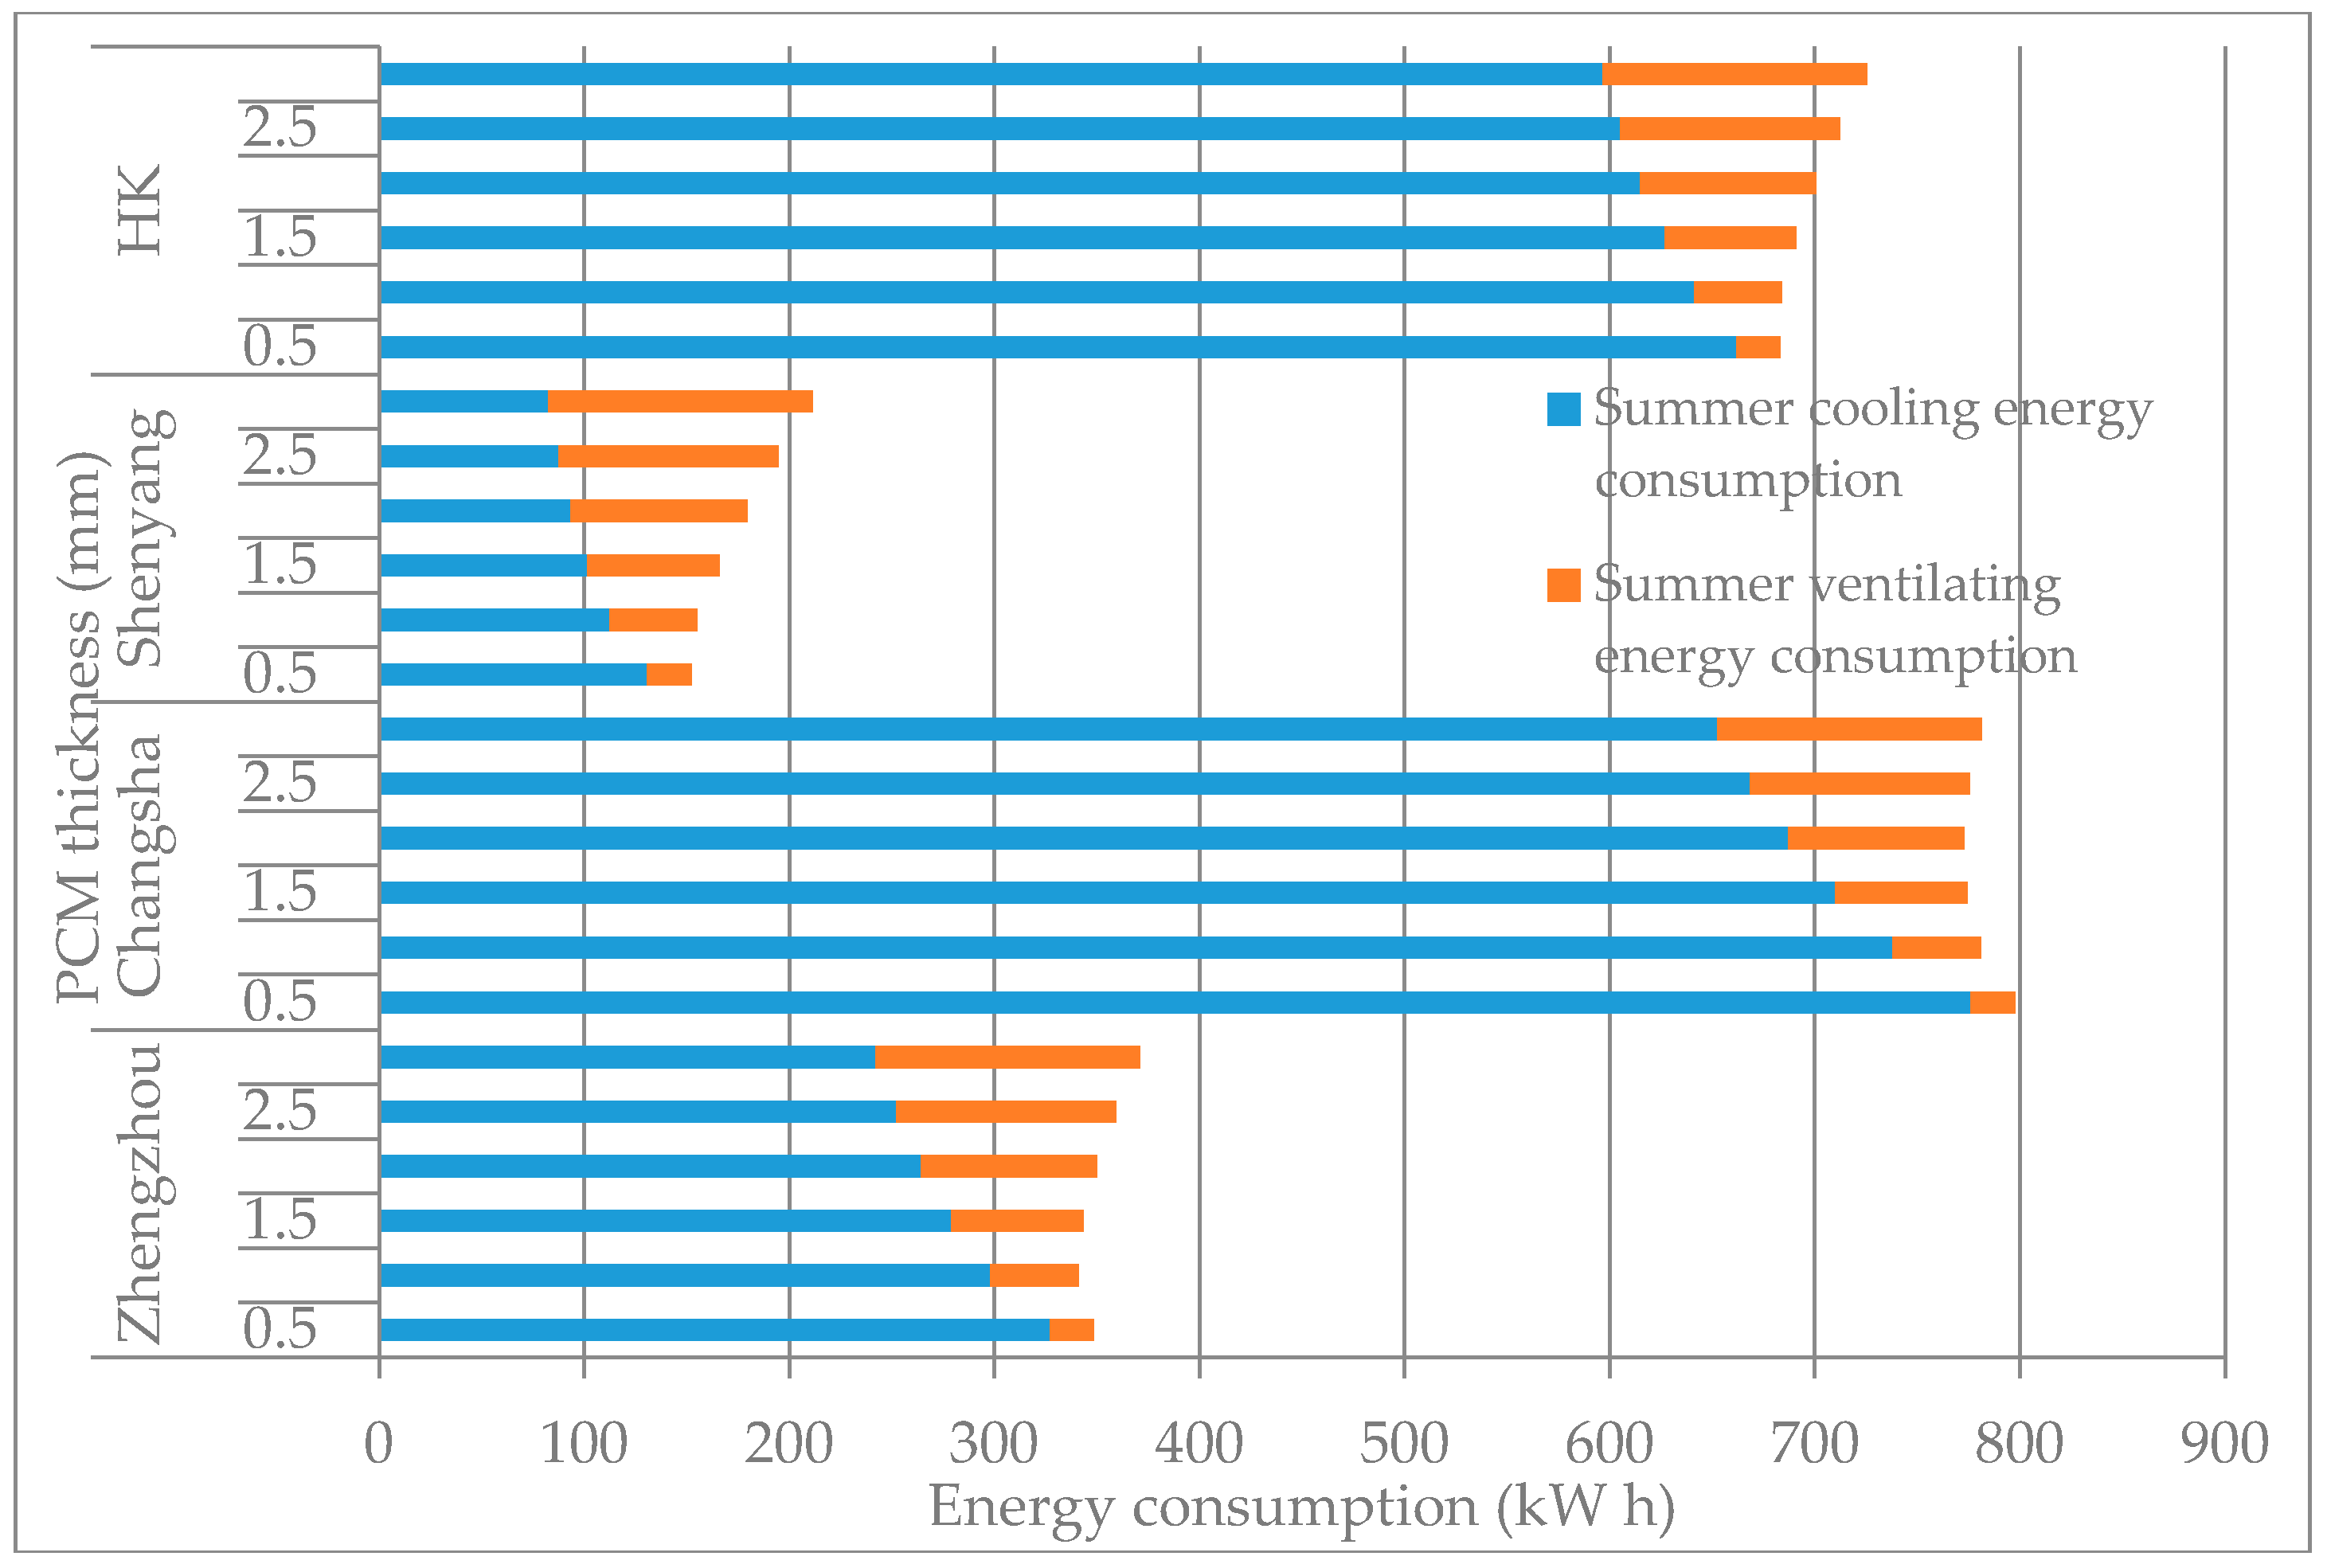
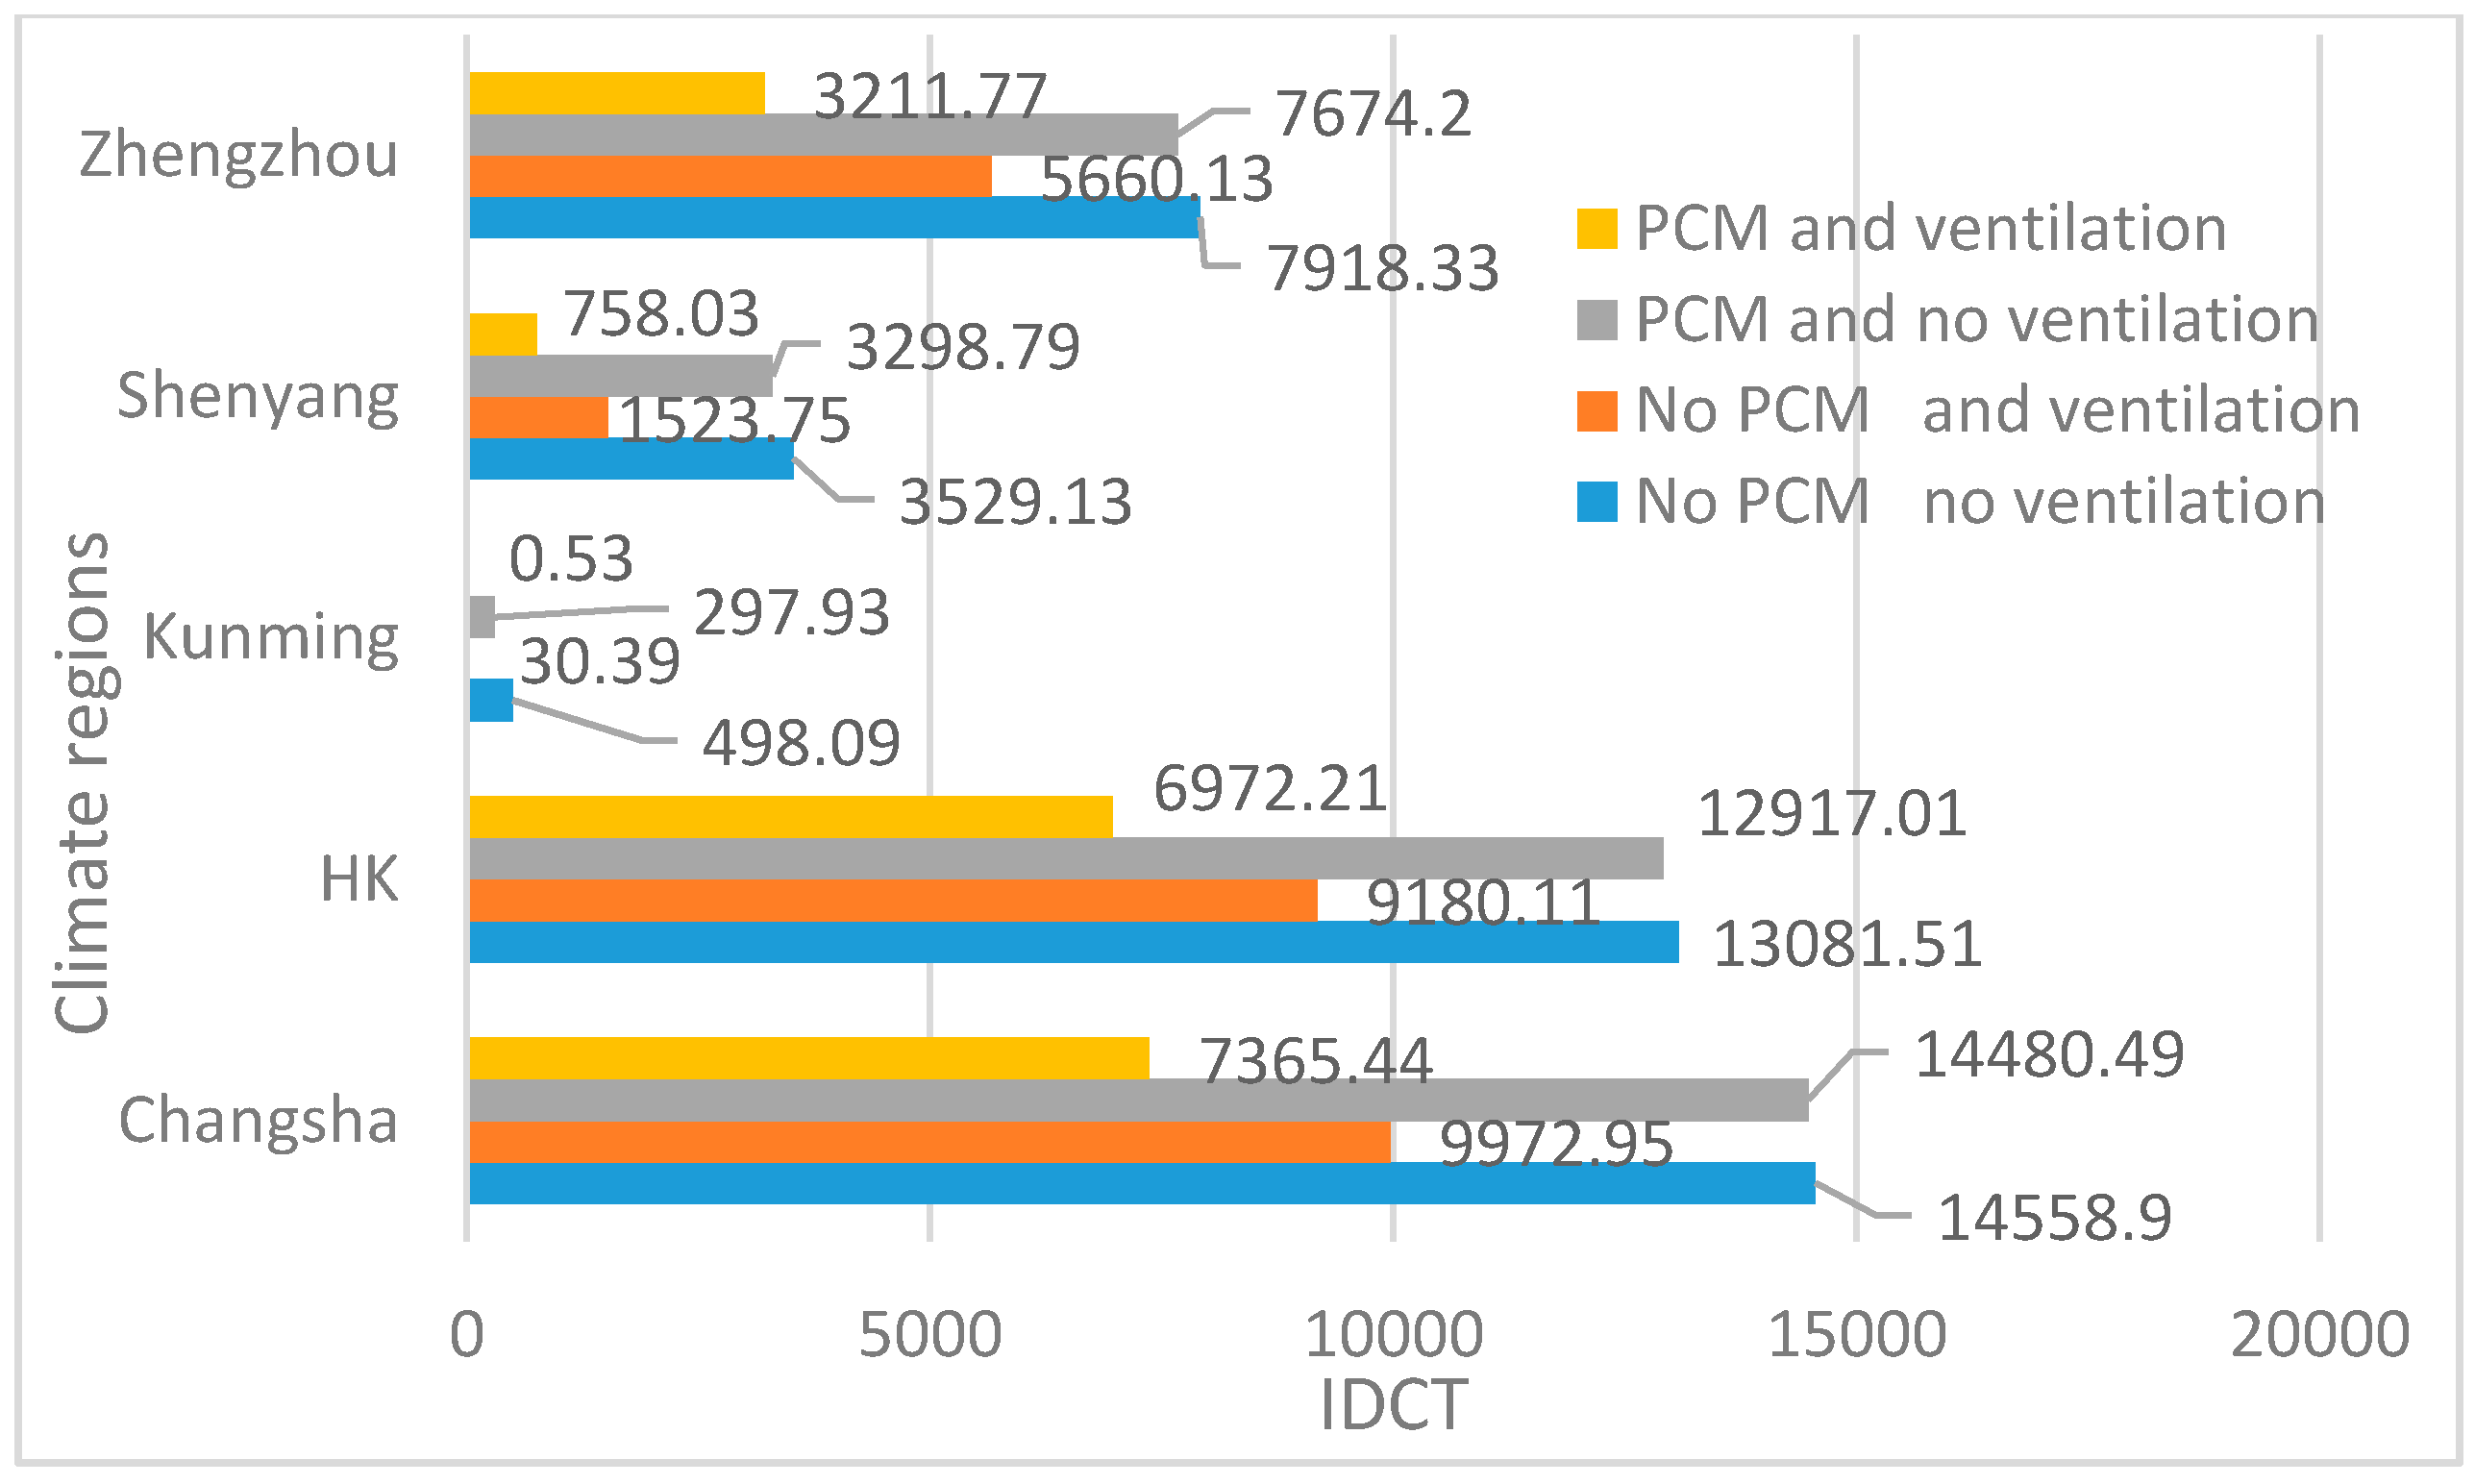
3.3.2. The Influence of Ventilation Quantity on Energy Consumption of Building with PCM

Figure 8 shows the effect of ventilation quantity on energy consumption in different cities. Like the indoor temperature results, the cooling energy consumption decreased with increasing quantity of ventilation, which means that the ventilation quantity also played a significant role in reducing the cooling energy consumption. In general, the greater the ventilation quantity provided, the greater the effect of PCM on energy savings. However, the effect of ventilation quantity on energy consumption became insignificant when more than 2 ac/h of ventilation was provided. It is clear that higher ventilation quantity can save more cooling energy consumption, however excessive mechanical ventilation also consumes a large amount of energy, so the cooling energy consumption, ventilation energy consumption and the total energy spent under different ventilation quantities in summer (from June 1 to September 30) were analyzed, and by taking economic consideration into account, the optimal amount of ventilation quantity for building models in different cities located at various climate regions were determined.
It can be seen from Figure 8 that the optimal amounts of ventilation quantity observed for different climate regions were different. The optimal ventilation quantity for Changsha was 2 ac/h with 773.01 kWh summer energy consumption and the reason is mainly due to the high environmental temperature and small temperature difference between day and night times in summer, consequently the PCM required more ventilation to complete the phase change cycle in Changsha. The summer climate of Zhengzhou and Shenyang was milder, so the PCM required less ventilation to complete the phase change cycle and the optimal ventilation quantity in Zhengzhou and Shenyang was 1 ac/h with 340.95 kWh and 0.5 ac/h with 152.28 kWh summer energy consumption, respectively.

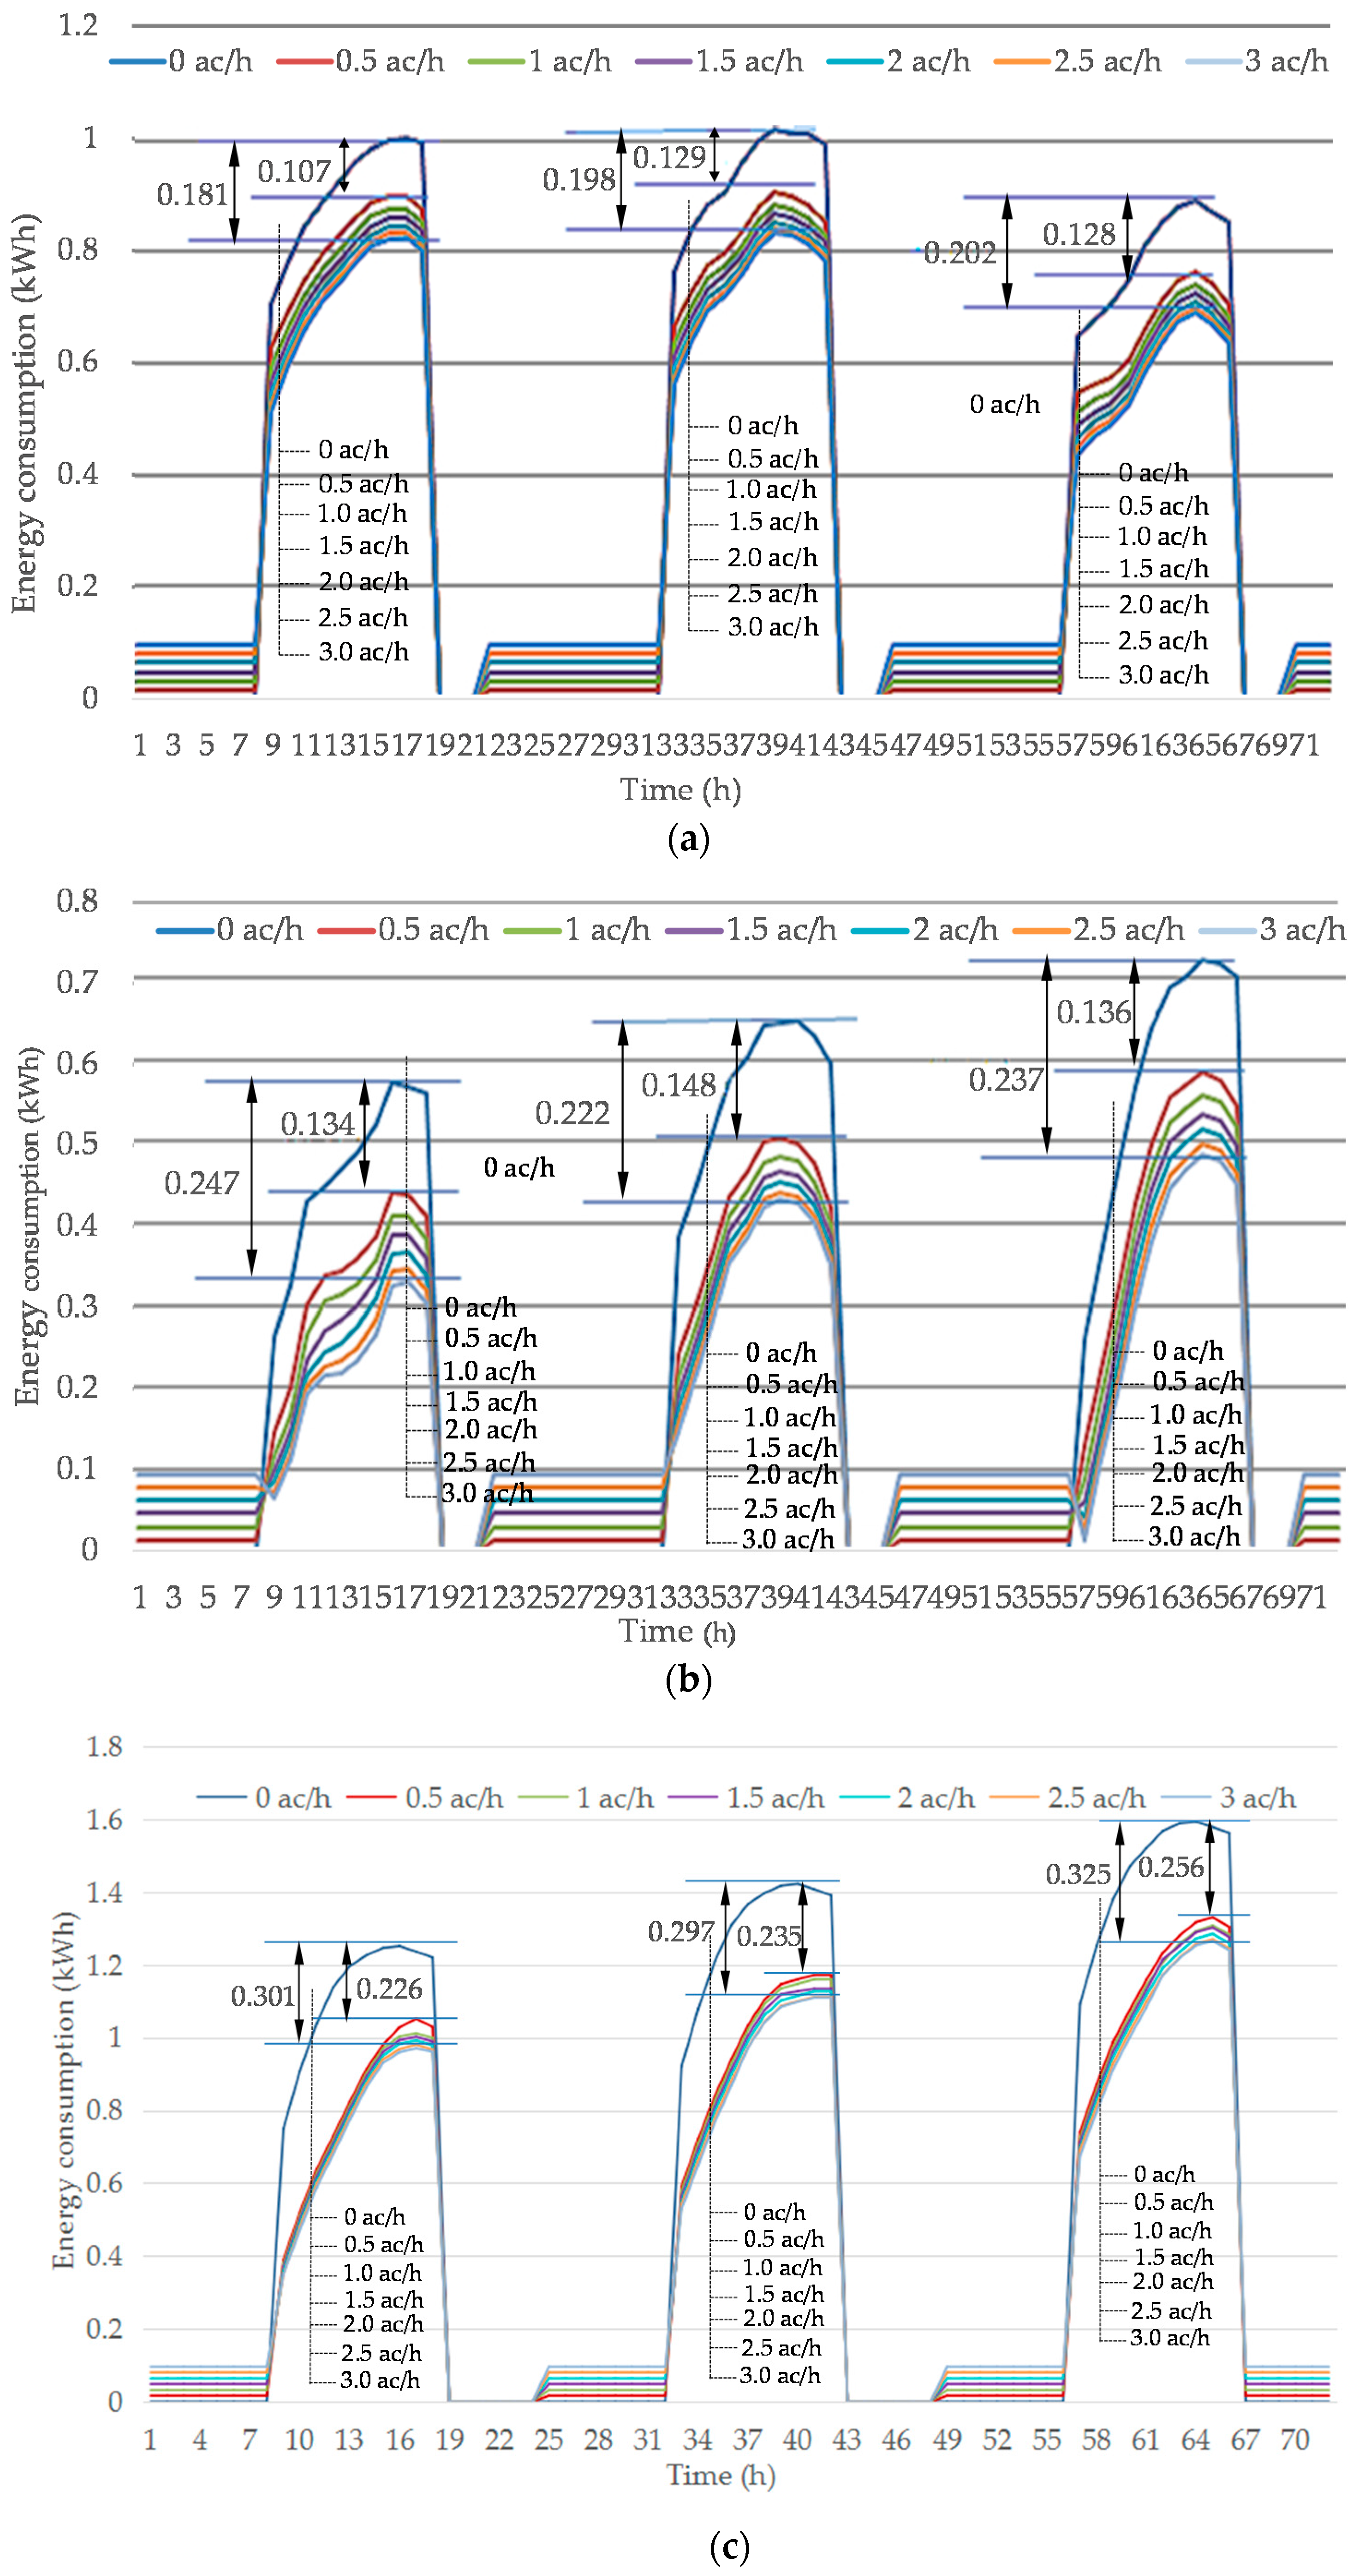
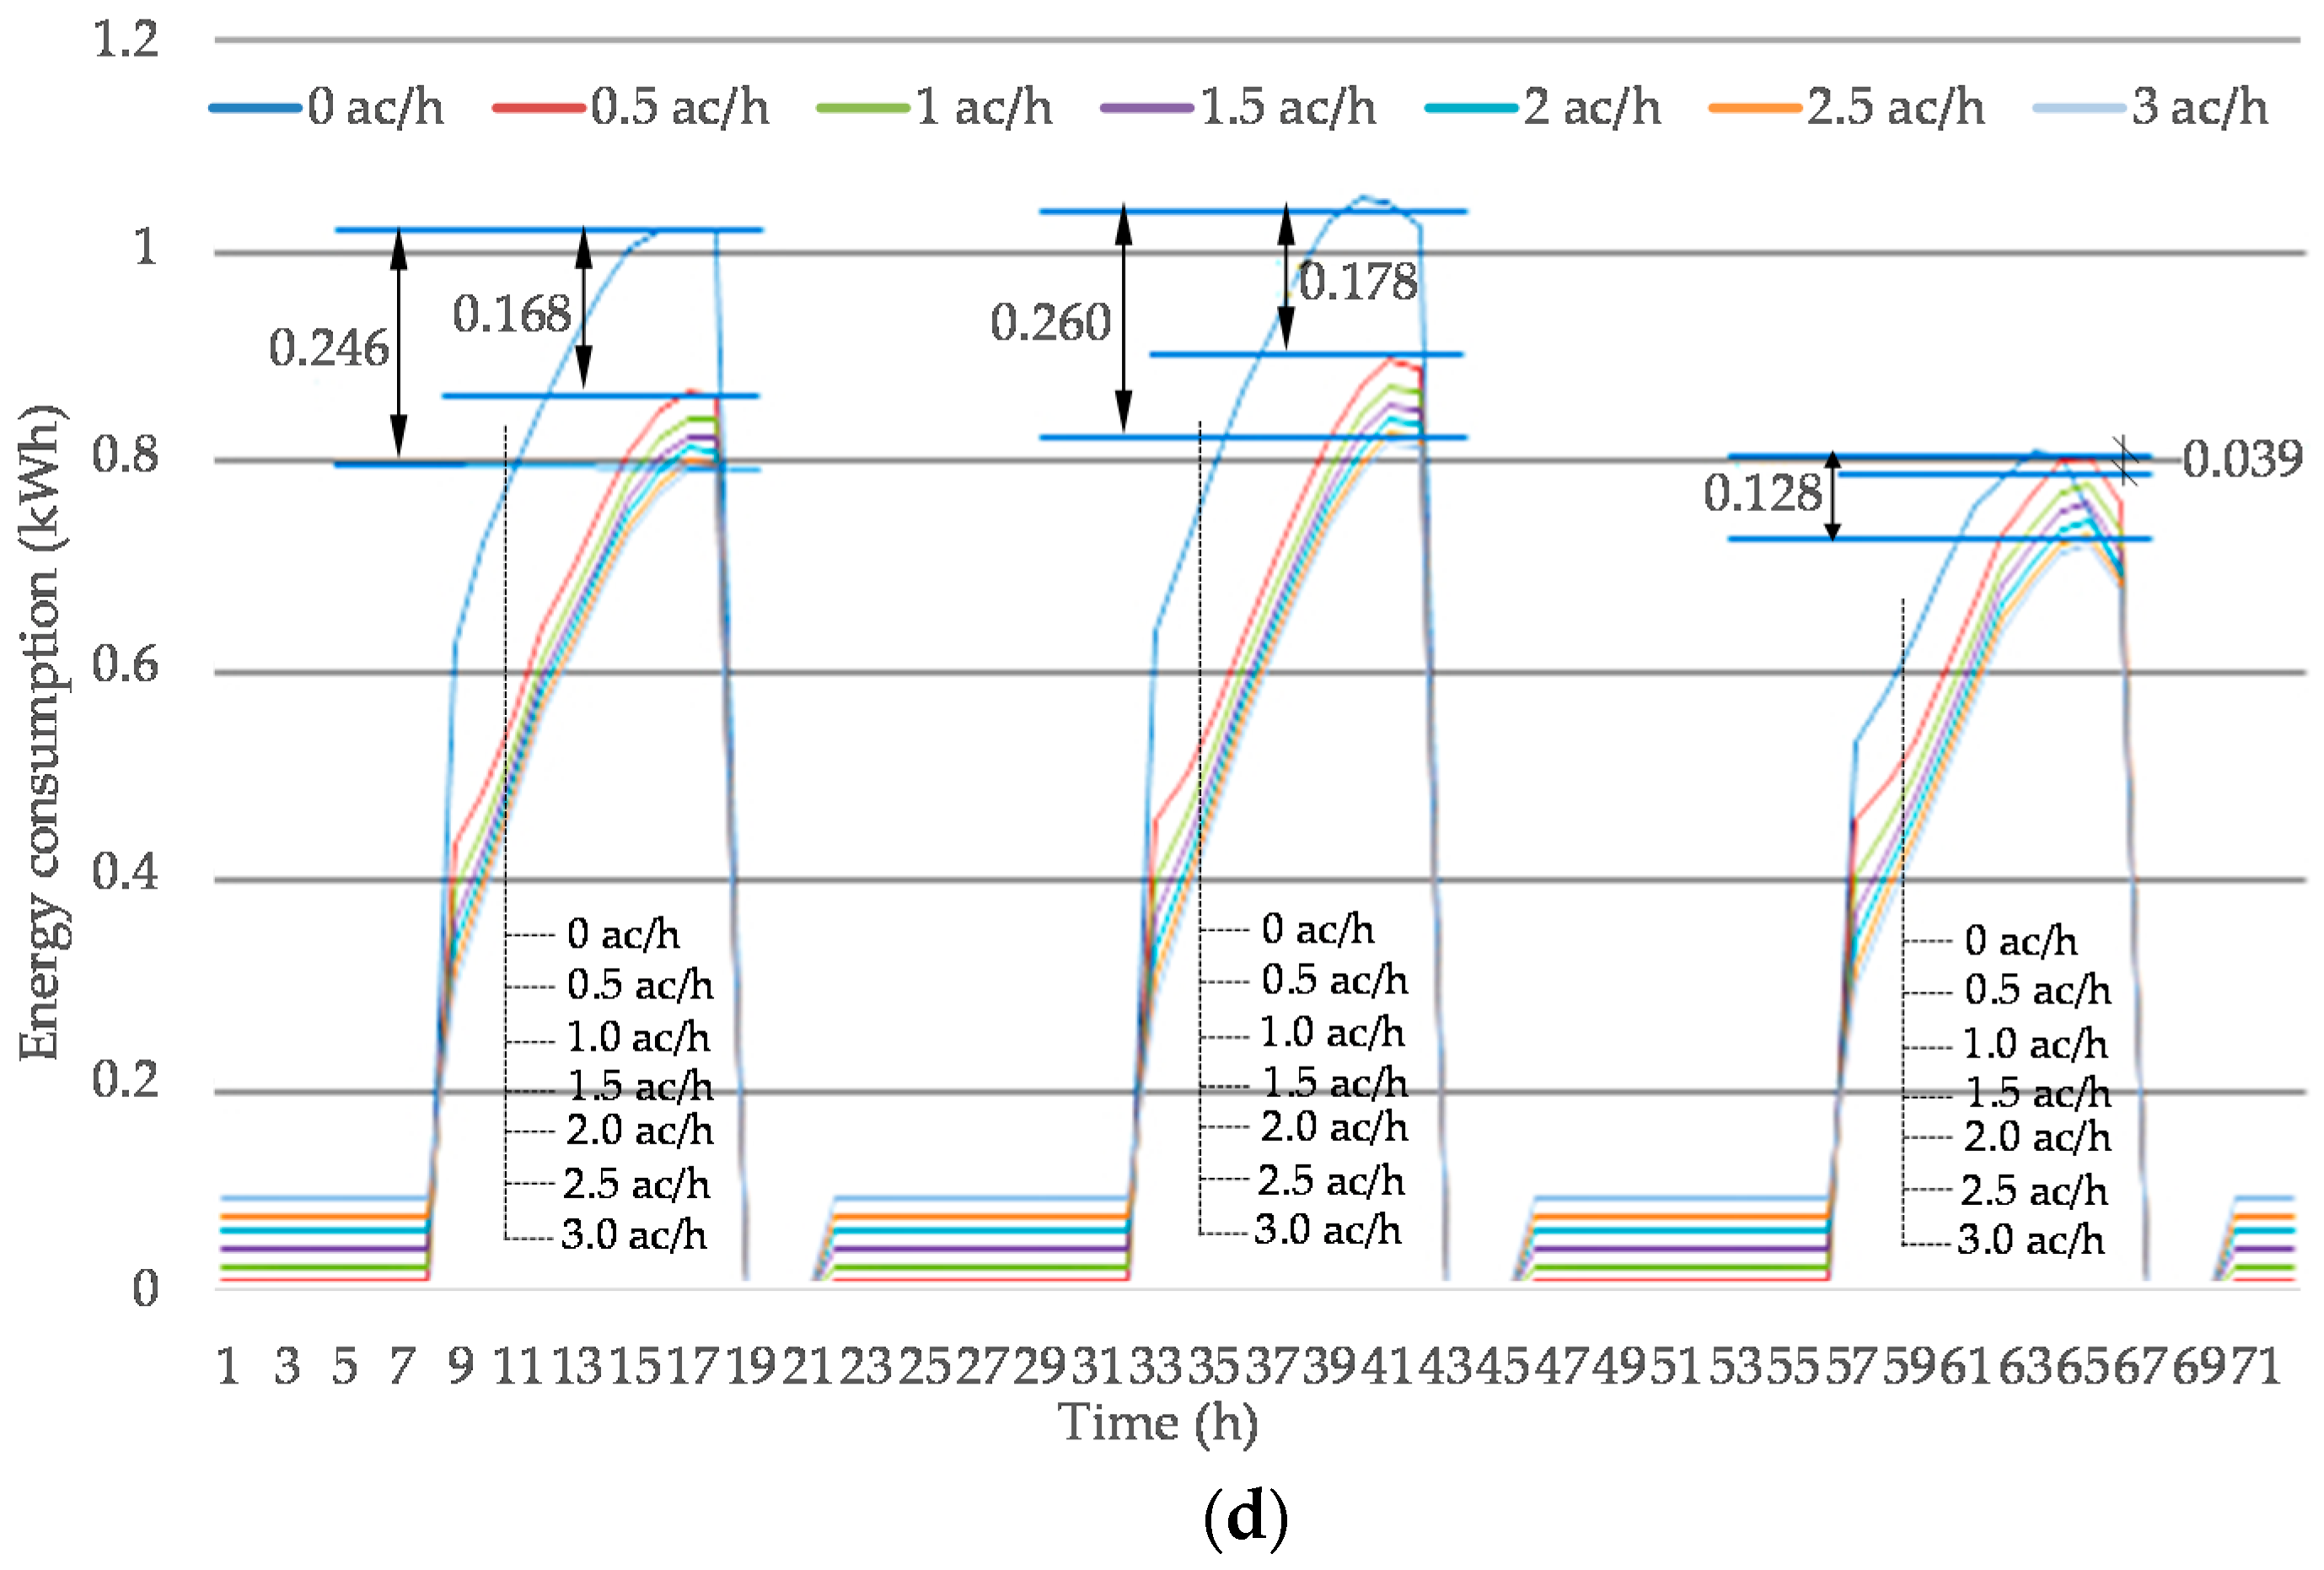
3.3.3. Influence of Ventilation Quantity on Shifting Peak Energy Consumption of Building with PCM

In China, the energy price is not constant and increases with the amount of energy consumption during the day, in other words, the more energy consumed, the higher price would be. Moreover, the energy is charged based on the time of day of using electricity. Lower rates are available during off-peak hours and higher rates are charged during peak hours for the energy market. In this paper, the ventilation improvement on PCM energy saving performance was analyzed. Instead of comparing the total energy consumption, the reduced peak energy in summer was determined in this study. Due to the higher rates are charged during peak hours, it is of high economic and environmental benefits to reduce building peak energy consumption in peak seasons.
As shown in Figure 9, the energy consumption observed for building models with PCM and night ventilation slightly increased at night during Aug 1 and Aug 3 in four regions, but the energy consumption significantly decreased during the day, especially during the peak hours. It is believed that the PCM played a significant role in reducing the energy load by shifting it from peak to off-peak hours, thus reducing the AC energy consumption during the daytime, and in particular the AC operating times during peak periods were reduced. The results of this study shows that the influence of ventilation quantity on energy saving of building with PCM was more pronounced in Changsha. The provision of 0.5 ac/h and 3 ac/h amount of ventilation could reduce 0.256 kWh and 0.325 kWh peak energy consumption, respectively.

4. Conclusions and Recommendation

The present research showed that the thermal inertia of building envelopes increased substantially with the use of a PCM and a reasonable amount of mechanical ventilation as the indoor cumulative heat could be effectively released. It is believed that the simultaneous use of a PCM and ventilation can significantly improve the indoor thermal comfort in summer. Based on the simulation results, it was suggested that cities like Kunming where the summer indoor thermal environment was relatively mild, the indoor thermal comfort of buildings could be maintained with appropriate use of natural ventilation instead of using PCM and mechanical ventilation.
The results also showed that the thermal performance and energy saving efficiency of buildings utilizing a PCM could be improved when ventilation was in place, however, the effect was affected by different ventilation periods. Compared the results with ventilation during the daytime, the use of ventilation at night was more effective to improve the indoor thermal environment and reduced the cooling energy consumption for building with PCM. The optimal ventilation period was found between 0:00 and 9:00 for buildings in most climate regions.
In general, the greater the amount of ventilation quantity provided, the greater the improvement of PCM on the indoor thermal comfort, but the effect of ventilation quantity on energy consumption became insignificant when more than 2 ac/h of ventilation was provided. Considering the economic benefits, different optimal ventilation quantities in different climate regions were suggested. The optimal ventilation quantity suggested for the buildings in Changsha, Shenyang and Zhengzhou were 2 ac/h, 1 ac/h and 0.5 ac/h, respectively. In future studies, researchers need to start investigating actual buildings to accurately estimate the impacts of PCM.

Acknowledgments

The work described in this paper was fully supported by grants from Natural Science Fund of China (51678367), Natural Science Fund of China (51372155) and Australian Research Council Discovery Project (No.: G1500225).

Author Contributions

Yi Zhang did the simulations, data analysis and wrote part of this paper. Hongzhi Cui provided the original idea and wrote part of this paper. Waiching Tang wrote part of this paper. Guochen Sang did the data analysis and wrote part of this paper. Hong Wu did the data analysis.

Conflicts of Interest

The authors declare no conflict of interest.

References

  1. Homod, R.Z.; Sahari, K.S.M.; Almurib, H.A.F.; Nagi, F.H. Rlf and ts fuzzy model identification of indoor thermal comfort based on pmv/ppd. Build. Environ. 2012, 49, 141–153. [Google Scholar] [CrossRef]
  2. Kumar, A.; Suman, B.M. Experimental evaluation of insulation materials for walls and roofs and their impact on indoor thermal comfort under composite climate. Build. Environ. 2013, 59, 635–643. [Google Scholar] [CrossRef]
  3. Ye, Y.Y.; Xu, P.; Mao, J.C. Energy performance of external versus internal shading devices in residential buildings. Appl. Mech. Mater. 2014, 672, 546–549. [Google Scholar] [CrossRef]
  4. Pérez-Lombard, L.; Ortiz, J.; Pout, C. A review on buildings energy consumption information. Energy Build. 2008, 40, 394–398. [Google Scholar] [CrossRef]
  5. Jiang, S.; Guo, J.; Yang, C.; Ding, Z.; Tian, L. Analysis of the relative price in china’s energy market for reducing the emissions from consumption. Energies 2017, 10, 656. [Google Scholar] [CrossRef]
  6. Wei, W.; He, L.-Y. China building energy consumption: Definitions and measures from an operational perspective. Energies 2017, 10, 582. [Google Scholar] [CrossRef]
  7. De Paola, M.; Arcuri, N.; Calabrò, V.; De Simone, M. Thermal and stability investigation of phase change material dispersions for thermal energy storage by t-history and optical methods. Energies 2017, 10, 354. [Google Scholar] [CrossRef]
  8. Soares, N.; Costa, J.J.; Gaspar, A.R.; Santos, P. Review of passive pcm latent heat thermal energy storage systems towards buildings’ energy efficiency. Energy Build. 2013, 59, 82–103. [Google Scholar] [CrossRef]
  9. Cabeza, L.F.; Castellón, C.; Nogués, M.; Medrano, M.; Leppers, R.; Zubillaga, O. Use of microencapsulated pcm in concrete walls for energy savings. Energy Build. 2007, 39, 113–119. [Google Scholar] [CrossRef]
  10. Sharma, A.; Tyagi, V.V.; Chen, C.R.; Buddhi, D. Review on thermal energy storage with phase change materials and applications. Renew. Sustain. Energy Rev. 2009, 13, 318–345. [Google Scholar] [CrossRef]
  11. Cui, H.; Tang, W.; Qin, Q.; Xing, F.; Liao, W.; Wen, H. Development of structural-functional integrated energy storage concrete with innovative macro-encapsulated pcm by hollow steel ball. Appl. Energy 2017, 185, 107–118. [Google Scholar] [CrossRef]
  12. Memon, S.A. Phase change materials integrated in building walls: A state of the art review. Renew. Sustain. Energy Rev. 2014, 31, 870–906. [Google Scholar] [CrossRef]
  13. Alam, M.; Jamil, H.; Sanjayan, J.; Wilson, J. Energy saving potential of phase change materials in major australian cities. Energy Build. 2014, 78, 192–201. [Google Scholar] [CrossRef]
  14. Mazzeo, D.; Oliveti, G.; Arcuri, N. A method for thermal dimensioning and for energy behavior evaluation of a building envelope pcm layer by using the characteristic days. Energies 2017, 10, 659. [Google Scholar] [CrossRef]
  15. Regin, A.F.; Solanki, S.C.; Saini, J.S. An analysis of a packed bed latent heat thermal energy storage system using pcm capsules: Numerical investigation. Renew. Energy 2009, 34, 1765–1773. [Google Scholar] [CrossRef]
  16. Lo Brano, V.; Ciulla, G.; Piacentino, A.; Cardona, F. On the efficacy of pcm to shave peak temperature of crystalline photovoltaic panels: An fdm model and field validation. Energies 2013, 6, 6188–6210. [Google Scholar] [CrossRef] [Green Version]
  17. Wortman, D.N.; Christensen, C.B. Variable-base degree-day correction factors for energy savings calculations. In Proceedings of the ASHRAE Winter Meeting, Chicago, IL, USA, 27–30 January 1985; pp. 253–260. [Google Scholar]
  18. Tabares-Velasco, P.C.; Christensen, C.; Bianchi, M. Verification and validation of energyplus phase change material model for opaque wall assemblies. Build. Environ. 2012, 54, 186–196. [Google Scholar] [CrossRef]
  19. Meiss, A.; Padilla-Marcos, M.; Feijó-Muñoz, J. Methodology applied to the evaluation of natural ventilation in residential building retrofits: A case study. Energies 2017, 10, 456. [Google Scholar] [CrossRef]
  20. Park, J.; Choi, J.-I.; Rhee, G. Enhanced single-sided ventilation with overhang in buildings. Energies 2016, 9, 122. [Google Scholar] [CrossRef]
  21. Wang, P.; Li, D.; Huang, Y.; Zheng, X.; Wang, Y.; Peng, Z.; Ding, Y. Numerical study of solidification in a plate heat exchange device with a zigzag configuration containing multiple phase-change-materials. Energies 2016, 9, 394. [Google Scholar] [CrossRef]
  22. Qingyan, C.; Van, D.K.J. Accuracy―a program for combined problems of energy analysis, indoor airflow, and air quality. Ashrae Trans. 1988, 94, 196–214. [Google Scholar]
  23. Cui, H.; Memon, S.A.; Liu, R. Development, mechanical properties and numerical simulation of macro encapsulated thermal energy storage concrete. Energy Build. 2015, 96, 162–174. [Google Scholar] [CrossRef]
  24. Mi, X.; Liu, R.; Cui, H.; Memon, S.A.; Xing, F.; Lo, Y. Energy and economic analysis of building integrated with pcm in different cities of china. Appl. Energy 2016, 175, 324–336. [Google Scholar] [CrossRef]
  25. Shi, X.; Memon, S.A.; Tang, W.; Cui, H.; Xing, F. Experimental assessment of position of macro encapsulated phase change material in concrete walls on indoor temperatures and humidity levels. Energy Build. 2014, 71, 80–87. [Google Scholar] [CrossRef]
  26. Memon, S.A.; Cui, H.Z.; Zhang, H.; Xing, F. Utilization of macro encapsulated phase change materials for the development of thermal energy storage and structural lightweight aggregate concrete. Appl. Energy 2015, 139, 43–55. [Google Scholar] [CrossRef]
  27. Bonakdar, F.; Dodoo, A.; Gustavsson, L. Cost-optimum analysis of building fabric renovation in a swedish multi-story residential building. Energy Build. 2014, 84, 662–673. [Google Scholar] [CrossRef]
  28. China Academy of Building Research. Thermal Design Code for Civil Building (gb 50176–1993); MOC: Beijing, China, 1993. (In Chinese) [Google Scholar]
  29. EnergyPlus Weather Data. Available online: http://apps1.Eere.Energy.Gov/buildings/energyplus/cfm/weather_data3.Cfm (accessed on 30 October 2016).
  30. Chan, M.Y.; Burnett, J.; Chow, W.K. Energy use for ventilation systems in underground car parks. Build. Environ. 1998, 33, 303–314. [Google Scholar] [CrossRef]
  31. Lin, K.; Zhang, Y.; Jiang, Y. Simulation and designing of pcm wallboard rooms combined with night ventilation. Acta Energiae Sol. Sin. 2003, 24, 145–151. [Google Scholar]
Figure 1. Ventilation models, (a) Natural ventilation by wind pressure; (b) Natural ventilation by thermal pressure; (c) Mechanical ventilation [18].
Energies 10 01214 g001
Figure 2. Room model (a) Externally bond with concrete wall (Type I); (b) Laminated within concrete wall (Type II) and (c) Internally bonded with concrete wall (Type III).
Energies 10 01214 g002
Figure 3. Building model.
Energies 10 01214 g003
Figure 4. Different climate regions in China.
Energies 10 01214 g004
Figure 5. Indoor temperature fluctuations of building models, (a) Zhengzhou; (b) Kunming; (c) Shenyang; (d) Changsha; (e) Hong Kong (Ventilating 1 ac/h from 8:00 to 18:00).
Energies 10 01214 g005aEnergies 10 01214 g005b
Figure 6. Summer IDCT of building models with different PCM and ventilation (Ventilating 1 ac/h from 8:00 to 18:00).
Energies 10 01214 g006
Figure 7. The relationship of IDCT and the change of ventilation quantities with the above-mentioned good ventilation periods (0:00~9:00)
Energies 10 01214 g007
Figure 8. Summer energy consumption in different ventilation quantity.
Energies 10 01214 g008
Figure 9. Hourly energy consumption in different ventilation quantity with the above-mentioned good ventilation periods (0:00~9:00) during 3 days, (a) Hong Kong; (b) Shenyang; (c) Changsha; (d) Zhengzhou.
Energies 10 01214 g009aEnergies 10 01214 g009b
Table 1. Detail construction of the building and thermal properties of building materials.
Building ElementsConstruction (Outside to Inside)U-Heat Transfer Coefficient 10−3 kW/(m2·K)
Roof10 mm Plastering,
40 mm Reinforced concrete,
100 mm XPS, 10 mm Plastering
0.25
PCM wall
(south wall and east wall)
10 mm Plastering, 79.5 mm XPS,
100 mm reinforced concrete,
10 mm PCM, 10 mm Plastering
0.348
Wall
(east wall and north wall)
10 mm Plastering, 79.5 mm XPS,
100 mm Reinforced concrete,
10 mm Plastering
0.35
Floor10 mm Plastering,
40 mm Reinforced concrete,
100 mm XPS, 10 mm Plastering
0.25
Table 2. Temperature characteristics for China in five different climate regions [28].
Climate RegionsMean Temperature in
Coldest MonthHottest Month
Severe Cold≤−10 °C/
Cold−10 °C–0 °C/
Hot Summer & Cold Winter0 °C–10 °C25 °C–30 °C
Hot Summer & Warm Winter>10 °C25 °C–29 °C
Mild (Temperate)0 °C–13 °C18 °C–25 °C
Table 3. Test cases along with different PCM, ventilation quantities and ventilation periods.
ItemsCase 1Case 2Case 3Case 4Case 13Case 14Case 15Case 16Case 17Case 18
10 mm PCMnonoyesyesyes
Ventilationnoyesnoyesyes
Ventilation quantities (ac/h)10.511.522.53
Ventilation periods8:00~18:000:00~9:00
Table 4. Test cases with different PCM, ventilation quantities and ventilation periods.
ItemsCase 5Case 6Case 7Case 8Case 9Case 10Case 11Case 12
10 mm PCMyes
ventilationyes
Ventilation quantities (ac/h)1
Ventilation periods0:00~3:003:00~6:006:00~9:009:00~12:0012:00~15:0015:00~18:0018:00~21:0021:00~24:00
Table 5. Building heat gains in different cities.
SourcesEquipmentPeopleSolar Radiation
ChangshaHong KongKunmingShenyangZhengzhou
Q—heat gain ( kW )1258.621090.221771.822309.322073.641507.391483.06
q—heat gain per hour (kW/h)0.1440.1240.2020.2640.2370.1720.169
Table 6. Balance-point temperature in different cities.
ChangshaHong KongKunmingShenyangZhengzhou
Original value (°C)28.00028.00028.00028.00028.000
Modified value (°C)27.19127.08427.13027.24227.248
Table 7. IDCT of building models with PCM in different ventilation periods during summer.
Ventilation PeriodsCase 5Case 6Case 7Case 8Case 9Case 10Case 11Case 12
0:00–3:003:00–6:006:00–9:009:00–12:0012:00–15:0015:00–18:0018:00–21:0021:00–24:00
Climate regionsHong Kong10350.310388.710390.610421.610423.610410.310439.810428.8
Kunming0.700.60.60.40.30.00.70.6
Shenyang1577.41577.91601.11654.31717.01746.41715.31632.1
Changsha11972.911910.911998.612115.212163.012143.612049.212056.0
Zhengzhou5186.55174.45186.95332.45424.55444.55398.45205.6
Note: The underline number is minimum data in the line.
Table 8. Summer cooling energy consumption of building models with PCM in different ventilation periods.
Ventilation PeriodsCase 5 (kW h)Case 6 (kW h)Case 7 (kW h)Case 8 (kW h)Case 9 (kW h)Case 10 (kW h)Case 11 (kW h)Case 12 (kW h)
0:00–3:003:00–6:006:00–9:009:00–12:0012:00–15:0015:00–18:0018:00–21:0021:00–24:00
Climate regionsHK672.67678.57673.48669.83673.33681.84676.01675.89
Kunming0.090.080.070.060.040.010.090.09
Shenyang132.56133.09134.55135.74141.41144.51145.35136.67
Changsha788.06789.81790.00790.24795.47796.78803.66793.07
Zhengzhou359.16357.42361.61362.60370.48372.92374.58358.39
Note: The underline number is minimum data in the line.

