Article

An Investigation into the Effect of Scour on the Loading and Deformation Responses of Monopile Foundations

1
Department of Civil Engineering, National Cheng Kung University, Tainan 701, Taiwan
2
Department of Hydraulic and Ocean Engineering, National Cheng Kung University, Tainan 701, Taiwan
*
Author to whom correspondence should be addressed.
Energies 2017, 10(8), 1190; https://doi.org/10.3390/en10081190
Submission received: 10 June 2017 / Revised: 3 August 2017 / Accepted: 4 August 2017 / Published: 11 August 2017
(This article belongs to the Special Issue Wind Turbine Loads and Wind Plant Performance)

Abstract

:
Severe foundation scour may occur around monopile foundations of offshore wind turbines due to currents and waves. The so-called p-y curves method is suggested in the existing design recommendations to determine the behavior of monopiles unprotected against scour and the reduction of effective soil stress is accounted for by the extreme scour depth. This conservative design approach does not consider the geometry of the scour hole and the effect of pile diameter on the soil resistance. An underestimated foundation stiffness would be obtained, thereby influencing the predicted overall response of the support structure of an offshore wind turbine. In this study, we calculated the load-deformation response and foundation stiffness of a monopile when scour occurred. The influence of pile diameter on the initial modulus of subgrade reaction, and the modification of the ultimate soil resistance of a monopile subject to scour are evaluated. The commercial software BLADED was used to simulate the dynamic response of the reference offshore wind turbine with monopile unprotected against scour at Chang-Bin offshore wind farm in Taiwan Strait. The results showed that when the p-y curve suggested by existing design regulation was used to calculate the load-deformation response, the foundation stiffness was underestimated where the scour depth was greater than the pile diameter, but the foundation stiffness was overestimated when the scour depth was less than the pile diameter.

1. Introduction

A monopile is a steel pipe pile with a diameter D of approximately 4–8 m and an embedded pile length L of approximately 30–50 m. A monopile has a simple geometric shape, can be easily constructed, and is therefore commonly used in commercial offshore wind farms [1]. The ratio of embedded pile length L to diameter D for the support structure of the monopile is between 4 and 8 [2], and monopile design is controlled by the lateral loading and moment. In ultimate limit states (ULS), lateral bearing capacity must be verified to ensure stability of monopile. In a serviceability limit state (SLS), the permanent inclination of the monopile foundation should be limited. During a dynamic analysis, the natural frequency of the support structure must be within an allowable turbine operating range. Arany et al. [3] proposed a simple procedure for the basic conceptual design of a monopile: they assessed foundation stiffness and determined the initial size of a monopile through calculation of pile deformation. However, scour is not considered in the design conditions.
Methods for calculating the load-displacement response of soil-structure interactions include an elastic theory method [4], a p-y curve method, and a finite element method [5]. The p-y curve method is the most common method used in the engineering practice; it has been recommended by the American Petroleum Institute (API) [6] and Det Norske Veritas and Germanischer Lloyd (DNV-GL) [7]. The p-y curves were obtained through field tests on piles with diameter D less than 2 m. If a p-y curve is applied to calculate the foundation deformation of a monopile (D > 4 m), pile deformation may be underestimated [8]. To analyze the deformation of monopile foundations, numerous researchers proposed methods involving modified p-y curves [9,10,11,12].
When the foundation of a monopile with a diameter greater than 4 m experiences waves and currents, a horseshoe vortex can occur at the mudline around the monopole, resulting in foundation scour [13,14,15,16]. According to DNV [17] and DNV-GL [7], for the foundation of a monopile, scour depth may reach approximately 1 to 1.5 times as large as pile diameter. If a monopile foundation design is unprotected against scour, scour will decrease the embedded pile length, increase the foundation lateral deformation [18,19], reduce the foundation stiffness, and increase the natural frequency of the support structure [20,21,22].
Typical p-y curves constructed according to the results of field tests do not consider the geometric shapes of scour holes caused by local scour. When scour occurs around the pile foundation, the entire layer of soil above the bottom of scour hole will be ignored, then soil resistance will be underestimated and pile foundation design will be extremely conservative. Recently, several methods have considered the effect of scour with modified p-y curves [23,24,25]. However, no relevant studies have conducted dynamic analysis of the support structure of offshore turbine.
Seasonal typhoons erode mountain river soils and form alluvia on the western seabed of Taiwan; in addition, because of the current effect, severe foundation scour occurs in marine environments. The Taiwan Power Company installed a meteorological mast and undertook water depth measurements around pile foundations. The results showed that with scour protection, differences in terrain elevation around a pile reached 1.3 m, which was approximately 0.34 times as large as the pile diameter [26]. Therefore, foundation scour must be considered when designing an offshore wind farm in Taiwan; accordingly, the foundation stiffness of an offshore turbine in its lifetime can meet the requirements of its original design to ensure the safe operation of wind turbines.

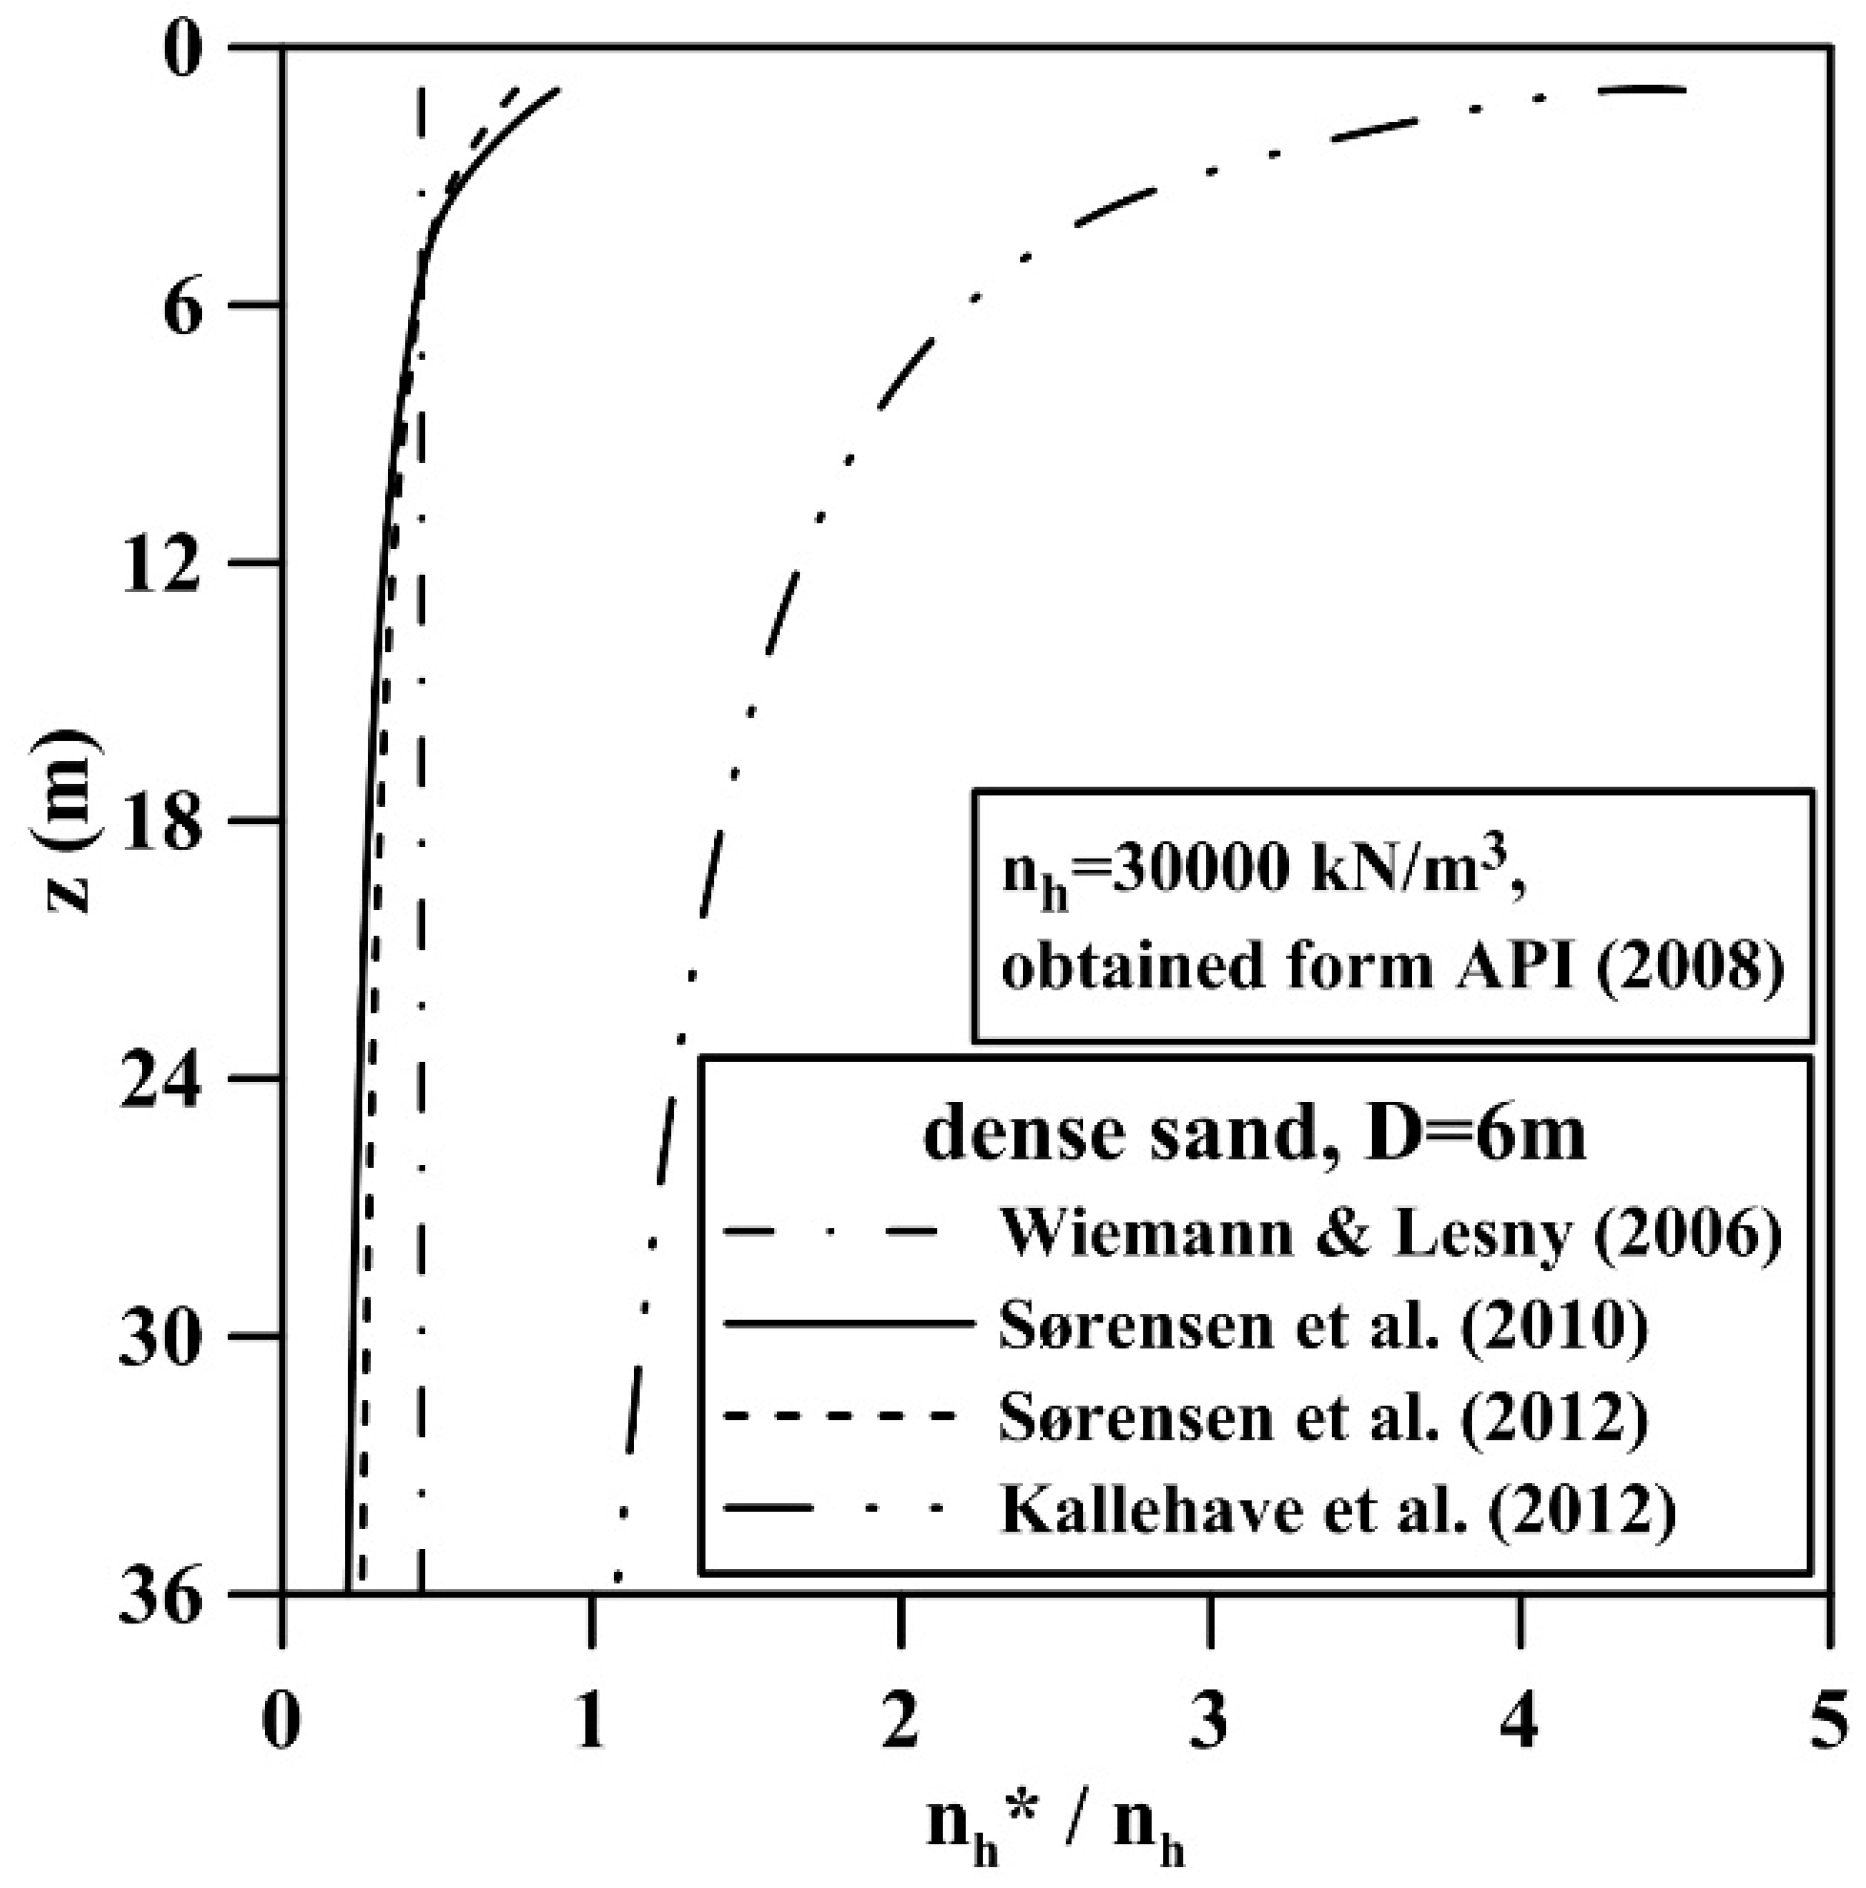
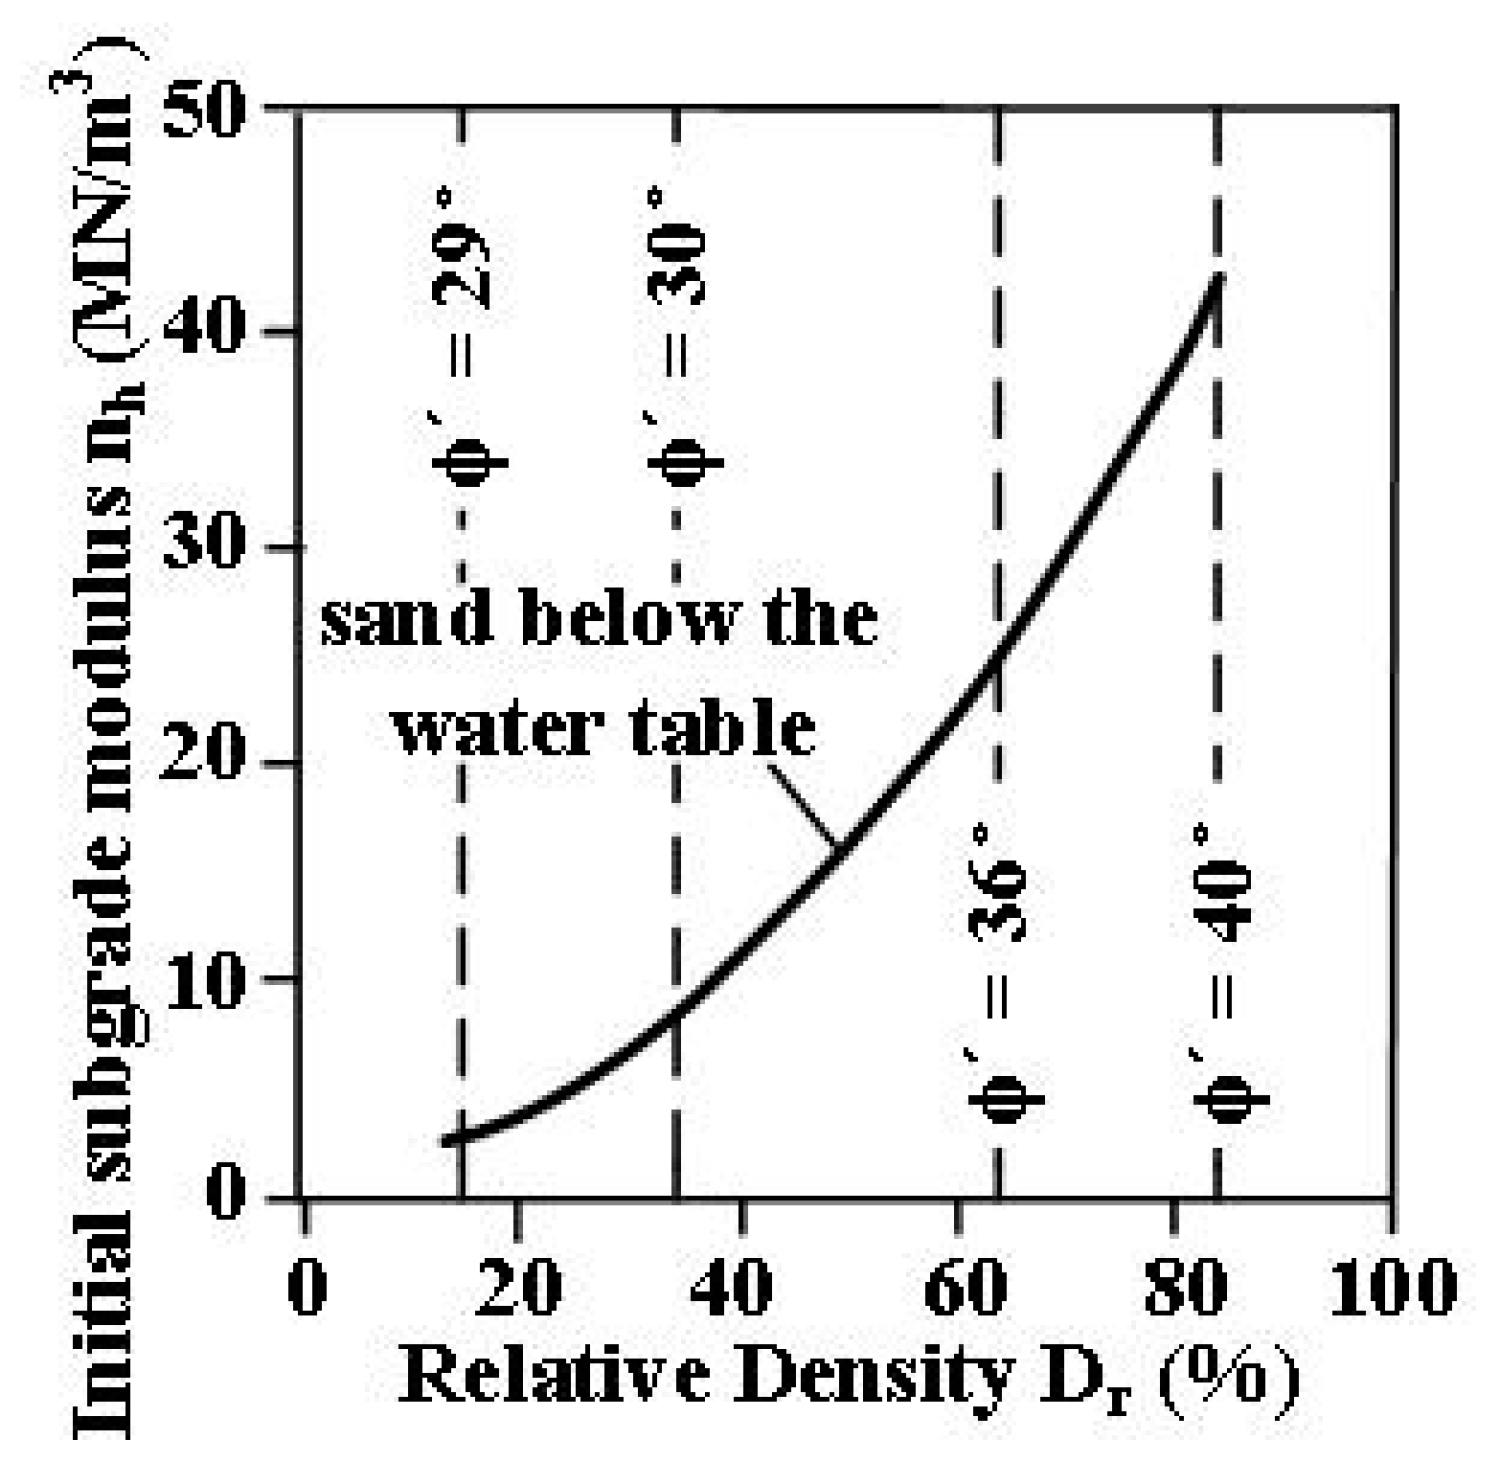
2. The Influence of Pile Diameter on the Initial Stiffness of the p-y Curve

The p-y curve method assumes that the pile is considered as an elastic beam supported by a series of nonlinear springs; the soil resistance per length p and horizontal pile deflection y forms a p-y curve. Regarding the p-y curve for a foundation pile embedded in cohesionless soil, API [6] suggested using Equation (1) to construct the p-y curve for depth z:
p   =   A   ×   p u   ×   tanh [ n h   ×   z A   ×   p u   ×   y ] ,
For the pile encounter cyclic loading, the value of A equals 0.9. The ultimate soil resistance p u can be determined by Equation (2) or (3), and the smaller of both values is to be considered:
p s t   =   γ z [ K 0 z tan ϕ sin β tan ( β     ϕ ) cos α   +   tan β tan ( β     ϕ ) ( D   +   z tan β tan α )   +   K 0 z tan β ( tan ϕ sin β   tan α )   K a D ] ,
p s d   = K a D γ z ( tan 8 β 1 )   +   K 0 D γ z tan ϕ tan 4 β
The initial stiffness of p-y curve E p y can be obtained by calculating the differential of Equation (1); it has a linear relationship with depth z (refer to Equation (4)):
E p y   =   p ( y = 0 )   = n h z
where ϕ denotes the effective friction angle of soil (°); γ denotes the effective unit weight ( kN / m 3 ); D denotes pile diameter (m); α   =   ϕ / 2 ; β = 45 °   +   ϕ / 2 ; K 0 denotes the coefficient of lateral earth pressure at rest; K a denotes the coefficient of the active lateral earth pressure; n h denotes the initial modulus of subgrade reaction ( kN / m 3 ). The initial modulus of subgrade reaction is given as a function of soil conditions and not dependent of pile diameter and depth. According to API [27], the relationship of relative density and initial modulus of subgrade reaction can be graphed, as shown in Figure 1.
Assume that the elastic modulus of cohesionless soil increases linearly with depth z . Wiemann and Lesny [9] considered that the initial modulus of subgrade reaction n h of the monopile below the critical pile length L c might be overestimated. Therefore, Equation (5) proposed by Titze [28] can be used to determine the critical pile length of a monopile subject to a lateral force (moment M   =   0 ). In addition, the oedometric modulus of soil at the bottom of the pile E o e d ( z ) can be employed to calculate the initial modulus of subgrade reaction n h (refer to Equation (6)):
L c   =   4 E p I p z E o e d ( z )
n h   =   n h · ( D D r e f ) 4 ( 1     a ) 4   +   a
where the reference diameter D r e f equals 1 m. The adjusted coefficient of pile diameter a is influenced by soil relative density. For medium dense sand, the value of a equals 0.6; for dense sand, the value of a equals 0.5.
Sørensen et al. [10] employed six laboratory tests to verify a numerical model, and calculated pile deformation. Sørensen et al. [10] proposed the modification of p-y curve, the initial stiffness of p-y curve E p y increases nonlinearly with depth. The initial stiffness of the p-y curve for cohesionless soil obtained according to API [6]; Equation (4) will be overestimated when the depth exceeds a specific value. Therefore, Sørensen et al. [10] suggested that an adjusted initial modulus of subgrade reaction n h , which is specified by Equation (7), should be substituted in Equation (4) to modify the initial stiffness of p-y curve E p y :
n h   =   1 z · n h , r e f · ( z z r e f ) b · ( D D r e f ) c · ϕ d
where reference depth z r e f equals 1 m; reference diameter D r e f equals 1 m; the initial modulus of subgrade reaction of the reference p-y curve n h , r e f equals 50,000 kPa; the adjusted coefficient of depth b equals 0.6; the adjusted coefficient of pile diameter c equals 0.5; the adjusted coefficient of effective friction angle d equals 3.6; the unit for the effective friction angle ϕ is radians.
Sørensen [11] proposed Equation (8) to modify the initial modulus of subgrade reaction n h ; Equation (8) includes the adjusted elastic modulus of soil that changes with depth:
n h   =   1 z · n h , r e f · ( z z r e f ) b · ( D D r e f ) c · ( E s E s , r e f ) d
where the reference depth z r e f equals 1 m; reference diameter D r e f equals 1 m; reference elastic modulus of soil E s , r e f equals 1000 kPa; reference initial modulus of subgrade reaction n h , r e f equals 1000 kPa; adjusted coefficient of depth b equals 0.3; adjusted coefficient of pile diameter c equals 0.5; adjusted coefficient of soil elastic modulus d equals 0.8.
Kallehave et al. [12] compared the measured natural frequencies of the support structures of three offshore turbines at the Walney offshore wind farm with the predicted natural frequencies of the support structures; the predicted frequencies were calculated from foundation stiffness values obtained from the p-y curve (Equation (4)). The results showed that the measured values were greater than the predicted values. Therefore, Kallehave et al. [12] considered that using p-y curves based on current design guidelines to calculate load-deformation responses would underestimate soil stiffness; they therefore suggested modifying the initial modulus of subgrade reaction n h (refer to Equation (9)). According to Kallehave et al. [12], the adjusted initial stiffness of p-y curve E p y was higher than the unadjusted initial stiffness of the p-y curve:
n h   =   1 z · n h · z r e f · ( z z r e f ) m · ( D D r e f ) 0.5
In Equation (9), reference depth z r e f equals 2.5 m; reference diameter D r e f = 0.61 m; adjusted coefficient of depth m equals 0.6.
Assume that for a monopile foundation, the diameter of a pile embedded in cohesionless soil D equals 6 m and the effective friction angle ϕ equals 37.5°. According to API [27], the initial modulus of subgrade reaction n h equals 30,000 kN / m 3 . Figure 2 shows modified initial modulus of subgrade reaction suggested by various researchers.
According to Wiemann and Lesny [9], Sørensen et al. [10], Sørensen [11], and Kallehave et al. [12], the initial stiffness of p-y curve E p y for monopile foundation increased with depth. The initial modulus of subgrade reaction n h with the suggestion of Wiemann and Lesny [9], Sørensen et al. [10], and Sørensen [11] showed API [6] overestimated the initial modulus of subgrade reaction. However, the initial modulus of subgrade reaction that calculated with the suggestion of Kallehave et al. [12] showed that API [6] underestimated the initial modulus of subgrade reaction. The reason is that Wiemann and Lesny [9], Sørensen et al. [10], and Sørensen [11] used a pile deformation curve obtained according to a field test or numerical method to correct the initial stiffness of the p-y curve for a monopile foundation. Kallehave et al. [12] modified the initial stiffness of the p-y curve for a monopile foundation that caused the predicted natural frequency of the support structure of an offshore turbine to fit the measured natural frequency of the offshore turbine supporting structure. The p-y curve suggested by API [6] was based on the deformation of a foundation pile in a field test under low-frequency loading conditions (monotonic & cyclic). Therefore, the p-y curve suggested by API [6] was unsuitable for assessing the initial modulus of subgrade reaction for dynamic deformation of monopile.
Achmus et al. [29] used the Hardening Soil Model with Small-Strain Stiffness (HSS)-model implemented in the finite element software PLAXIS [30] to calculate the pile deformations and compared with results from p-y curves according the API [6], Sørensen [11], Kallehave et al. [12]. Achmus et al. [29] calculated the lateral loading required at the pile head when an identical normalized pile head lateral deformation occurred. The results showed that for both SLS and ULS conditions, the lateral loading required at the pile head for the modified p-y curve of Kallehave et al. [12] was greater than the simulated value based on the finite element model. For the modified p-y curve of Sørensen [11], the lateral loading required at the pile head was similar to the simulated value based on the finite element model under both SLS and ULS conditions. For fatigue limit state (FLS) conditions the modified p-y curve of Kallehave et al. [12] will be more appropriate. These differences resulted from various correction methods that had been used to serve various design regulations. DNV [31] suggested that for a shear strain γ of less than 10 3 , static foundation stiffness can be used to analyze the dynamic response of a support structure. Therefore, in this study, according to API’s suggestion [7], a p-y curve for cohesionless soil was established; in addition, to explore the influence of scour on foundation deformation responses, the initial modulus of subgrade reaction for monopile foundation was corrected to fit the suggestion of Sørensen [11].

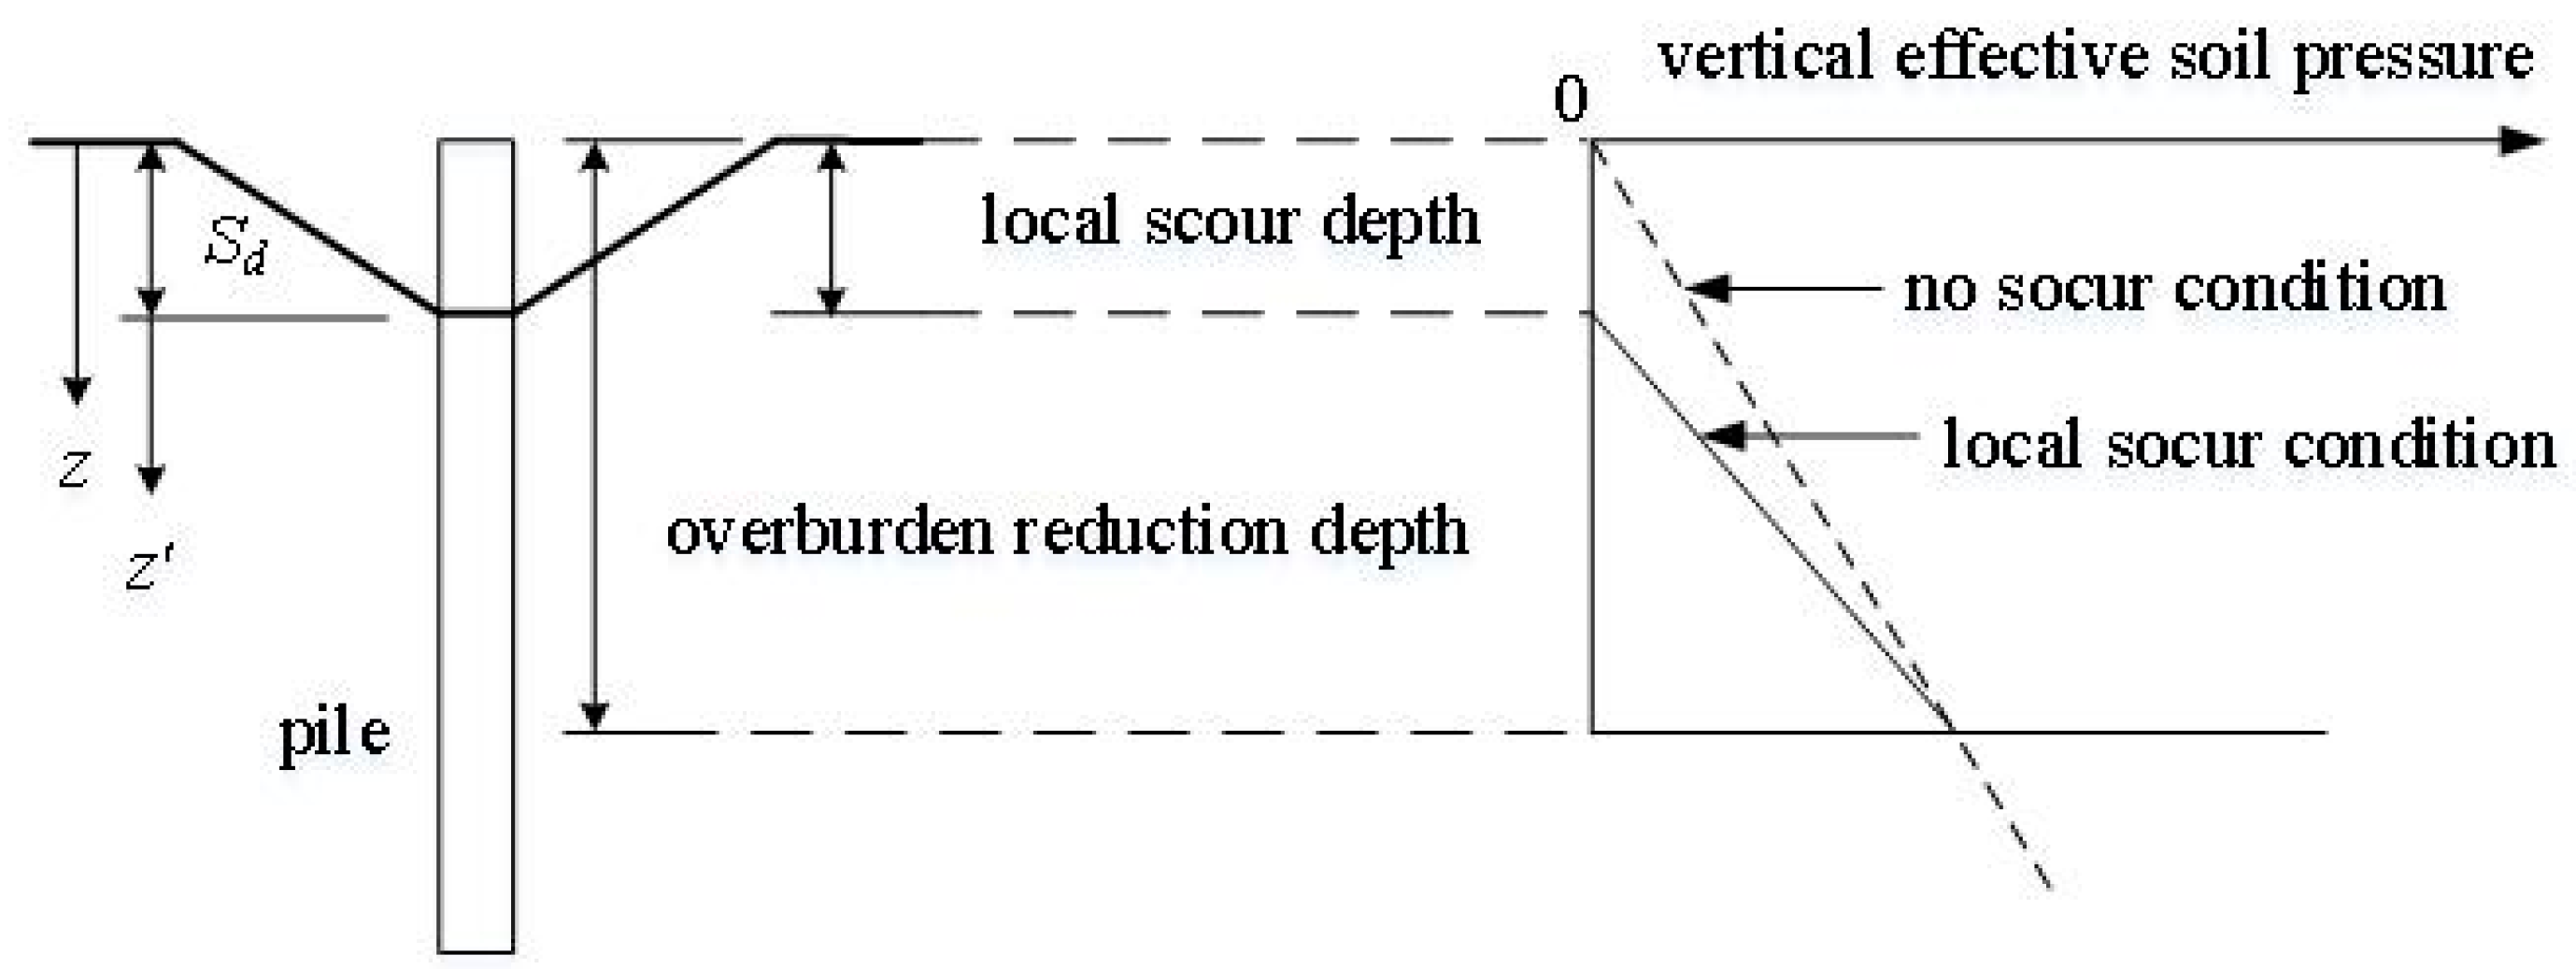
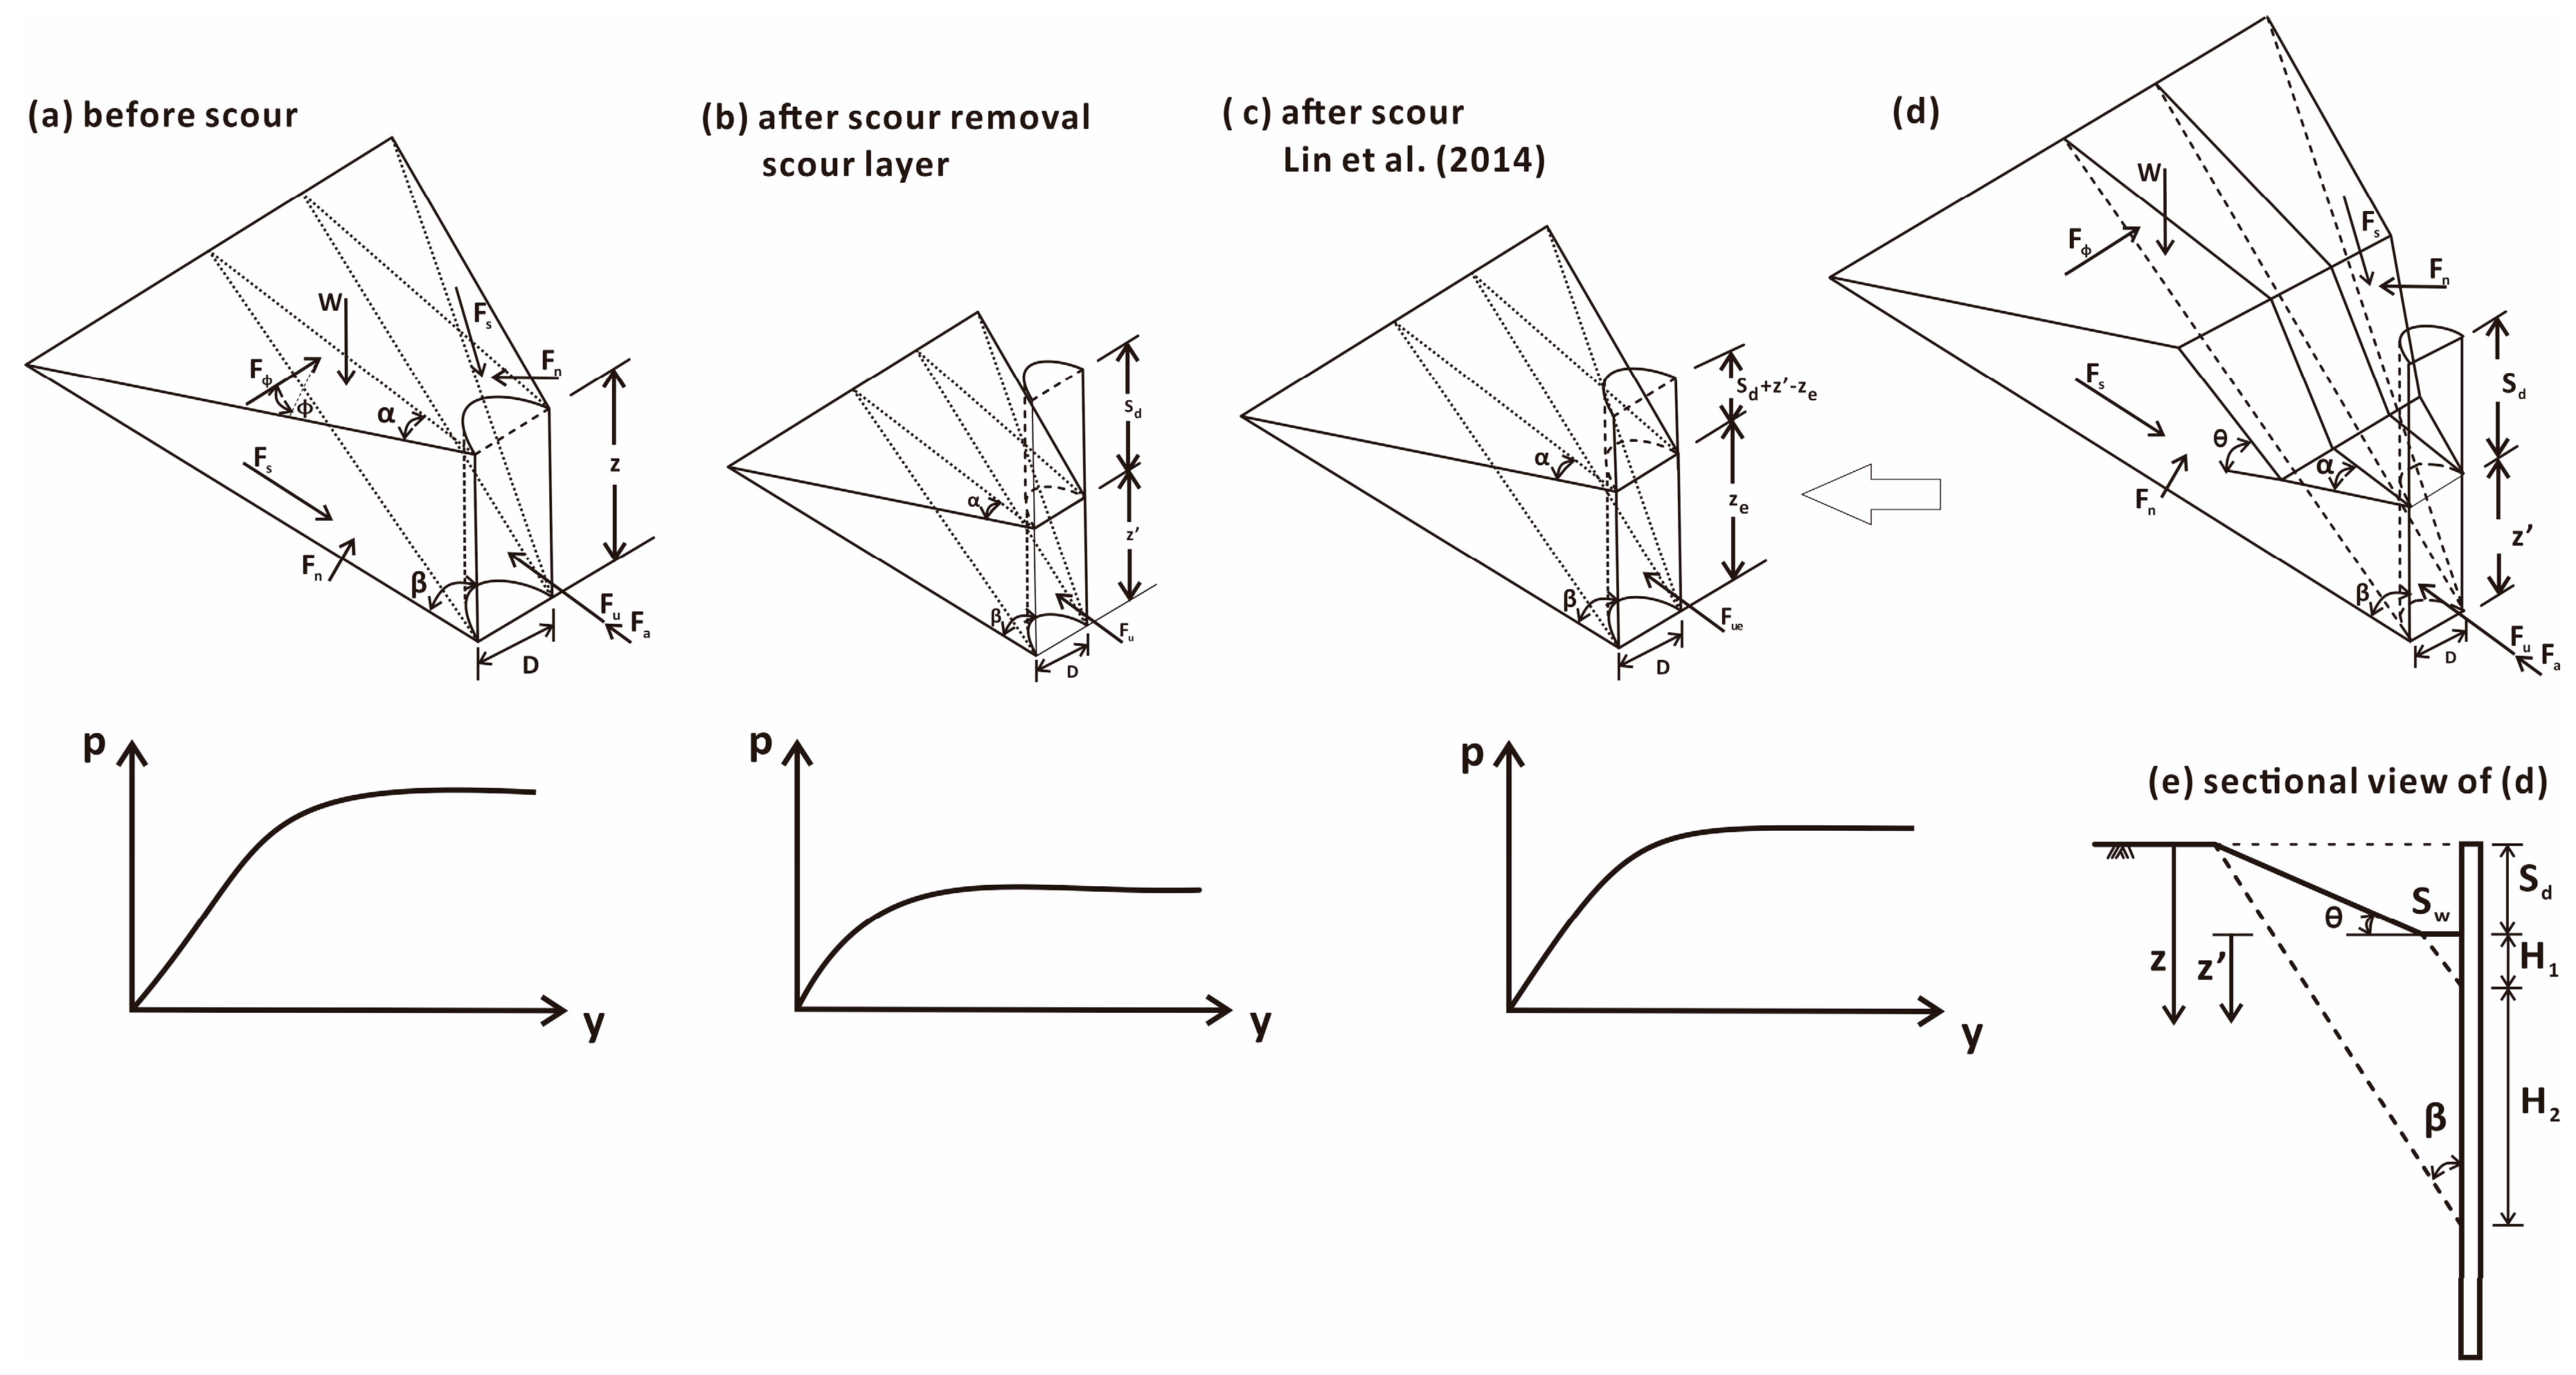
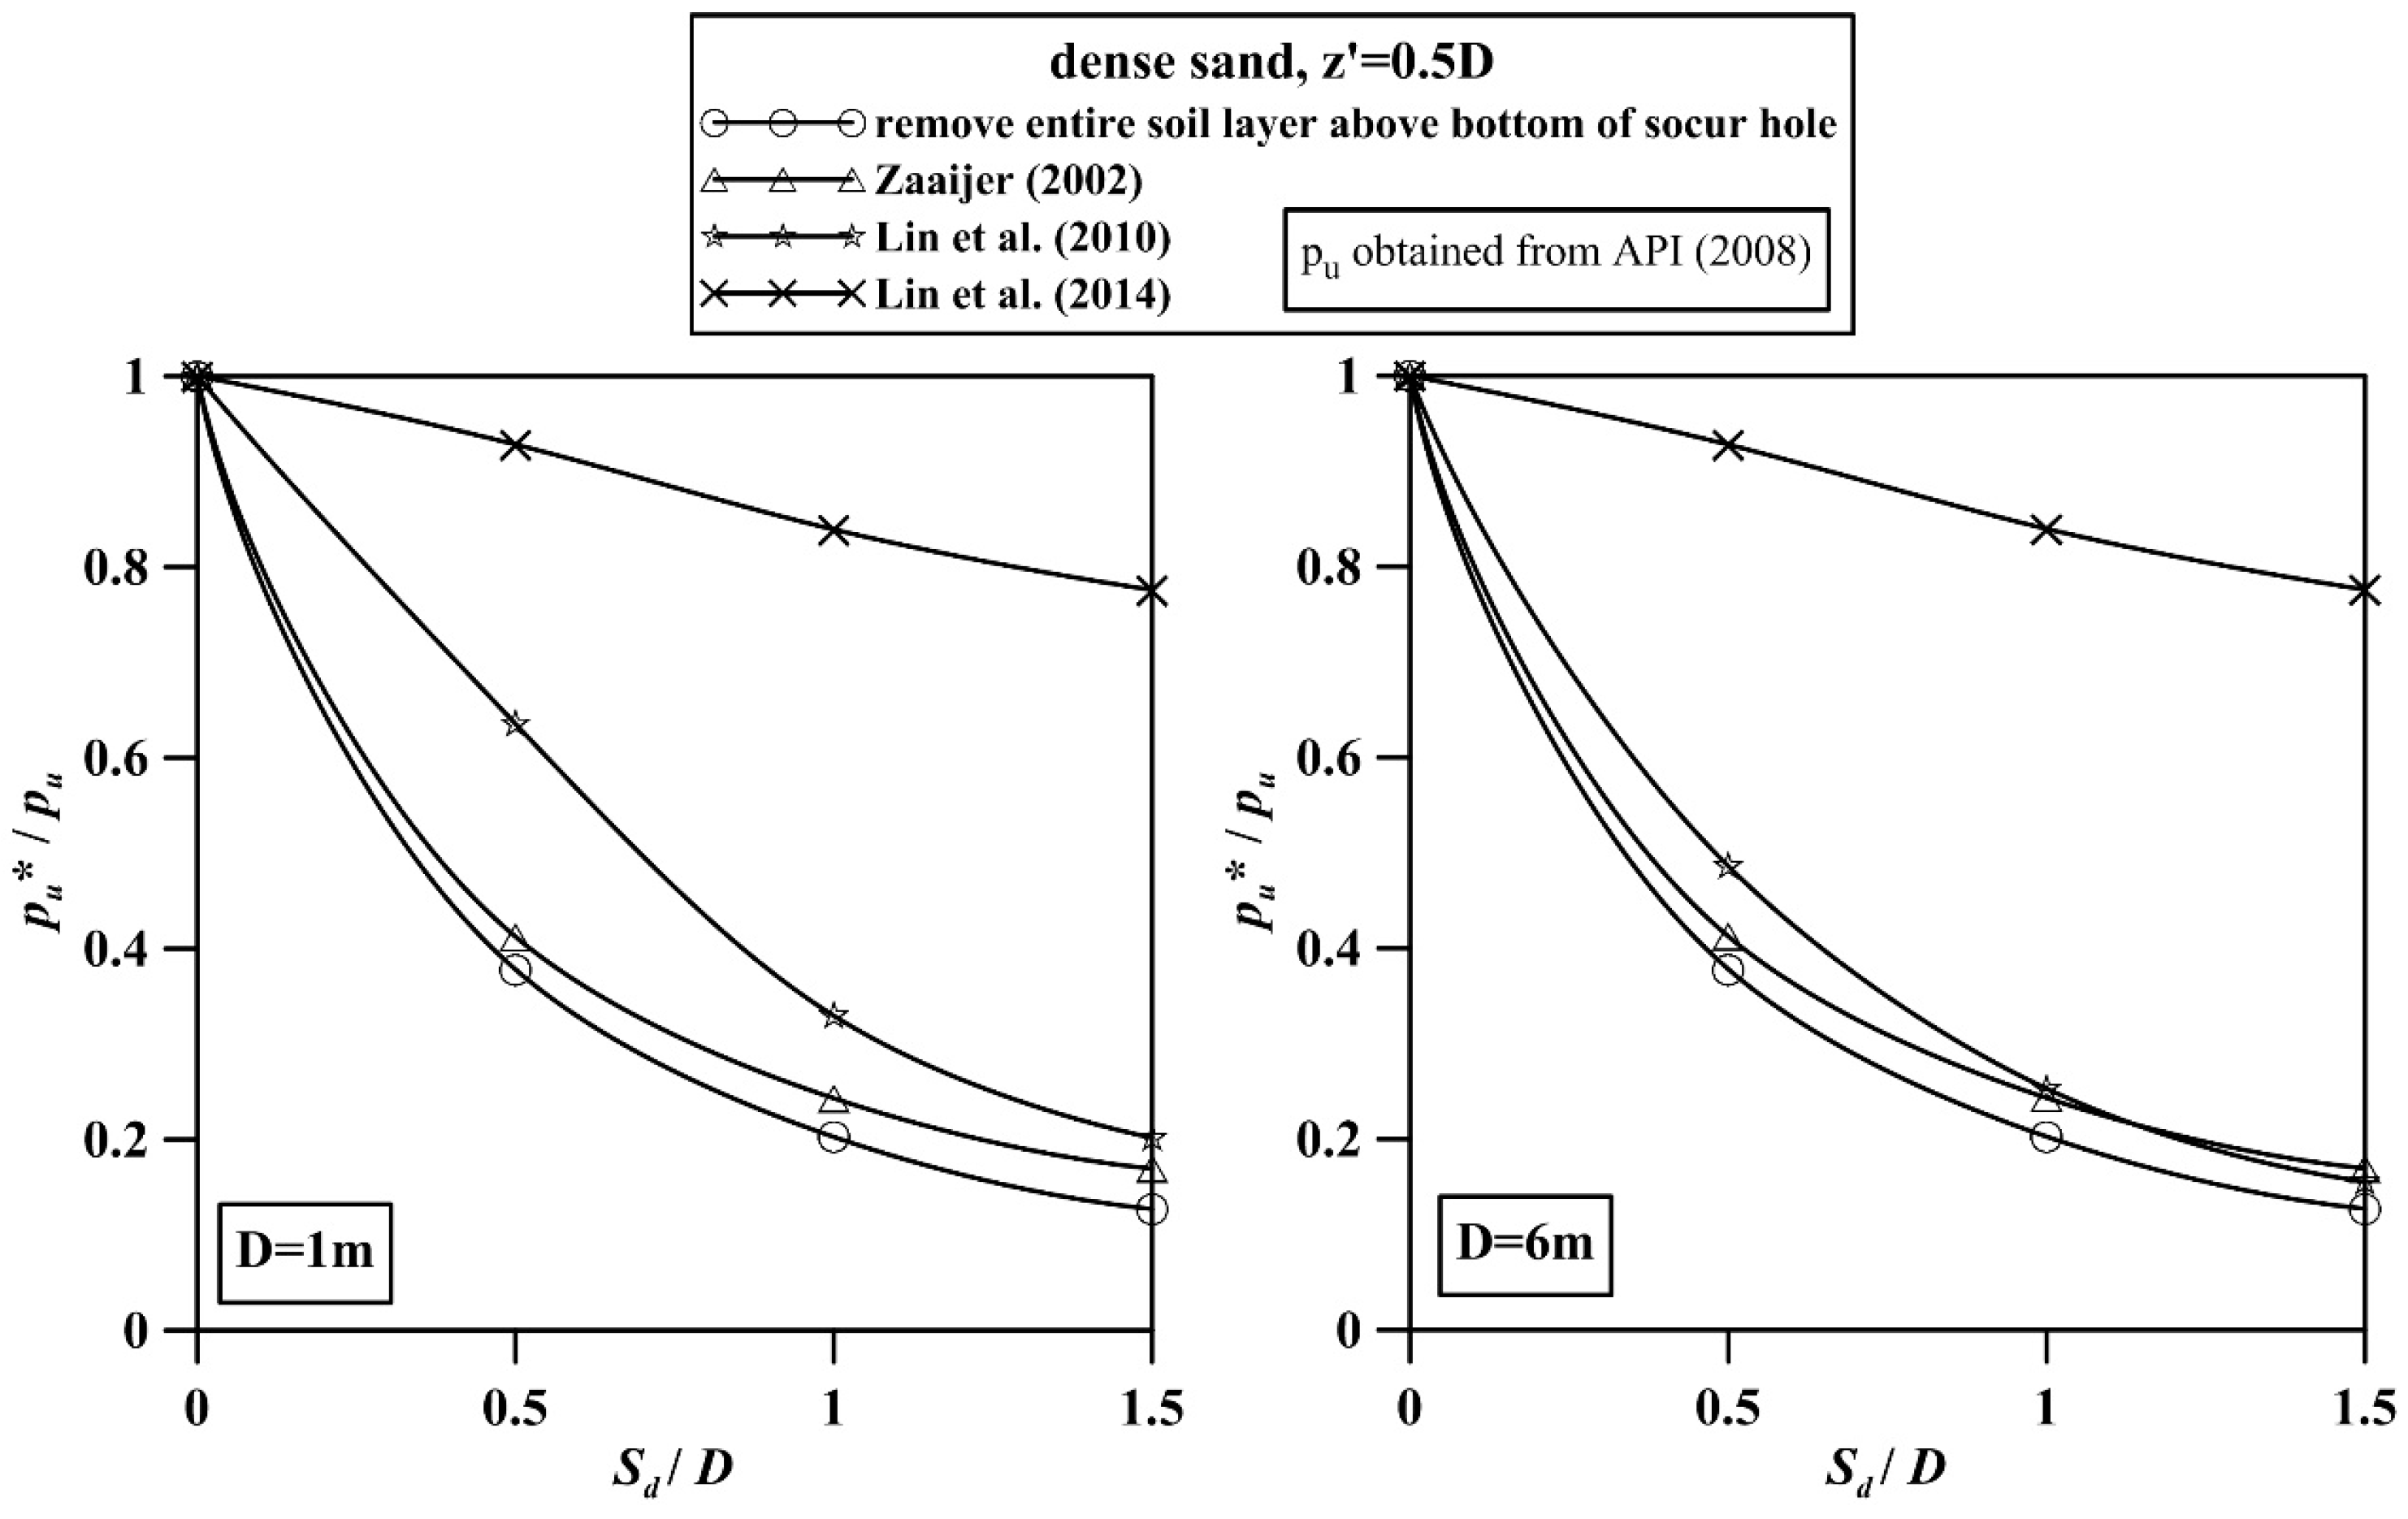
3. The Influence of Scour on Ultimate Soil Resistance

Ultimate soil resistance per length of p-y curves p u can be determined by Equations (2) or (3), and the smaller of both values is to be considered. Equations (2) and (3) are determined by effective friction angle of soil ϕ , effective unit weight of soil γ , and depth z . Currently, several researchers considered that the aforementioned parameters were influenced by scour and therefore proposed some parameter correction methods [23,24,25].
Scour can result in soil loss around a monopile’s foundation, thereby forming a conical local scour hole with a depth of S d (Figure 3). Scour can reduce the embedded pile length of the monopile foundation. API [6] and Zaaijer [23] reported that scour could influence the effective unit weight γ of soil within six times the pile diameter D below the mudline; however, the effective unit weight γ would not be influenced by scour at the depth deeper than six times the pile diameter D . Therefore, the effective unit weight γ s c within the depth range between the bottom of the scour hole ( z   =   S d ) and six times the pile diameter D can be determined from Equation (10):
γ s c   =   6 D 6 D     S d γ
Lin et al. [24] claimed that when soil scour occurred around a monopile, overburden stress around the monopile would change from normally consolidated state to over-consolidated state and the coefficient of lateral earth pressure at rest would increase from K 0 n to K 0 c (Equations (11) and (12)). Scour can change soil stress and influence the void ratio of the sand e , the effective unit weight of sand γ , the relative density of the sand D r , and the effective friction angle of sand ϕ . Equations (13)−(15) show the relationships of various parameters. On the basis of the change of the coefficient of lateral earth pressure at rest, the mean effective stress values before and after scour ( p and p s c ) can be calculated. The void ratio of the sand for scour-induced stress unloading from initial state and Equation (16) can be used to calculate the difference Δ e between the void ratio of the sand before scour and the void ratio of the sand after scour. Through an iterative method, Equations (13)−(15) can be employed to obtain the relative density of the sand D r , s c , the effective friction angle of sand ϕ s c , the effective unit weight of sand γ s c , and the void ratio of the sand e s c after scour. However, the relative density and friction angle of sandy soil will not change significantly due to loading of remove soil during scour. The method proposed by Lin et al. [24] need further verification of field tests:
K 0 n = 1 sin ϕ
K 0 c   =   ( 1     sin ϕ ) O C R sin ϕ
γ   =   ( G s     1 ) γ ω 1   +   e
D r = e m a x e e m a x e m i n
ϕ   =   ϕ c s   +   3 D r ( 10     ln ( p   /   ( 1     2 sin ϕ 3 sin ϕ ) ) )     3
Δ e   =   κ ln ( p s c   /   p )
where κ denotes the unloading index; OCR denotes the over-consolidation ratio; ϕ c s denotes the critical effective friction angle; G s denotes the specific gravity of soil; e m a x denotes the maximum void ratio of the sand; e m i n denotes the minimum void ratio of the sand.
According to Zaaijer [23] and Lin et al. [24], the effective friction angle of sand ϕ s c and the effective unit weight of sand γ s c after scour can be obtained from Equation (10) or Equations (13) and (15); these values can be substituted into Equations (2) and (3) to calculate the ultimate soil resistance per length p u , s c around a pile at a depth of z after scour, then the modified p-y curves considering scour can be obtained.
The p-y curve established according to the aforementioned method did not account for the geometric shape of a scour hole due to local scour. In general engineering practice, when scour occurred around the pile, the local scour hole is assumed simply as the general scour for pile foundation design, the position with a scour depth S d would be adjusted from the original mudline to the new mudline; soil depth is reduced from z to z (Equation (17)). Subsequently, Equation (2) would be used to calculate the ultimate soil resistance per length near the ground surface p s t . In this manner, the soil resistance per length p would be underestimated (refer to Figure 4a,b). Following the method of Reese et al. [32], Lin et al. [25] considered the shape of scour hole in soil wedge and recalculated the ultimate soil resistance per length near the ground surface p s t based on force equilibrium. Accordingly, Lin et al. [25] employed an equivalent soil depth z e to replace z , so the ultimate soil resistance per length near the ground surface p s t reasonably reflected the influence of soil around the scour hole (Figure 4c):
z   =   z     S d
The soil model suggested by Reese et al. [32] considered the shear forces acting on the side plane of the wedge F s , the normal forces acting on the side plane of the wedge F n , the weight of the wedge W , the active earth thrust F a , and the sliding resistance acting on the bottom side of the wedge F ϕ . Force balance was used to obtain the total lateral force per length F u at the pile with a depth of z below the mudline. Various parameters were influenced by the shape of damaged soil wedge at failure (refer to Equation (18)). Figure 4a shows the loading acted on soil wedge which does not consider the shape of scour hole. Equation (19) can be derived by substituting F s , F n , W , and F a in Equation (18):
F u   =   2 F s cos α sin β     2 F n sin α   +   2 F s cos β   +   W tan ( β     ϕ )     F a
F u   =   γ K 0 tan β z 3 3 cos α [ cos α sin β tan ϕ     sin α   +   tan ϕ cos β tan ( β     ϕ ) ]   +   γ z 2 tan ( β     ϕ ) ( D tan β 2   +   z tan 2 β tan α 3 )     K a γ D z 2 2
Lin et al. [25] suggested that after scour occurred, the shape of the scour hole should be included in the shape of the soil wedge at failure (Figure 4d). According to the results of the flume experiments conducted by Roulund et al. [33] and Nielsen and Hansen [34], the slope of the scour hole in cohesionless soil θ was one-third to one-half times as large as the effective friction angle of sand ϕ ; therefore θ is smaller than 90 ° β (Figure 4e). Because the shape of the soil wedge at failure changed according to the depth of the bottom of the scour hole z , the total lateral force per length F u at the pile was recalculated on the basis of the depth z (Table 1). The values of H 1 and H 2 in Table 1 were obtained from Equations (20) and (21):
H 1   =   S w tan β
H 2   =   S w tan β   +   S d D 1
where S w denotes the width of the scour hole bottom, and D 1 denotes the influence of the shape of the scour hole. The value of D 1 can be derived from Equation (22).
D 1   =   tan β tan θ 1     tan β tan θ
When 0 < z H 1 , the shape of the soil wedge at failure is identical to the shape of the soil wedge at failure before scour. Therefore, by replacing depth z in Equation (19) with z , the total lateral force F u 0 exerted on the pile can be obtained (Equation (23)):
F u 0   =   γ K 0 tan β z 3 3 cos α [ cos α sin β tan ϕ     sin α   +   tan ϕ cos β tan ( β     ϕ ) ]   +   γ z 2 tan ( β     ϕ ) ( D tan β 2   + z tan 2 β tan α 3 )     K a γ D z 2 2
When H 1   <   z   H 2 , the shape of the soil wedge at failure changes. By recalculating F s , F n , W , and F a , and substituting them into Equation (18), the total lateral force F u 1 exerted on the foundation pile can be obtained (Equation (24)).
F u1  =  γ K 0 tanβ 3cosα { [ z 3  + 3 D 1 ( z 3    z 2 S w tanβ ) + 2 D 1 2 ( z    S w tanβ ) 3 ] × [ cosαsinβtan ϕ   sinα +  tan ϕ cosβ tan( β   ϕ ) ] } +  1 tan( β  ϕ ) ( γ( 1  tanβtanθ )tanβ 6 { 3D [ z ( 1 +  D 1 )    S w D 1 tanβ ] 2  + 2tanβtanα [ z( 1 + D 1 )   S w D 1 tanβ ] 3 }   + γ S w 2 tan θ 6 ( 3 D   +   2 S w tan α ) ) K a γ Dz 2 2
When z > H 2 , the shape of the soil wedge at failure changes again. By recalculating F s , F n , W , and F a and substituting them into Equation (18), the total lateral force F u 2 exerted on the foundation pile can be obtained (Equation (25)):
F u2  =  γ K 0 3cosα { [ ( z  +  S d ) 3 tanβ  3( S w  +  S d tanθ ) S d 2  + 2 S d 3 tanθ ] × [ cosαsinβtan ϕ   sinα +  tan ϕ cosβ tan( β  ϕ ) ] }+ 1 tan( β  ϕ ) { γ ( z  +   S d ) 2 tanβ 6 [ 3D + 2( z +  S d )tanβtanα ]   γ ( S w tanθ +  S d ) 2 tanθ [ D 2  +  1 3 ( S w  +  S d tanθ )tanα ]  + γ S w 2 tanθ( D 2  +  S w tanα 3 ) }  K a γ D ( z +  S d ) 2    S d 2 2
The total lateral force ( F u 0 , F u 1 , or F u 2 ) that accounts for the shape of the scour hole is identical to the total lateral force ( F u e ) derived from the equivalent depth z e that does not account for the shape of the scour hole (Equation (26)). Equations (23)–(26) can be used to calculate the equivalent depth z e , which is in turn substituted into Equation (2) to modify the ultimate soil resistance per length near the ground surface p s t . By comparing p s t and p s d from Equation (3) and choosing the smaller value, the ultimate soil resistance per length p u at depth z below the bottom of the scour hole considered the shape of the scour hole can be obtained:
F u e   =   γ K 0 tan β z e 3 3 cos α [ cos α sin β tan ϕ     sin α   +   tan ϕ cos β tan   ( β     ϕ ) ]   +   γ z e 2 tan ( β     ϕ ) ( D tan β 2   +   z e tan 2 β tan α 3 )   K a γ D z e 2 2
The methods proposed by Zaaijer [23] and Lin et al. [24,25] to modify the p-y curve reduced the lateral ultimate soil resistance at a specific depth around a pile. Figure 5 shows the lateral ultimate soil resistance at depth of 0.5 D below the bottom of scour hole for a monopile foundation with a diameter of 1 m or 6 m embedded in dense soil with various scour depths S d . As shown in Figure 5, after the scour soil layer was removed entirely, the lateral ultimate soil resistance was the most conservative. According to Zaaijer [23] and Lin et al. [24], only soil parameters were modified; therefore, the lateral ultimate soil resistance obtained was slightly greater than the lateral ultimate soil resistance after the entire scour soil layer was removed. In addition, the lateral ultimate soil resistance around the pile rapidly decreased as the scour depth increased. For the monopile ( D = 6   m ), the p-y curve obtained with the methods of Zaaijer [23] and Lin et al. [24] was consistent with the p-y curve obtained after the entire scour soil layer was removed. In calculations done according to the model of Lin et al. [25], the soil around the scour hole was included for calculation of the soil wedge at failure; therefore, after scour, the decrease of the lateral ultimate soil resistance around the pile was apparently smaller than the values obtained from other p-y curve modification methods. Qi et al. [35] used the pile model test to simulate the load-displacement response for the local scour of a monopile and considered that the soil around the scour hole substantially enhanced the ultimate soil resistance per length near the ground surface. This view accorded with the approach of Lin et al. [25]. Therefore, in this study, the method suggested by Lin et al. [25] was used to modify the p-y curve for monopile foundations, and the influence of scour on the load-displacement response of monopile foundation was considered.

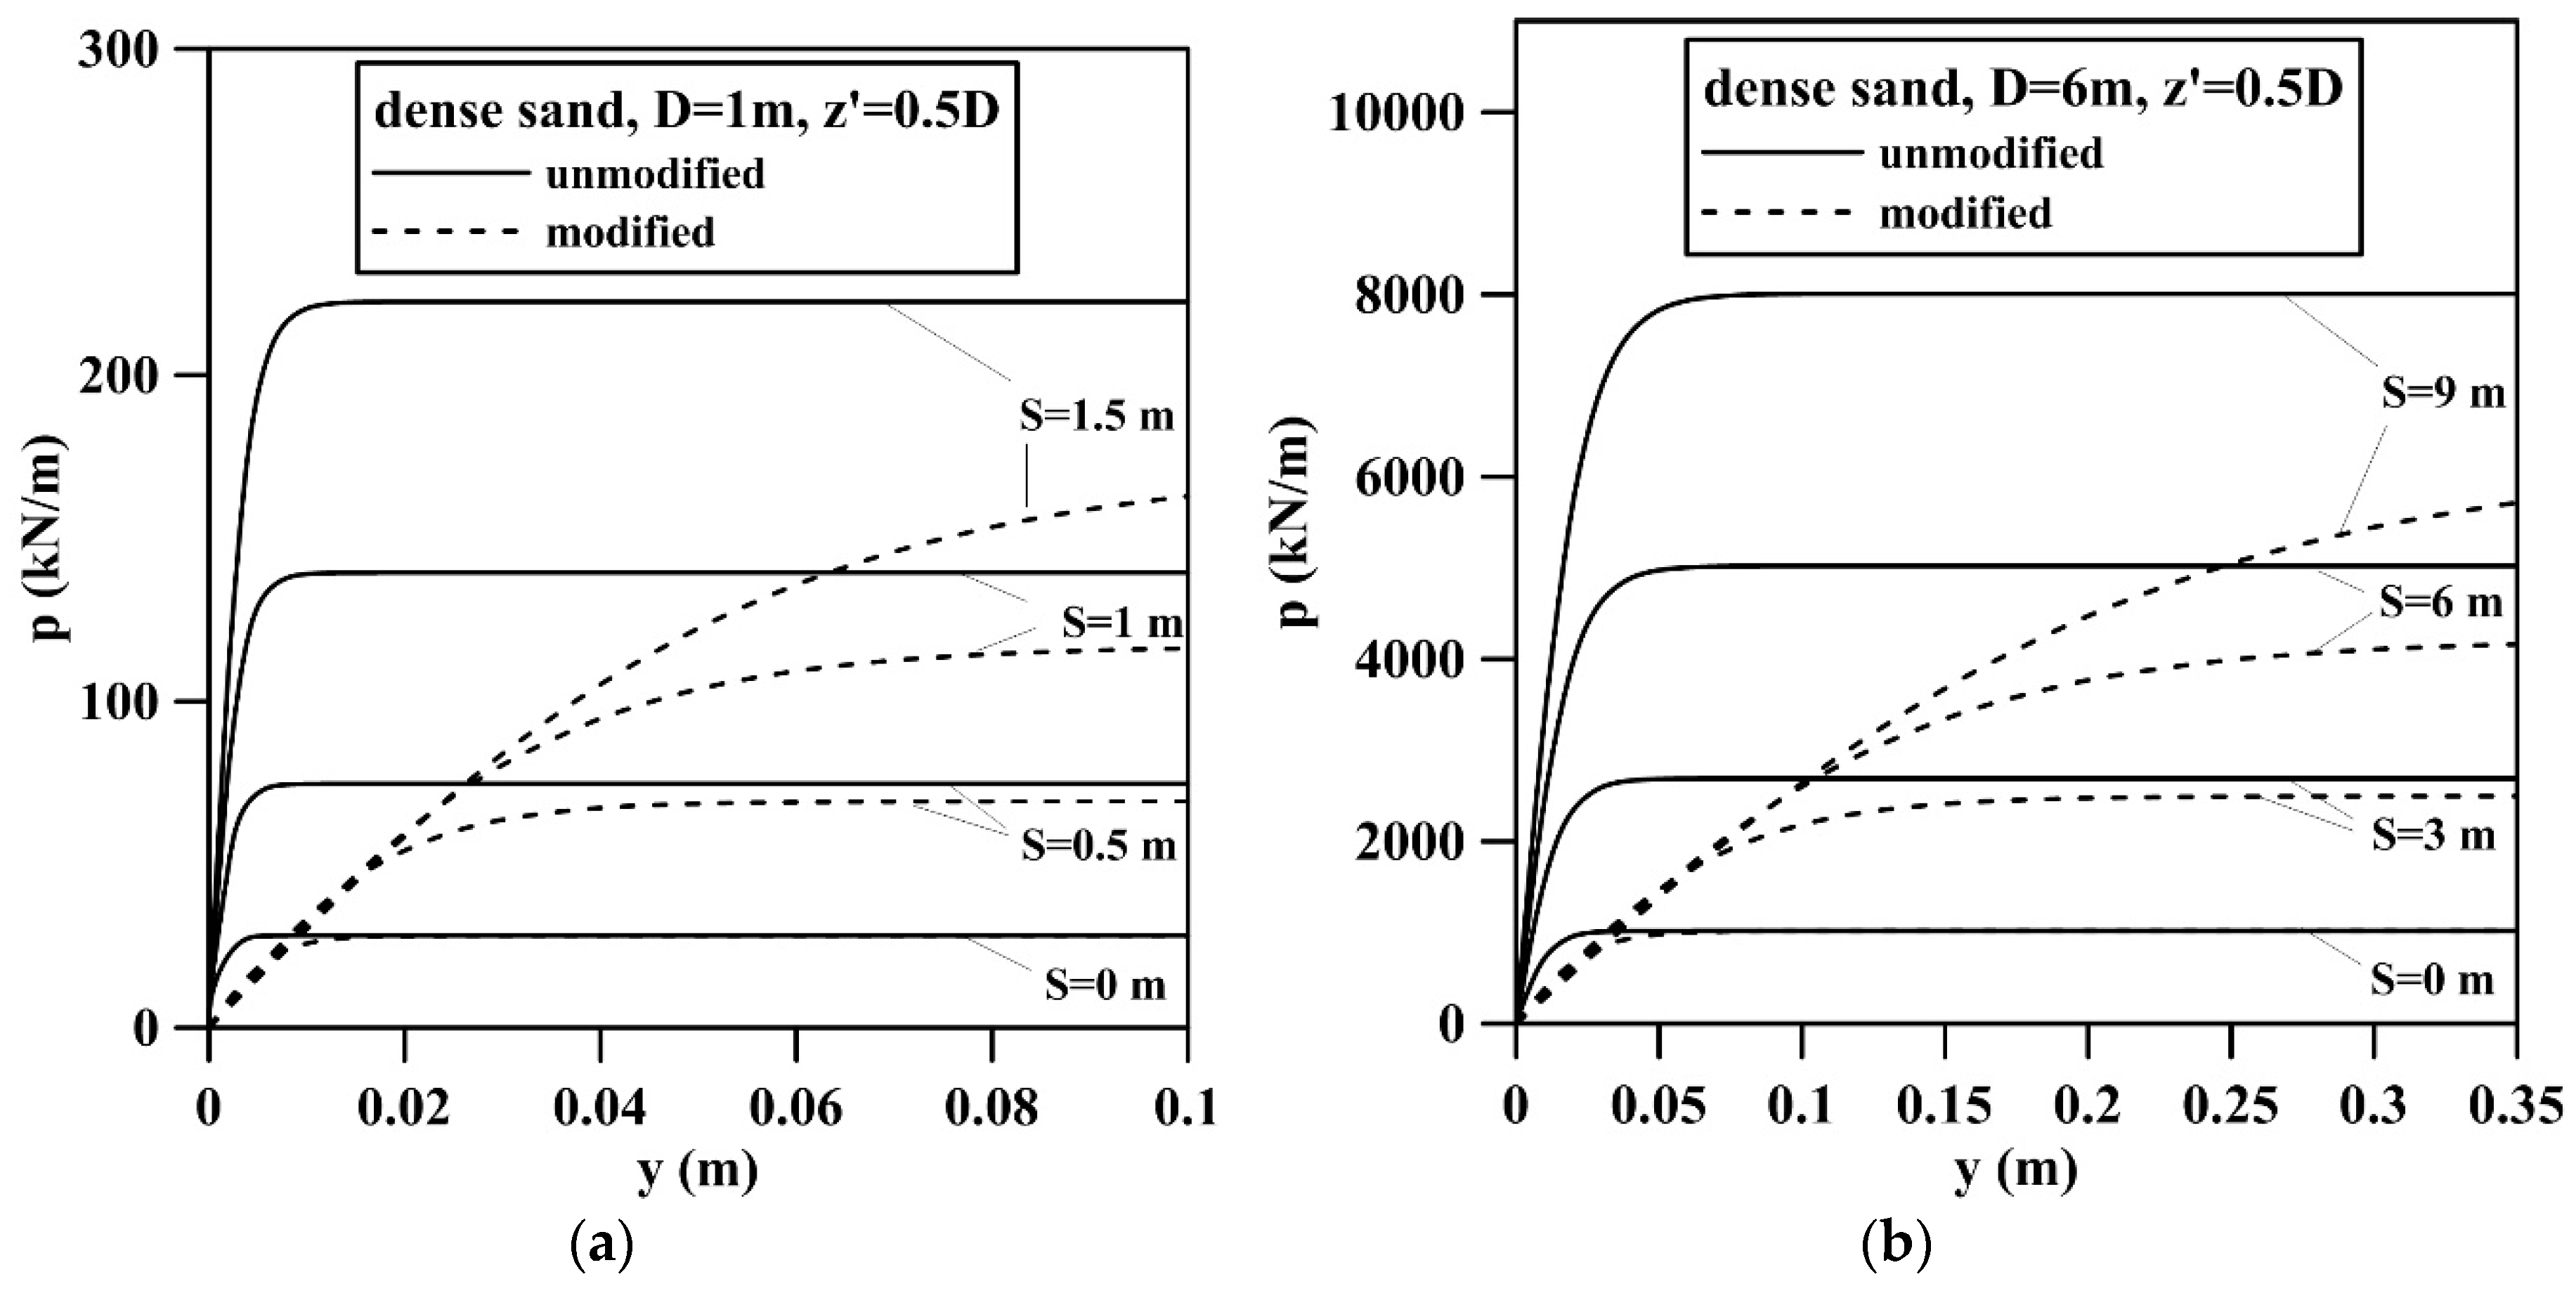
4. The Influence of the Modification of the Initial Modulus of Subgrade Reaction and the Ultimate Soil Resistance on the p-y Curve

To evaluate the influence of scour on monopile deformation, in this study, the method suggested by Sørensen [11] was used to modify the initial modulus of subgrade reaction n h for monopile foundations. In addition, according to Lin et al. [25], the influence of scour was incorporated into the ultimate soil resistance per length p u , and Equation (1) was used to derive a modified p-y curve. For various scour depths ( S d   =   0 D , 0.5 D , 1 D , or 1.5 D ), the unmodified and modified p-y curves at depth of 0.5 D below the bottom of the scour hole after scour (i.e., z   =   0 , 0.5 , 1 or 1.5 D below the ground line before scour) were compared. As shown in Figure 6, before scour occurred ( S d   =   0 D ), the ultimate soil resistance per length p u was not influenced, and only the initial stiffness of p-y curve E p y required modification for large pile diameter. As the scour depth increased, the ultimate soil resistance per length p u decreased. After scour occurred, the decrease of the initial stiffness of p-y curve E p y became apparent.

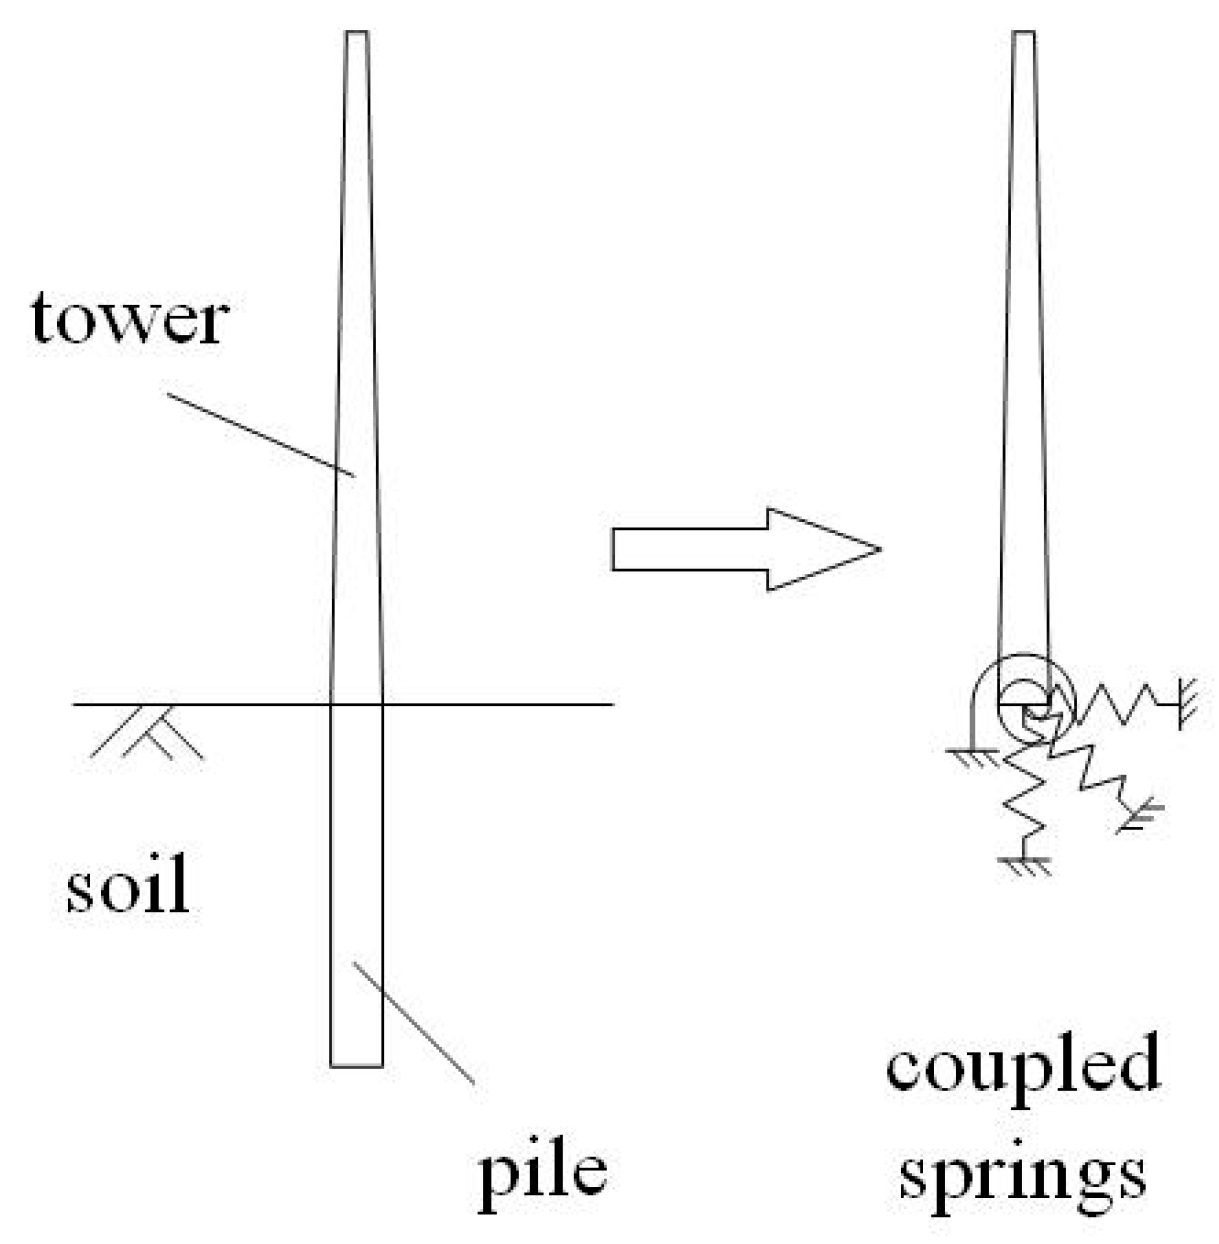
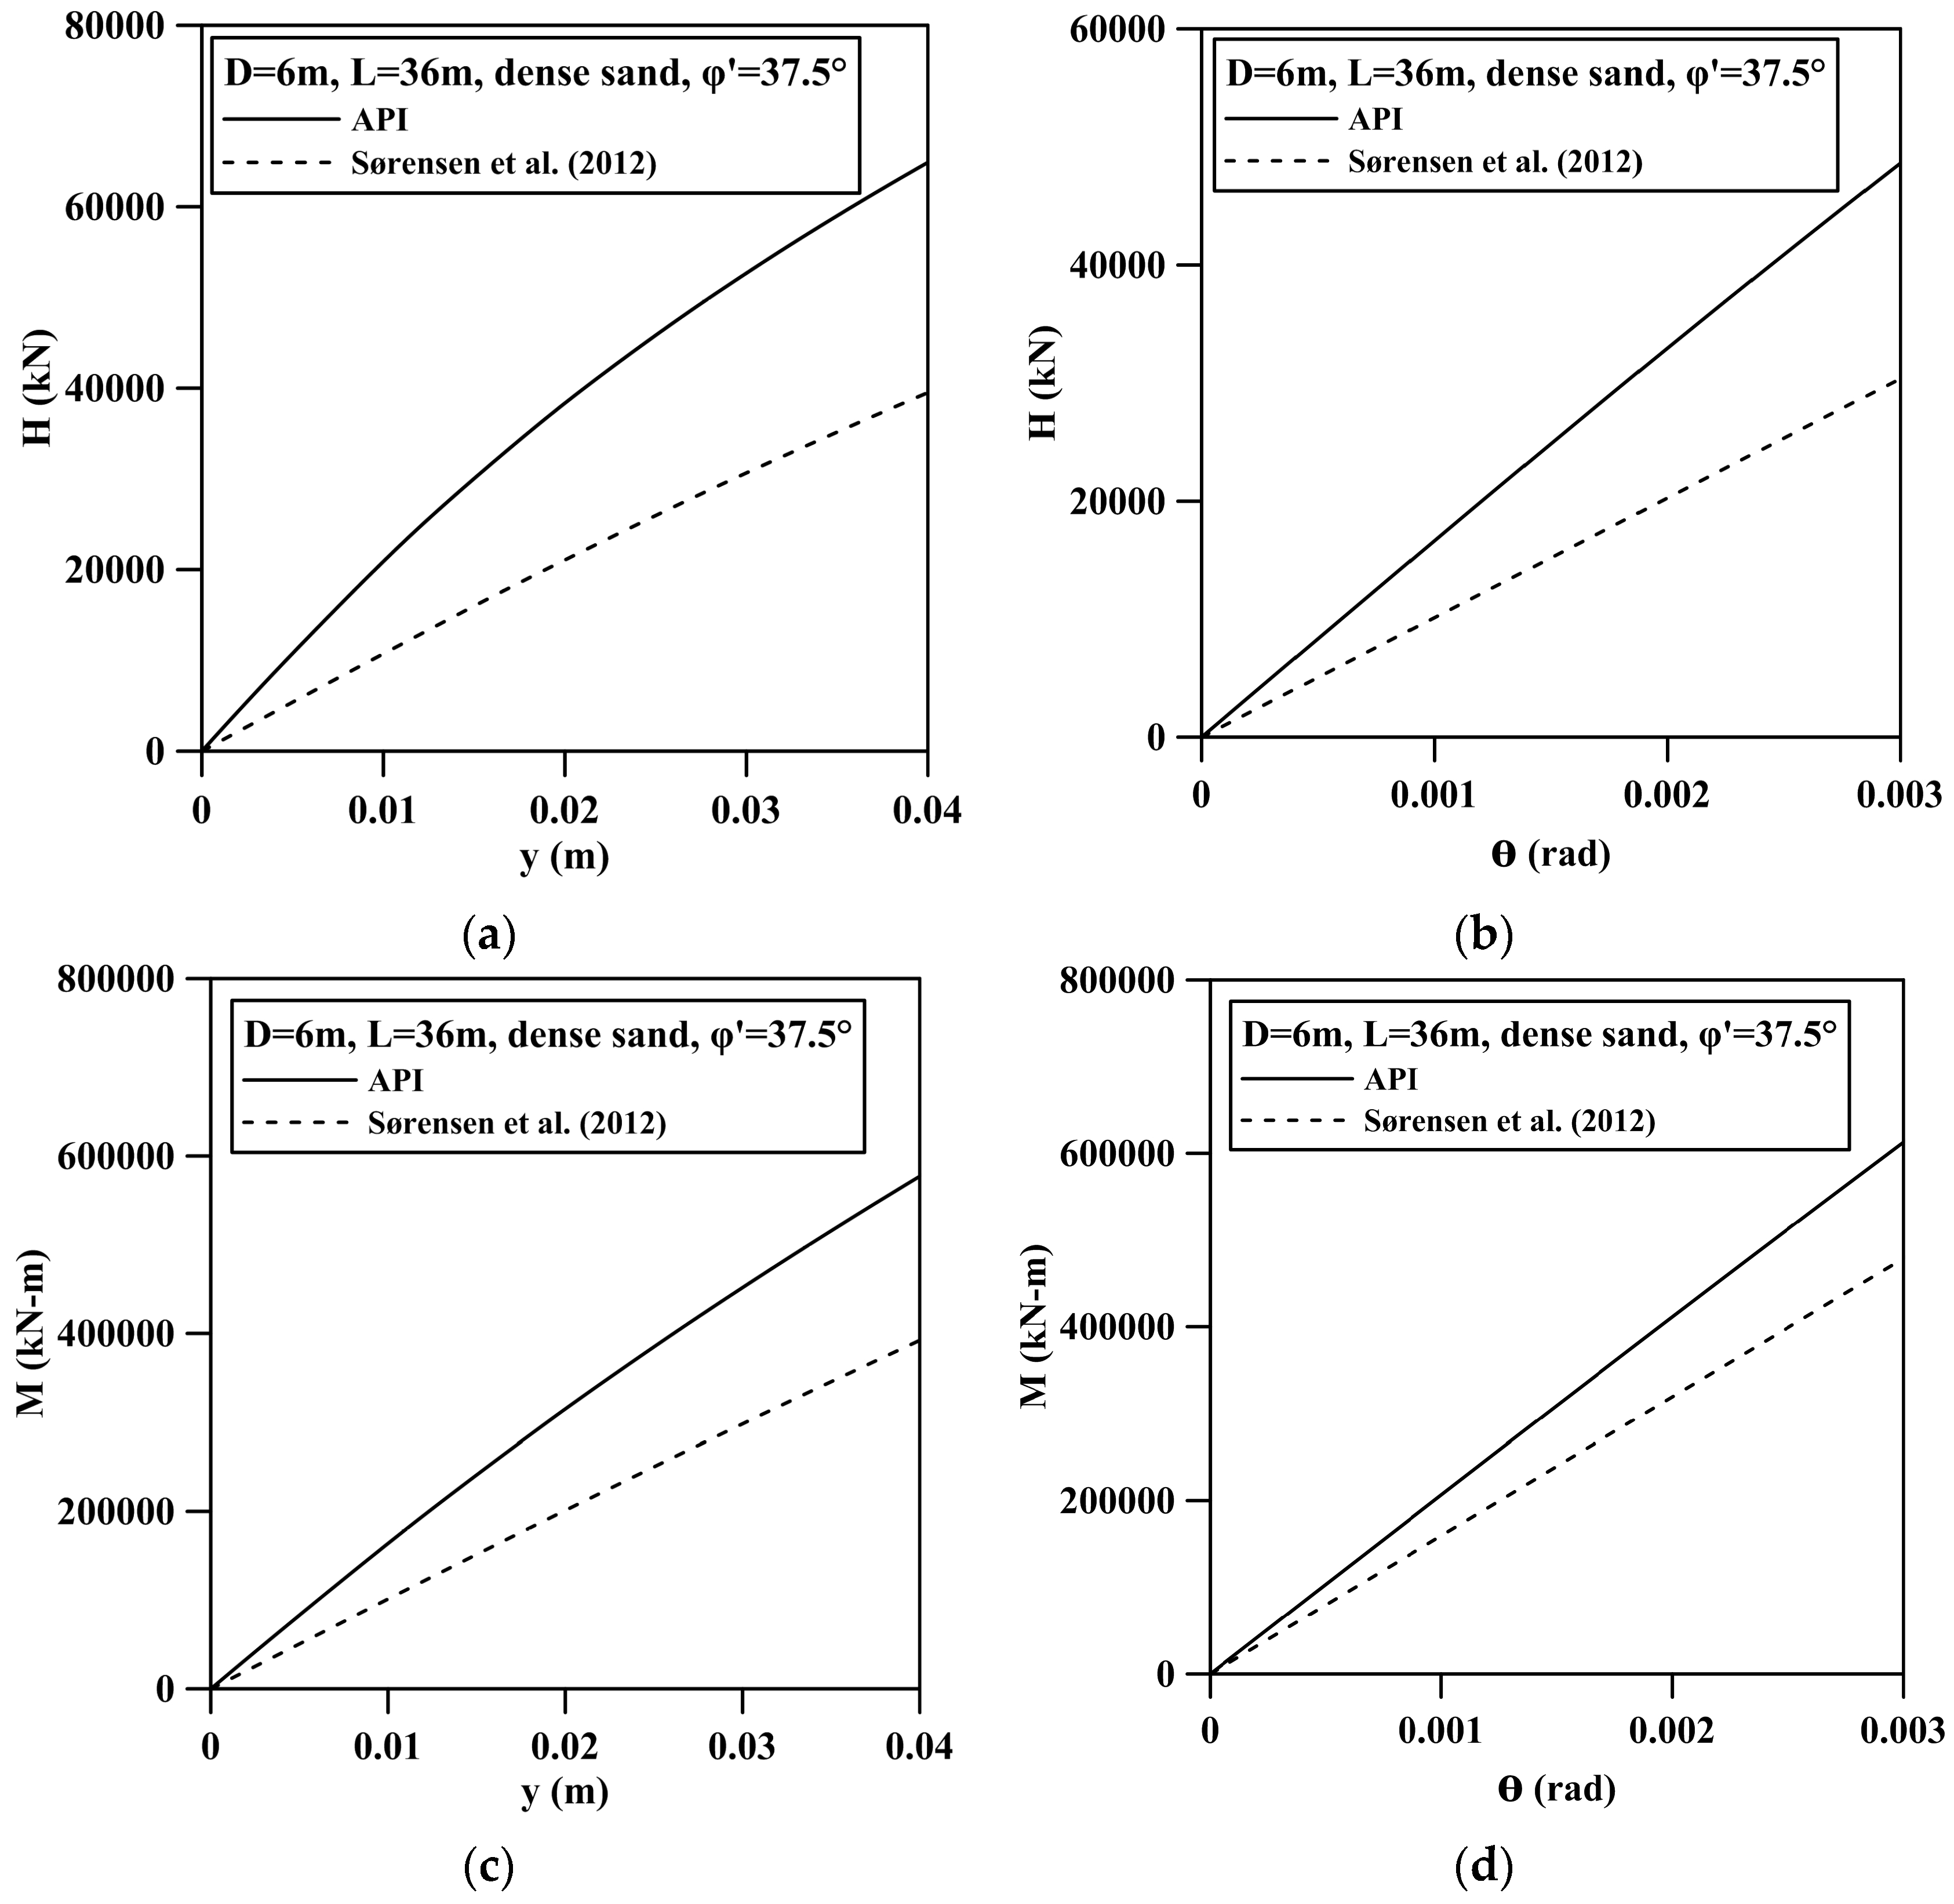
5. Foundation Stiffness of Monopile

In engineering practice, during the dynamic analysis of the whole structure of offshore wind turbine, the load-displacement response of a monopile foundation is often simplified to be a foundation stiffness matrix; accordingly, the natural frequency and the load-displacement response of the support structure can be calculated (Figure 7) [36,37,38,39,40].
Arany et al. [39] considered that the vertical foundation stiffness for the monopile foundation of an offshore turbine is much higher than the foundation stiffness in other directions; therefore, simple calculations of foundation stiffness can disregard the influence of vertical foundation stiffness. According to the load response of the lateral, rotational and coupled spring, the flexibility matrix of the coupled springs model is defined as a 2 × 2 matrix in Equation (27), where u denotes the pile head deflection; θ ( = u / z ) denotes the pile head rotation; H denotes the lateral loading of the pile head; M denotes the moment of the pile head. When the foundation receives lateral force H (i.e., M = 0 ), the pile head deflection and rotation for the mudline can be used to derive the coefficients of the flexibility matrix ( S u u and S θ u ). When moment M is exerted on the foundation (i.e., H   =   0 ), the pile head deflection and rotation can be used to calculate the coefficients of the flexibility matrix ( S u θ and S θ θ ). When the flexibility matrix is known, the stiffness matrix ( K ) can be obtained by inverting the flexibility matrix (Equation (28)):
{ u θ }   =   [ S u u S u θ S θ u S θ θ ] { H M }
{ H M }   =   [ K u u K u θ K θ u K θ θ ] { u θ }
To calculate a coupled spring with foundation stiffness, the p-y curve can be employed to calculate the load-displacement response of a monopile foundation; the initial stiffness of the load-displacement curve can be employed to determine the foundation stiffness for the operation of an offshore wind turbine. Considering a pile with a diameter of 6 m and a length of 36 m embedded in dense sand ( ϕ   =   37.5 ° ), Figure 8 shows the load-displacement response of a monopile foundation, calculated by using the initial modulus of subgrade reaction n h suggested by API [6] and Sørensen [11] without considering scour. The foundation stiffness of the monopile were 23% to 50% lower than the foundation stiffness obtained from the unmodified p-y curve.

6. A Case Study for the Loading and Deformation Response of Monopile Foundation with Scour at the Chang-Bin Wind Farm

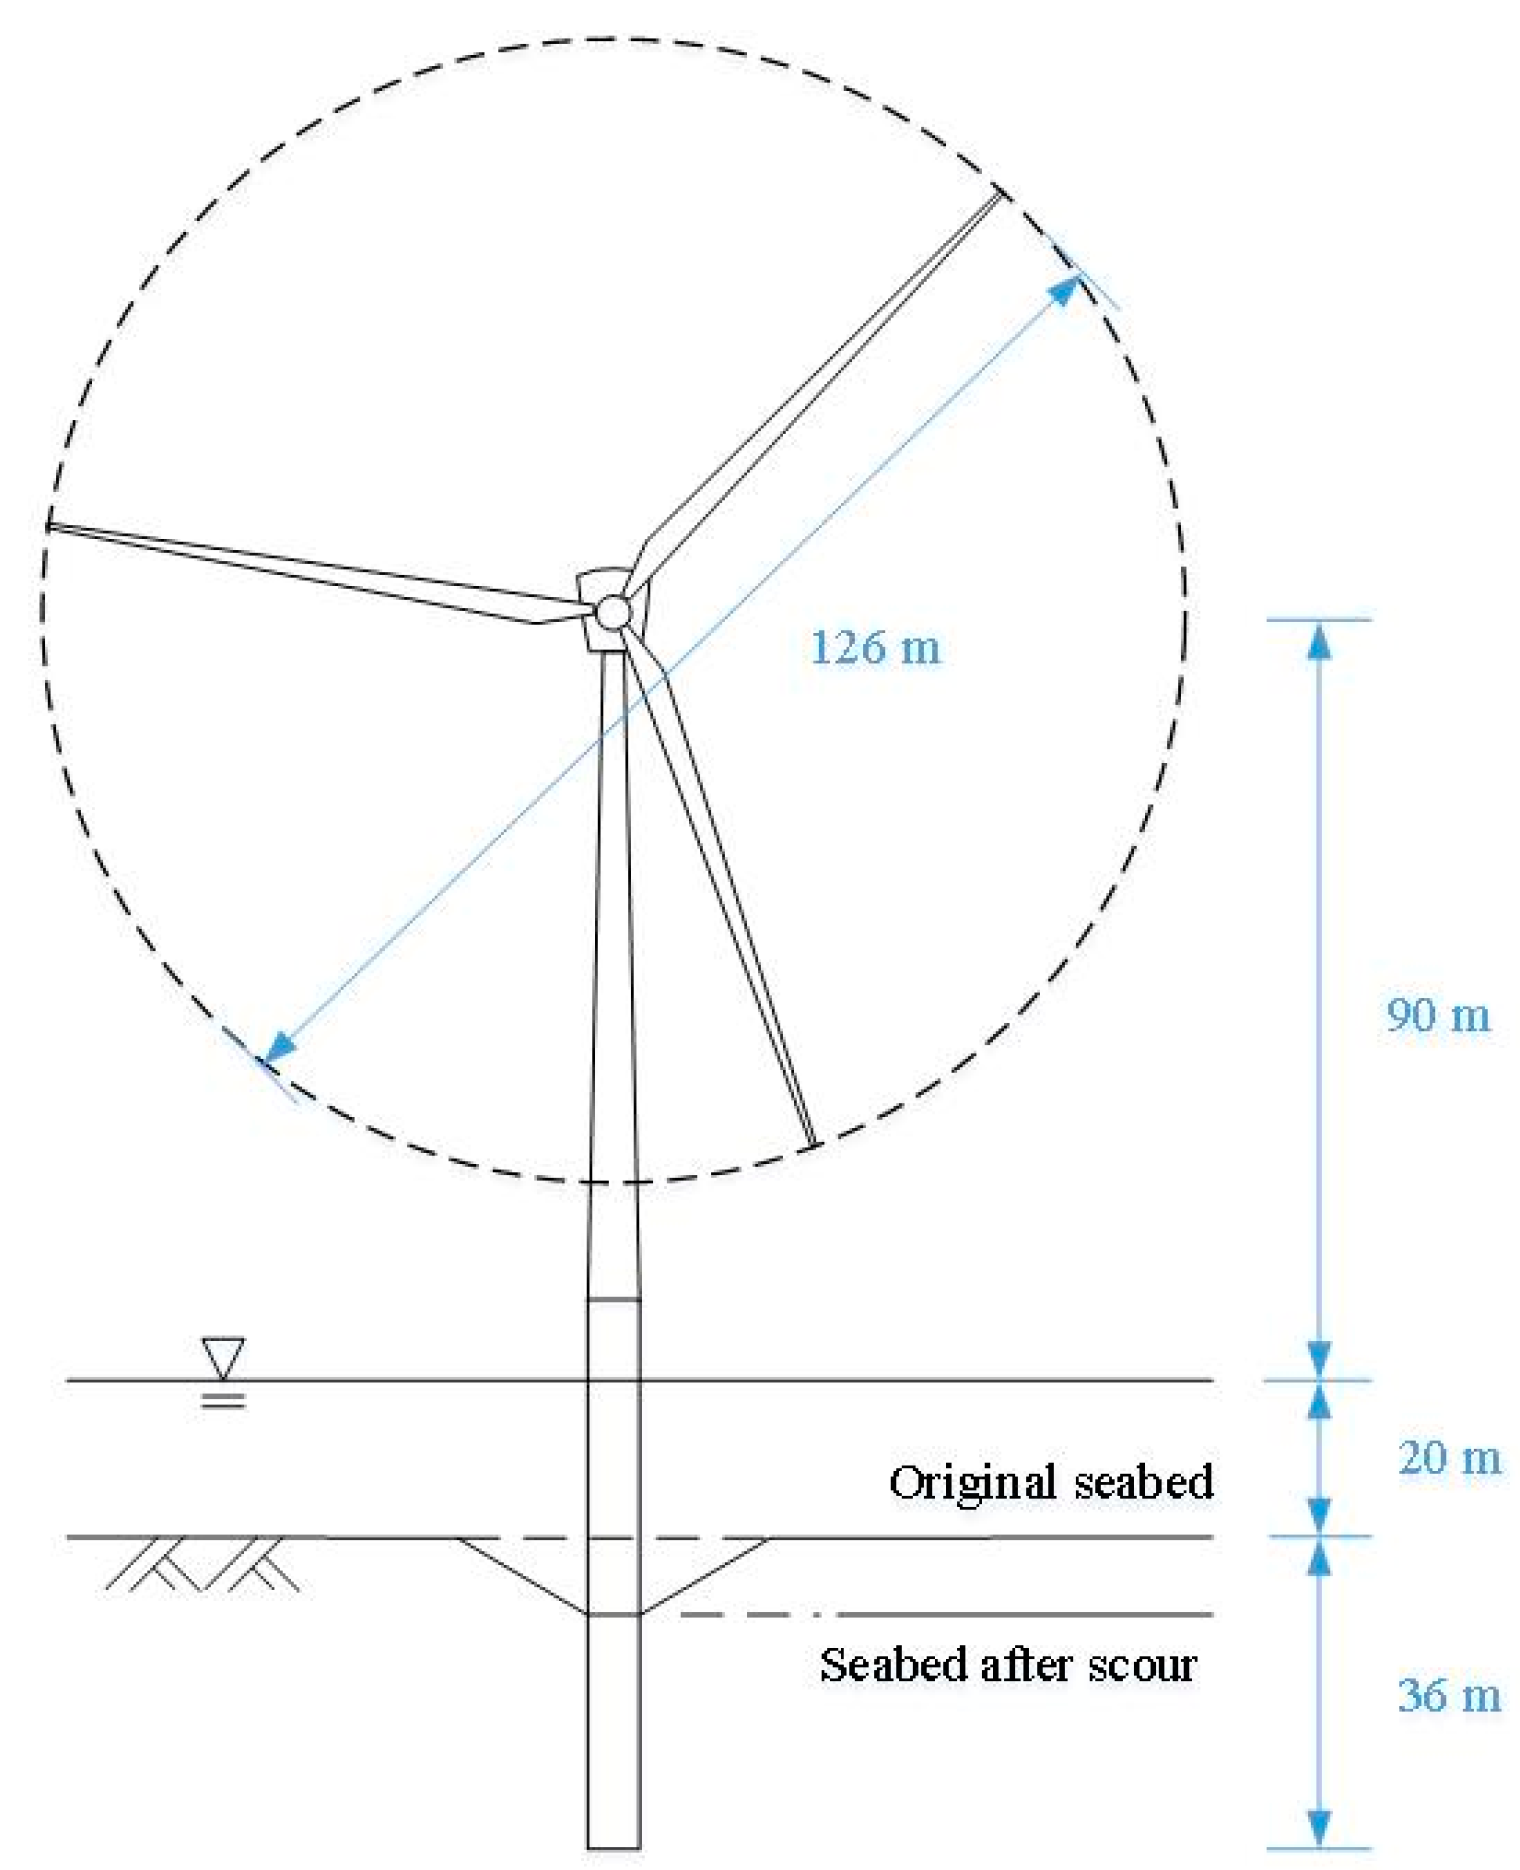
6.1. Reference Offshore Wind Turbine of National Renewable Energy (NREL)

In this study, we used the Chang-Bin wind farm as an example and used a 5-MW reference wind turbine developed at the National Renewable Energy Laboratory (NREL) to perform a dynamic analysis [37] and to assess the influence of scour on the response of a support structure and foundation stability. This wind turbine had three blades and featured variable speed and pitch control; its cut-in, rated, cut-out wind speeds were 3, 11.4, and 25 m / s , respectively. The rotation speeds of cut-in and rated rotors were 6.9 and 12.1 rpm , respectively; the diameter of the rotors was 126 m ; the hub was at 90 m above sea level. The weights of all rotors, the nacelle, and the tower were 110, 240, and 347.5 tons , respectively. The tower top had a diameter of 3.87 m and a wall thickness of 0.019 m ; the diameter of the tower bottom was 6 m and its wall thickness was 0.027 m ; the water depth was 20 m . The diameter of the monopile foundation was 6 m , the wall thickness was 0.06 m , and the pile length was 36 m ; the scour depths were 0, 3, 6, and 9 m ; the steel density for the tower was 7850 kg / m 3 . A “total density of tower structure” 8500 kg / m 3 is considered in the study in order to account for paint, bolts, welds and flanges. The elastic modulus of the steel material was 2.1   ×   10 8 kN / m 2 . The soil was sandy soil; the effective friction angle of sand ϕ was 29.5 ° –33 ° . The effective unit weight of sand was 9.61–10.58 kN / m 3 . Figure 9 and Table 2 and Table 3 show relevant soil data [41] to facilitate further analysis.

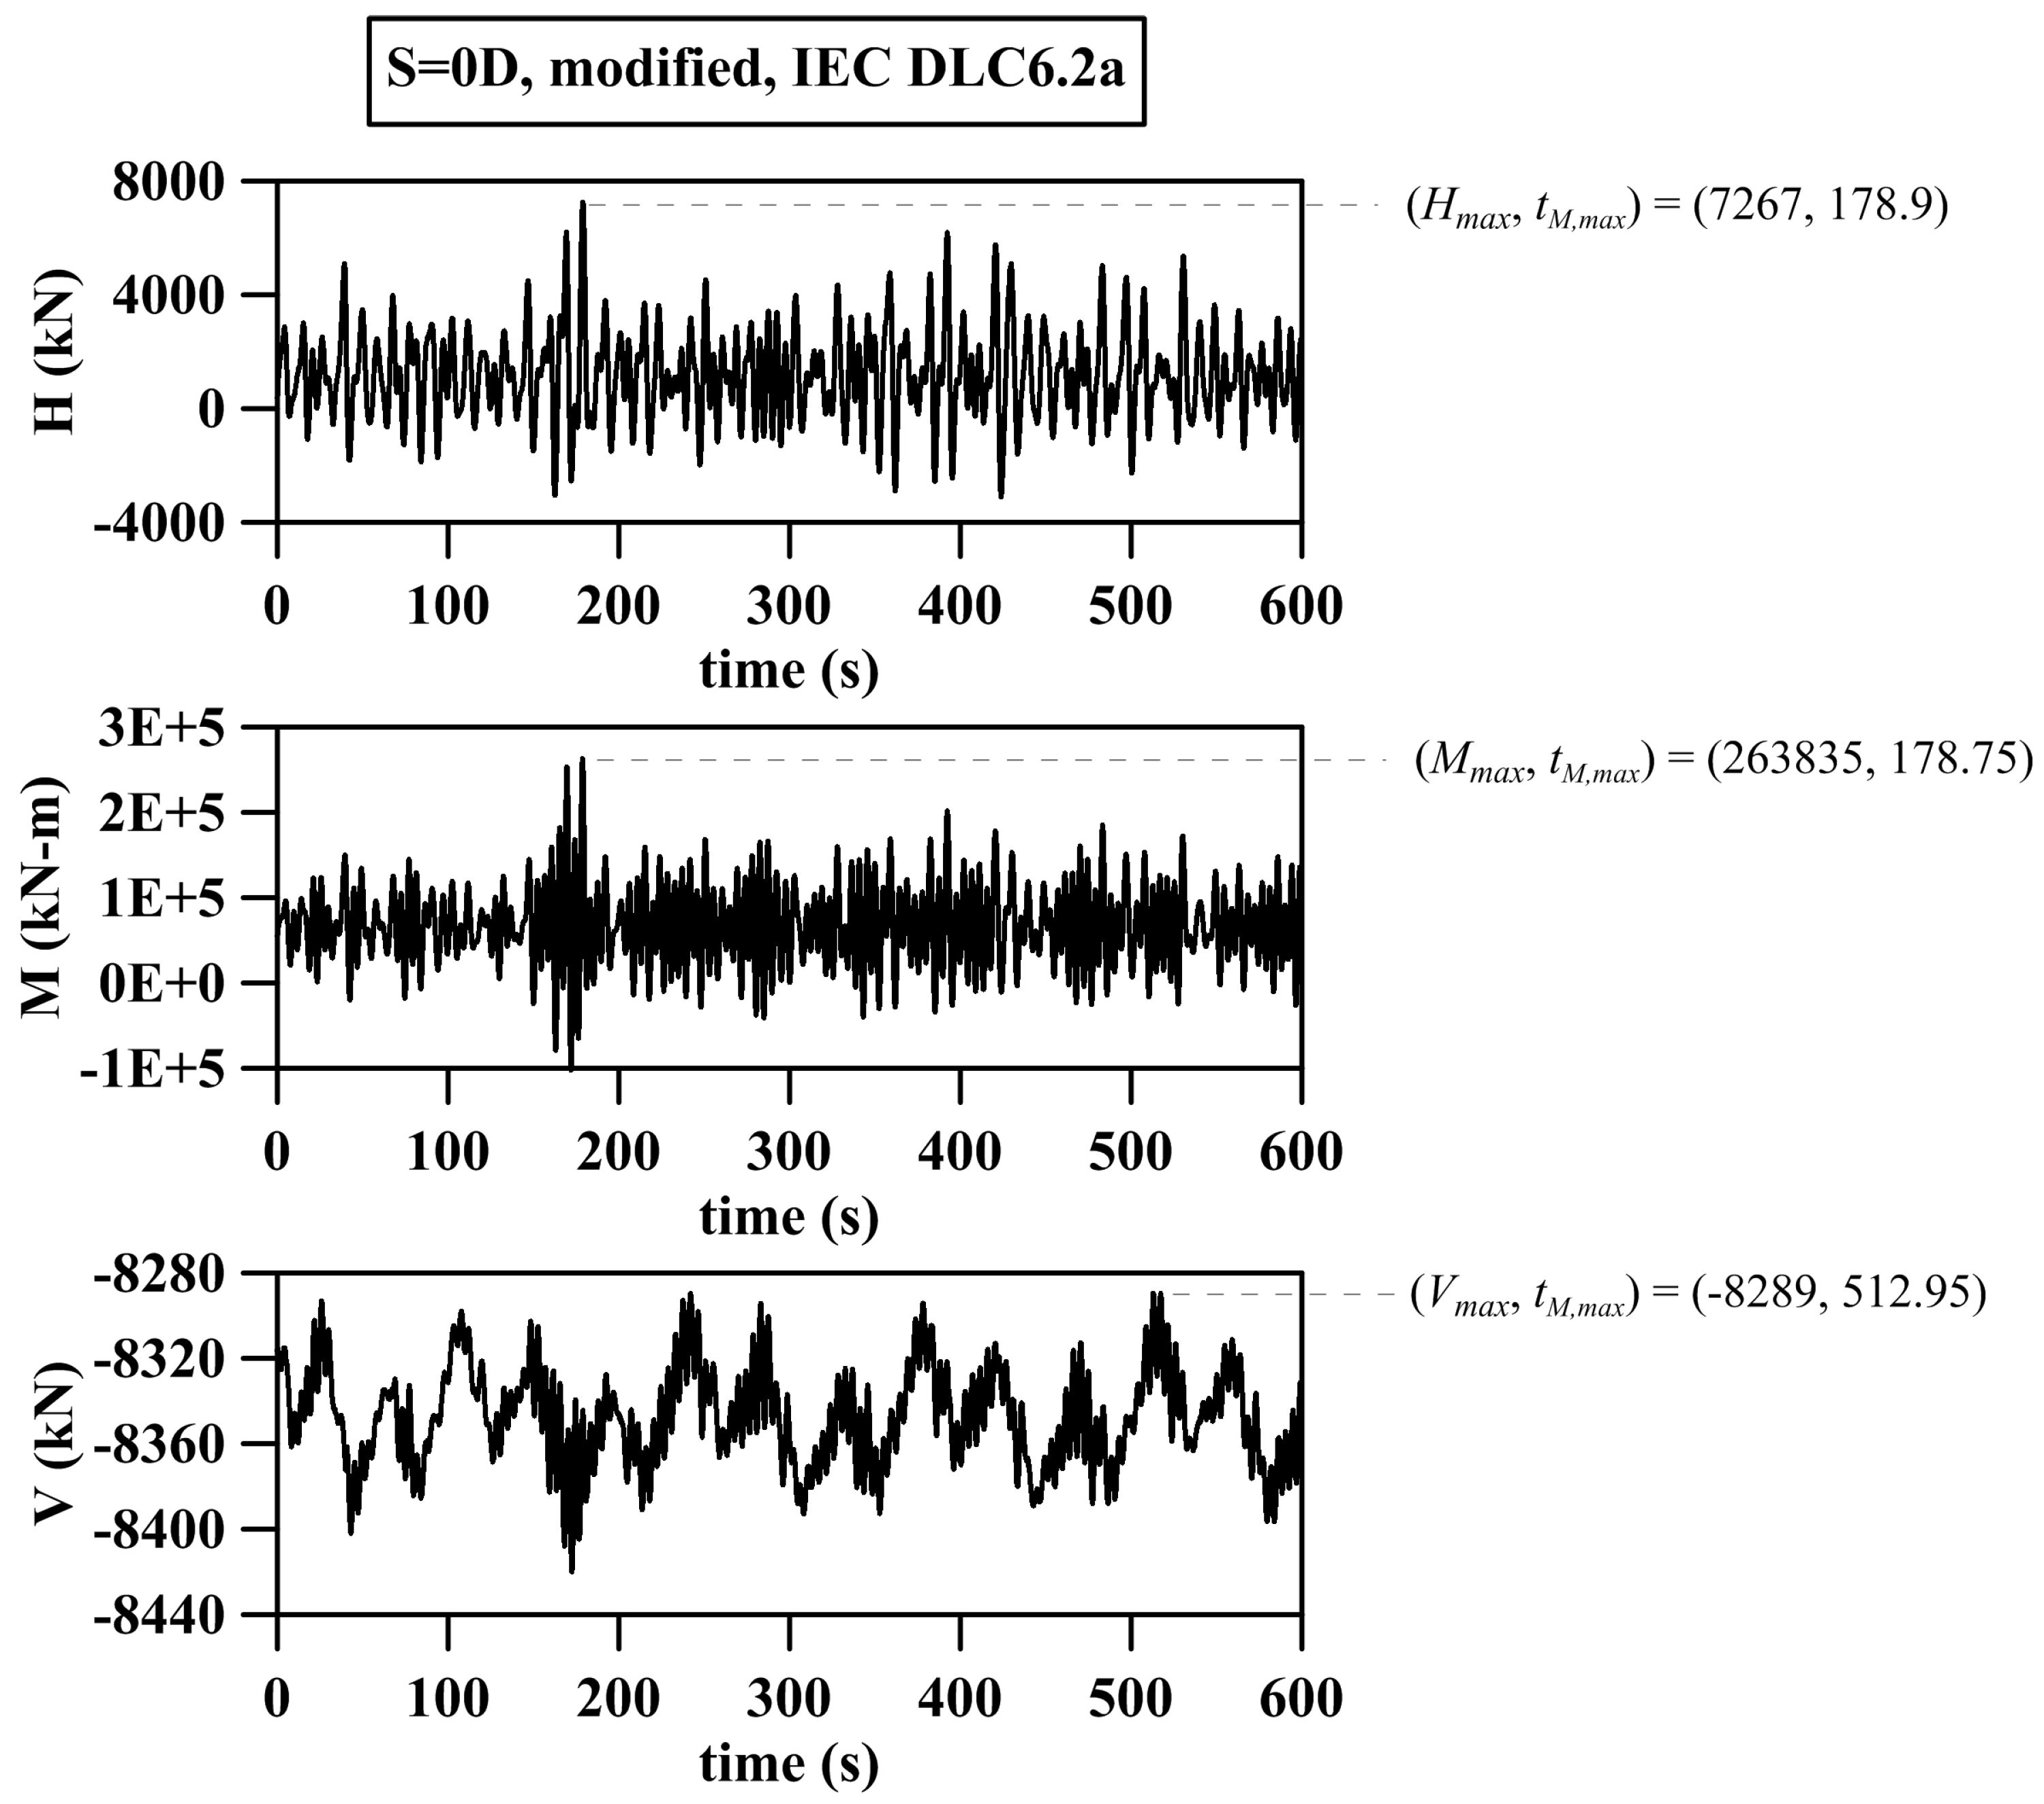
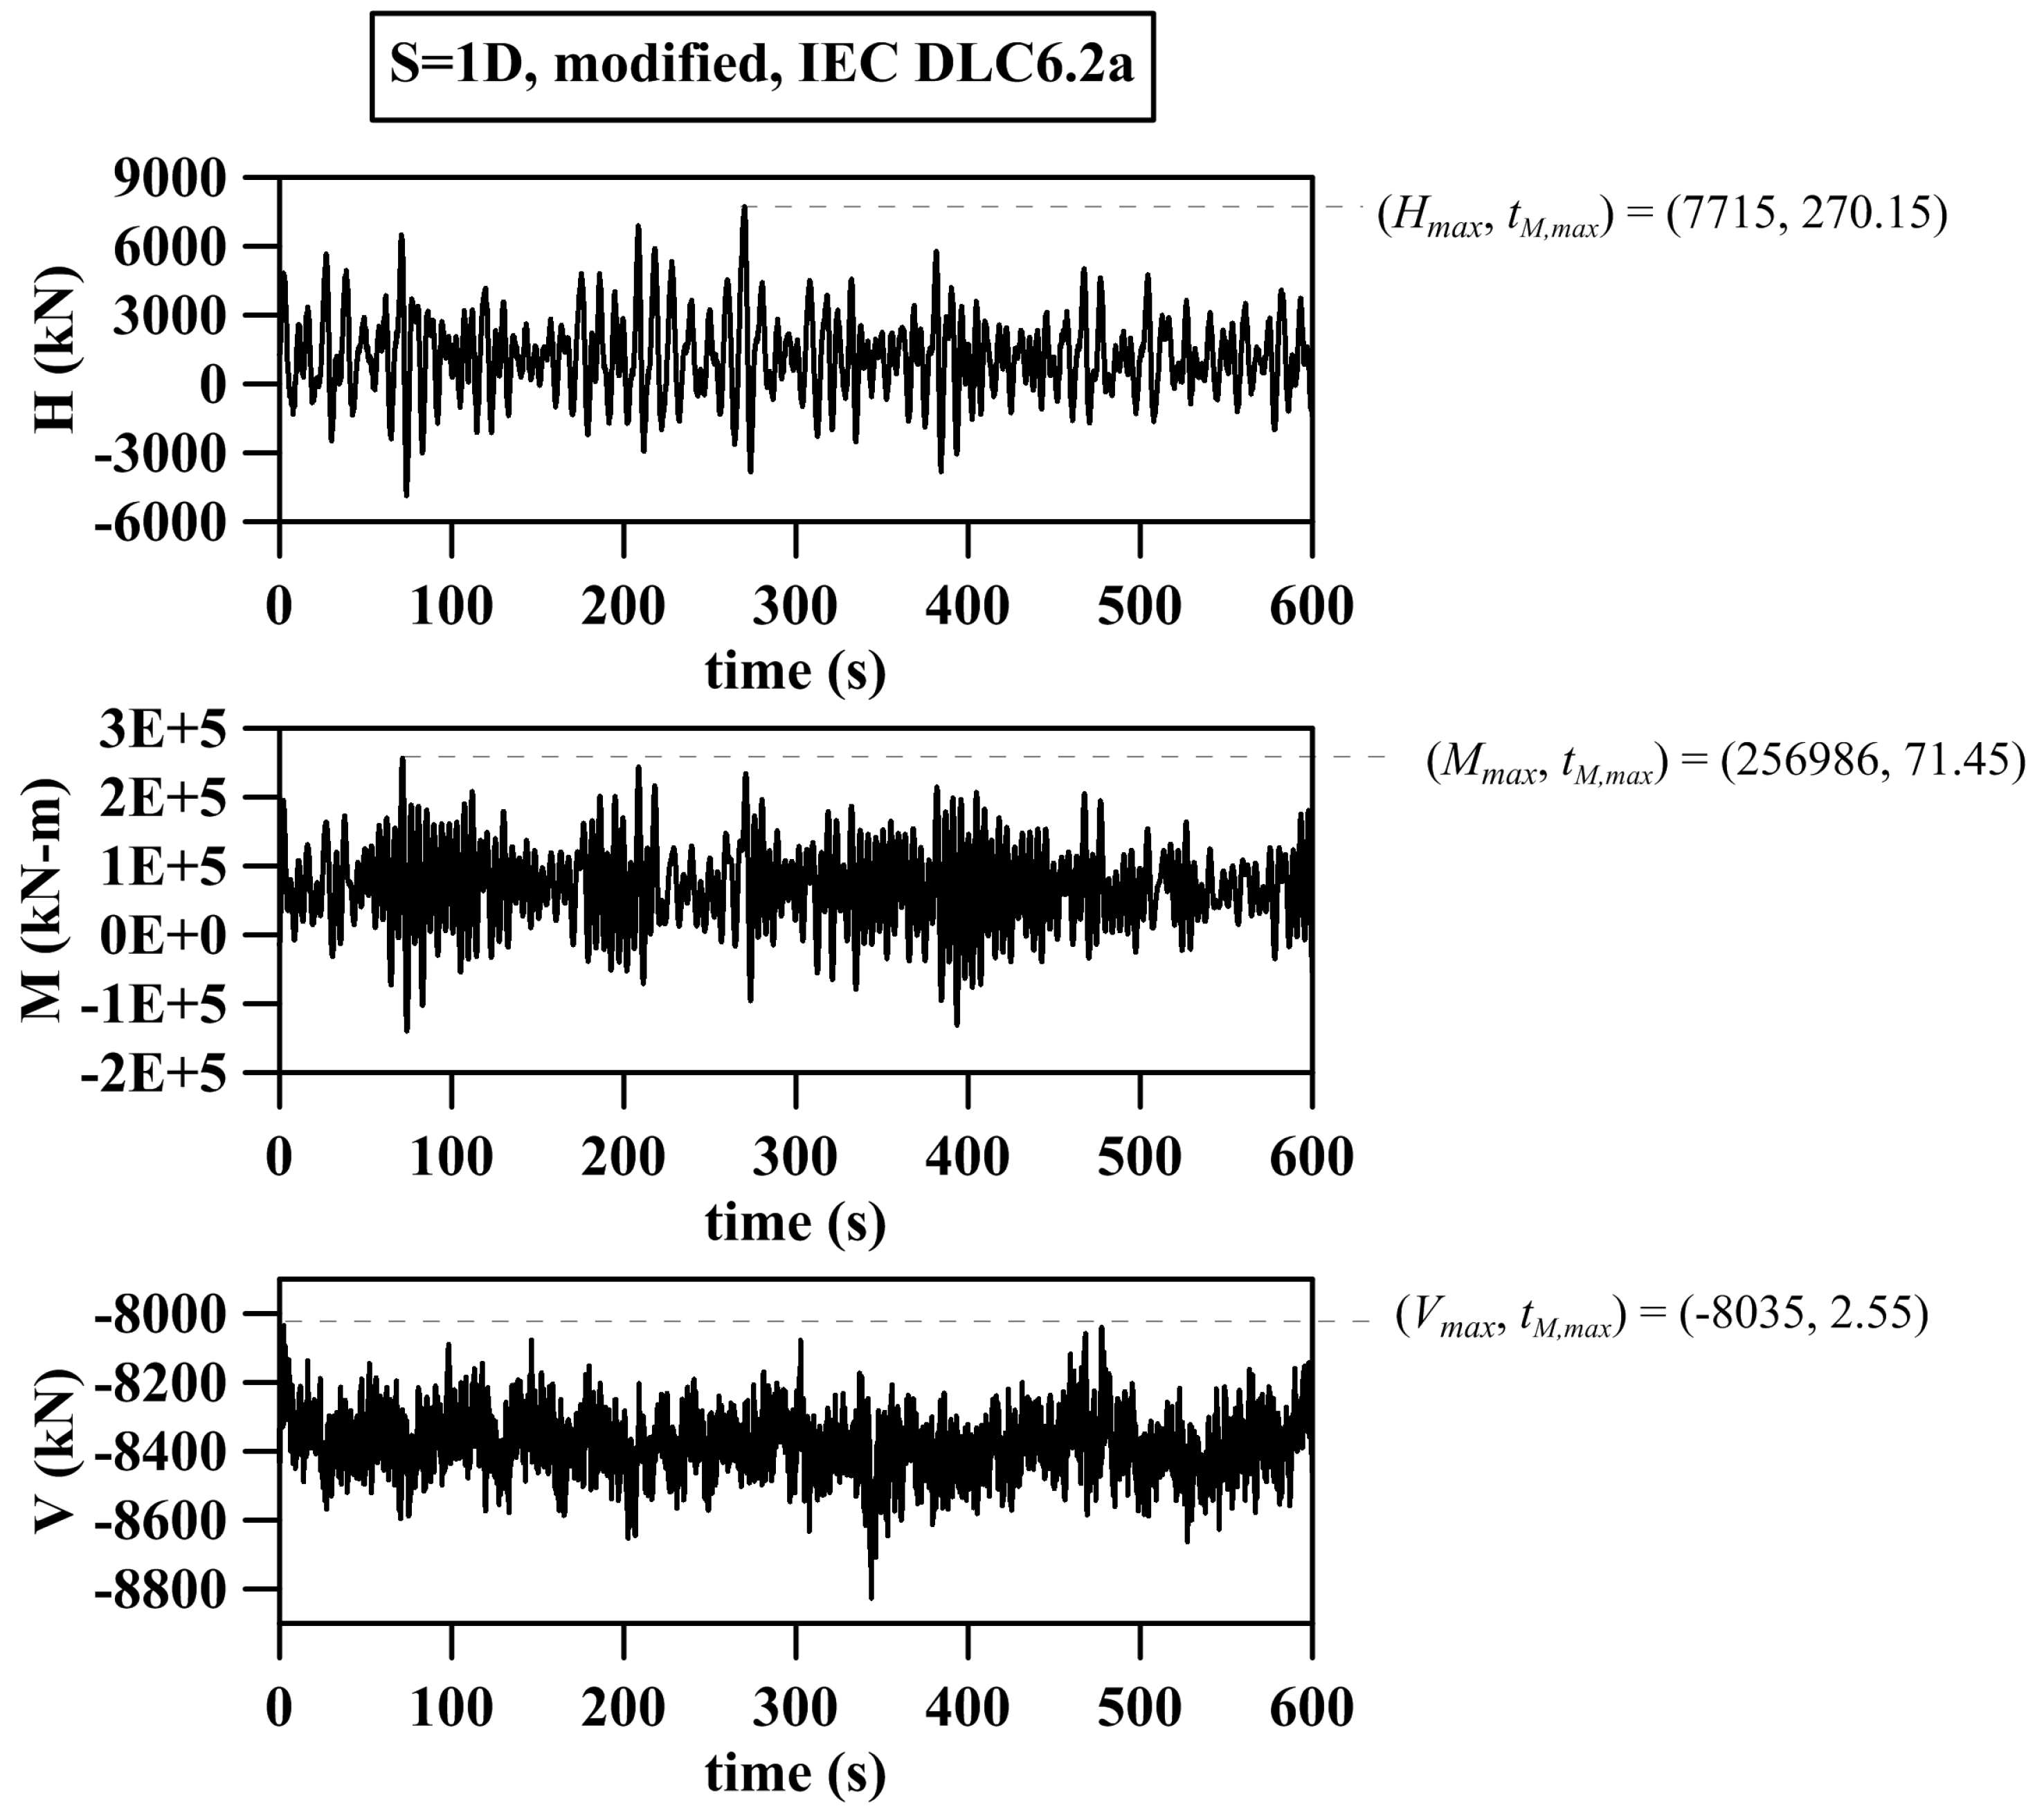
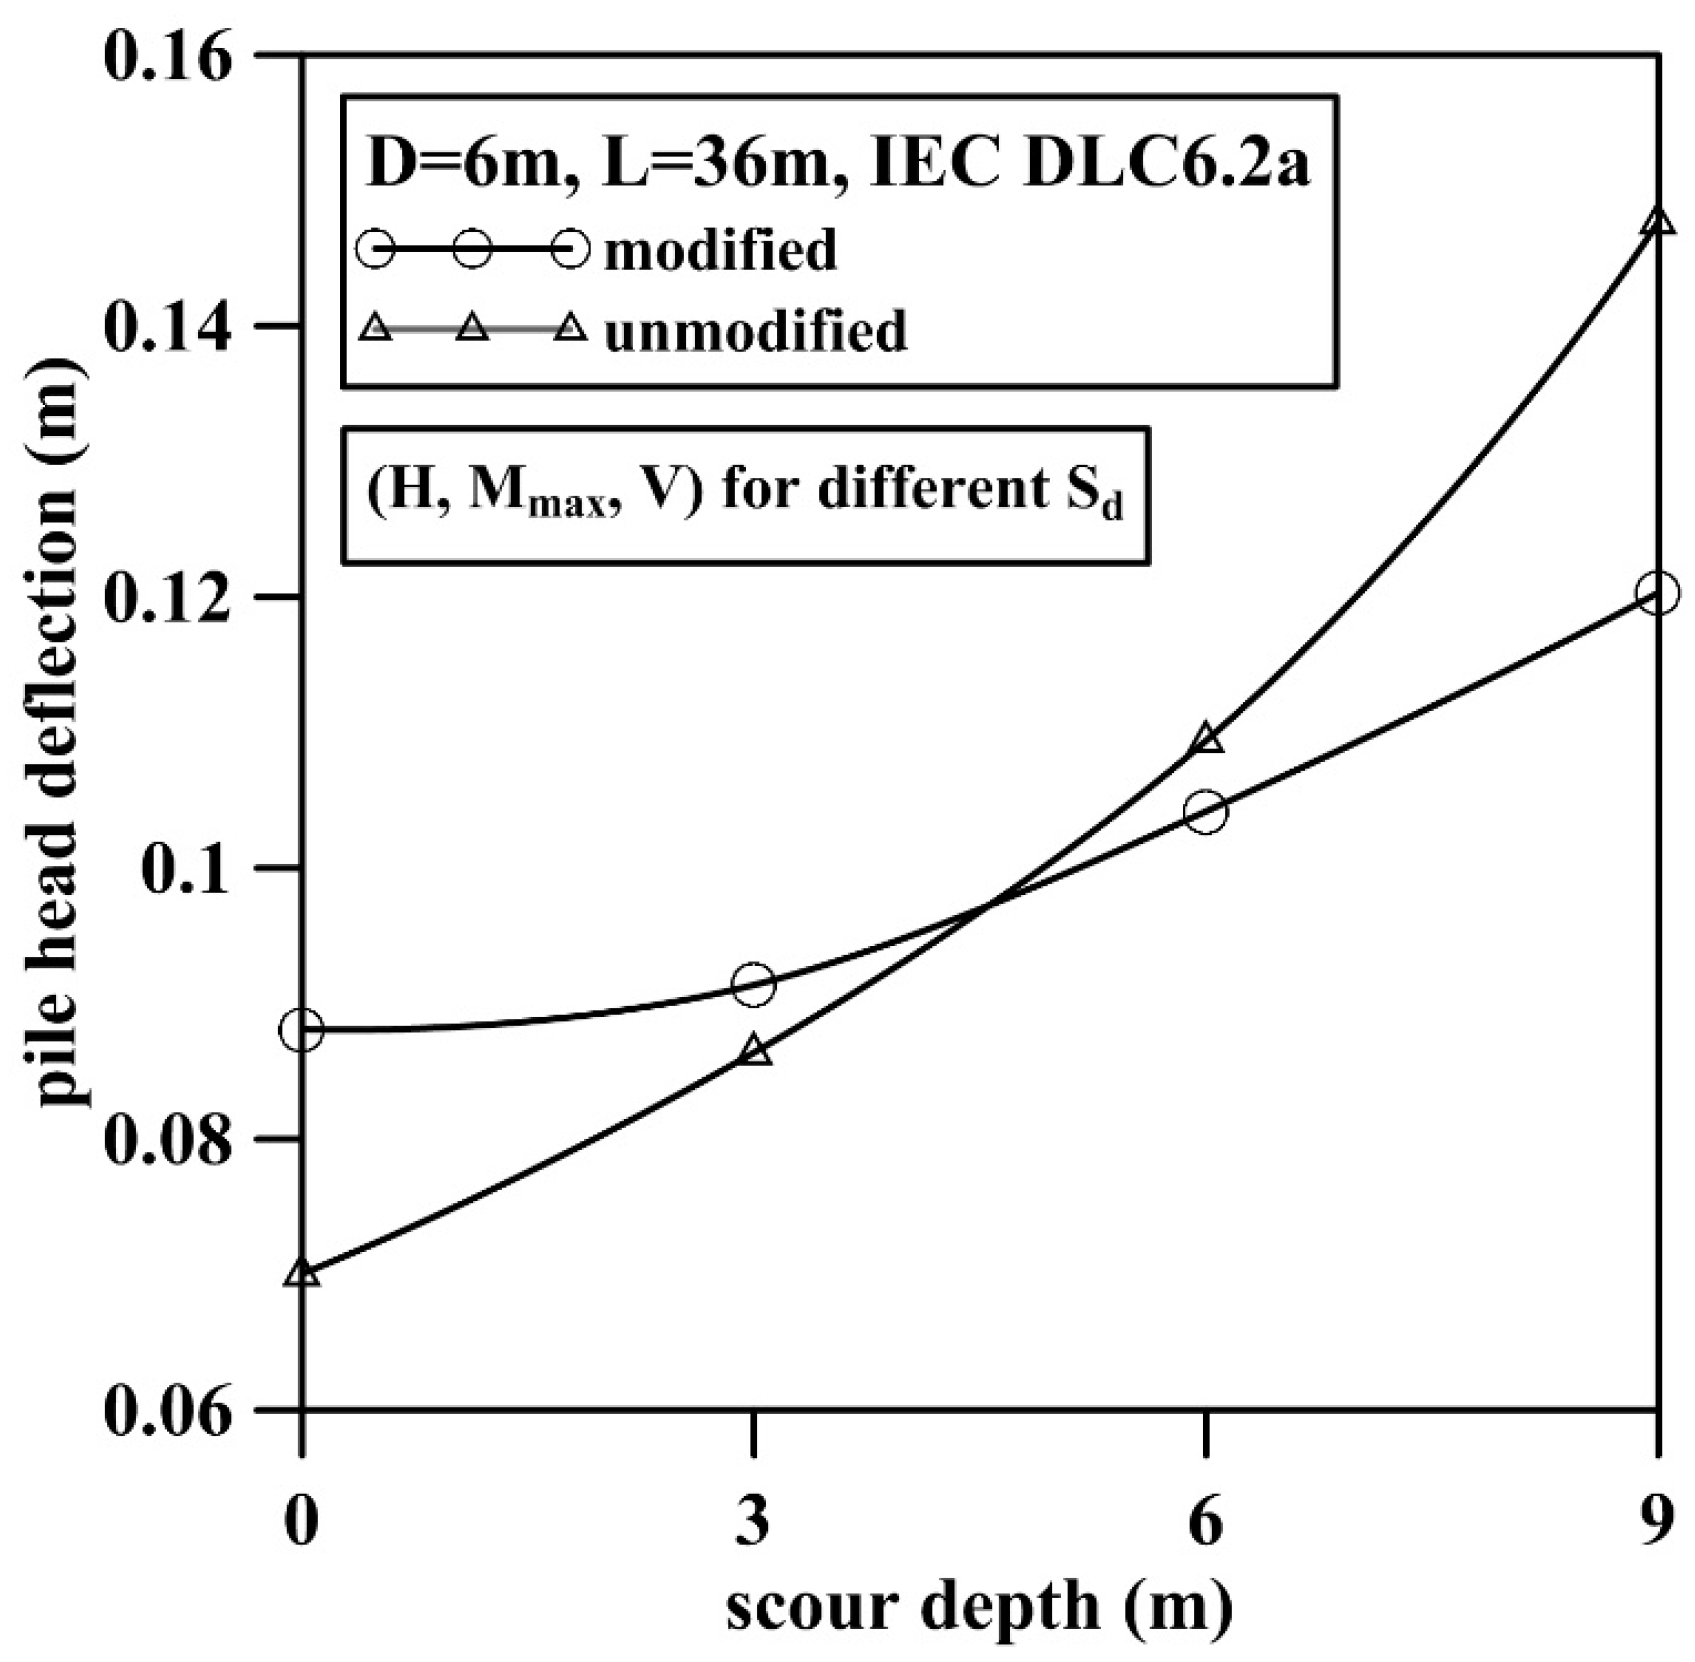
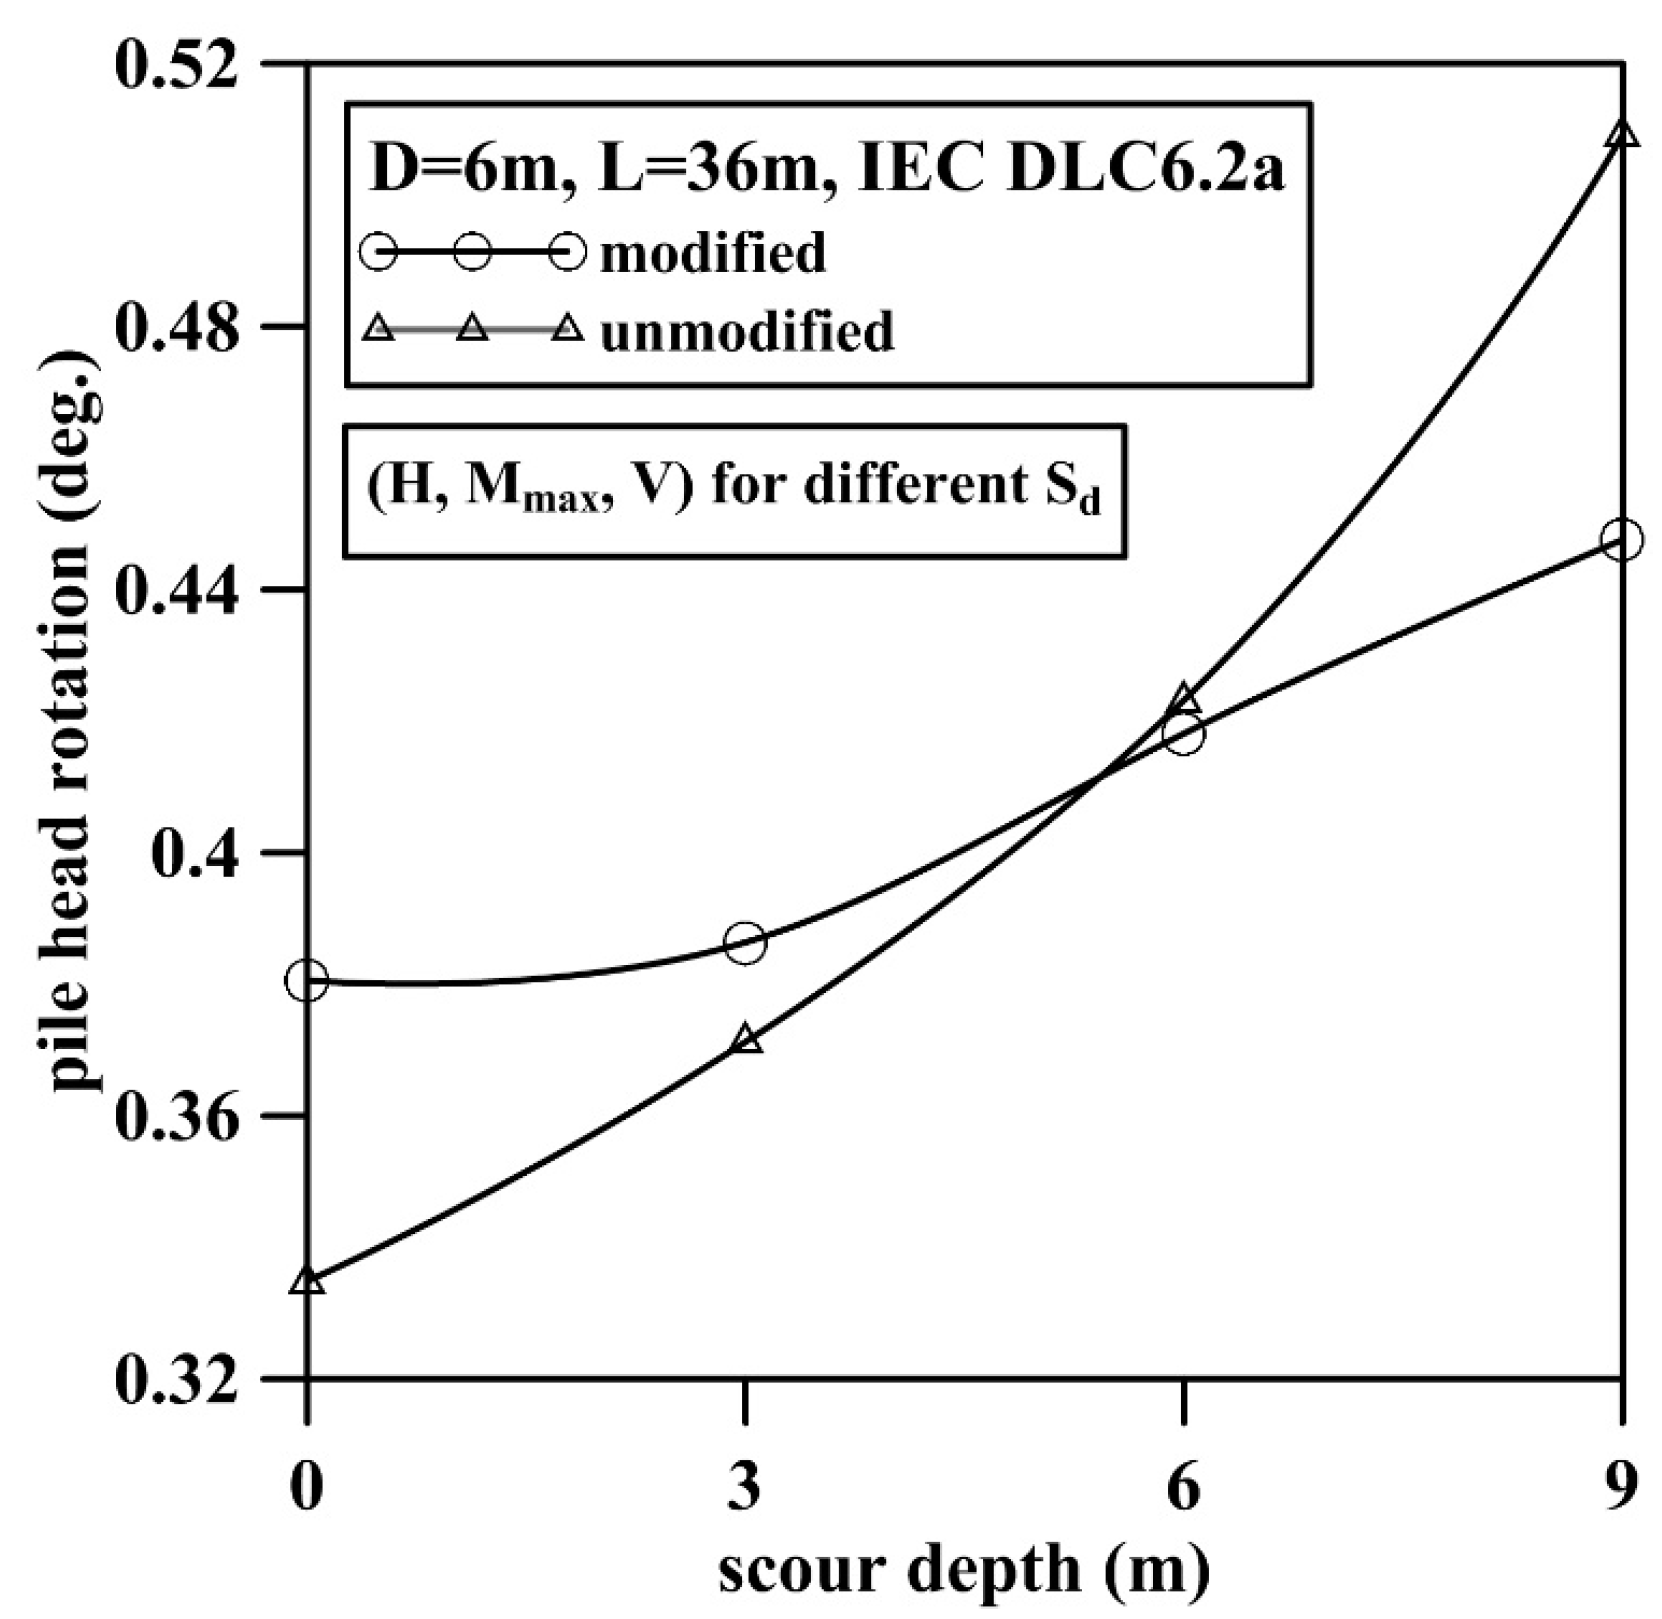
6.2. Loading and Deformation Response of Monopile Foundation

A numerical model of the reference 5 MW offshore wind turbine of NREL presented in Section 6.1 is modelling with Commercial software BLADED [42]. The foundation stiffness is determined from the initial stiffness of the load-displacement curve at pile head described in Section 5. To evaluate the effect of scour around the monopile foundation, the p-y curves are modified with the suggestion presented in this study, the modification of initial modulus of subgrade reaction n h proposed by Sørensen [11] is combined with the modification of ultimate soil resistance per length p u suggested by Lin et al. [25] when scour occurred. The deformation response of monopile with scour can be derived from modified p-y curve method. Therefore, the foundation stiffness matrix considered with modified and unmodified p-y curve for various scour depths ( S d = 0 , 0.5 , 1 , or 1.5 D ) were calculated as showed in Table 4. A design loading for extreme wind and wave conditions (International Electrotechnical Commission (IEC) design load cases (DLC) 6.2a) was employed to perform an analysis and the foundation stiffness matrix is determined under this loading. According to IEC DLC 6.2a, the wind condition was the hub height mean wind speed with 50-year return period; the wave condition was the extreme significant wave height with 50-year return period; the current condition was the extreme current speed with 50-year return period; the water level condition was the extreme water level with 50-year return period [43]. The environmental conditions of Chang-Bin offshore wind farm are collected in Table 5. The BLADED software was used to calculate the lateral force in wind direction H , the moment M , the vertical force V , the lateral displacement u , and the time-series of the rotation angle θ on the surface before scour occurred and after scour happened. At the time t M , m a x in Figure 10 and Figure 11, the maximum moment applied on pile head can be obtained. The pile head deformation ( u ,   θ ) t M , m a x corresponded to the pile head loading ( H ,   M m a x , V ) t M , m a x are determined. Maximum pile head loading ( H ,   M m a x , V ) t M , m a x with different scour depth are documented in Table 6, where the extreme loading condition calculated with unmodified p-y curve are also presented. Figure 12 and Figure 13 show the relationships between scour depth S d , lateral displacement of pile head u , and rotation angle θ .
As shown in Figure 12 and Figure 13, the lateral defection and rotation of the pile head derived from a modified or unmodified p - y curve increase with scour depth. Before scour occurred (i.e., S d = 0 D ), the initial modulus of subgrade reaction n h based on the modification formula proposed by Sørensen [11] was smaller than the value suggested by API [6] (Figure 3). Therefore, the lateral deflection and rotation of the pile head based on the modified p - y curve was greater than the values based on the unmodified p - y curve. After scour occurred, the ultimate soil resistance p u obtained according to Lin et al. [25] was greater than the value suggested by API [6]. Thus, the lateral deflection and rotation of the pile head based on the modified p - y curve was lower than the value based on the unmodified p - y curve as scour depth increased to approximately 5 to 6 m. If the formula suggested by API [6] were used to calculate the lateral deflection and rotation of pile head, then the deformation level would be underestimated for a scour depth shallower than 5 to 6 m and the deformation level would be overestimated for a scour depth greater than 5 to 6 m. The foundation stiffness would be underestimated for a scour depth greater than 5 to 6 m when the formula suggested by API [6] were used.

6.3 Discussion

The p - y curve method suggested by API [6] underestimates the initial stiffness of p - y curve E p y and does not consider the geometric shape of a scour hole due to local scour. Therefore, in this study, regarding the initial modulus of subgrade reaction n h and the ultimate soil resistance p u , we compared various modification methods proposed by various researchers and modified the initial stiffness of p - y curve E p y according to Sørensen [11]. In addition, according to Lin et al. [25], we incorporated the geometric shape of a scour hole into the ultimate soil resistance p u to obtain a modified p-y curve. The initial stiffness of the load-displacement curve was used as foundation stiffness and included in the dynamic model. Finally, we analyzed the lateral deflection and rotation for various scour depths under the ULS condition; the results served as a reference for design procedure which consider scour. For a monopile, if the p-y curve suggested by API [6] is used to calculate the pile head deformation, the pile head deformation will be underestimated before scour occurs and the pile head deformation will be overestimated after scour occurs. According to the case analysis, when scour depth is 1.5D, deviations for the lateral deflection and rotation of pile head reach 19% and 13% when the unmodified p-y curve is adopted. Therefore, we suggest that the computation procedure established in this study can be considered in foundation design for monopile unprotected against scour.

7. Conclusions

In this study, we compared various modification methods for assessing the influence of pile diameter on the load-displacement response of a monopile foundation with scour. The existing suggested modification for p-y curves when scour occurred around small-diameter pile are also evaluated. To calculate the deformation response of large-diameter monopile foundation with scour, the approach of Sørensen [11] who proposed to modify the initial modulus of subgrade reaction and Lin et al. [25] who proposed to modify the ultimate soil resistance are combined in this study. We proposed a method for calculating the load-displacement response of a monopile foundation and foundation stiffness when scour occurs. In addition, we used a 5-MW reference wind turbine developed at NREL and deployed at the Chang-Bin wind farm as an example to explain deformation responses of the support structure of the monopile foundation of an offshore wind turbine under the DLC 6.2a design loading condition; calculations covered cases with and without scour. According to the case analysis, when the p-y curve method suggested by the design guidelines for an offshore wind turbine was used to design the support structure of the monopile foundation for an offshore wind turbine, the foundation deformation was underestimated for a scour depth of less than pile diameter and foundation stiffness was underestimated for a scour depth of greater than pile diameter. Field measurements are still required to validate if the proposed model in this study is more accurate the design guideline. The results of this study can serve as a reference for the monopile foundation design for offshore wind farm in Taiwan.

Acknowledgments

The research was supported by the grants “Infrastructure Program of Offshore Wind Farm Zonal Development (106-D0601)”, The Bureau of Energy, Ministry of Economic Affairs of Taiwan.

Author Contributions

Yu-Shu Kuo conceived the study. Wei-Chen Tseng carried out the p-y curves analysis and case study. Yu-Shu Kuo and Wei-Chen Tseng collected and analysis the data. Jing-Wen Chen give some suggestion for the manuscript editing. Yu-Shu Kuo supervised the study and edited the manuscript. Yu-Shu Kuo is the Principal investigator of project “Infrastructure Program of Offshore Wind Farm Zonal Development (106-D0601)”.

Conflicts of Interest

The authors declare no conflict of interest.

References

  1. European Wind Energy Association. The European Offshore Wind industry—Key Trends and Statistics 2016; European Wind Energy Association: Brussels, Belgium, 2017. [Google Scholar]
  2. Lombardi, D.; Bhattacharya, S.; Wood, D.M. Dynamic soil–structure interaction of monopile supported wind turbines in cohesive soil. Soil Dyn. Earthq. Eng. 2013, 49, 165–180. [Google Scholar] [CrossRef]
  3. Arany, L.; Bhattacharya, S.; Macdonald, J.; Hogan, S.J. Design of monopiles for offshore wind turbines in 10 steps. Soil Dyn. Earthq. Eng. 2017, 92, 126–152. [Google Scholar] [CrossRef]
  4. Poulos, H.G.; Davis, E.H. Pile Foundation Analysis and Design; Wiley: Chichester, UK, 1980. [Google Scholar]
  5. Kuo, Y.S. On the Behavior of Large-Diameter Piles Under Cyclic Lateral Load. Ph.D. Thesis, Leibniz University, Hannover, Germany, 2008. [Google Scholar]
  6. API RP 2GEO. Geotechnical and Foundation Design Considerations; American Petroleum Institute: Washington, DC, USA, 2011. [Google Scholar]
  7. Standard DNVGL-ST-0126. Support Structures for Wind Turbines; DNVGL AS: Oslo, Norway, 2016. [Google Scholar]
  8. Abdel-Rahman, K.; Achmus, M. Finite element modelling of horizontally loaded monopile foundations for offshore wind energy converters in Germany. In Proceedings of the First International Symposium on Frontiers in Offshore Geotechnics, Perth, Australia, 19–21 September 2005; Taylor and Francis: Boca Raton, FL, USA; pp. 391–396. [Google Scholar]
  9. Lesny, K.; Wiemann, J. Finite-element-modelling of large diameter monopiles for offshore wind energy converters. In Proceedings of the GeoCongress 2006, Atlanta, GA, USA, 26 February–1 March 2006; American Society of Civil Enginering: Reston, VA, USA; pp. 1–6. [Google Scholar]
  10. Sørensen, S.P.H.; Ibsen, L.B.; Augustesen, A.H. Effects of diameter on initial stiffness of py curves for large-diameter piles in sand. In Proceedings of the European Conference on Numerical Methods in Geotechnical Engineering, Trondheim, Norway, 2–4 June 2010; pp. 907–912. [Google Scholar]
  11. Sørensen, S.P.H. Soil-Structure Interaction for Non-Slender, Large-Diameter Offshore Monopiles. Ph.D. Thesis, Aalborg University, Aalborg, Denmark, December 2012. [Google Scholar]
  12. Kallehave, D.; Thilsted, C.L.; Liingaard, M.A. Modification of the API py Formulation of Initial Stiffness of Sand, Offshore Site Investigation and Geotechnics: Integrated Technologies-Present and Future; Society of Underwater Technology: London, UK, 2012. [Google Scholar]
  13. Sumer, B.M.; Fredsøe, J. The Mechanics of Scour in the Marine Environment; World Scientific: Singapore, 2002. [Google Scholar]
  14. Whitehouse, R.; Sutherland, J.; O’Brien, D. Seabed scour assessment for offshore windfarm. In Proceedings of the 3rd International Conference on Scour and Erosion, Gouda, The Netherlands, 3–5 July 2006. [Google Scholar]
  15. Li, Y.; Chen, X.; Fan, S.; Briaud, J.L.; Chen, H.C. Is scour important for pile foundation design in deepwater? In Proceedings of the Offshore Technology Conference, Houston, TX, USA, 4–7 May 2009. [Google Scholar]
  16. Qi, W.G.; Gao, F.P. Physical modeling of local scour development around a large-diameter monopile in combined waves and current. Coast. Eng. 2014, 83, 72–81. [Google Scholar] [CrossRef]
  17. Design of Offshore Wind Turbine Structures; DNV-OS-J101; Det Norske Veritas AS: Oslo, Norway, 2004.
  18. Achmus, M.; Kuo, Y.S.; Abdel-Rahman, K. Numerical investigation of scour effect on lateral resistance of windfarm monopiles. In Proceedings of the Twentieth International Offshore and Polar Engineering Conference, Beijing, China, 20–25 June 2010. [Google Scholar]
  19. Kishore, Y.N.; Rao, S.N.; Mani, J.S. The behavior of laterally loaded piles subjected to scour in marine environment. KSCE J. Civ. Eng. 2009, 13, 403–408. [Google Scholar] [CrossRef]
  20. Sorensen, S.P.H.; Ibsen, L.B. Assessment of foundation design for offshore monopiles unprotected against scour. Ocean Eng. 2013, 63, 17–25. [Google Scholar] [CrossRef]
  21. Prendergast, L.J.; Hester, D.; Gavin, K.; O’Sullivan, J.J. An investigation of the changes in the natural frequency of a pile affected by scour. J. Sound Vib. 2013, 332, 6685–6702. [Google Scholar] [CrossRef]
  22. Prendergast, L.J.; Gavin, K.; Doherty, P. An investigation into the effect of scour on the natural frequency of an offshore wind turbine. Ocean Eng. 2015, 101, 1–11. [Google Scholar] [CrossRef]
  23. Zaaijer, M.B. Design Methods for Offshore Wind Turbines at Exposed Sites (OWTES)—Sensitivity Analysis for Foundations of Offshore Wind Turbines; Delft University of Technology: Delft, The Netherlands, 2002. [Google Scholar]
  24. Lin, C.; Bennett, C.; Han, J.; Parsons, R.L. Scour effects on the response of laterally loaded piles considering stress history of sand. Comput. Geotech. 2010, 37, 1008–1014. [Google Scholar] [CrossRef]
  25. Lin, C.; Han, J.; Bennett, C.; Parsons, R.L. Analysis of laterally loaded piles in sand considering scour hole dimensions. J. Geotech. Geoenviron. Eng. 2014, 140, 04014024. [Google Scholar] [CrossRef]
  26. Taiwan Power Company. Development of Monitoring Database and Application Module for Meteorology Mast; Taiwan Power Company: Taipei, Taiwan, 2017. [Google Scholar]
  27. Recommended Practice for Planning, Designing and Constructing Fixed Offshore Platforms—Working Stress Design; API RP2A-WSD; American Petroleum Institute: Washington, DC, USA, 2007.
  28. Titze, E. Über Den Seitlichen Bodenwiderstand Bei Pfahlgründungen. Bauingenieur-Praxis, 77; Ernst & Sohn: Berlin, Germany, 1970. [Google Scholar]
  29. Achmus, M.; Thieken, K.; Lemke, K. Evaluation of p-y approaches for large diameter monopiles in sand. In Proceedings of the Twenty-fourth International Ocean and Polar Engineering Conference, Busan, Korea, 15–20 June 2014. [Google Scholar]
  30. Brinkgreve, R.B.J.; Engin, E.; Swolfs, W.M. PLAXIS 3D 2013 Manual; Plaxis: Delft, The Netherlands, 2013. [Google Scholar]
  31. DNV/Risø. Guidelines for Design of Wind Turbines, 2nd ed.; Jydsk Centraltrykkeri: Viby, Denmark, 2002. [Google Scholar]
  32. Reese, L.C.; Cox, W.R.; Koop, F.D. Analysis of laterally loaded piles in sand. In Offshore Technology in Civil Engineering Hall of Fame Papers from the Early Years; American Society of Civil Engineers: Reston, VA, USA, 1974; pp. 95–105. [Google Scholar]
  33. Roulund, A.; Sumer, B.M.; Fredsøe, J.; Michelsen, J. Numerical and experimental investigation of flow and scour around a circular pile. J. Fluid Mech. 2005, 534, 351–401. [Google Scholar] [CrossRef]
  34. Nielsen, A.; Hansen, E. Time-varying wave and current-induced scour around offshore wind turbines. In Proceedings of the ASME 2007 26th International Conference on Offshore Mechanics and Arctic Engineering, San Diego, CA, USA, 10–15 June 2007; pp. 399–408. [Google Scholar]
  35. Qi, W.G.; Gao, F.P.; Randolph, M.F.; Lehane, B.M. Scour effects on p–y curves for shallowly embedded piles in sand. Geotechnique 2016, 66, 648–660. [Google Scholar] [CrossRef]
  36. Zaaijer, M.B. Foundation modelling to assess dynamic behaviour of offshore wind turbines. Appl. Ocean Res. 2006, 28, 45–57. [Google Scholar] [CrossRef]
  37. Jonkman, J.; Musial, W. Offshore Code Comparison Collaboration (OC3) for IEA Wind Task 23 Offshore Wind Technology and Deployment; National Renewable Energy Laboratory: Golden, CO, USA, 2010.
  38. Bush, E.; Manuel, L. The influence of foundation modeling assumptions on long-term load prediction for offshore wind turbines. In Proceedings of the ASME 28th International Conference on Ocean, Offshore and Arctic Engineering, Honolulu, HI, USA, 31 May–5 June 2009; pp. 1075–1083. [Google Scholar]
  39. Arany, L.; Bhattacharya, S.; Adhikari, S.; Hogan, S.J.; Macdonald, J.H.G. An analytical model to predict the natural frequency of offshore wind turbines on three-spring flexible foundations using two different beam models. Soil Dyn. Earthq. Eng. 2015, 74, 40–45. [Google Scholar] [CrossRef]
  40. Jung, S.; Kim, S.R.; Patil, A.; Hung, L.C. Effect of monopile foundation modeling on the structural response of a 5-MW offshore wind turbine tower. Ocean Eng. 2015, 109, 479–488. [Google Scholar] [CrossRef]
  41. Wang, Y.K.; Chai, J.F.; Chang, Y.W.; Huang, T.Y.; Kuo, Y.S. Development of seismic demand for chang-bin offshore wind Farm in Taiwan strait. Energies 2016, 9, 1036. [Google Scholar] [CrossRef]
  42. Garrad Hassan and Partners Ltd. Bladed User Manual, version 4.5; Garrad Hassan & Partners Ltd.: Bristol, UK, 2013. [Google Scholar]
  43. Wind Turbines—Part 3: Design Requirements for Offshore Wind Turbines; IEC 61400-3; International Electrotechnical Commission: Geneva, Switzerland, 2009.
Figure 1. Relationship of the initial modulus of subgrade reaction, the effective friction angle, and relative density.
Energies 10 01190 g001
Figure 2. Various p-y curves for different depth values under dense sand, given that D equals 6 m.
Energies 10 01190 g002
Figure 3. Schematic for the influence of scour on effective stress (suggested by API [6] and Zaaijer [23]).
Energies 10 01190 g003
Figure 4. Schematic for damaged soil at a depth of z below the mudline before scour and the p-y curves (suggested by Lin et al. [25]).
Energies 10 01190 g004
Figure 5. Relationship between the ultimate soil resistance at depth of 0.5 D below the bottom of the scour hole and the scour depth.
Energies 10 01190 g005
Figure 6. p-y curves for various scour depths at depth of 0.5D below the bottom of the scour hole. (a) D = 1 m; (b) D = 6 m.
Energies 10 01190 g006
Figure 7. Coupled spring model for the foundation of offshore wind turbine.
Energies 10 01190 g007
Figure 8. Load-displacement curve at pile head with D = 6 m and L = 36 m for dense sand. (a) y (m)-H (kN); (b) θ (rad)-H (kN); (c) y (m)-M (KN-m); (d) θ (rad)-M (kN-m).
Energies 10 01190 g008
Figure 9. Schematic for the 5 MW offshore wind turbine developed at National Renewable Energy Laboratory (NREL).
Energies 10 01190 g009
Figure 10. Loading time-series at pile head before scour occurred; (H, Mmax, V)t=178.75s = (7192 kN, 263,835 kN-m, −8346 kN).
Energies 10 01190 g010
Figure 11. Loading time-series at pile head after scour occurred; (H, Mmax, V)t=71.45s = (5925 kN, 256,986 kN-m, −8304 kN).
Energies 10 01190 g011
Figure 12. Relationship between the lateral displacement of the pile head on the surface before scour occurred and scour depth.
Energies 10 01190 g012
Figure 13. Relationship between the pile head rotation on the surface before scour occurred and scour depth.
Energies 10 01190 g013
Table 1. Total lateral force exerted on the foundation pile at a depth of z’.
Depth (m)Total Lateral Force ( F u ) Exerted on the Pile
0   <   z   H 1 F u   =   F u 0
H 1   <   z   H 2 F u   =   F u 1
z >   H 2 F u   =   F u 2
Table 2. Data regarding the 5 MW offshore wind turbine developed at NREL.
PropertyValue
Cut-in, Rated, Cut-out wind speed(m/s)3, 11.4, 25
Cut-in, Rated rotor speed(rpm)6.9, 12.1
Rotor diameter(m)126
Hub height(m)90
Rotor, Nacelle, Tower mass(ton)110, 240, 347.5
Tower top diameter, Thickness(m)3.87, 0.019
Tower base diameter, Thickness(m)6, 0.027
Water depth(m)20
Pile diameter, Thickness, Length(m)6, 0.06, 36
Table 3. Soil data for the Chang-Bin wind farm.
Soil LayerDepth (m)Effective Unit Weight γ ( k N / m 3 )Friction Angle ϕ ′(°)Initial Modulus of Subgrade Reaction n h ( k N / m 3 )
Sand 10–10.88.529.55067
Sand 210.8–26.19.532.013,612
Sand 326.1–47.29.632.314,388
Sand 447.2–71.59.533.016,251
Table 4. The foundation stiffness matrix used in simulations.
Classification of p-y Curves Used in This StudyS/D00.511.5
Modified K u u ( kN / m )6.42 × 1057.84 × 1059.25 × 1051.07 × 106
K θ u ( m kN / m )7.52 × 1068.35 × 1069.18 × 1069.99 × 106
K u θ ( kN / rad )7.52 × 1068.35 × 1069.18 × 1069.99 × 106
K θ θ ( m kN / rad )1.40 × 1081.46 × 1081.51 × 1081.54 × 108
Unmodified K u u ( kN / m )8.94 × 1059.40 × 1051.00 × 1061.04 × 106
K θ u ( m kN / m )9.59 × 1069.93 × 1061.04 × 1071.07 × 107
K u θ ( kN / rad )9.59 × 1069.93 × 1061.04 × 1071.07 × 107
K θ θ ( m kN / rad )1.60 × 1081.62 × 1081.65 × 1081.67 × 108
Table 5. Environmental data for Chang-Bin wind farm under the IEC DLC 6.2a loading condition.
Loading ConditionValue
Extreme Wind Speed( m / s )60.9
Extreme Significant Wave Height( m )10.88
Extreme Current Speed( m / s )2.45
Extreme Water Level( m )4.01
Table 6. Maximum pile head loading and the corresponding time.
Classification of p-y Curves Used in This StudyS/D00.511.5
Modified t ( s )178.7571.371.45209.1
H ( kN )7192622459255972
M m a x ( kN m )262,941260,781256,986240,231
V ( kN )−8346−8277−8304−8357
Unmodified t ( s )178.571.25208.871.75
H ( kN )6956624364435248
M m a x ( kN m )263,835251,695237,848252,062
V ( kN )−8221−8333−8355−8394

