Article

An Economical Evaluation of Anaerobic Digestion Plants Fed with Organic Agro-Industrial Waste

by
Maurizio Carlini
1,
Enrico Maria Mosconi
1,
Sonia Castellucci
1,*,
Mauro Villarini
2 and
Andrea Colantoni
2
1
Department of Economic, Engineering, Society and Business Organization (DEIM), Tuscia University, 01100 Viterbo, Italy
2
Department of Agriculture and Forestry Science (DAFNE), Tuscia University, 01100 Viterbo, Italy
*
Author to whom correspondence should be addressed.
Energies 2017, 10(8), 1165; https://doi.org/10.3390/en10081165
Submission received: 26 May 2017 / Revised: 25 July 2017 / Accepted: 4 August 2017 / Published: 8 August 2017
(This article belongs to the Section L: Energy Sources)

Abstract

:
Anaerobic co-digestion technology is increasingly used to simultaneously treat solid and liquid organic waste to balance nutrient content, to reduce the negative effects of toxic compounds in the process, and to increase biogas yield. The aim of this study was to analyze the economic performance of co-digestion plants fed with agro-industrial wastes as a function of installed power, with a method of discounted cash flow. The study focused on Italian framework conditions concerning payment for electricity produced by anaerobic digestion (AD) plants as well as the production costs. The economic analysis was carried out using three different plant sizes: 100 kW, 500 kW, and 1000 kW, which are representative of biogas plants in Italy. The study showed that the improvement of the break-point is closely linked to the increase in corresponding plant size. Given the assumptions of the simulation, the payback for the 100 kW plant was nine years for both the all-inclusive tariff and the basic feed-in tariff (BFT). Regarding the 500 kW and 1000 kW plants, the payback periods were five and four years, respectively.

1. Introduction

In Italy, a remarkable development of renewable sources for the production of electrical and thermal energy has been registered in recent years. In 2014, the total gross consumption of energy was 118.6 MTOE (milloin tons of oil equivalent), of which the share of consumption covered by renewable sources was 17.1%, in line with the target assigned to Italy by Directive 2009/28/EC for 2020 [1]. In Italy, there are 656,000 plants with a total installed capacity of 50,594 MW that contribute to the production of electricity [1]. In terms of gross production, this has increased from 54,472 GWh in 2001 to 120,679 GWh in 2014, with an increased contribution of bio-energy [1].
Bio-energy is energy produced from plants fed with solid bio-fuel, biogas, and bio-liquids. In particular, anaerobic digestion (AD) plants have been greatly developed; in 2014, they recorded a gross production amount of 8199 GWh, which was an increase of 10.1% compared to 2013, mainly due to plants using animal waste and byproducts from the food and agro-industrial sectors [1].
In the first six months of 2015, there was a total of 414 biogas plants that requested government incentives (related to the production of electricity from renewable sources), and produced a total power of 159 MW. The analysis of the data published by Electrical Services Manager Italian, Gestore Servizi Energetici (GSE), showed that from 2013, a steady growth of AD plants with an average power less than 1 MW was observed [2].
In Italy, the use of financial incentives related to the production of electricity from renewable sources has led to the development of smaller bio-energy plants as these have not only the highest incentives, but also the fastest access [3].
AD is considered as one of the most suitable processes for the management of residual biomass from an environmental and energy perspective. In addition to the production of biogas, the digestate can be used as a fertilizer, so the process makes it possible to completely eliminate pathogens [4,5,6]. Organic waste sent to landfills generates uncontrolled methane and carbon dioxide emissions associated with decomposition. Using these wastes in AD processes results in a reduction in greenhouse emissions [7,8].
Furthermore, the agro-industrial waste from the food industry may be stabilized by AD. It is estimated that the transformation of one ton of raw agricultural material generates from 30–100 kg of organic waste [9]. In particular, residues from the olive oil industry are an excellent feed for AD plants, as this waste is produced in high quantity during a short period, and is not biodegradable due to the high concentration in organic and phenolic compounds [10,11]. The waste derived from olive mills can be divided into two components: olive mill wastewater (OMWW) and olive mill solid waste (OMSW) [12,13]. The composition and quantity of this waste is dependent on the olive oil extraction technology used [14]; however, in general the OMWW is composed of vegetation water and suspended solids, whereas the OMSW is made up of olive pulp, peel, pieces of pit, and oil content [15], which can be used in co-digestion processes with other biomass materials.
Anaerobic co-digestion technology is increasingly used to simultaneously treat solid and liquid organic waste to balance nutrient content, to reduce the negative effects of toxic compounds on the process, and to increase the biogas yield. Moreover, co-digestion technology contributes to a more efficient use of AD as multiple streams of waste can be processed in a single plant at the same time [16].
The use of OMSW (with pieces of pit) represents a very attractive economic possibility for small olive mills. From tests carried out with a batch-stirred tank reactor, the results of the OMSW (with pit) had better performance if used in co-digestion with other substrates [17].
Thus, the aims of this study were to analyze the economic performance of co-digestion plants characterized by the same feedstock, these being OMSW, cattle manure (CM), and cattle slurry (CS). Furthermore, economic assessments for three co-digestion systems with different istalled power sources were conducted. Our study focused on Italian framework conditions concerning payment for electricity as well as production cost. The impact of economic policy on biogas plants was also considered in the calculations, where for each size of the selected system, economic profitability (as a function of the two incentives provided for by Italian legislation, including tariffs and financial inducement (ministerial decree (MD) 6 July 2012)) was assessed.
A profitability calculation, as well as a comparison of key economic figures and the interactions of changing framework conditions on economics by sensitivity and break-even analysis, were conducted. The performed analysis aimed to provide support for both investment decisionmakers and political decisionmakers in the debate on future adjustments of bio-energy policies.

2. Materials and Methods

The economic analysis of the examined biogas plants as a time factor of future payments and dynamics business ratio aimed at illustrating the profitability of a specific investment for the entire time-frame of production to draw the most realistic picture of its economic performance [18]. These cost-benefit calculations were made based on well-defined input parameters from the literature or experimental results. Therefore, changes to the input parameters may affect the cost-benefit calculation, for example, differences in the type of feedstock used in the biogas system can cause variations not only of the operating costs, but also of the earnings related to energy production.

2.1. Feeding Practice and Technical Parameters of Co-Digestion Systems

More than 95% of biogas plants in Italy have an installed electrical performance below 1 MW. Approximately 35% of plants reach an electrical performance between 70 and 100 kW, which directly relate to government incentives; 30% are between 100 and 500 kW; and 30% are have 1 MW capacity [2]. Based on these data, model calculations were conducted for three different plant sizes: 100 kW, 500 kW, and 1 MW (Combined Heat and Power (CHP) size).
For the three plant sizes, the same feeding strategies were considered, these being OMSW, CM, and CS.
In a previous study described in reference [18], the optimization of bio-methane potential (BMP) from the anaerobic co-digestion of OMSW, CM, and CS were analyzed. The OMSW used for the analysis was a waste product from a three-phase olive oil processing system mostly used in Italy for oil extraction. Biomass energy characterization was undertaken and a batch-stirred tank reactor was used under mesophilic conditions (38 °C) to study the biogas yield. The entire process was carried out under wet conditions with a hydraulic retention time (HRT) of 55 days [12]. The properties of the feedstocks used in the reactor are provided in Table 1.
The evaluation of BMP was undertaken by considering the percentage of volatile solids contained in the biomass used for feeding. For each of the analyzed plant models, technical parameters were defined (Table 2) and CHP efficiency, in functions of growing size and operating hours, were specified [19]. Further technical parameters such as the average biomass retention time, the amount of biomass to be used, the fermented volume, or internal electricity and heat needs were also evaluated for each specific substrate used.
For mesophilic biogas systems, the average retention time included was between 50 and 55 days [12]. The required biomass quantities were calculated from the results obtained from the experimental campaign conducted in the laboratory. Experimental tests were carried out in a batch reactor at a temperature of 50 °C [12].
As a function of the biomass used and the hydraulic retention time obtained from the experimental campaign, the volumes of the reactors were calculated:
V = H R T · q
where HRT is the average retention time (d); and q is the flow rate (m3/d).
The electricity needs of the process were considered equal to 2% of the total electricity generated [20], and process heat needs were evaluated as equal to 25%, as reported in the literatures [19,20].

2.2. Economic Parameters and Economic Simulation Model

Several parameters influencing economic performance were determined [21]. The labor time requirement was set between 4.5 and 7.5 h day−1 for each work unit, depending on the plant size. Gross labor wage was specified at seven € h−1 as per standard data for the agricultural wage rate in Italy [22].
Depending on the process used, it was either advantageous to use electricity generated by the CHP of the biogas plant, or to purchase power. In cases where the electricity needs were satisfied by electricity generated by the CHP, then no cost was charged. Additionally, the net electric power fed into the grid was calculated by also considering the self-consumption of the plant.
Regarding the cost of feedstock, only transportation cost were considered since waste were used [23].
Regarding earnings, only those related to grid feed-in were considered. These earnings were mostly due to the free-market sale of the produced electricity and by the incentive rates provided by the Italian government. There are three ways to access the electricity incentives provided by the Italian government [3]: direct access to incentives for biogas plants with power less than 100 kW; registration at computer registers for biogas power plants with power not exceeding 5 MW; and participation in auction procedures for power plants higher than 5 MW.
The basic feed-in tariff (BFT) is calculated as a function of plant size, based on the production of electrical energy supplied to the grid, and the type of feedstock. The zonal price of electricity is not considered, that is the payment of electricity supplied to the grid. The basic rate only considers the production of energy from renewable sources without considering the cost of energy in the free electricity market. The BFT is guaranteed for a period of 20 years, and may be accessed by any biogas power plant.
In place of the basic tariff, the producers of electricity from renewable sources (for plants with power less than 1 MW) may access the all-inclusive feed-in tariff (AIFT). The AIFT includes both incentive components relating to the enhancement of electricity fed into the grid and is guaranteed for a period of 15 years. Table 3 lists the tariffs used for the economic evaluation of the installations, where the BFT was considered as only the basic tariff and not the payment of the electricity supplied to the grid, which is included in the AIFT.
The methodology applied for the economic assessment was based on the comparison of each plant size, and an analysis of the investment value. Verification was undertaken considering both the BFT and the AIFT for each type of system.
The values in Table 3 show that the AIFT rate is higher than the BFT; however, there are substantial differences between the two incentive modes that may affect the economic evaluation of a power plant. The first is the incentive time, which ranges from 15 years for the AIFT to 20 years for the BFT; second, the price of electricity on the free energy market where the producer may choose to sell electricity at most economically advantageous price.
The method of discounted cash flow was applied to correlate the value of the plant with the capacity to produce a cash level adequate to meet the return expectations of an investor. The financial feasibility of a project was given the sum of cumulated discounted outflows with the cumulated discounted revenues from which the break-even point, BEP, of the investment was obtained.
The calculations for financial economic analysis and profitability of the investment were obtained using the business plan technique:
-
The cost categories and costs selected for setting up the business plan were divided into the ordinary costs for plant management and the financial costs for reimbursing the investment;
-
The cost structure contained in the business plan followed the model proposed by the Authorities for Electricity Gas and Water System (AEEG) [20];
-
The assumptions and the values adopted for the simulation were derived from the cost model for biogas production plants of the AEEG National Authority [20].
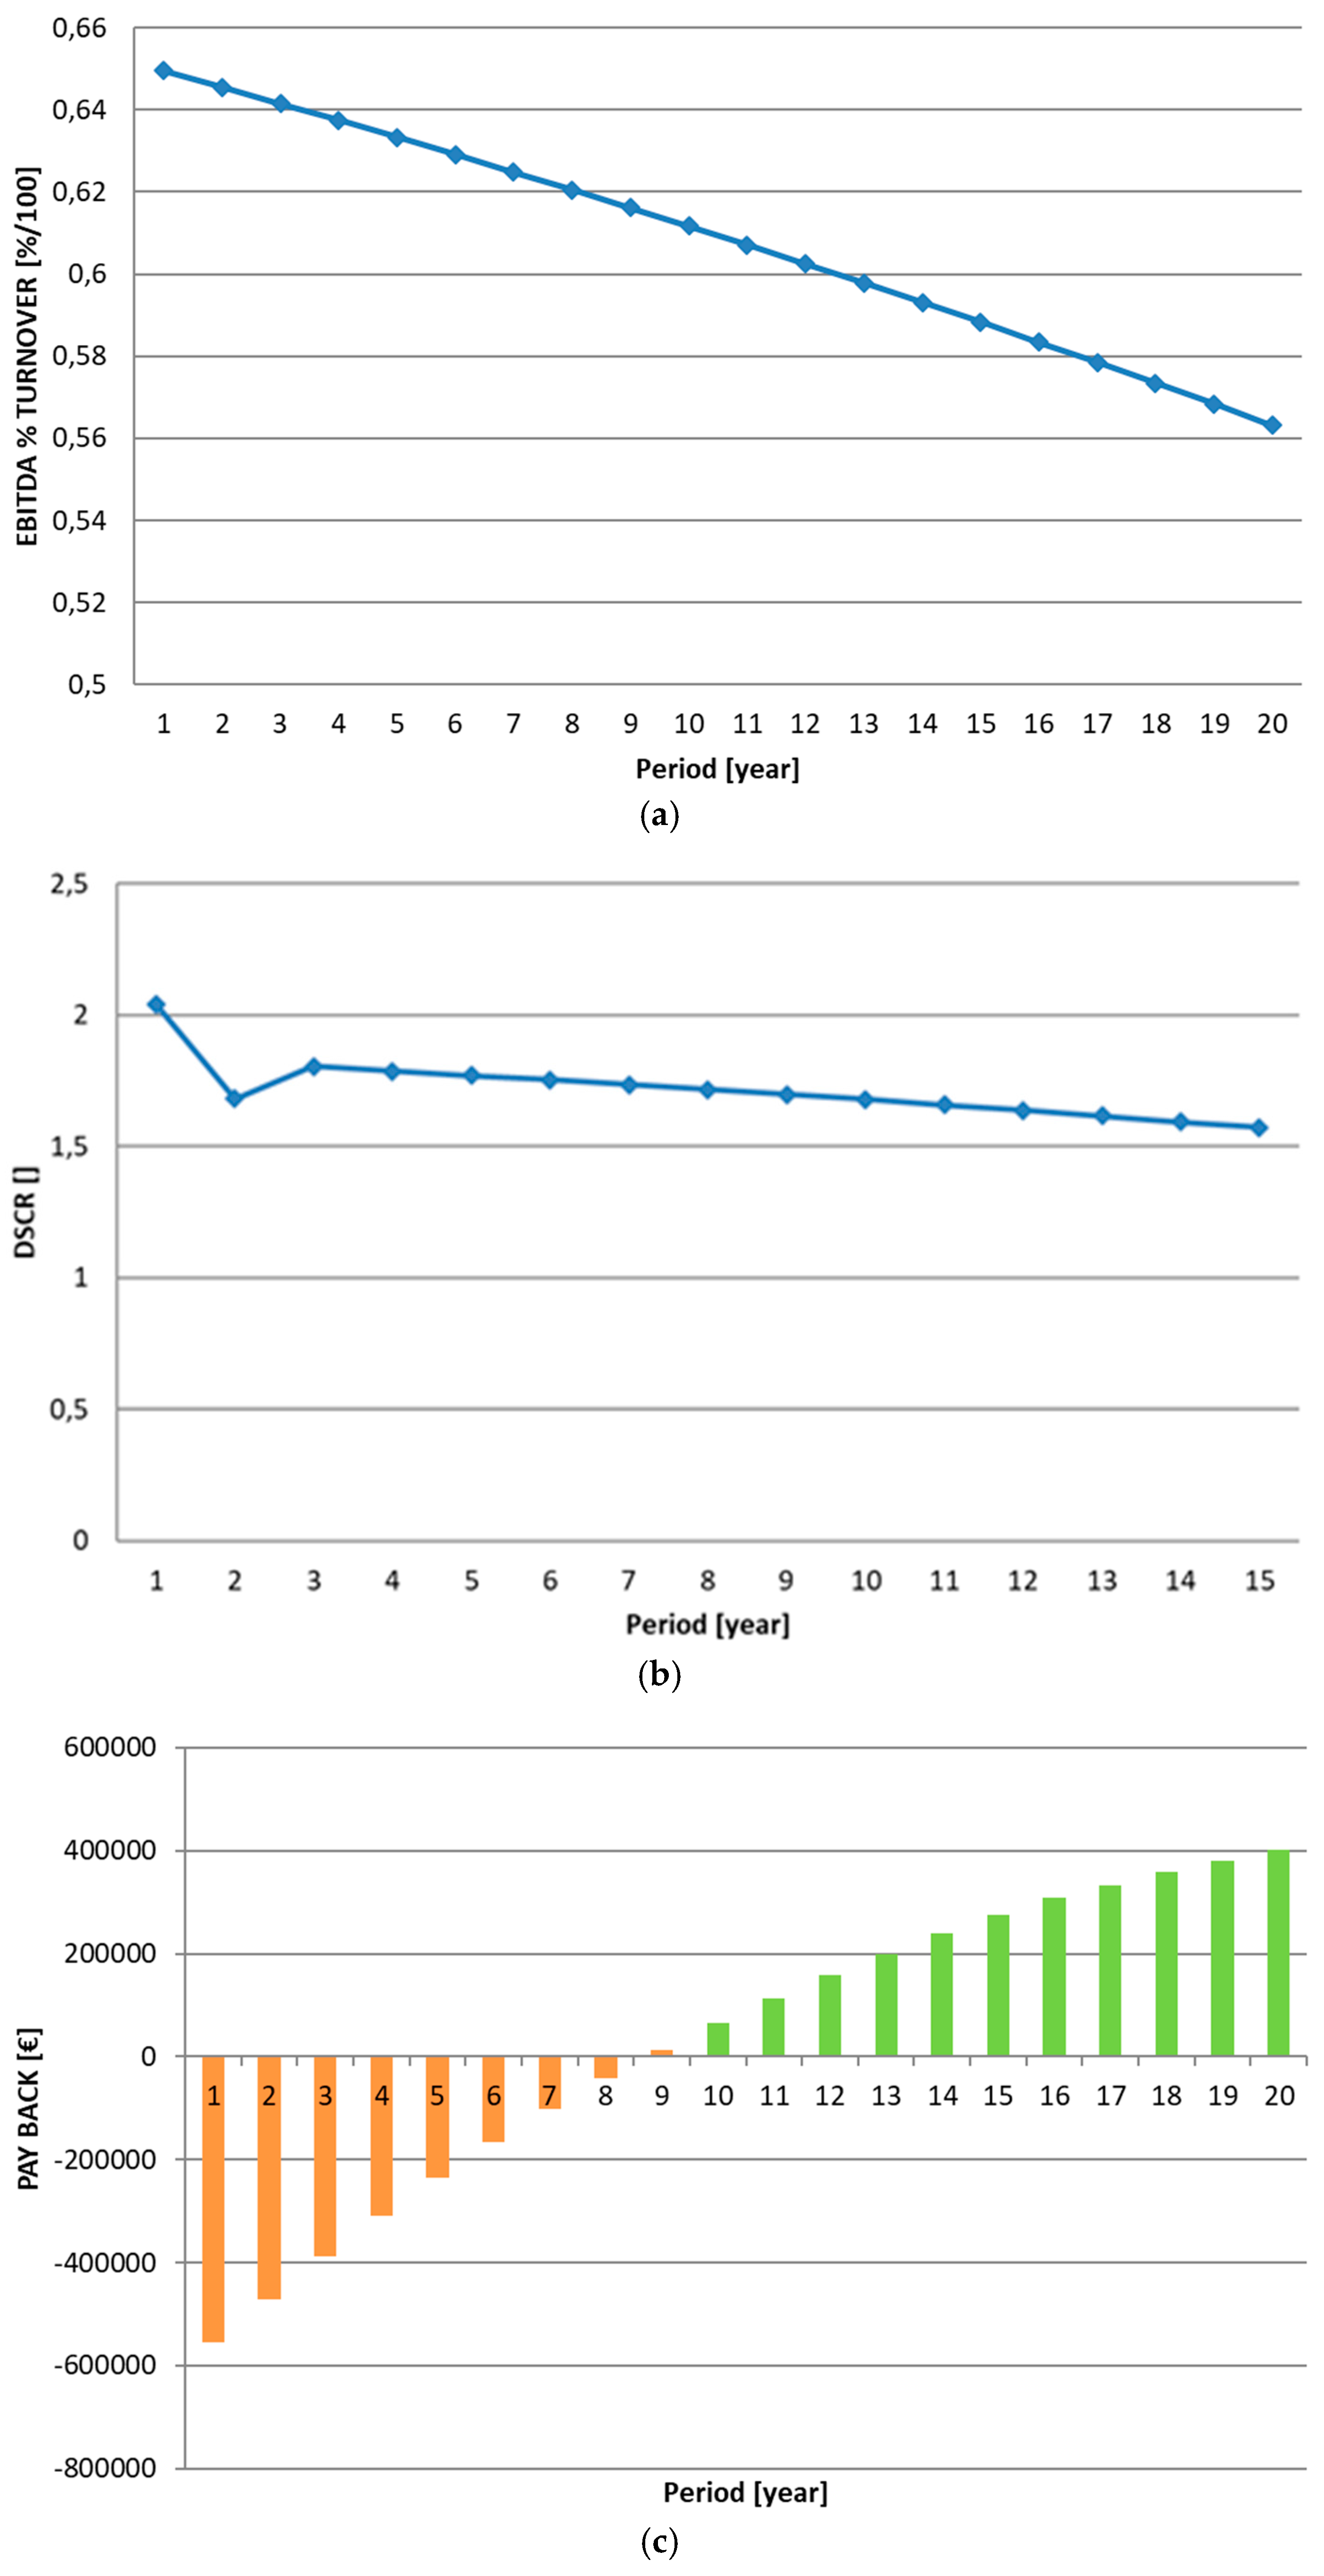
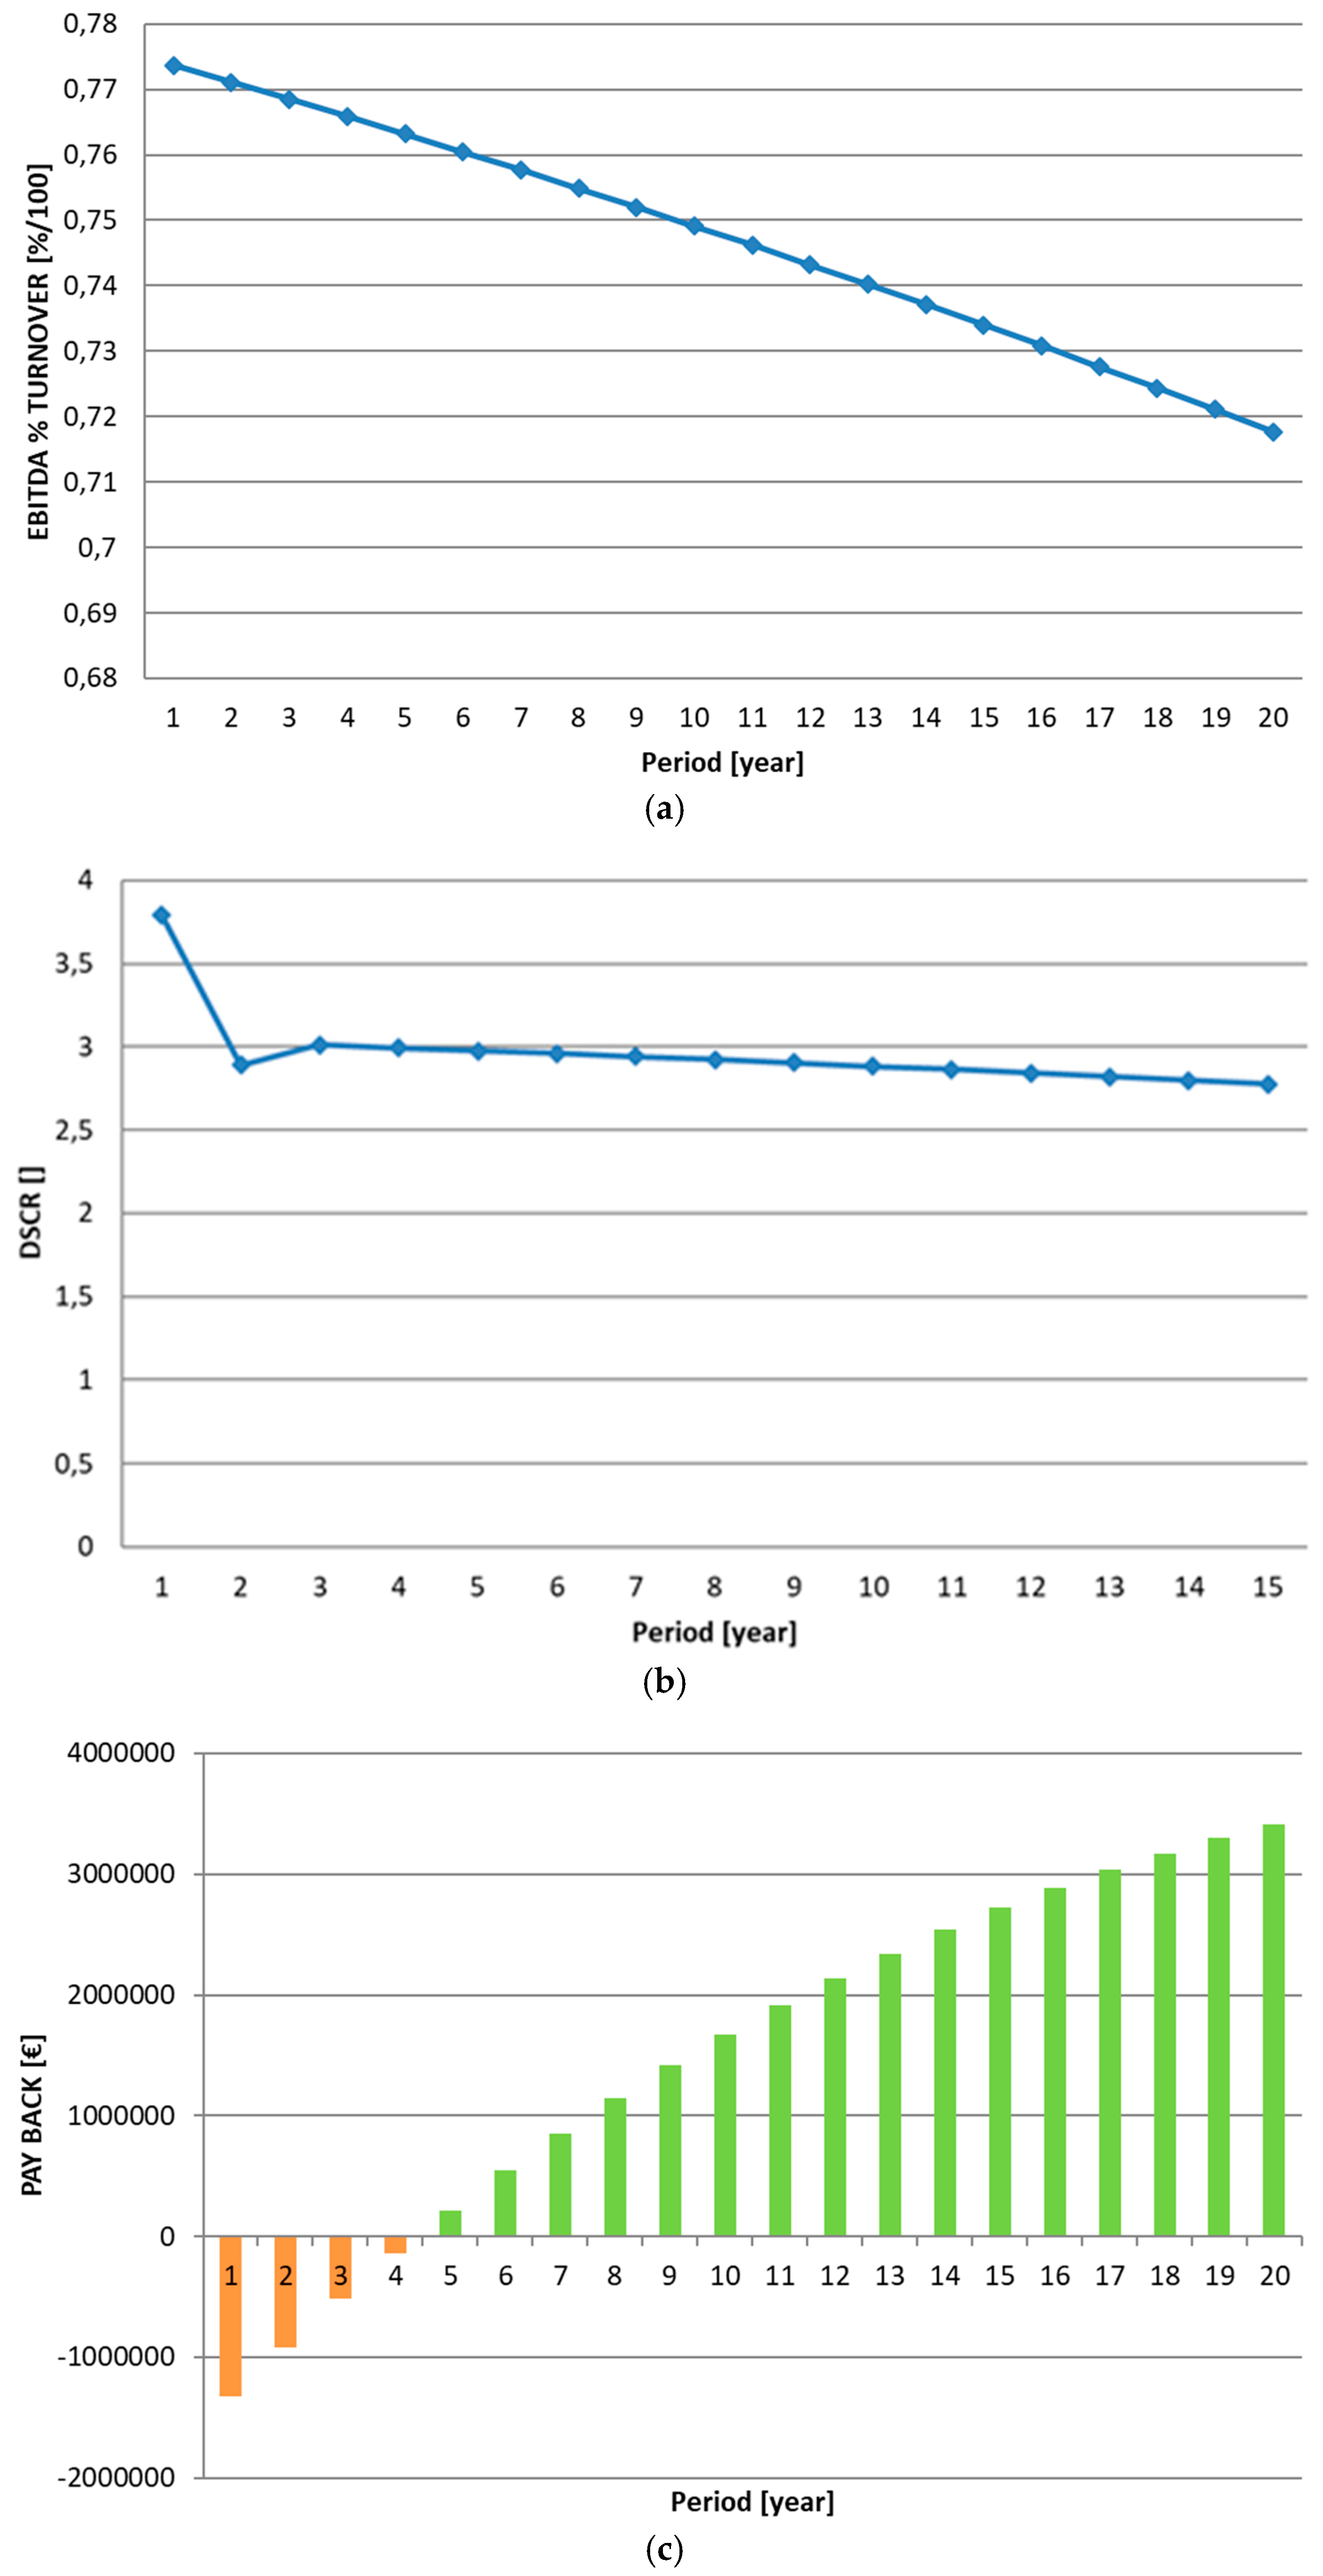
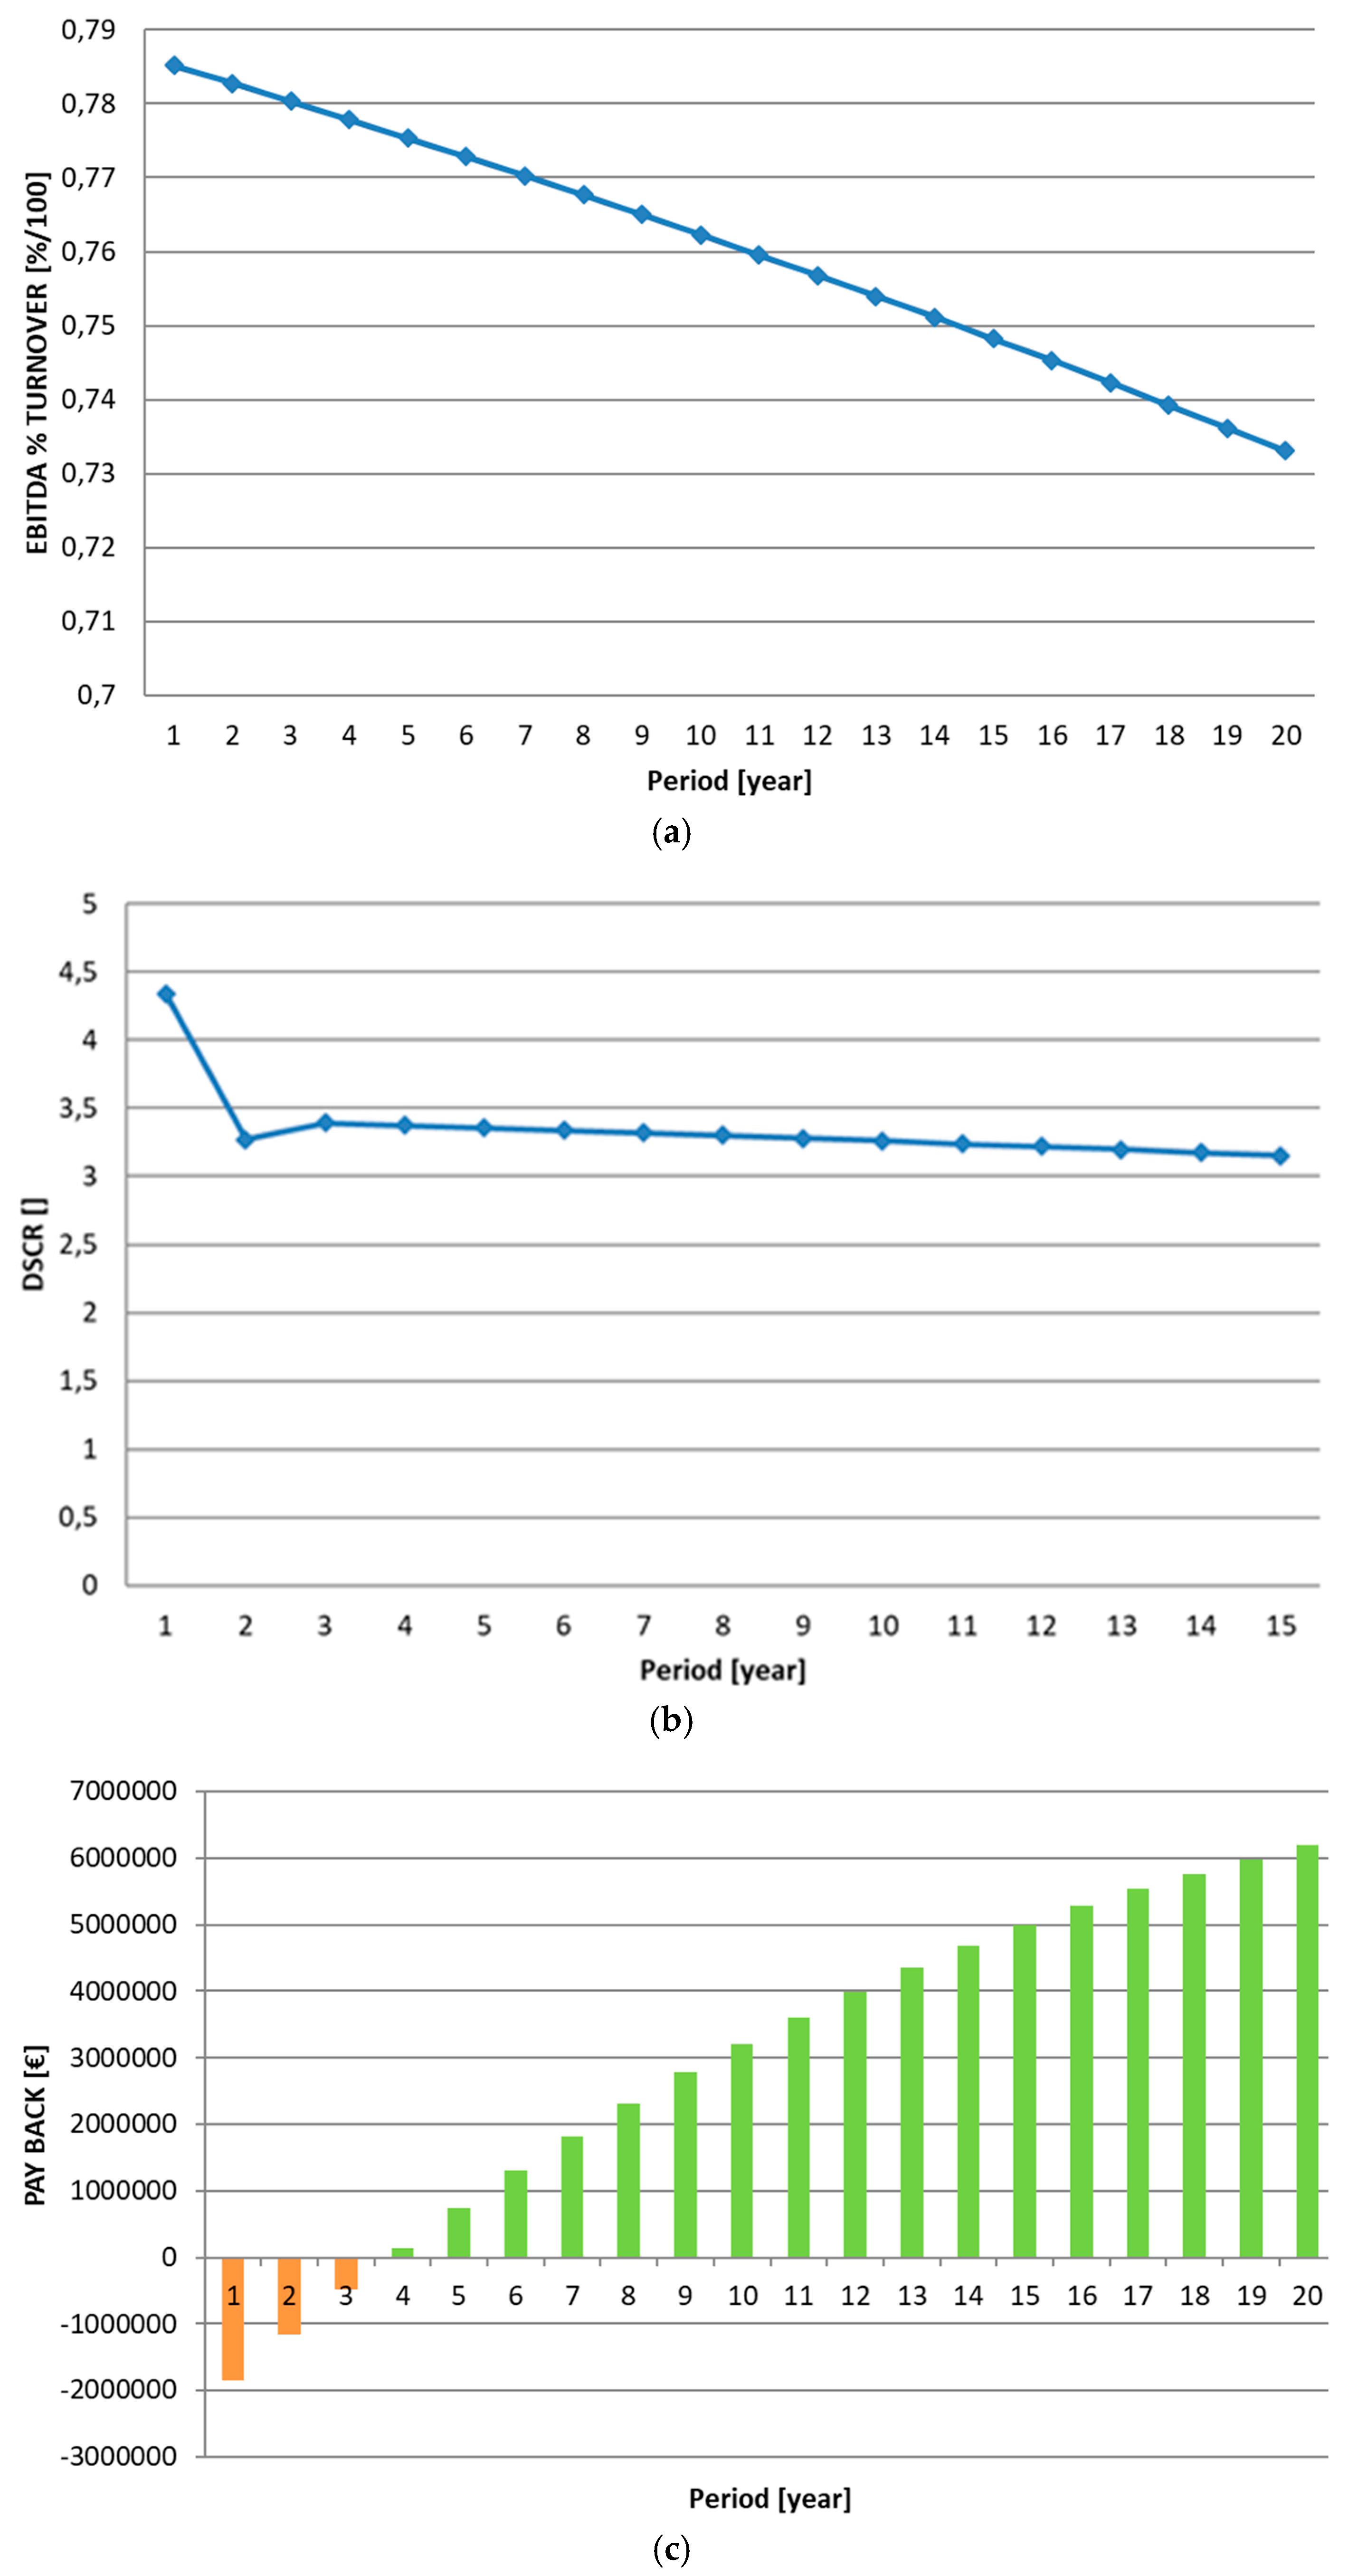
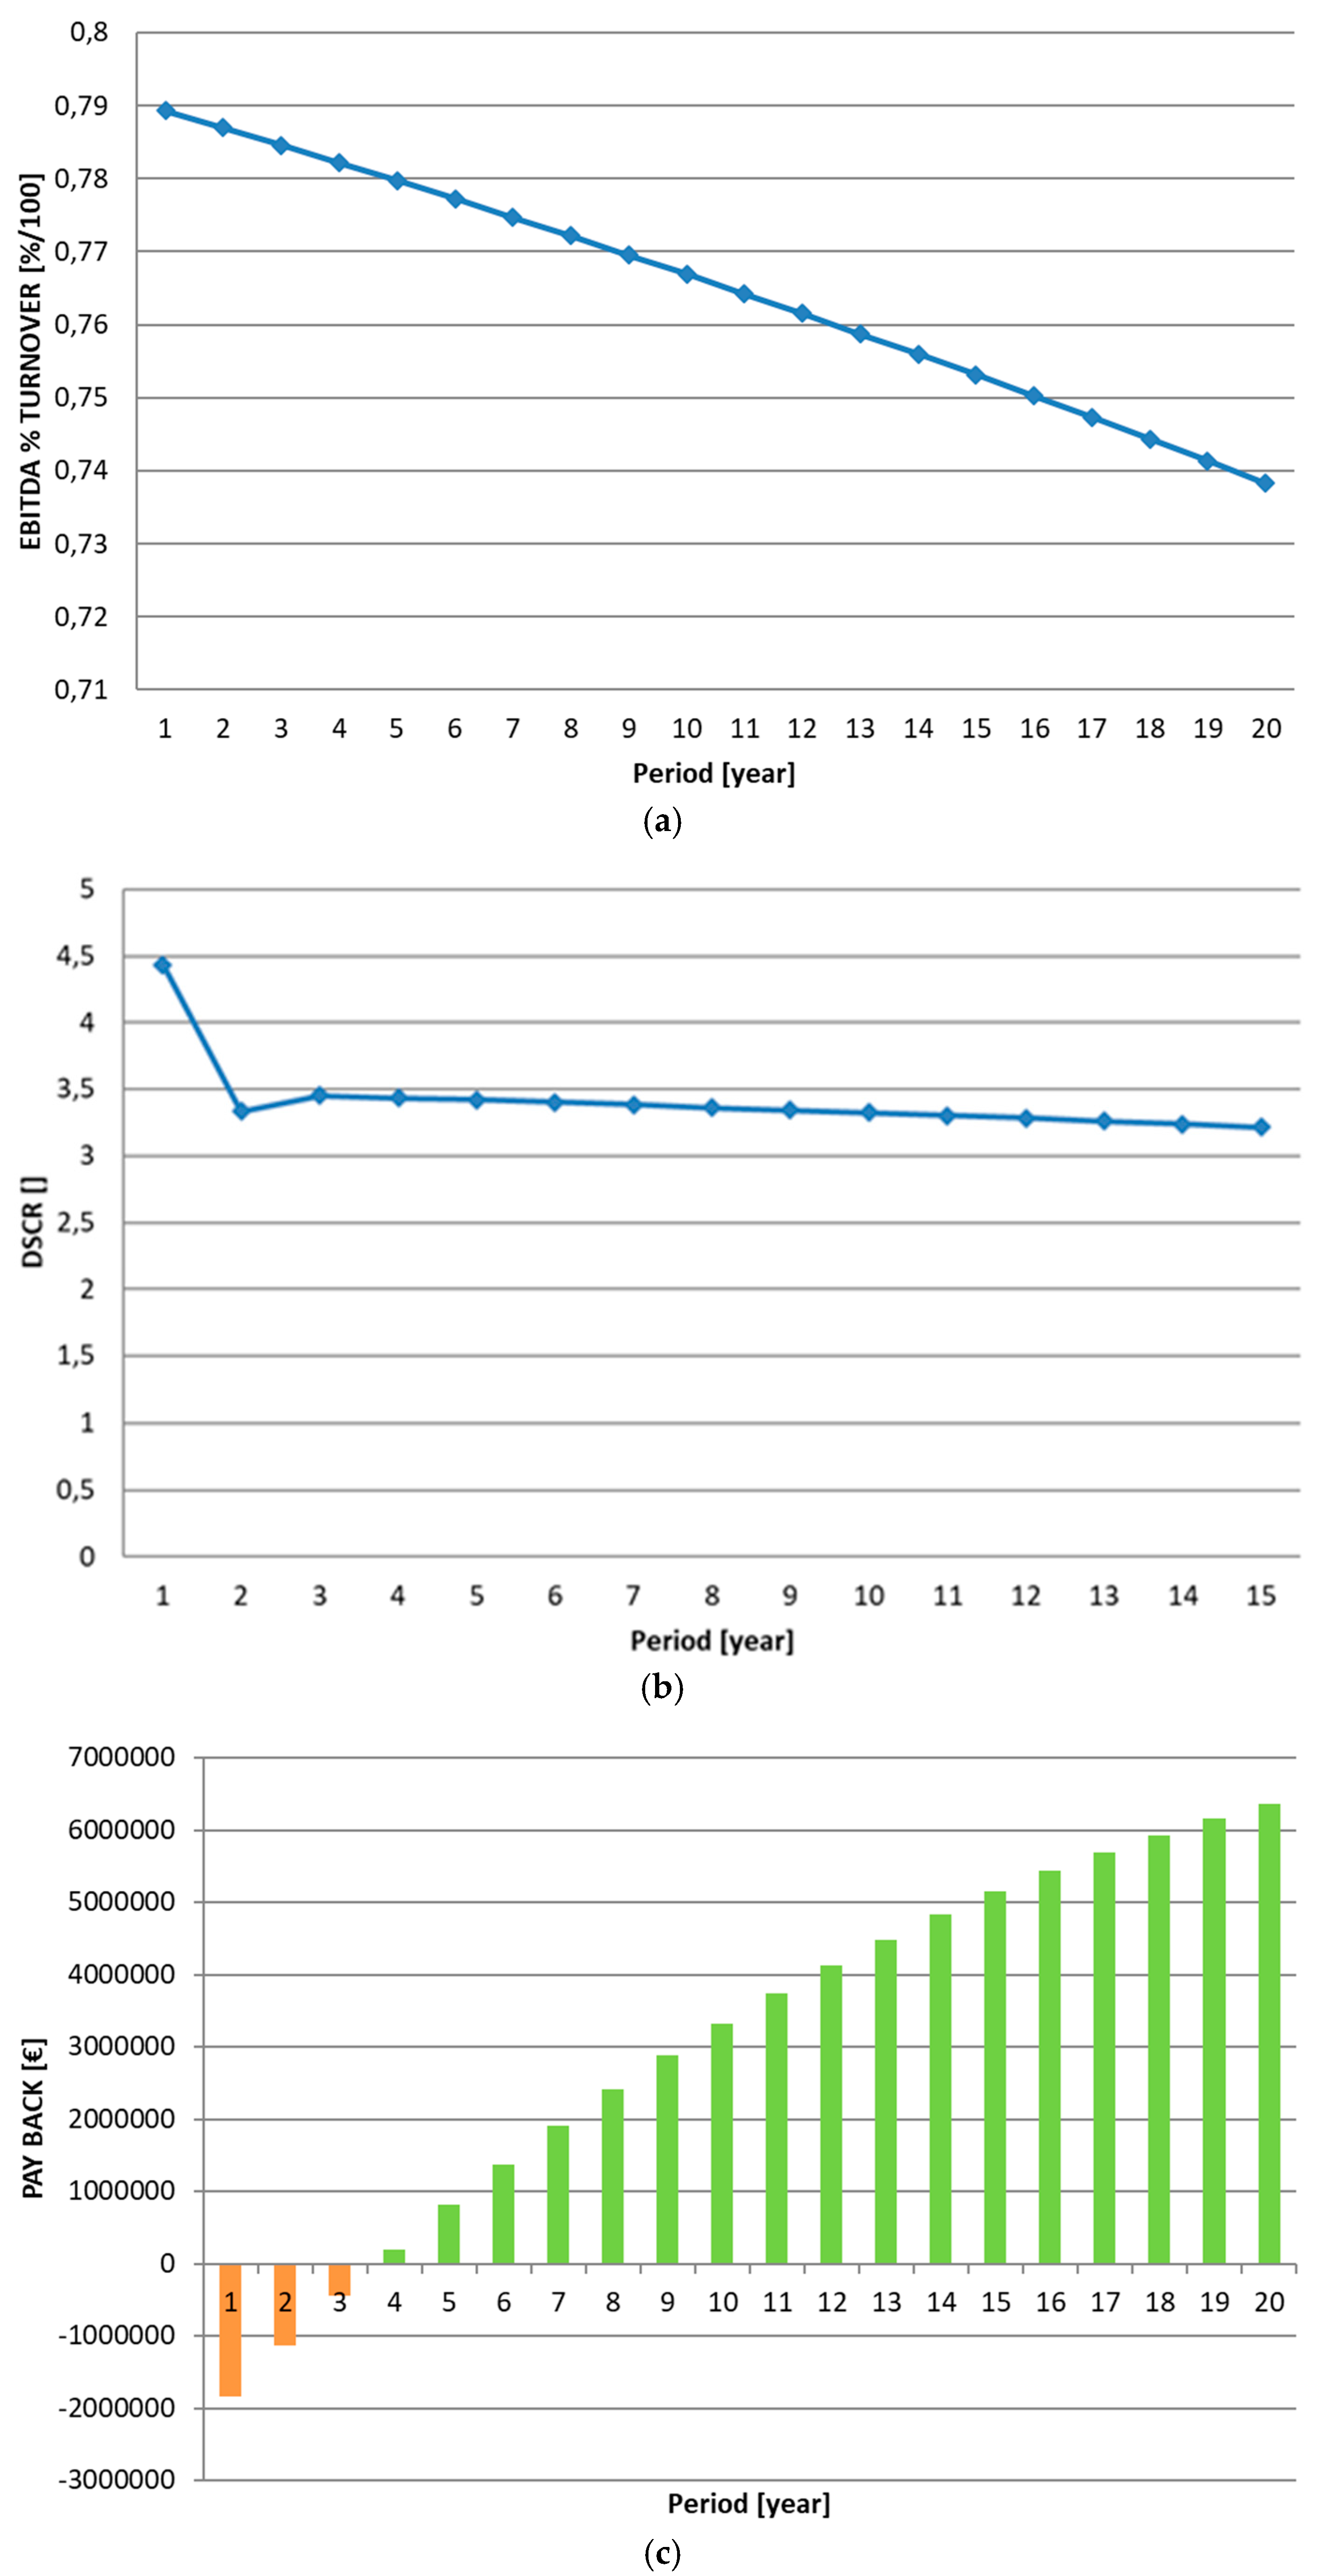
In addition, the analysis was based on the following economic indicators: earnings before interest, taxes, depreciation and amortization (EBITDA), debt service coverage ratio (DSCR), and the payback period.
The use of EBITDA provides the ability to generate an economic margin in terms of % by considering financial policies (interest income and expense) and budget techniques (amortization, depreciation, taxation). It is essential for profitability analysis both at a management level and to estimate the profitability of an investment and assists in the comparison to results from different companies operating in the same sector. Its application for each year (n) is given according to Equations (1) and (2):
EBITDA (n) = Added value (n)−Cost of employees (n)
EBITDA % = EBITDA (n)/Revenues (n) × 100
The DSCR measures the annual capacity of an activity to cover its debts, therefore highlighting how much of the investment can be financed through a financial structure (known as the bankability of the project):
DSCR = FCO/(Df (n) + I (n))
where FCO is the cash flow; Df is the principal repayments; I represents the interest payments; and n is the ith year.
Furthermore, the indicator can assume different values: DSCR > 1 (positive capacity), or DSCR < 1 (negative capacity) to finance the investment of expertise in year n.
The payback period represents the number of years needed to offset the investment, and the payback period of a given investment or project is an important determinant of whether to proceed with the position or project, as longer payback periods are typically not desirable for investment positions.
The analysis was based on the calculation of net present value (NPV) as the fundamental tool for selecting the optimal investment [24]. This method was applied to correlate the value of the plant with the ability to produce a level of financial flow adequate enough to meet an investor’s expectation of remuneration. The calculation was applied in the classical formula:
N P V = t = 0 n N C F t ( 1 + r ) t
where NCF are the cash flows from operating activities; t are the n years investment; and r is the discount rate.

3. Results

An evaluation of the costs for the three types of systems is presented in Table 4.
Furthermore, the annual cost related to financing must be added to these costs. The financing for the plant construction was assumed at 85%, consequently the equity was 15% for a 15-year period. The final interest rate of the loan was considered at 4.5% per year, and the rate was obtained from the average rates charged by banks for mortgage financing and consists of the Euribor rate at three-months (variable part) plus spreads, which were the stationary part of the interest. The discount rate, or the weighted average cost of capital (WACC) was set at 6%.
The break point (BP) was set at 20 years, the incentive duration. The sale price of electricity in the free market for 2017 was considered equal to €39.38/MWh [25,26,27,28].
The rate used to discount the expected cash flow was represented by the weighted average cost of capital, which reflected the specific risk of the activity in the energy sector, both operationally and financially. Royalties on sales were not considered.
To realize the model, the taxes that were considered concerned the income tax of the company at 31% of pre-tax income, plus the fees, concessions, and regional taxes quantified were a flat rate of €5000.
Results of the economic model for the 100 kW system as a function of the feed-in tariff are shown in Figure 1 and Figure 2. Results of the economic model for the 500 kW system as a function of the feed-in tariff are shown in Figure 3 and Figure 4. Finally, the results of the economic model for the 1000 kW system as a function of the feed-in tariff are shown in Figure 5 and Figure 6.

4. Conclusions

Anaerobic co-digestion technology is increasingly used to simultaneously treat solid and liquid organic waste with the aims of balancing the nutrient content, to reduce the negative effects of toxic compounds on the process, and to increase the biogas yield and CO2 capture like those of others biofuels [5,7,9,12,16,17,28].
An analysis of the economic and financial simulation results showed that the economic benefit is dependent on two economic variables: (1) the structure costs and the price of energy associated with the feed-in tariffs; and (2) a purely financial variable, which is based on the repayment installments of the loan.
The latter, given the constancy of both energy production and costs, plays a central role in the economic and financial sustainability of a plant that must operate in an alternative system of AIFT and BFT.
The analysis of the earning margins showed high profitability with both the BFT and the all-inclusive tariff. Specifically, depending on the size of the plants, the average values of EBITDA were between 62% and 77%.
An analysis of the DSCR demonstrated the sustainability of energy production for all sizes of installations, which is significant, particularly with regard to the previous time range to the point of payback. Thus, the positive values of the index showed that the financial burden of the installment of the loan for the construction of the plant is sustainable.
The analysis of the NPV, derived from cash flow, showed that all plants with the all-inclusive tariff option have a higher total value than those that produce energy in the basic tariff regime for each installed power plant.
Considering a payback period made with the discounted cash flow, the improvement of the break-point is closely linked to the increase in the corresponding plant size. Given the assumptions of the simulation, the payback for a plant making 100 kW is nine years for both the all-inclusive tariff and BFT. Regarding plants producing 500 kW and 1000 kW, the payback period is five and four years, respectively.
The analysis of payback showed that an increase of the size of the plant, with increased investment and management costs, corresponds to a notable decrease of the time of recoup of investment. As shown by the economic analysis, the payback is halved. The increased energy production of the plant, whatever the incentive rate, guarantees a low pay-back, compensating for rising costs. The study showed that the Italian legislation, with regard to incentives for AD systems, gives greater advantages to medium-sized plants at the expense of small-scale plants.
The annual earnings analysis, at the payback point, showed that all plants with the BFT option have a higher total value than those that produce energy in the AIFT regime for each installed power plant. In detail, for 100 kW plants, the value ranges from €12,815 in the case of AIFT to €23,514 for BFT. Similarly, for 500 kW plants, the value of NPV ranges from €214,00 for AIFT to €249,070 for BFT. Annual earnings are even higher for 1000 kW power plants, from €749,011 for AIFT to €808,555 for BFT.
These values increase annually as the cost of amortization decreases.
In all of the analyzed cases, a considerable economic advantage was highlighted, in particular for the AIFT compared to the BFT. This result is highly dependent on contributions linked to the price of electricity on the market. Thus, fluctuations in energy prices could lead to an economic analysis variation affecting the assessment of the basic tariff.

Author Contributions

Maurizio Carlini and Sonia Castellucci have conceived and designed the experiments; Enrico Maria Mosconi has analyzed the data; Sonia Castellucci, Andrea Colantoni and Mauro Villarini have writed the paper.

Conflicts of Interest

The authors declare no conflict of interest.

Abbreviations

ADAnaerobic digestion
CHPCombined heat and power
OMWWOlive mill waste water
OMSWOlive mill solid waste
CMCattle manure
CSCattle slurry
BMPBio methane potential
BFTBasic feed-in tariff
AIFTAll-inclusive feed-in tariff
BPBreak point
BEPBreak-even point
EBITDAEarnings before interest taxes, depreciation, and amortization
EBITDA %Earnings before interest taxes, depreciation, and amortization as a % of turnover
IRRInternal rate of return
WACCWeighted average cost of capital
DSCRDebt service coverage ratio

References

  1. Gestore Servizi Energetici (GSE). Rapporto Statistico. 2014. Available online: http://www.gse.it/it/Statistiche/RapportiStatistici/Pagine/default.aspx (accessed on 4 May 2017).
  2. Gestore Servizi Energetici (GSE). Incentivazione Delle Fonti Rinnovabili. 2015. Available online: http://www.gse.it/it/Dati%20e%20Bilanci/GSE_Documenti/Bollettino%20informativo/Bollettino%202%20semestre%202015.pdf (accessed on 3 May 2017).
  3. Decreto Ministeriale. Incentivi per Energia da Fonti Rinnovabili; Italian Republic: Rome, Italy, 2012.
  4. Torquati, B.; Venanzi, S.; Ciani, A.; Diotallevi, F.; Tamburi, V. Environmental sustainability and economic benefits of dairy farm biogas energy production: A case study in Umbria. Sustainability 2014, 6, 6696–6713. [Google Scholar] [CrossRef]
  5. Holm-Nielsen, J.B.; Al Seadi, T.; Oleskowicz-Popiel, P. The future of anaerobic digestion and biogas utilization. Bioresour. Technol. 2009, 100, 5478–5484. [Google Scholar] [CrossRef] [PubMed]
  6. Weiland, P. Biogas production: Current state and perspectives. Appl. Microbiol. Biotechnol. 2010, 85, 849–860. [Google Scholar] [CrossRef] [PubMed]
  7. Xie, S.; Lawlo, P.G.; Frost, J.P.; Hu, Z.; Zhan, X. Effect of pig manure to grass silage ratio on methane production in batch anaerobic co-digestion of concentrated pig manure and grass silage. Bioresour. Technol. 2011, 102, 5728–5733. [Google Scholar] [CrossRef] [PubMed]
  8. Carlini, M.; Castellucci, S.; Cocchi, S.; Allegrini, E. Slaughterhouse wastes: A review on regulations and current technologies for biogas production. Adv. Mater. Res. 2013, 827, 91–98. [Google Scholar] [CrossRef]
  9. Ruffino, B.; Fiore, S.; Roati, C.; Campo, G.; Novarino, D.; Zanetti, M. Scale effect of anaerobic digestion tests in fed-batch and semi continuous mode for the technical and economic feasibility of a full scale digester. Bioresour. Technol. 2015, 182, 302–313. [Google Scholar] [CrossRef] [PubMed]
  10. Carlini, M.; Castellucci, S.; Moneti, M. Biogas production from poultry manure and cheese whey wastewater under mesophilic conditions in batch reactor. Energy Procedia 2015, 82, 811–818. [Google Scholar] [CrossRef]
  11. Roig, A.; Cayuela, M.L.; Sánchez-Monedero, M.A. An overview on olive mill wastes and their valorization methods. Waste Manag. 2006, 26, 960–969. [Google Scholar] [CrossRef] [PubMed]
  12. Carlini, M.; Castellucci, S.; Moneti, M. Anaerobic co-digestion of olive-mill solid waste with cattle manure and cattle slurry: Analysis of bio-methane potential. Energy Procedia 2015, 81, 354–367. [Google Scholar] [CrossRef]
  13. Caputo, A.C.; Scacchia, F.; Pelagagge, P.M. Disposal of by-products in olive oil industry: Waste-to-energy solutions. Appl. Therm. Eng. 2003, 23, 197–214. [Google Scholar] [CrossRef]
  14. Fountoulakis, M.S.; Dokianakis, S.N.; Kornaros, M.E.; Aggelis, G.G.; Lyberatos, G. Removal of phenolics in olive mill wastewaters using the white-rot fungus Pleurotus ostreatus. Water Res. 2002, 36, 4735–4744. [Google Scholar] [CrossRef]
  15. Doymaz, I.; Gorel, O.; Akgun, N.A. Drying Characteristics of the Solid By-product of Olive Oil Extraction. Biosyst. Eng. 2004, 88, 213–219. [Google Scholar] [CrossRef]
  16. Mata-Alvarez, J.; Dosta, J.; Romero-Güiza, M.S.; Fonoll, X.; Peces, M.; Astals, S. A critical review on anaerobic co-digestion achievements between 2010 and 2013. Renew. Sustain. Energy Rev. 2014, 36, 412–427. [Google Scholar] [CrossRef]
  17. Dermeche, S.; Nadour, M.; Larroche, C.; Moulti-Mati, F.; Michaud, P. Olive mill wastes: Biochemical characterizations and valorization strategies. Process Biochem. 2013, 48, 1532–1552. [Google Scholar] [CrossRef]
  18. Ministry of Agricultural Food and Forestry Policies. Olive-Oil Sector Plan; European Union: Rome, Italy, 2016. [Google Scholar]
  19. Blumenstein, B.; Siegmeier, T.; Moller, D. Economics of anaerobic digestion in organic agriculture: Between system constraints and policy regulation. Biomass Bioenergy 2016, 86, 105–119. [Google Scholar] [CrossRef]
  20. Marchesi, R.; Bombarda, P.; Bresciani, F.; Casalegno, A.; Guilizzoni, M.; Manfredi, G.; Escobar, P.; Rota, A.; Zago, M. Electricity Production from Renewable Sources; Politecnico di Milano-Energy Department: Milan, Italy, July 2013. [Google Scholar]
  21. Javanovic, P. Application of sensitivity analysis in investment project evaluation under uncertainty and risk. Int. J. Proj. Manag. 1999, 17, 217–222. [Google Scholar] [CrossRef]
  22. Associazione Iavoratori Pensionati Autonomi Italian. Contratto Collettivo Nazionale Dell’agricoltura (Operai e Florvivaisti); Confederazione Generale dell’agricoltura Italiana: Roma, Italy, 2016. [Google Scholar]
  23. Agenzia per la Protezione dell’Ambientee per i servizi Tecnici (APAT). La Valutazione del Prezzo dello Smaltimento dei Rifiuti; Istituto Superiore per la Protezione e la Ricerca Ambientale: Roma, Italy, 2011.
  24. Žižlavskýa, O. Net Present Value Approach: Method for Economic Assessment of Innovation Projects. In Proceedings of the 19th International Scientific Conference Economics and Management, Riga, Latvia, 23–25 April 2014. [Google Scholar]
  25. Gestore dei Mercati Energetici (GME). Available online: http://www.mercatoelettrico.org/it/ (accessed on 5 May 2017).
  26. Zambon, I.; Colosimo, F.; Monarca, D.; Cecchini, M.; Gallucci, F.; Proto, A.R.; Lord, R.; Colantoni, A. An innovative agro-forestry supply chain for residual biomass: Physicochemical characterization of biochar from olive and hazelnut pellets. Energies 2016, 9, 526. [Google Scholar] [CrossRef] [Green Version]
  27. Civitarese, V.; Spinelli, R.; Barontini, M.; Gallucci, F.; Santangelo, E.; Acampora, A.; Scarfone, A.; del Giudice, A.; Pari, L. Open-Air Drying of Cut and Windrowed Short-Rotation Poplar Stems. BioEnergy Res. 2015, 8, 1614–1620. [Google Scholar] [CrossRef]
  28. Colantoni, A.; Evic, N.; Lord, R.; Retschitzegger, S.; Proto, A.R.; Gallucci, F.; Monarca, D. Characterization of biochars produced from pyrolysis of pelletized agricultural residues. Renew. Sustain. Energy Rev. 2016, 64, 187–194. [Google Scholar] [CrossRef] [Green Version]
Figure 1. (a) Earnings before interest, taxes, depreciation and amortization (EBITDA) of a 100 kW biogas plant with all-inclusive feed-in tariff (AIFT); (b) debt service coverage ratio (DSCR) of a 100 kW biogas plant with AIFT; and (c) Payback of a 100 kW biogas plant with AIFT.
Energies 10 01165 g001
Figure 2. (a) EBITDA of a 100 kW biogas plant with feed-in tariff; (b) DSCR of a 100 kW biogas plant with feed-in tariff; and (c) Payback of a 100 kW biogas plant with feed-in tariff.
Energies 10 01165 g002
Figure 3. (a) EBITA of a 500 kW biogas plant with AIFT; (b) DSCR of a 500 kW biogas plant with AIFT; and (c) Payback of a 500 kW biogas plant with AIFT.
Energies 10 01165 g003
Figure 4. (a) EBITDA of a 500 kW biogas plant with feed-in tariff; (b) DSCR of a 500 kW biogas plant with feed-in tariff; and (c) Payback of a 500 kW biogas plant with feed-in tariff.
Energies 10 01165 g004
Figure 5. (a) EBITDA of a 1000 kW biogas plant with AIFT; (b) DSCR of a 1000 kW biogas plant with AIFT; and (c) Payback of a 1000 kW biogas plant with AIFT.
Energies 10 01165 g005
Figure 6. (a) EBITDA of a 1000 kW biogas plant with feed-in tariff; (b) DSCR of a 1000 kW biogas plant with feed-in tariff; and (c) Payback of a 1000 kW biogas plant with feed-in tariff.
Energies 10 01165 g006
Table 1. Biomass properties.
Biomass Properties
BiomassDry Matter (%)Moisture (Wet Basis) (%)Ashes (Dry Basis) (%)Organic Matter (Dry Basis) (%)Volatile Solid (Dry Basis) (%)Substrate Ratio of Fresh Weight (%)
Cattle slurry1.04 ± 0.0198.96 ± 0.0235.02 ± 0.0564.73 ± 0.0161.73 ± 0.0170
Cattle manure18.46 ± 0.0481.54 ± 0.0315.96 ± 0.00284.04 ± 0.0375.63 ± 0.015
OMSW54.12 ± 0.0245.89 ± 0.014.75 ± 0.00695.25 ± 0.0294.07 ± 0.0125
Mixture properties
Total dry matter: 14%
Initial pH: 7.07
Total organic matter on dry basis: 93.6%
Total organic matter on wet basis: 13.03%
BMP (Bio-Methane Potential test) (L/gsv): 0.1034 (Liter/volatile solid)
Table 2. Technical parameters for three different anaerobic digestion (AD) plant sizes.
Technical ParametersUnitsPowerPowerPower
Installed electrical performancekW1005001000
CHP efficiency----
Electrical%36.541.640.7
Thermal%37.541.642.8
CHP operating hoursh a−1800080008000
Average retention timesd555555
OMSWt2608201800
CSt80625425580
CMt52164360
Net fermenter volumem3130041009000
Electricity needs%222
Heat needs%252525
Table 3. Incentive rates.
Installed Electrical Performance (kW)AIFT (€/MWh)BFT (€/MWh)
100222.11185.31
500193.88157.08
1000167.53130.73
Table 4. Total costs of three different AD plant sizes.
CostsPower (kW)Power (kW)Power (kW)
Investment cost (€/Kw)1005001000
Total investment cost (€)700040003000
Annual cost (€/annum)700,0002,000,0003,000,000
Repair and maintenance16,00045,00070,000
Labor13,00026,00052,000
Substrate input10,00040,00050,000
Management plant200010,00020,000
Insurance300010,00015,000
Book-keeping counselling200020002000
Concessions and royalties500050005000

