1. Introduction
Legislative requirements are motivating vehicle manufacturers to integrate new powertrain technologies. Over the last few years, a number of hybrid and electric vehicles have been introduced alongside their traditional internal combustion engine counterparts. Rechargeable lithium-ion technology has been a key contributor to facilitating this [
1,
2]. Many manufacturers use cylindrical format cells (e.g., 18650) in their vehicles [
3,
4,
5,
6]. These cells are often chosen for economic reasons because they are a common form factor produced in large quantities and, thus, benefit from economies of scale and security of supply [
6,
7,
8]. They are also chosen for safety reasons because of integrated features which prevent high current surges and gas build up [
6,
7,
8], making the chance of explosion and fire less likely.
To ensure in-market reliability, vehicle manufacturers perform a variety of mechanical and durability tests during the design and prototype stages of the development process. These tests ensure that new vehicle components are fit-for-purpose and that they can meet the expected lifetime requirements. These tests also provide data to either parameterize or validate computer aided engineering (CAE) models and simulations. They also help to determine root cause of failure modes so that the robustness of the component can be improved. Vibration durability is one of these tests and is performed to better understand the behavior of a given system when subjected to mechanically induced vibration that is representative of the in-service environment or desired vehicle life (typically 100,000 miles of customer usage). Vibration durability tests play an important role in the selection and lifetime prediction of components. As discussed within [
9,
10,
11,
12,
13], vibration is a significant factor in the failure of automotive components due to mechanisms, such as fatigue cracking or the work-hardening of materials [
11,
14,
15]. Within the context of Li-ion cells suitable for a contemporary EV battery application, a significant body of research exists that underpins the mechanical characterization of both pouch and cylindrical cell formats through quasi-static and dynamic test techniques. With respect to the quasi-static testing, there has been a clear focus on obtaining data from materials found within Li-ion cells through traditional mechanical assessment techniques, such as strain and bending [
16,
17,
18,
19], force displacement [
16,
17,
18,
19,
20], and creep [
19], as well as Li-ion cell-specific studies investigating tolerance changes during charge and discharge [
21]. Within the dynamic testing domain there has been a significant focus towards assessing the crashworthiness and robustness of Li-ion cells via mechanical crush [
16,
20,
22], penetration [
18,
23], impact resistance [
16,
22], and mechanical shock [
16,
24]. The research in the quasi-static and dynamic domains has been driven by a need to comply with whole vehicle crash homologation [
25,
26], to meet consumer focused accreditation requirements (e.g., Euro NCAP [
27]) and mandatory transport legislation, such as UN 38.3 [
28].
As discussed within [
29], there has been very little research into how vibration impacts the internal components of lithium-ion cells and how the cells are aged at a microscopic level when subjected to a desired durability life. Brand et al. [
24] performed vibration studies on 18650-type cylindrical cells and found that vibration caused short circuits from the mandrel moving up and down along the center of the cell; they showed images of where the mandrel created a hole through the center of the electrode tab. They also show what appears to be a melted separator, attributed to internal short circuits, and there is also some black soot deposit as well. However, their test was focused on providing energy along the mandrel axis and such forces, over long periods of time, are not likely to be exhibited over 100,000 miles. Svens [
30] notes a potential mechanism for lithium iron phosphate cells which is more attributable to long-term effects of vibration aging. They found iron deposited at the negative electrode, presumably through fracture and subsequent dissolution at the positive electrode followed by migration to the negative electrode through the electrolyte. However, they provide no explanation of how samples were prepared for analysis and so the potential for contamination during cell opening and analysis is always a consideration in such cases.
This paper presents the results from a materials characterization study on four cells (numbered 3, 15, 17, and 18) from previous work on the impact of vibration to electrical performance [
29]. The aim of the paper is to determine the internal mechanism(s) responsible for changes in the electrical performance of commercially-available 18650-type lithium-ion cells due to vibration.
2. Experimental Method and Theory
This study is an extension of that presented within [
29] which identified that exposing commercially-available 18650-type nickel manganese cobalt (NMC) cells to vibration energy (representative of 100,000 miles North American customer usage) can result in increased levels of cell performance degradation through permanent capacity loss and an increase in the cell’s internal impedance. While its effect on electrical performance was quantified through experimentation, the underlying causality was not defined in this previous work. It is beyond the scope of this study to define, in detail, the experimental method or the complete set of results obtained. However, to provide context for this research, pertinent elements are presented later.
2.1. Cells
This work used four commercially-available 2.2 Ah 18650-type cells comprised of a NMC positive electrode, graphite negative electrode with organic solvent; containing LiPF
6 salt. Three cells were subjected to vibration in accordance with SAE J2380 [
29], whilst the remaining sample was defined as a control cell. The control sample was not subject to any vibration. However, during vibration testing, the control sample was located in the same room and in close proximity to the other three test cells and therefore was subject to the same temperature and humidity.
2.2. Vibration and Electrical Characterization
Electrical characterization of the cells was conducted pre and post application of vibration so that a measurement of the changes in electrical performance could be determined. The electrical characterization methods employed to measure cell performance were:
A 1 C capacity discharge (fully discharged at 1 C to 2.75 V)
Pulse power testing (to determine DC resistance)
Electrochemical impedance spectroscopy (EIS) (to determine ohmic and charge transfer resistance)
Open cell voltage measurement (OCV)
Additional information and an in depth explanation on how these cells were vibrated and electrically-characterized is explained in [
29]. Post application of vibration, all cells displayed performance degradation. The key specific changes with respect to Samples 3, 15, 17, and 18 are defined in
Table 1. To ensure traceability with results mentioned in [
29] the same cell sample numbers are used.
2.3. Post-Test Analysis Cell Tear Down
Cells were opened, electrodes unwound, and samples prepared in an inert argon environment glove box with less than 1 ppm of both oxygen and water. The cells were opened using a method which did not produce sparks or contaminants from the cell can, or cut into the electrode jelly roll. The electrodes were stored separately in plastic bags. Cathode and anode samples were prepared for X-ray photoelectron spectroscopy (XPS) analysis separately and not in proximity to each other to limit cross-contamination. In addition, all samples were handled and cut with clean tweezers and scissors each time to further reduce the chance of sample cross-contamination. Three samples were taken from 10 mm in from along the length of the longest side of the unwound electrode from each cell and analyzed with XPS. After processing there was a total difference in relative area of the chemical environments of up to 5% between these samples, for this reason, differences of less than 5% will be deemed as insignificant.
2.4. XPS Analysis
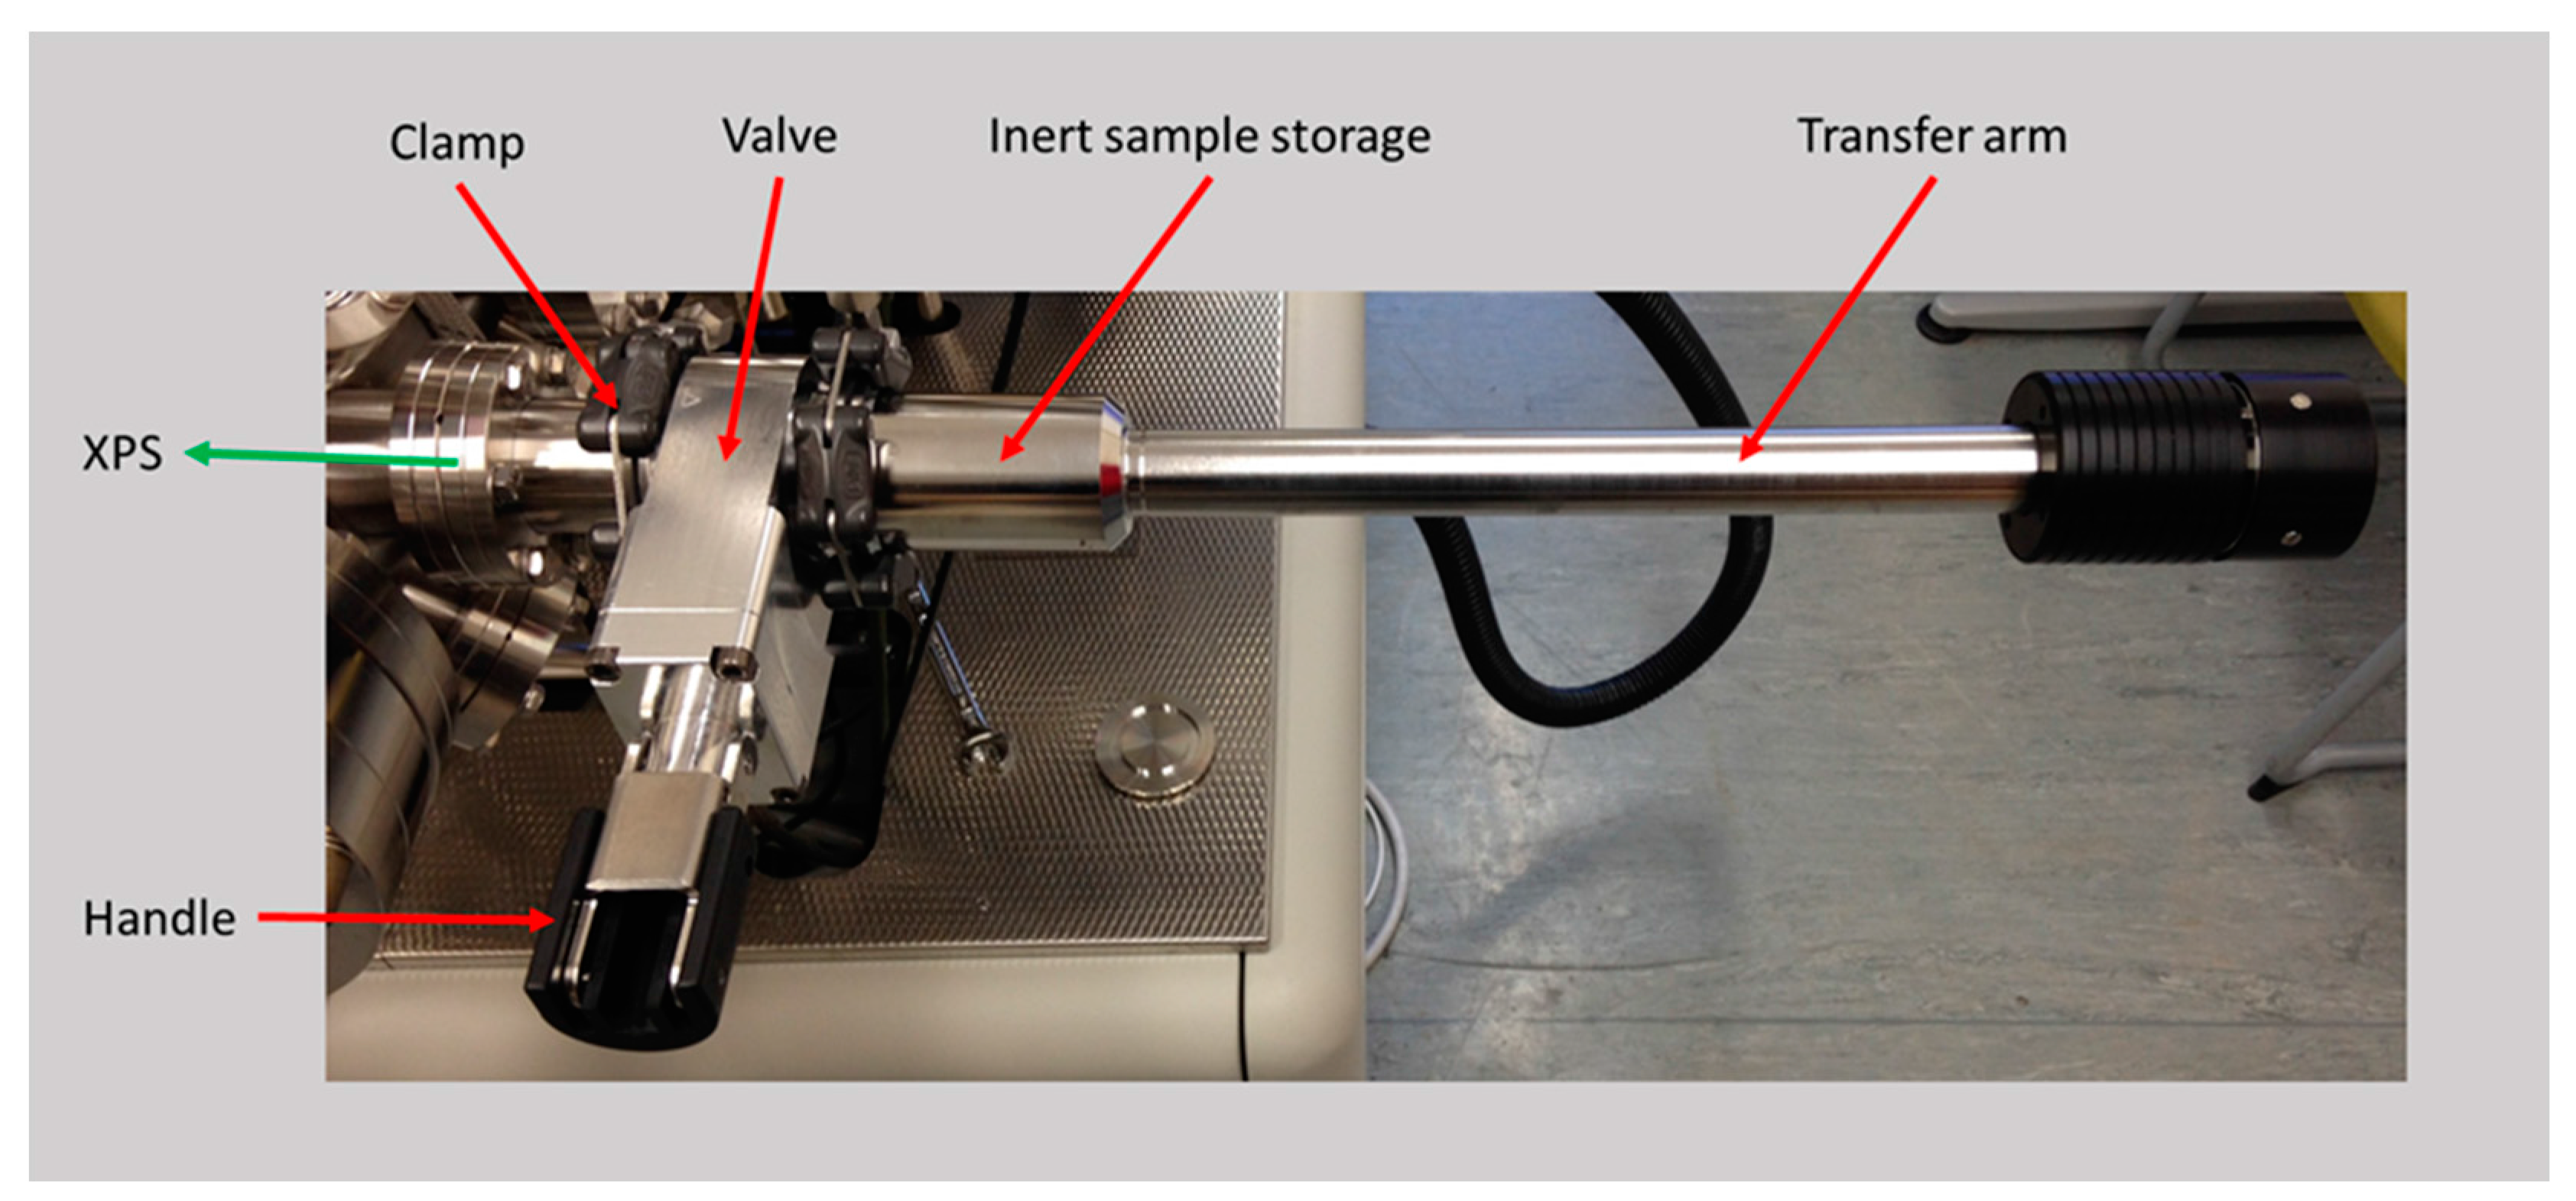
Samples were transferred to the XPS system using an original manufacturer air-tight sample holder, shown in
Figure 1. This transfer unit did not expose the sample to atmosphere at any stage. Samples were analyzed using a Kratos Axis Ultra DLD spectrometer (Kratos Analytical Ltd, Manchester, UK) with a base pressure of circa 2 × 10
−10 mbar. XPS measurements were performed in the main analysis chamber, with the sample being illuminated using a monochromatic Al kα X-ray source. Measurements were conducted at room temperature and a take-off angle of 90° with respect to the surface parallel.
The core level spectra were recorded using a pass energy of 20 eV (resolution ca. 0.4 eV), from an analysis area of 300 µm × 700 µm. The spectrometer work function and binding energy scale were calibrated using the Fermi edge and 3d_5/2 peak recorded from a clean polycrystalline Ag sample prior to the commencement of the experiments. After acquisition, all spectra were referenced to the C 1s peak at 284.6 eV (before sputtering) and 284.4 eV (after sputtering). The data were processed using Shirley backgrounds and mixed Gaussian-Lorentzian (Voigt) line shapes. For compositional analysis, the analyzer transmission function has been determined using Ag, Au, and Cu foils to calibrate the detection efficiency across the full binding energy range. Sputtering was performed with an Ar+ ion gun at 2 keV over an area of 3 × 3 mm. Samples were sputtered in 30 s periods until a steady state (the relative concentrations and peak positions does not change) was achieved in the material at which point no more sputtering occurred and the post-sputtered sample spectra was recorded. All negative electrode samples reached a steady state within one minute of sputtering.
Peak positions and chemical environments were established based on the fewest number of component parts for a fitting R
2 (a statistical measure of the variation that is explained by a linear model) of greater than 98% accuracy and in accordance with expected chemical environments for the system. Peak positions (binding energy) were maintained from sample to sample of less than 0.4 eV variance, and peak width (FWHM) had an identical restriction. The assignment of chemical environments is representative of expected binding energies, in accordance with established literature [
29,
31,
32].
4. Discussion
Part of the problem faced within the lithium-ion research community is the trade-off between understanding specific chemical mechanisms and obtaining answers which are accurate of in-use systems. This work has utilized commercially available 18650-type cells of unknown precise chemical composition. This was done to ensure that the results are representative of in-use conditions, however, since they are commercial cells it is not possible to know precisely which chemicals are present within the system and, therefore, precisely what reactants are present to form the surface film. This makes attributing a specific chemical mechanism for surface film formation complicated. However, it does mean that any conclusions reached are representative of real-world conditions and, therefore, directly relevant to industry practitioners and energy storage systems engineers tasked with designing and integrating complete battery assemblies for the automotive and road transport sector.
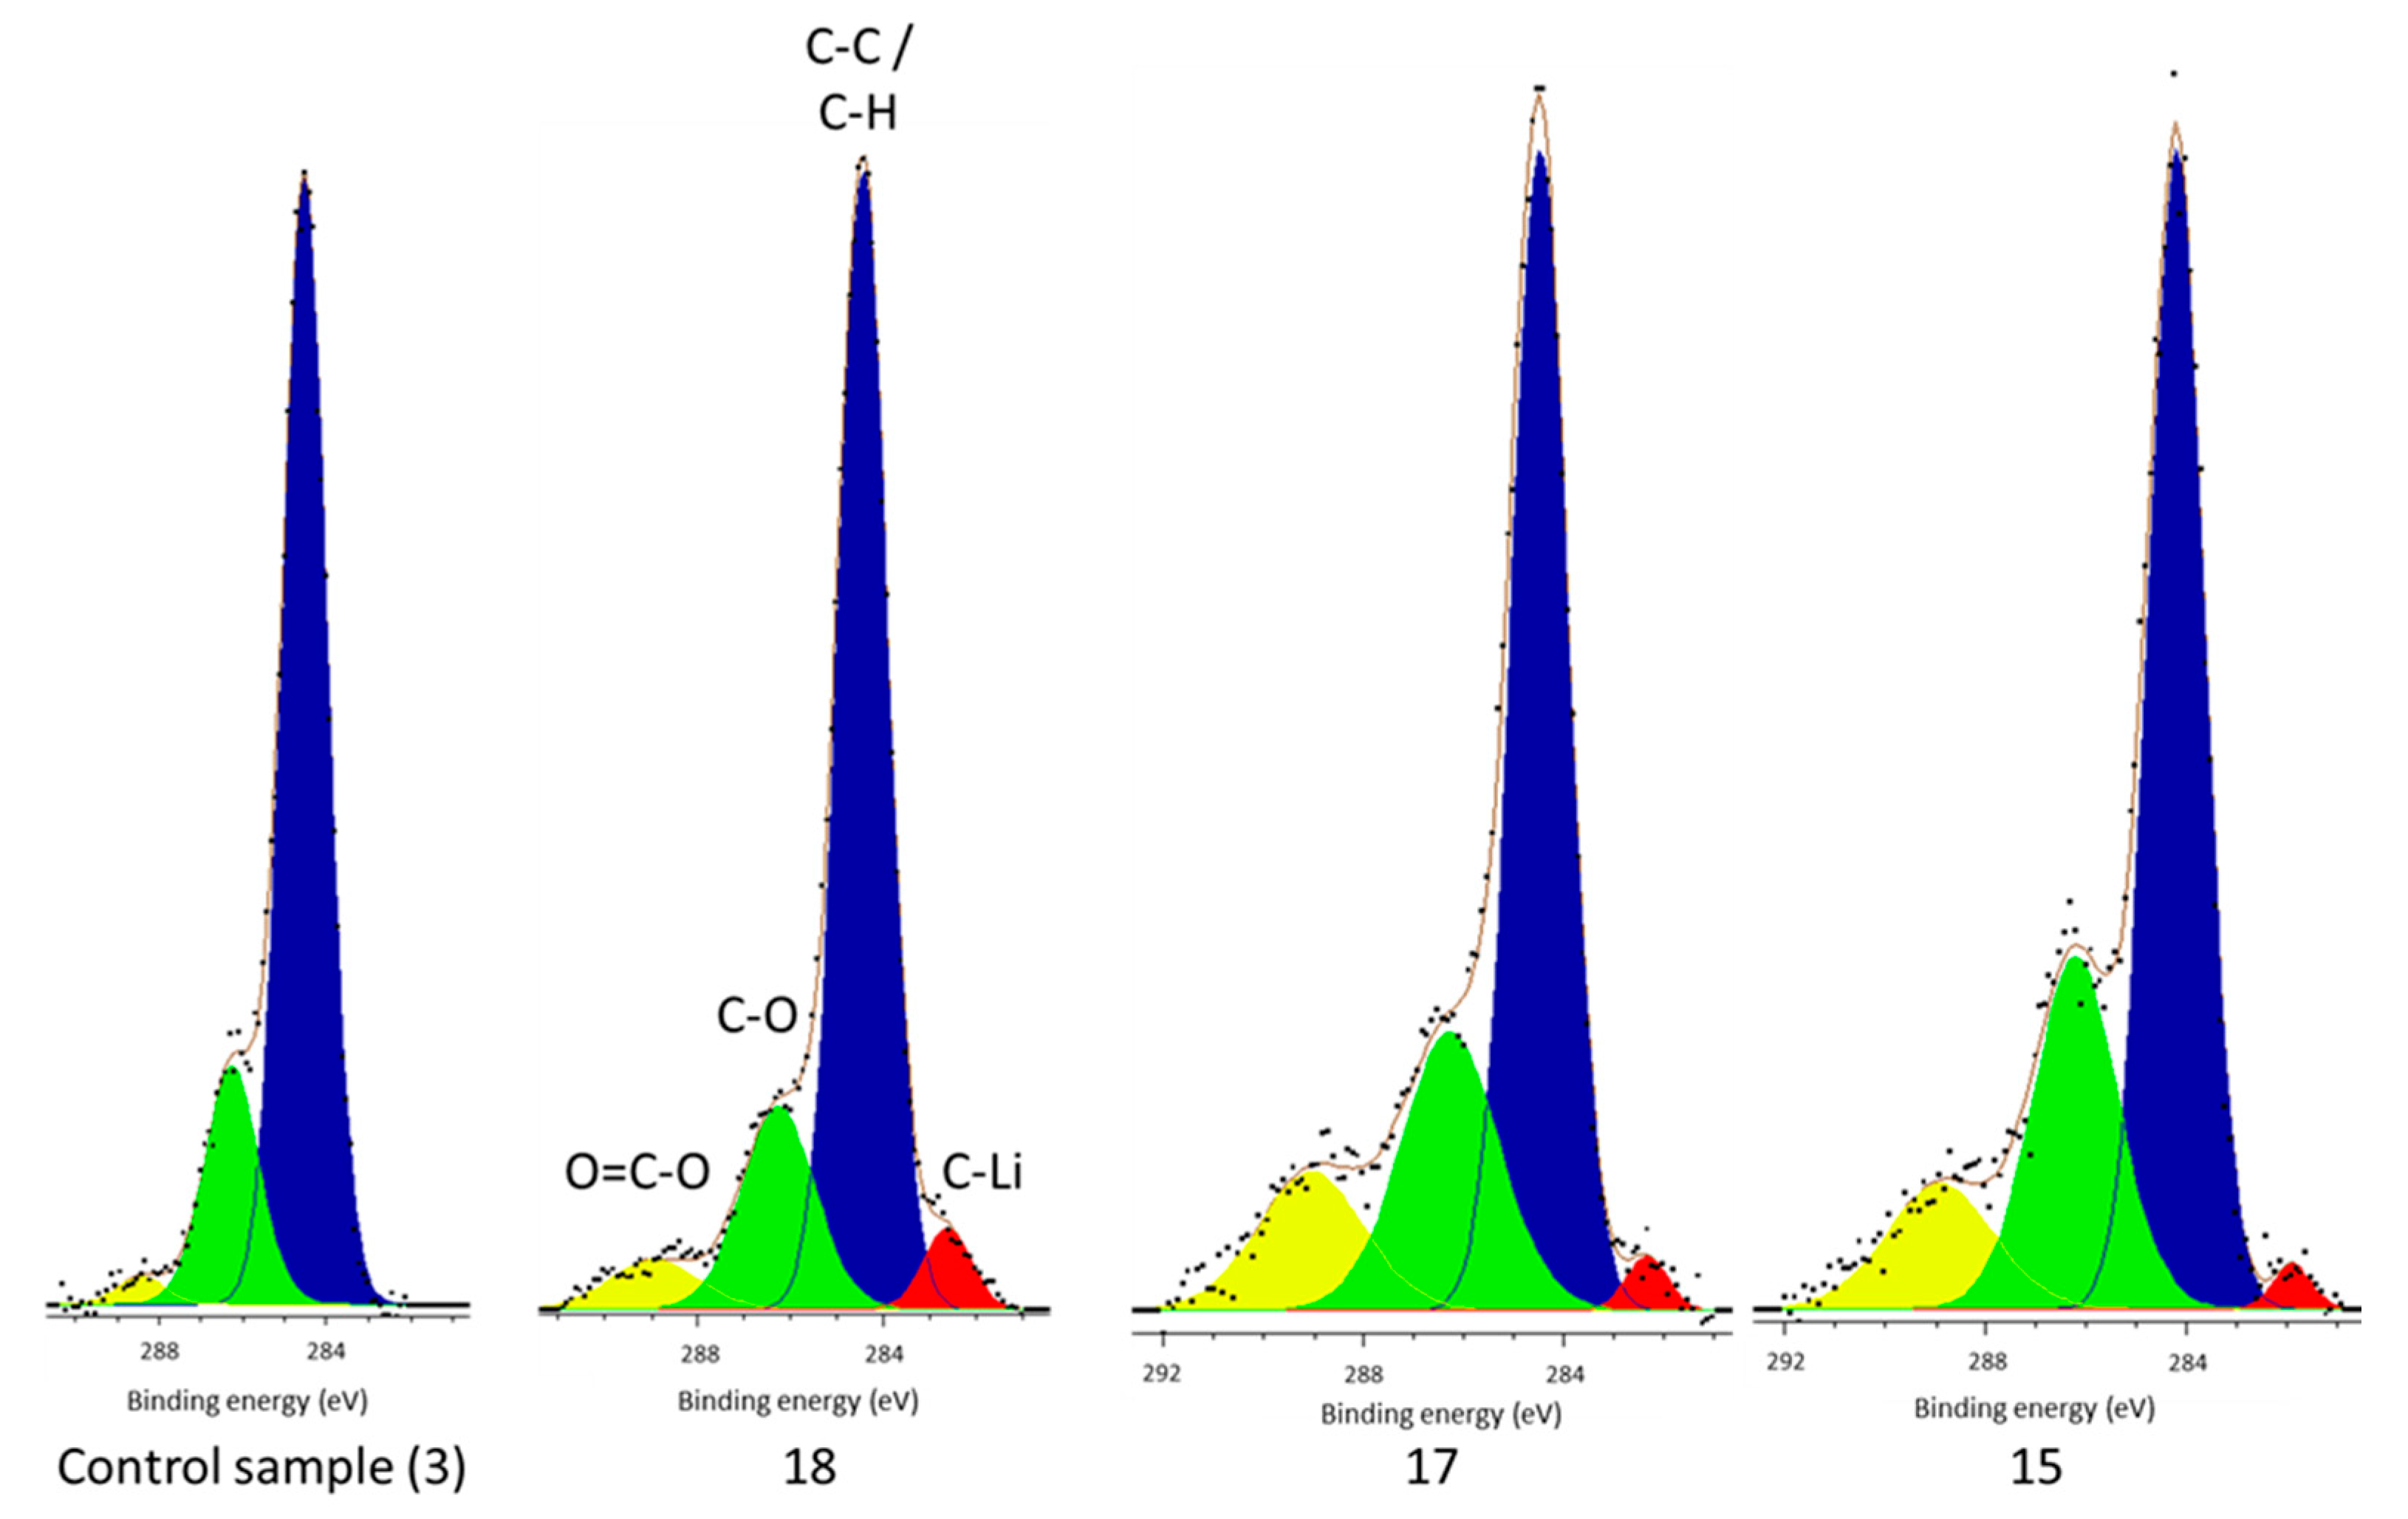
From this work it can be concluded that there is a carbide environment (C–Li) which comprises part of the surface film of each cell and the highest concentration is present in the control cell (
Figure 2).
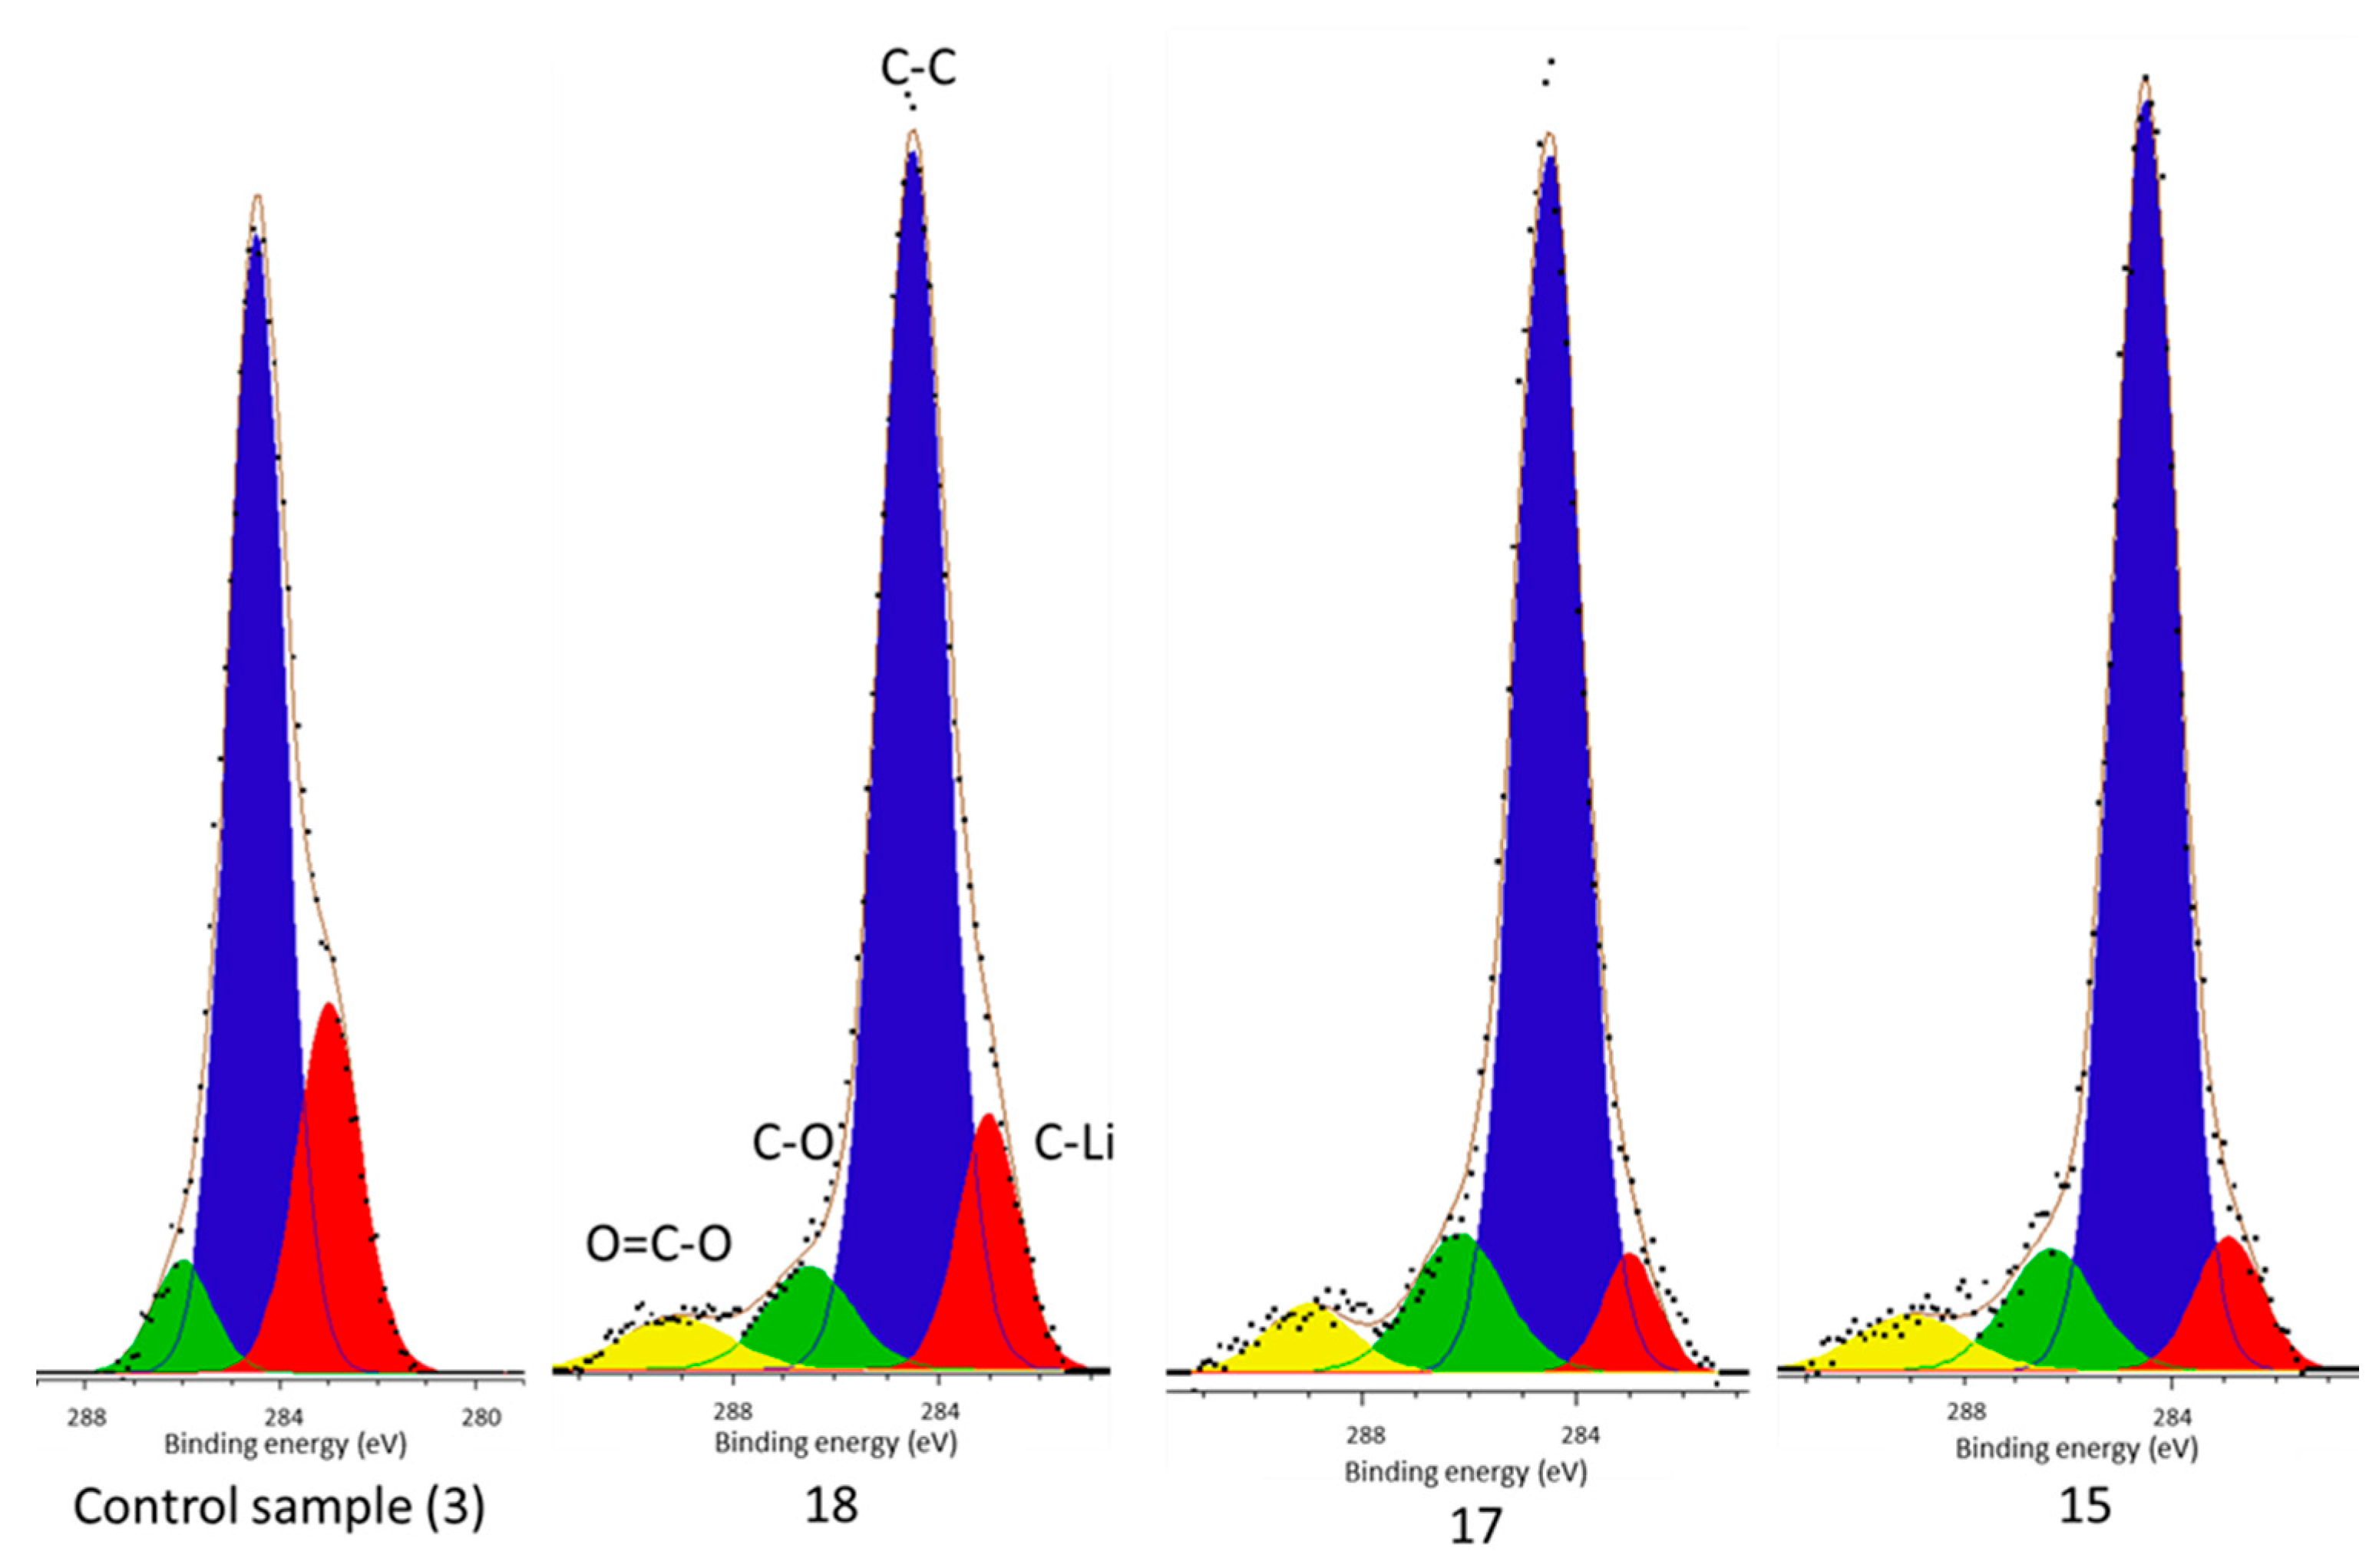
However, there is no carbide peak present in the electrolyte decomposition products of the control cell, but is present in each of the cells subject to vibration (
Figure 4). It has been established that Li–C is a component of the surface film [
34]. According to Aurbach its formation is dependent on a primary reaction of dimethyl carbonate (DMC) at the electrode surface with Li+ ions and electrons followed by a radical induced chain reaction with Li. They also suggest that this reaction probability is increased by the presence of a few ppm of H
2O in the electrolyte initially and, thus, would occur when the cell is manufactured [
37] and not afterward. Its presence within the surface film decomposition products of only the vibrated cells yet in all cell surface films indicate that vibration is responsible. Since its formation happens shortly after manufacture vibration cannot be the source of the Li–C in the deposits, which is in accordance with the work of Aurbach et al., but rather liberated it from the surface film. Therefore, these results suggest that during vibration some of the surface film (including Li–C) breaks away from the electrode and is subsequently deposited within the cell electrolyte. The new film, which is indicated by the presence of O–C=O environments within the surface film of only vibrated cells, reforms in its place. As first presented in [
38] and summarized in
Table 1, the cell level manifestation of this reaction is a reduction in cell capacity and an increase in impedance.
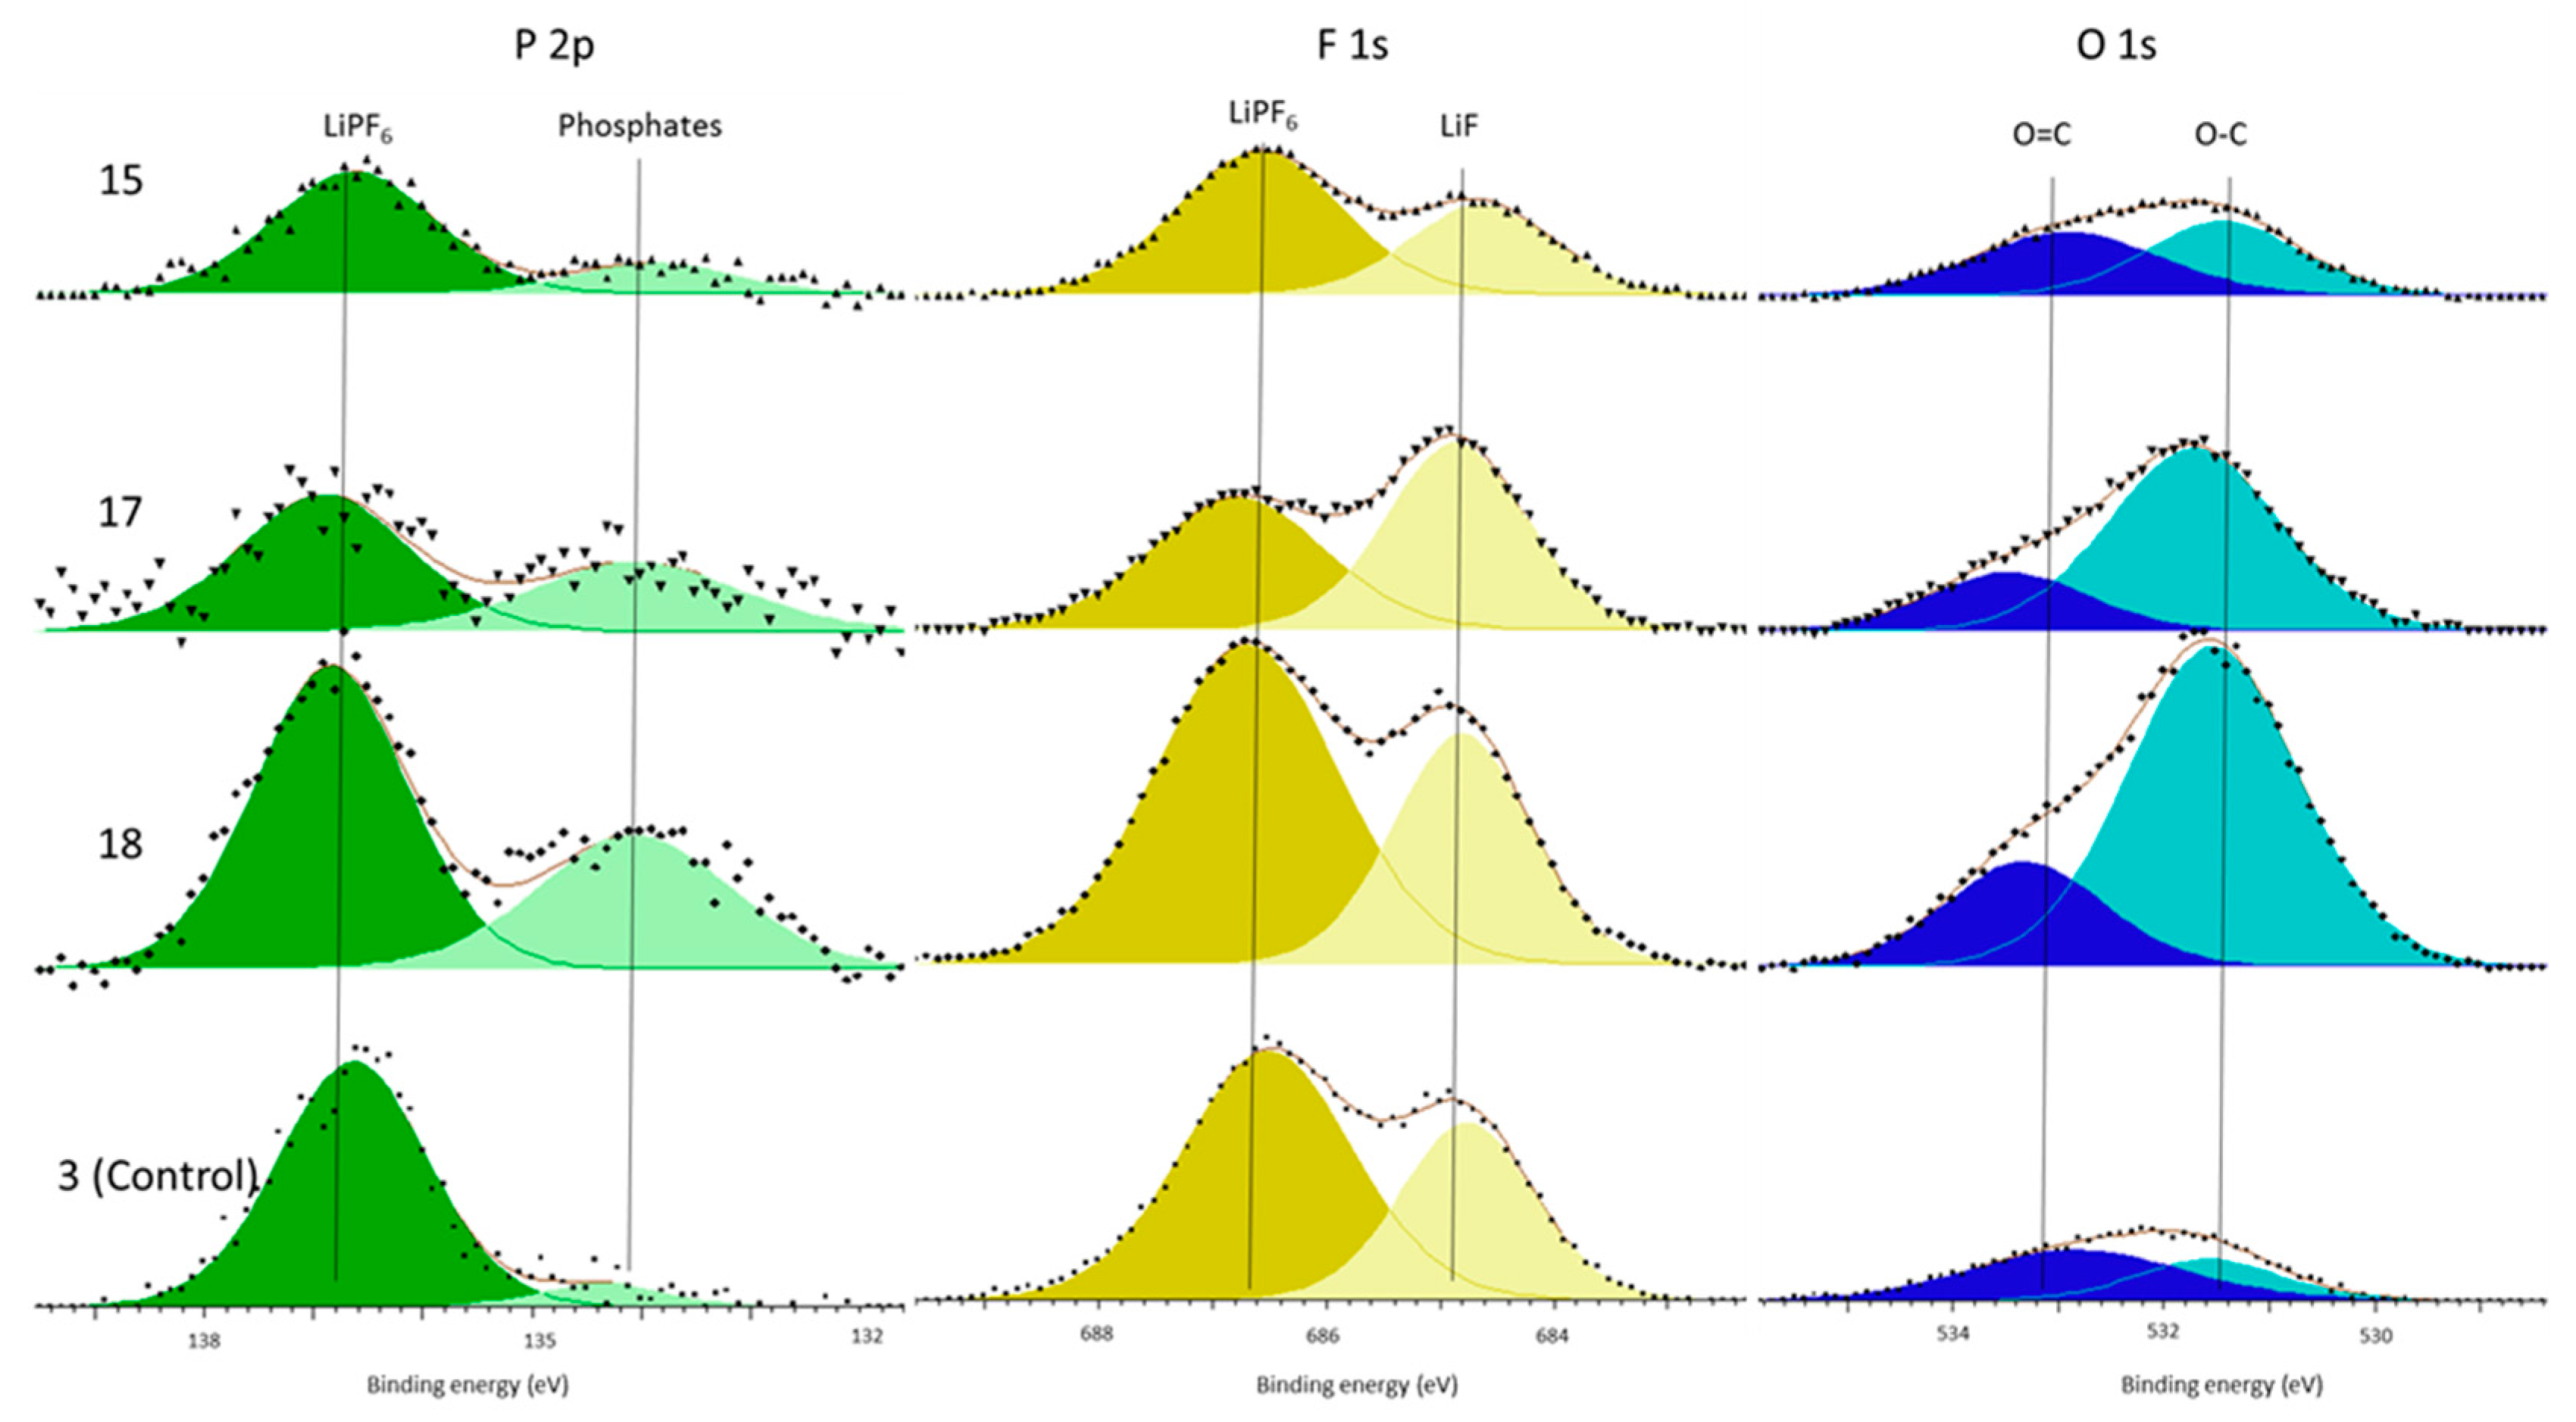
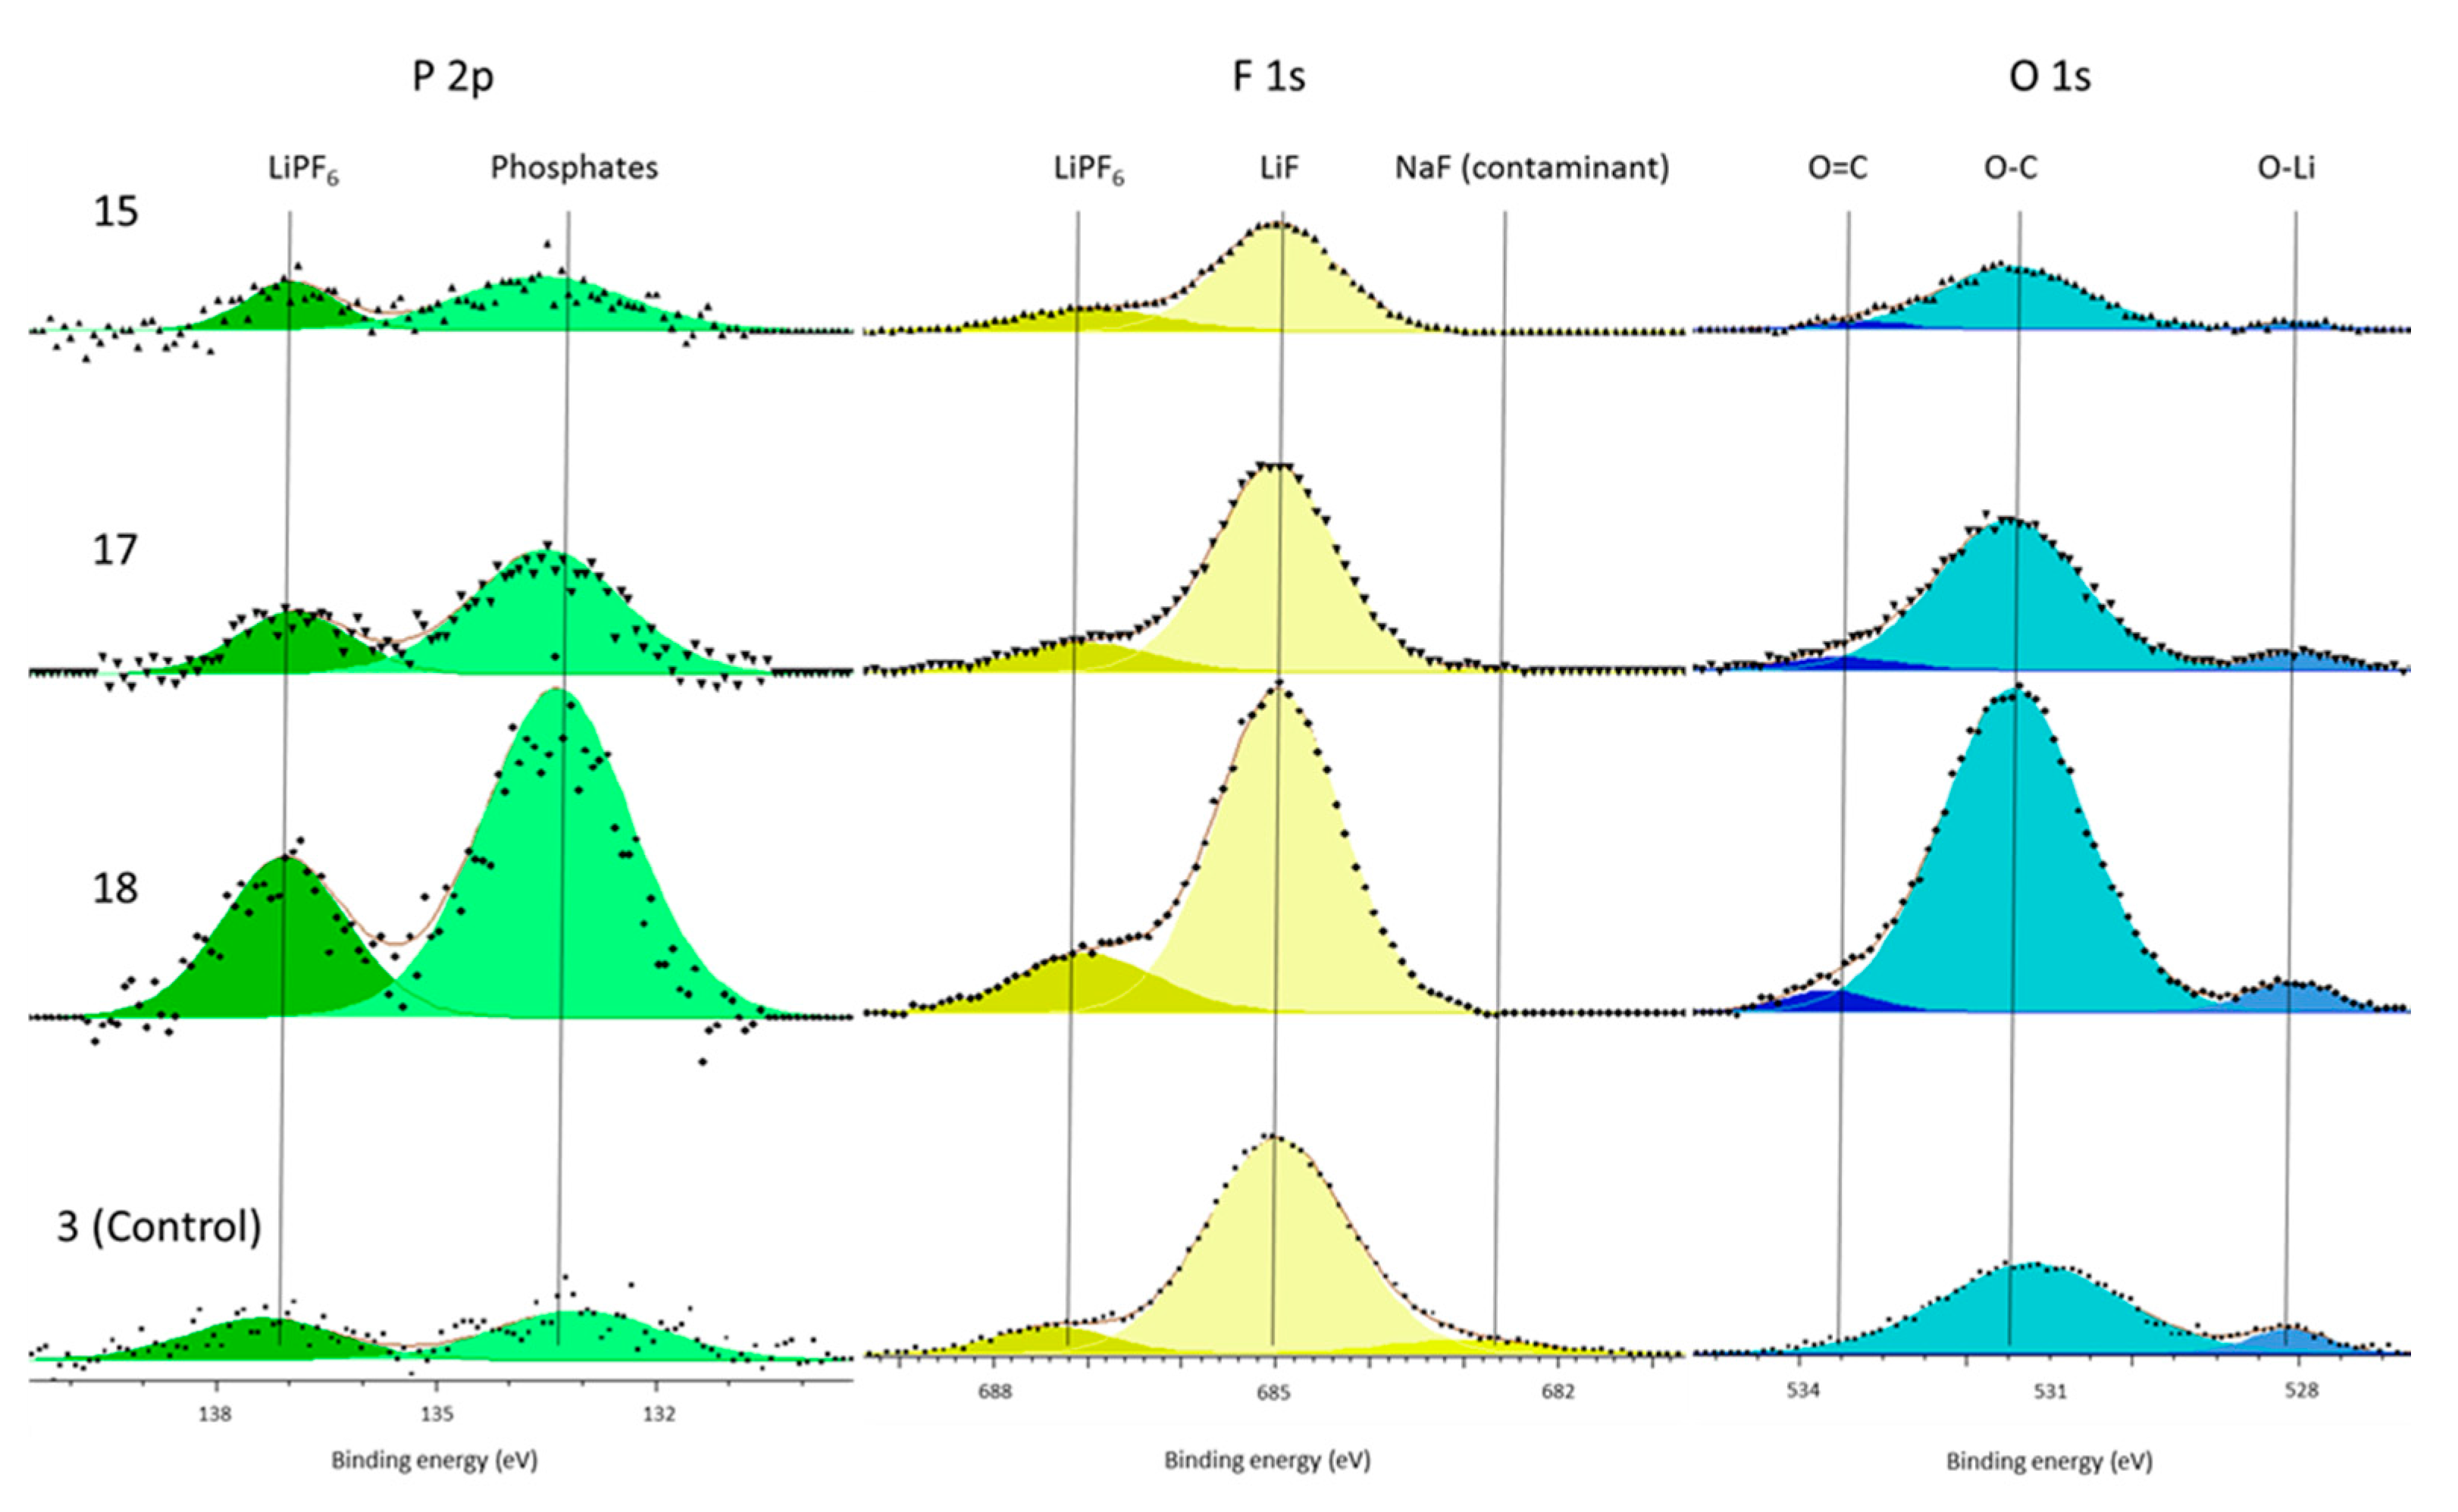
In support of this principal mechanism the authors refer the reader to the presence of increased phosphate concentrations within the surface film and the electrolyte decomposition. The only source of phosphates is the LiPF
6 salt. This is known because there is no C–F component (binder) in the C 1s spectra (
Figure 2 and
Figure 4) and because both the P 2p and F 1s (
Figure 3 and
Figure 5) only have LiPF
6, as supported by the referenced literature. Therefore, the salt must have decomposed to form the additional phosphate components. Kawamura et al. show a possible mechanism for this phosphate formation in their work on the decomposition of LiPF
6 [
39]. Although our work cannot definitively support this particular mechanism, it shows that salt decomposition occurs during cell formation and that this occurred more in the cells subjected to vibration.
In addition to lithium carbide in the electrolyte of vibrated cells and increased phosphate concentrations, the vibrated cells also contained higher concentrations of C–O and O–C=O environments in the electrolyte and increased LiF and C–O components in the surface film. It is well established that each of these components are part of the surface film, or products of its formation if found in the electrolyte, and that their increased concentration is suggestive of the increase in surface film forming reactions [
31,
32,
35].
The presence of O–C=O environments within the vibrated cell surface film, with its absence in the control cell, further supports the previously-suggested mechanism. It would appear that vibration has caused the removal of surface film from the electrode surface and then new surface film took its place, because the conditions are now different (i.e., lower concentrations of H
2O), the chemical composition of the surface film is different, hence the inclusion of O–C=O components. Etacheri et al. showed that the main reduction products for ethylene carbonate, propylene carbonate, and DMC contain ester compounds (O–C=O) [
40]. It is also documented that commercial cells use additives such as vinylene carbonate to selectively react at the surface of electrodes initially [
41] as sacrificial reactions to that of organic electrolyte solvents. They use specific quantities of these additives to form a surface film which uses up as little of the useful electrolyte components as possible without impeding cell function later [
42]. Therefore, no matter the precise composition of the electrolyte used in these commercial cells, initially the product (new surface film formed after vibration) is likely to lead to an increased concentration of ester environments, causing an increased impedance and increased cell resistance as the surface film is no longer selectively formed for its role. The replacement of the selectively-formed film, that is purpose-built for its role, with a film that is the product of normal electrolyte reduction is the cause of cell aging for vibrated cells. It may be possible to mitigate the effect of aging if higher concentrations of the selective additives for improving cell surface film performance were included during cell manufacture.
The cells subjected to vibration all exhibited increased DC resistance and reduced capacity, which is consistent with the increased surface film. The formation of surface film and its composition has been shown to increase cell resistance [
29]. The sharp increase in ohmic resistance of the vibrated cells can be attributed to either intercalation at the electrode surface, caused by a more ionically-resistant surface film, or an increase in electrolyte resistance. Both of these are exhibited in the XPS results (see
Figure 2) by the presence of O–C=O components after vibration, which are known to be ionically resistant, which would potentially increase both DC and ohmic resistance. In addition, higher concentrations of C–O, O–C=O, and phosphate components were found in the electrolyte deposits. Since these products are formed from electrolyte, their presence indicates not only that transfer through the electrolyte is more difficult, but also that the cell contains less electrolyte solvent after vibration. Since these cells are commercial, no specific mechanism has been suggested for the capacity loss, itself, however, it is well established that lithium is consumed by the reaction at the exposed electrode surface [
35]. Therefore, the mechanism suggested in our work is similarly consistent with a reduction in capacity. Vibration is reducing the cell performance in a similar manner to that of cycling cells, by removal, and then replacement, of the surface film.
It is recommended that original equipment manufacturers that use or make lithium-ion cells use a vibration profile within their testing procedures to determine expected cell lifetime.
5. Further Work
Having established these results, the authors would add that quantitative analysis of peaks for lithium-ion cells is difficult with XPS due to the number and variety of chemical species present in commercial cells and different vibration conditions; coupled with different chemical environments which can have similar binding energy. In addition, there are multiple different interpretations of the data and, as such, conclusions have only been made where the change in relative percentages of peaks is significant (>5%) and, thus, not open to variances in the C–C/C–H dependencies, or inadvertent bias introduced through peak selection. In essence, the authors have been careful to not over-interpret small changes in chemical composition between cells and made sure that only significant differences are considered. The XPS data fitting used is consistent for most of the chemical environments studied, however, there are variances in the percentage values of some C–O and O–C=O components between vibrated cells, as shown in
Figure 4 and recorded in
Table 3. The difference in these values may relate to the inherent differences in cell performance between identical cell types, as shown in [
38].
Over the course of this test, the cells were subject to a representative 10 years of vehicle vibration and very few other variations in conditions. During 10 years of actual use, the cell will be subjected to many other competing factors, such as temperature, state of charge, and other storage or cycling conditions. Vibration may play a minor part compared to these factors over a whole vehicle lifetime. However, its ability to remove surface film that has been selectively formed for its passivating abilities is unique from other mechanisms that temperature or state of charge induce and, therefore, may play a significant part in cell performance decline, especially when coupled with these other conditions.
The experimental results presented within [
29], highlight the potential dependency between the charge state of the cells and the level of vibration induced degradation. Within this paper, the primary objective was to ascertain and to quantify the underpinning causes of the capacity loss and the impedance rise reported within [
29]. This was achieved using a subset of the cell samples from [
29]. One area of future research would be to extend these results through a more comprehensive evaluation program in which multiple cells conditioned to different SOC levels are subject to vibration energy before undertaking XPS analysis. The aim of this further work would be to better understand if the degradation modes identified within this initial study are realized across the complete SOC range that the cells may be expected to operate within for a typical EV application.
It is acknowledged the limited dataset employed, in terms of cells initially exposed to vibration loading and the subset studied through post-mortem analysis. Whilst the authors are confident that the results presented here highlight the underlying causality between cell vibration and performance degradation, it is believe that these initial results warrant further research. Especially because the concentration of some chemical environments (C–O/O–C=O), presented in
Table 3, consistently vary between cells and, therefore, the type of vibration may induce a change in the surface film formed. It is, therefore, recommended that the scope of the experimental study to encompass cells from a broader cross-section of manufacturers, form-factors, and chemistries be expanded. This will identify if the experimental results presented here are transferable to other cell technologies. In addition, the mechanism of film formation proposed here requires further study and this would be improved by including additional analytical techniques to further elucidate the surface film composition of the replacement film that forms.


