Review

Structured Literature Review of Electricity Consumption Classification Using Smart Meter Data

by
Alexander Martin Tureczek
* and
Per Sieverts Nielsen
Systems Analysis, Management Engineering, Technical University of Denmark, 2800 Kongens Lyngby, Denmark
*
Author to whom correspondence should be addressed.
Energies 2017, 10(5), 584; https://doi.org/10.3390/en10050584
Submission received: 22 February 2017 / Revised: 6 April 2017 / Accepted: 19 April 2017 / Published: 25 April 2017

Abstract

:
Smart meters for measuring electricity consumption are fast becoming prevalent in households. The meters measure consumption on a very fine scale, usually on a 15 min basis, and the data give unprecedented granularity of consumption patterns at household level. A multitude of papers have emerged utilizing smart meter data for deepening our knowledge of consumption patterns. This paper applies a modification of Okoli’s method for conducting structured literature reviews to generate an overview of research in electricity customer classification using smart meter data. The process assessed 2099 papers before identifying 34 significant papers, and highlights three key points: prominent methods, datasets and application. Three important findings are outlined. First, only a few papers contemplate future applications of the classification, rendering papers relevant only in a classification setting. Second; the encountered classification methods do not consider correlation or time series analysis when classifying. The identified papers fail to thoroughly analyze the statistical properties of the data, investigations that could potentially improve classification performance. Third, the description of the data utilized is of varying quality, with only 50% acknowledging missing values impact on the final sample size. A data description score for assessing the quality in data description has been developed and applied to all papers reviewed.

1. Introduction

Recent developments in digital intelligent smart meters have made it possible to monitor energy consumption in details never before seen. The intelligent meters are part of a digitized society, which has been introduced over the last two decades, wherein home appliances, home automation and the smart meters make it possible to monitor energy consumption down to the second. Historically we have measured energy consumption at the household level with analog meters installed at every consumer, and biannually the consumer has reported the meter reading to the utility company for billing purposes. Conversely, intelligent meters are directly connected to the utility company and are able to measure consumption autonomously down to seconds, made possible by the technological development and also pushed by legislation. The intelligent meters enable fast and accurate billing, and also offer a unique and unprecedented opportunity to log and analyze electricity consumption at the consumer level.
Across the European Union member states have initiated installation of the intelligent meters. The European Commission sees the installation of smart meters as a way to improve the overall efficiency of the energy system, and the target is to reach 80% roll out by 2020 in the EU, with an expected reduction in CO2 emissions by 9% [1]. Denmark has passed legislation that requires all electricity consumers in Denmark, more than 3 million households and industries, to have intelligent meters installed by the end of 2020. The meters must record consumption at a frequency of no less than 15 min; a level of monitoring that yields at least 35,040 measurements per meter per year.
The high frequency electricity consumption data contain detailed information about consumption patterns, and this has initiated discussions among energy system stakeholders about utilizing the data for purposes other than billing. It has sprawled diverse research projects; such as research on data security and anonymization, non-intrusive load monitoring, load forecasting and consumer classification.
With this in mind, the purpose of this paper is twofold. First; to apply a modified version of Okoli’s structured literature review process for conducting an extensive and structured review of smart meter consumption classification, and second; to evaluate the current state of the art in electricity consumption classification using smart meter data and how these findings have been utilized. The review specifically identifies datasets, applied classification methods, results and potential gaps in the research into consumption classification using smart meter data. Papers assessed in this review apply smart meter data in the context of classifying electricity consumption.
Relevant papers have been identified using Thomson-Reuters Web-of-Science search engine, which was selected because of fast search options across multiple scientific journals with multiple search phrases. Thirty phrases were applied in the search and reported in this article. Although this review will not constitute an exhaustive list of search phrases or relevant papers the structured approach encompasses and identifies the most important contributions to the field of electricity customer classification using smart meter data.
This paper will adhere to Fink’s [2] definition of systematic literature review: “Such a review must be systematic in following a methodological approach, explicit in explaining the procedures by which it was conducted, comprehensive in its scope of including all relevant material, and hence reproducible by others who would follow the same approach in reviewing the topic” [3]. Even though Web-of-Science indexes many of the leading journals, there will always be papers that are not included in the database or simply do not comply with the selected search phrases. Despite this the approach will present a strong structure and a strict methodology, and encompass the key features and work in this research field, while maintaining reproducibility.
This review will identify the state of the art for electricity customer classification using smart meter data. It will identify methods and datasets, but it is outside this paper’s scope to describe the methods identified. The paper is structured as follows: Section 2 introduces the systematic review processes as suggested by Okoli [3], including a practical case on smart meter data in Section 3; Section 4 synthesizes the findings from the structured review process; and Section 5 discusses the findings and the future perspective of the research.

2. Systematic Literature Review Methodology—An Empirical Study

Okoli [3] stresses the importance and difference of systematic reviews versus conventional literature reviews: “rather than providing a base for the researcher’s own endeavours it creates a solid starting point for all other members of the academic community interested in a particular topic” [3], and that they are “studies that can stand on their own, in themselves a complete research pursuit” [3], with the “distinguishing feature of a stand-alone review is its scope and rigour” [3]. The point is that the systematic literature review has to be completed with a rigor and systematism that enable others to reproduce the work using the exact same approach. He emphasizes the importance of this type of review, as it represents a base for the community to summarize the bulk of knowledge on the topic. Okoli presents an eight-step guide to conduct systematic literature reviews in information sciences. This paper slightly modifies the original methodology by combining data extraction and synthesis into one category that better fits quantitative studies where the extraction and synthesis of knowledge are closer linked, compared to qualitative studies. The seven steps of the process are outlined below:
Modified Okoli process for systematic literature review:
1: 
Purpose of the literature review. Clearly state the purpose of the review. What is the scope and contribution of the work presented?
2: 
Protocol and training. Ensure consistency, alignment, and reproducibility by formally defining rules and evaluation criteria.
3: 
Searching for literature. Explicitly describe the search for literature search, the “what and where.”
4: 
Practical screen. Crude inclusion and exclusion of articles not based on quality appraisal but on “applicability to the research question.” The reviewer normally only reads the title and abstract at this stage. “The practical screen is to screen articles for inclusion. If the reviewer thinks that an article matches the superficial qualities of the practical screen it should be included” [3]; if in doubt the article should be included.
5: 
Quality appraisal. Screen for exclusion, and explicitly define the criteria for judging articles. All articles need to be read and scored for their quality, depending on the research methodologies employed by the articles [3].
6: 
Data extraction and synthesis of studies. Systematically extract the applicable information of the identified articles and combine the facts.
7: 
Writing the review.
In the following sections the method will be applied in an empirical study of “electricity consumption classification using smart meter data.” Section 2 of this paper encompasses step 1 and 2, stating the purpose and protocol. Section 3 describes steps 3–5: searching for literature, screening and quality appraisal of the selected papers. Section 4 will address the data extraction and synthesis from step 6, followed by Section 5, where results are discussed.

2.1. Purpose of the Literature Review

The purpose of this paper is to create a systematic literature review of electricity consumption classification using smart meter data. The review will apply a modification of the described systematic literature review process as the basis for a structured and reproducible review, identifying important contributions to electricity consumption classification research. The review will identify significant datasets and methods for classification, point out common denominators and highlight research gaps. The result is an extensive overview of what has been done in the field of smart meter consumption classification and what the authors see as the next step in applying smart meter data.
This review only includes peer-reviewed papers employing electricity consumption data for classification. Research into identification of specific appliances such as Non-Intrusive Load Monitoring (NILM), data collection systems and protocols, smart meter control and development, data privacy and tariff development are beyond the scope of this paper. Only papers published in English are included in this review to maintain reproducibility, fully acknowledging the quality of non-English research literature. The use of the English language is extensive in science and will encompass the current state of the art in smart meter classification.

2.2. Protocol and Training

Regardless of the number of reviewers working on a review it is advisable to develop a formal protocol with evaluation criteria for inclusion, exclusion and quality appraisal to ensure consistency across the reviewers and papers. For this paper a protocol was developed for evaluating and extracting data.

3. Article Selection

The following section will describe how the relevant literature was selected and screened. Section 3.1 describes the search for literature; Section 3.2 describes the initial crude inclusion and exclusion on title and split on paper topic. This is extended in Section 3.3 through screen of abstract, while Section 3.4 describes the final selection of papers for this review and the quality appraisal. The entire section is equivalent to steps 3–5 in the modified Okoli process.

3.1. Searching for Literature

There are several ways to search for literature. Popular and feasible strategies are to visit multipurpose search-engines like Google, Bing etc. or visit the academic publishers’ online resources and identify journals of interest, but as many journals are cross disciplinary it is not a simple task to identify relevant journals. This review uses the Thomson-Reuters search engine Web-of-Science (WoS), which is a comprehensive search engine for academic literature from books, conferences, symposiums and journal papers. It enables the user to search in topic, title, abstract, author etc. across more than 12,000 scientific journals [4].
The WoS engine was set up to search in title or topic. Thirty search phrases with relevance to smart meter data analytics were employed to identify relevant literature. Twenty-six phrases start with the words “smart meter” plus an amendment, such as “classification” resulting in the search phrase “smart meter classification”. Additionally, “electricity customer classification”, “electricity customer segmentation”, “residential electricity classification” and “residential electricity segmentation” could potentially be relevant and include smart meter data. These four search phrases were also integrated into this review even though they do not contain the “smart meter” prefix, so there were 30 search phrases in total. The complete list of search phrases employed is listed in the Appendix A.

3.2. Screening I: Title

Via WoS the 30 phrases resulted in 3922 papers, of which 2099, or approximately 53.5%, were unique. The title of each paper was read and marked for potential relevance for this study; if in doubt the paper was included. The metadata were compiled into an Excel sheet with their relevance marked along with the date of extraction. Due to the manual workload, the extraction took place over seven days, from 5–12 July 2016. Metadata for all papers included and excluded were kept on record.
As previously mentioned papers were excluded for a wide variety of reasons. Every paper remotely relevant to research on electricity consumption classification using smart meter data is included for further screening. After the initial search and screening of the 2099 unique articles, 552 were deemed related and relevant.

3.3. Screening II: Abstract and Removal of Non-Peer-Reviewed Papers

The second screening evaluates the abstract to give a clearer understanding and deeper assessment of the focus of each paper and establish relationships to smart meter data analytics. Each paper was on the basis of the abstract labeled according to its topic, resulting in 10 different topics shown in Figure 1.
The label Borderline (176) papers are potentially relevant for this review; it is not possible from the abstract to conclude if the papers utilize smart meter data or not. Consumption Classification (135) through application of smart meter data. Economic (3) papers are concerned with grid level business models. Meter Control (58) is research regarding smart meter development, control systems and data management. Non-Intrusive Load Monitoring or NILM (42) studies how to identify individual appliances and other electric components operated in households through application of smart meter data. Not Relevant (19) papers are concerned with health meters, transmission protocols and standards and do not necessarily utilize smart meter consumption data. Policy (9) papers address issues about tariff policy and qualitative behavioral studies. Privacy (20) papers are focused data security and privacy. Smart Grid Analytics (49) are related to the entire distribution and transmission infrastructure. Water (41) applies smart meter readings to water consumption. Figure 1 shows the distribution of the distinct categories and the number of peer-reviewed material in each.
Only papers from the research topics Consumption Classification and Borderline were included in this review. Abstracts from Consumption classification indicate that smart meter data are utilized for classification while borderline can contain papers that apply smart meter data for classification. The papers selected need to be read for quality appraisal to conclude if they are relevant for the review. For quality assurance only papers listed as peer-reviewed journal papers were included in the bulk of relevant papers. Though the exclusion of conference, symposiums and seminar papers may have deprived this review from including the most up to date ideas and concepts, the task of validating non-peer-reviewed articles was not feasible for this study.

3.4. Quality Appraisal

By only including peer-reviewed papers the number of papers was reduced to 58 ‘Consumption Classification’ papers and 78 ‘Borderline’ papers, adding up to 136. Borderline was revisited by screening all papers for dataset description, resulting in 13 papers applying smart meter data. The 13 papers from Borderline were potentially relevant resulting in a total of 71 papers.
71 papers were read, with special focus on data description, methodology and purpose. Of the 71 papers, 34 focus on clustering consumption; these 34 papers are included in the synthesis of studies. Appendix B includes a qualitative summary table of data extracted from the papers, and Appendix C includes a list of the 34 papers analyzed. A waterfall statistic depicting the screening impact on the final number of papers included in the review can be seen in Table 1.

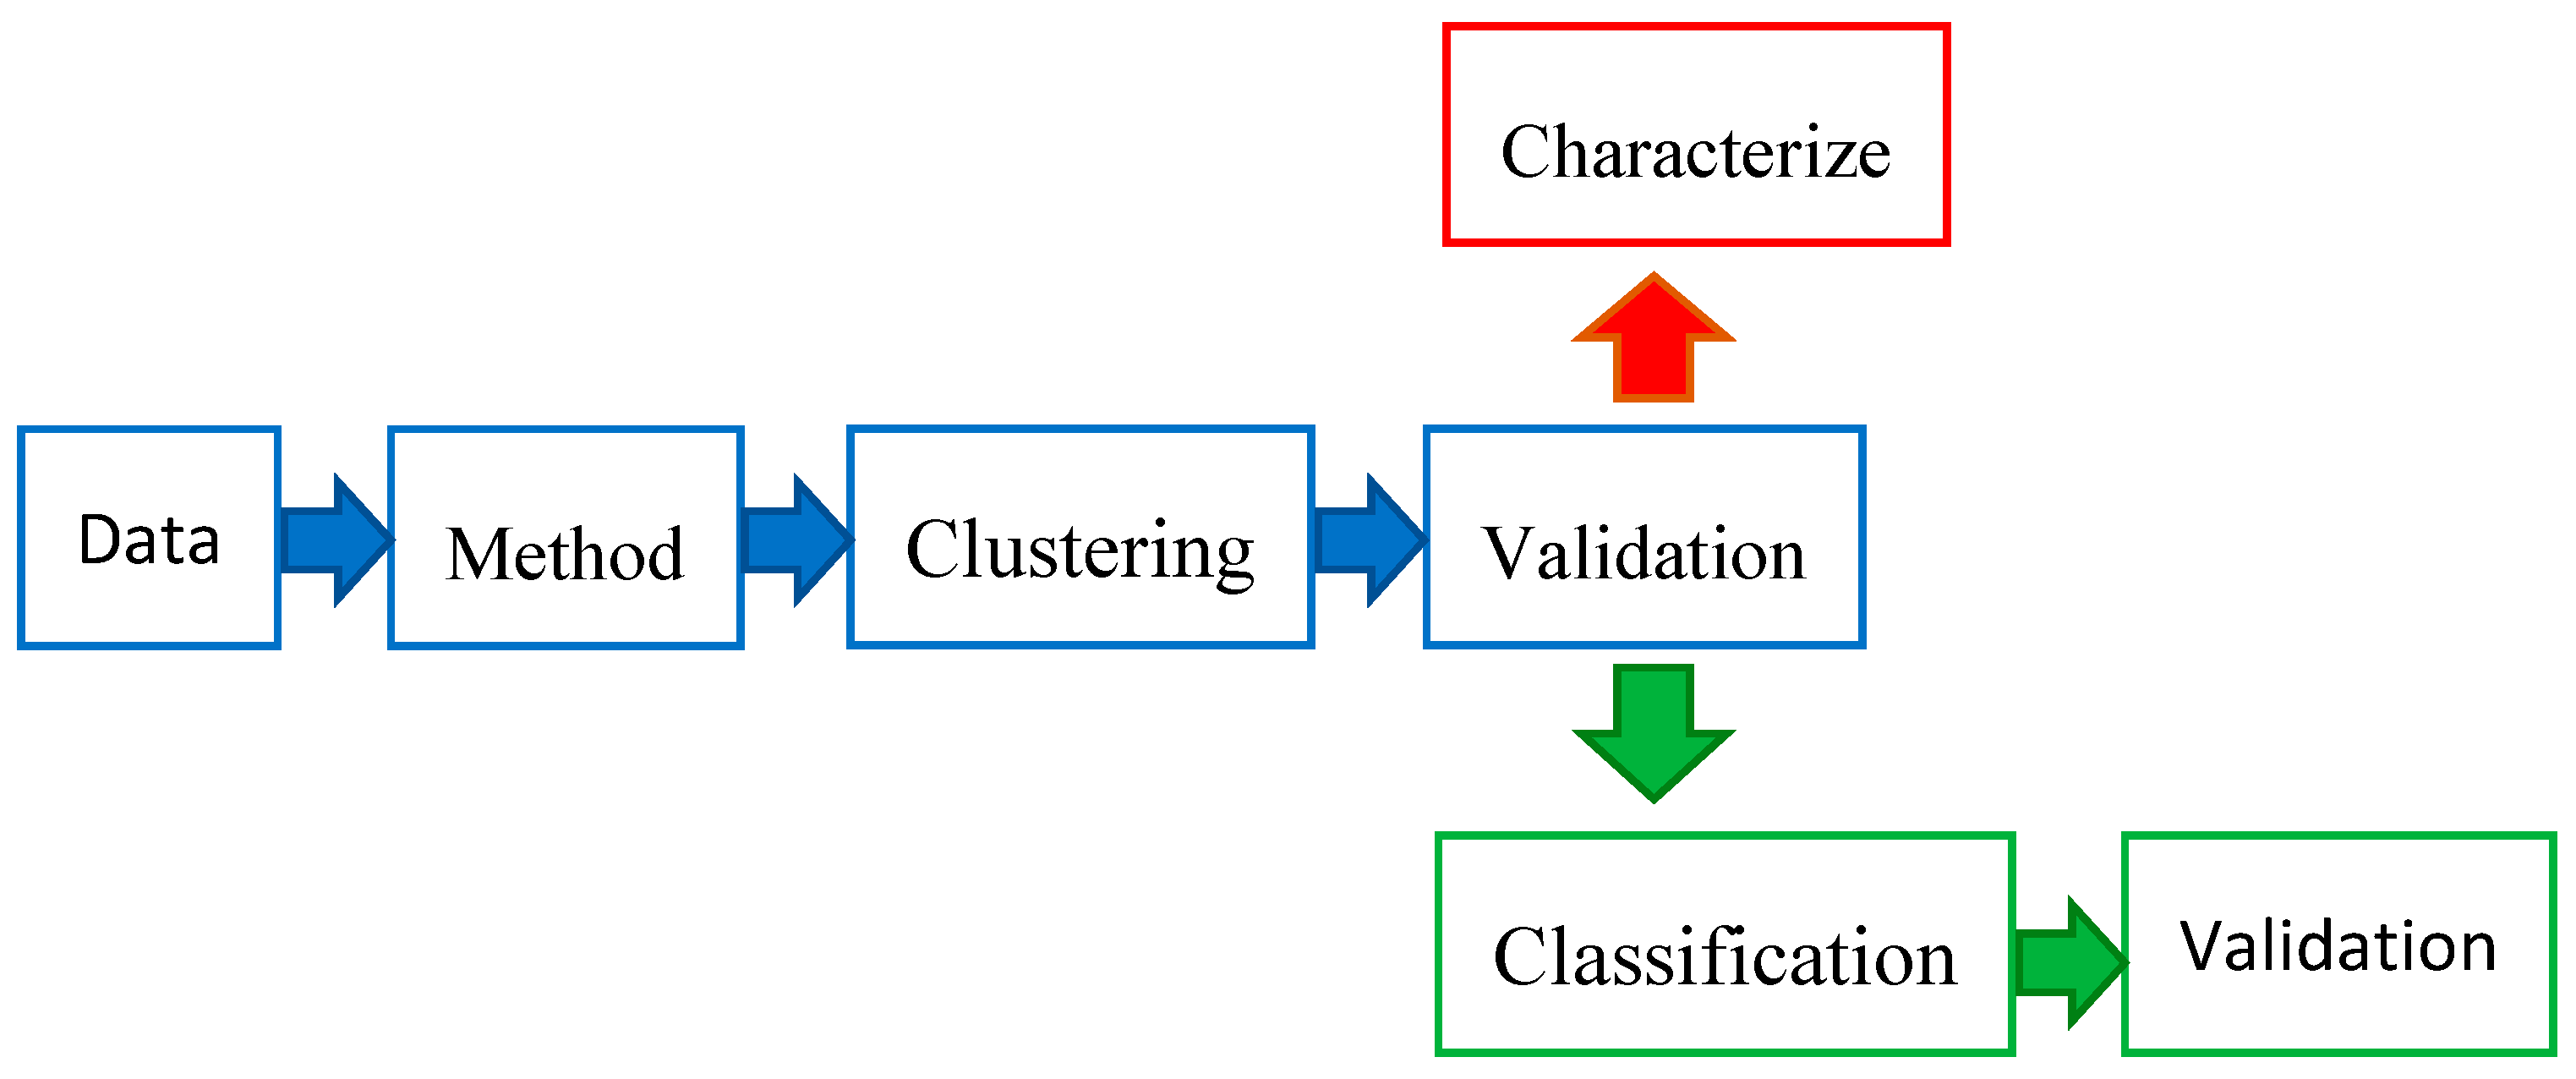
4. Data Extraction and Synthesis of Studies

The focus of the 34 selected papers is classification. Many different classification techniques have been tested on smart meter data. Dimensionality reduction has also been applied in order to make large data sets computationally feasible or ease visual inspection. Cluster indices have been applied to evaluate the stability of the resulting clusters. Generally, a large effort has been put into thorough description of methods for classifying consumption and validating the results using smart meter data. Surprisingly the description of the applied data does not adhere the same standard. The following chapter will describe the extracted information of the 34 articles and is divided into 4 sections. Section 4.1 discusses data description and introduces a 13-step data quality score. Section 4.2 is concerned with data classification techniques, while Section 4.3 focuses on dimensionality reduction and feature extraction. Section 4.4 describes the applied validation techniques for ensuring consistency in the clustering. This section complies with step 6 in the modified Okoli process.
Table 2 summarizes descriptive empirical information regarding the origin of data, how long the data have been recorded, at what frequency, the number of meters available and some of the classification methods applied.

4.1. Data Description and Empirical Findings

An important part when working with data analytics is knowledge about the data. This knowledge must be conveyed such that the reader gets an understanding of the data and how it can be utilized for analysis. For smart meter data, such information is sample size, supplier and customer type; residential or industrial. The 34 selected papers in this review demonstrate varying attention to these details when describing the data used in their research, some papers invest great effort while others apply much less care describing the data.
In order to quantify the quality of data description in each paper, the authors have created a data quality score, which is comprised of 13 measurable attributes. An attribute identified in the paper adds to the score, for a maximum of 13, the attributes are uniformly weighted.
The 13 attributes create a baseline of insight into the data used in the paper. The very thorough qualitative description of data seen in [5,6] elevates the level of description from the baseline but it is not honored in this score. The score is intended as a checklist for essential information when describing electricity smart meter data, and there are 5 categories comprising the score: Geographical information, Data information, Time information, Type information, References.
Geographical information (3 points): The country where the data was collected is relevant to assess possible (de)similarities in consumers and energy systems. Region is relevant for the understanding of the consumers, is the region. Is the region scarcely populated, having fluctuating climate or other identifying features? Supplier indicates who supplied the data for the study, and describes how representative it is of the population.
Data information (4 points): the initial size of the dataset is very relevant to reader and the generalizability of the results. Any real-life data set needs preprocessing before it is applicable for analysis, was certain consumers removed from the data, or were there other exclusion criteria? There should be a clear description of the reduction this preprocessing had on the sample size. After preprocessing is there listed an unambiguous final sample size? The data is generated from meters which are prone to random errors or missing values in the recordings. Have the authors acknowledged data imperfections and included a description of how missing or erroneous recordings were resolved.
Time information (4 points): The recording interval has a significant impact on the analytical challenges the data can help explain therefore the recording frequency must be stated including commence and end of the recordings. The length of uninterrupted recordings gives an indication of generalizability and the possibility of doing classification on daily, monthly, quarterly or yearly data.
Type information (1 point): The type of consumers, residential, industrial or both, the data set includes. These clients can exhibit vastly different consumption patterns.
Referencing other data sets (1 point): A Paper can reference data description in other papers of the same data. This attribute has been included to enable articles without data description to get acknowledgement through other papers describing the exact same data set. This is also relevant if the authors have described data in a previous paper. If the attribute information exists in the referenced papers these are counted in the score.
The developed data description score has been applied to all 34 papers in this review. For illustration purposes Table 3 shows the scoring of two papers. Both score 12 but they don’t include the same information; paper [7] has no data referral while paper [8] has no mentioning of the supplier of the data.
Table 4 shows the penetration of different attributes in the papers, and no attribute is accommodated by all. The most prevalent are identifiable in 33 (97%) papers. There is a consensus among more than 30 (>90%) papers that country, initial size, clear description of reduction, final size, recording frequency and consumer type is relevant information to state in a paper when describing the data 30 papers (88%) found that the length of recording is essential information to state when describing the data, while 27 papers (79%) include information about the region and supplier of the data. Only 23 respectively 22 found it important to include information about commencing and end time for the recording.
It is surprising that missing values is only mentioned in 50% of the papers. Missing data is prevalent in any real-life datasets, and how they are resolved is important to describe to account for any bias. The description can be very brief, and paper [9] shows how a short yet detailed description of data preprocessing, with encountered issues and main strategies for alleviating them, can be integrated into a paper.
Table 5 shows the distribution of scores by the 34 papers. It is seen that 3 papers have a mentioning of all 13 attributes, while 23 papers include 10–12 attributes, resulting in 26 papers scoring 10 or more.

4.2. Classification

With more than 10 different classification methods applied in 34 papers, the most prevalent methods observed was K-means clustering. K-means and related methods like K-medoid and Fuzzy K-means are used in 22 (65%) articles, often for performance comparison to more advanced techniques [10,11,12]. The popularity of K-means clustering can be attributed to its simplicity and generally satisfactory performance. K-means is also implemented in many software solutions, both proprietary and open source, making it an easy choice for fast clustering. The greedy design approach of the K-means algorithm can create suboptimum solutions by unfortunate initial starting conditions and converge in local optima; a problem that can be alleviated by rerunning the algorithm several times [13,14].
Agglomerative hierarchical clustering is used in 10 (29%) of the papers. Hierarchical clustering offers intuitive graphical display and interpretation of the class evolution for different thresholds in one figure. This method requires considerations about distance measures given by the link function. Popular link functions are the Euclidian, Wald and average linking.
More advanced models like Follow-the-leader and Mixture models are observed respectively in 5 (15%) and 3 (9%) papers for instance in [15,16]. The clustering is frequently applied directly on the raw data without investigating inherent features in data that could aid in classification, features like autocorrelation, seasonality, variance and average. Many features can automatically be extracted from data, dimensionality reduction techniques such as principal components or self-organizing maps can help identify hidden features.
Smart meter data can be regarded as signals; as such it could be advantageous to apply techniques that leverage time series information like periodicity or autocorrelation. In [12] Fast Fourier transform (FFT), a frequency domain analysis technique for signals, is applied, but several other techniques exist for analyzing time series. Wavelet transform, a signal processing method, is good for feature extraction and dimensionality reduction, and could be an interesting addition to the analysis of smart meter data but was not encountered in any of the papers.
The most frequent approach to customer classification encountered is unsupervised learning. In [17] artificial neural networks are applied for supervised learning by mapping data to clusters in an input to response (y = a·x) manner, but this cannot be done without prior knowledge of the clusters. To identify the clusters K-means is applied for unsupervised clustering before creating a neural network. Regression techniques like Hidden Markov models [18], linear regression [7] or logit [19], [20] are utilized for supervised classification of consumption, but are all using unsupervised clustering or survey data for initial starting conditions. Table 6 show a summary of the most frequently encountered methods with their most notable properties, while Table 7 gives an overview of different link functions applied in for instance Hierarchical clustering.

4.3. Dimensionality Reduction and Feature Extraction

Unsupervised classification techniques like K-means do not consider the inherent information stored in time series. There is no connection to autocorrelation or other features in the data. The algorithm regards every time-step as a feature or a dimension with no correlation to neighboring readings. Not necessarily a problem but with long recording windows—weeks or months—and few meters the curse of dimensionality could impact the applicability of the results. The curse revolves around increase in the required amount of data when increasing the number of dimensions; this is an exponential growth pattern and can render the data insufficient for the analysis.
Real life data—regardless of dimensions—often have some natural clustering or dependencies which can be highlighted and exploited by dimensionality reduction [21]. A popular algorithm for reducing dimensions in smart meter data sets is Self-Organizing Maps (SOM). SOM projects data into lower dimensions and can be useful for visualization, “SOM is an algorithm characterized by robustness and computational efficiency” [22]. While [23] notes that SOM is useful for handling noisy data and outliers due to the dimensionality reduction, which in turn results in better performance from K-means and other clusters algorithms compared to direct application of the algorithms on raw data.
SOM also delivers unsupervised classification which “can be viewed as a constrained version of K-means clustering in which the prototypes are encouraged to lie in a one or two dimensional manifold of the feature space” [24]. The two-dimensional manifold gives SOM desirable properties for visual inspection of the data.
From the papers, it is inconclusive whether to apply dimensionality reduction on a smart meter data set; “In general, the counterpart of the benefits of data size reduction is lower classification effectiveness, in terms of higher clustering validity indicators. On the basis of the results, the validity of the data size reduction methods can be generally indicated as acceptable” [10], rendering the application of dimensionality reduction at the discretion of the researchers on case by case basis. It is a trade-off between classification effectiveness and validity of clusters.

4.4. Cluster Validity Check

Estimating the optimum number of clusters is not a trivial task. Without prior knowledge of the underlying clusters there is no unambiguous way to identify the true underlying clusters. In an effort to quantify the uncertainty of the clusters [10], applies 4 different indices for cluster evaluation, of which the Davies-Bouldin (DBI), Mean Index Adequacy (MIA) and the cluster-dispersion index (CDI) are frequently applied in other papers for cluster selection.
Where regression is a minimization problem, minimizing sums of squares minimizing variance in clusters would yield the same number of clusters as meters which is not desirable. A wide array of indices for validation of cluster stability has been developed to aid the cluster selection process. There is no shortage of validity indices; the 34 papers in this review employ 18 different indices [25], notes: “Although these indexes [DBI, CDI, MIA] are widely accepted in clustering, they are not proficient in specific applications such as electricity load profile clustering. They do not consider domain knowledge and only focus on the internal structure of nodes. For these reasons, we focus on an external validity index such as entropy, which compares the clustering answer with pre-assigned, ground-truth clusters”. There still does not exist a single adequate index for validation of clusters, as with model diagnostics in regression the combination of indices help give an overview of the performance. Table 8 lists the most prevalent indices in this review and lists their properties.

5. Findings and Discussion

The proposed method for conducting a structured literature review applied in this paper has supplied a structure and simple step-by-step guidelines for ensuring consistency, objective evaluation and selection of papers. For a detailed summary of the qualitative findings from the 34 analyzed papers, see Appendix B.
In unsupervised segmentation, no prior information exists about the true underlying classes. There is no unambiguous minimization problem that can identify the true clusters. To alleviate the difficulties in selecting the number of clusters the literature has developed a wide variety of cluster performance estimators. The performance estimates help researchers determine the optimum number of clusters. Performance estimators evaluate different information [25], as with unsupervised classification, the performance estimates should be perceived as a tool to validate and not prove the correctness of the clusters.
The evaluated papers roughly follow the modelling structure outlined in Figure 2. Blue indicate the elements all papers undergo; Describing the data from meters and applicable external data. Method selection, dim reduction and classification algorithms. Clustering of the meter data and validation of the clusters to select optimum classification [10].
Successful classification leads to interest in cluster composition. This is often done with the aid of external data such as [6,27] combine smart meter data with survey data to attain deeper knowledge of the identifying features of the individual clusters.
Another application of the clusters is applying the clusters to new data in order to test the classification abilities of the clusters identified (green) on unknown data. Clustering on new data requires validation of the resulting classification a process similar to validating the initial clulsters.
Few papers charachterize the entire process of clustering, characterization and classification of new data [20], for a more complete overview of consumption behavior. While papers focusing only on clustering and validation (blue) result in more detailed comparissons of cluster methods.
Some papers are focused on evaluating unsupervised classification and cluster validation techniques [10,13,16], while others are looking at the implications of the clusters on our understanding of consumption.
Few papers also characterize the clusters identified (red). A Portuguese study with 265 meters enriched with survey data showed that it is possible to segment into distinct clusters and make meaningful socio-demographic deductions about the different clusters [6]. Through the clusters the study recognized 3 types of consumption: “fuel poverty” as households not keeping their home adequately warm, “Standard comfort” households and “fat energy” households which could be more rational in their consumption pattern. A similar study in Japan shows the ability to identify different consumption patterns and quantify the excess energy used for different life styles only by analyzing smart meter data, and discuss how these results can be used to influence the residential consumption by targeted and personalized information [12]. The Japanese study shows how differences in daily routines influence the consumption, while the Portuguese study identifies distinct levels of consumption within the same daily routines.
The high frequency time series created by smart meters, give invaluable insights into electricity consumption. For instance, the meters make it possible to investigate how well the UK Elexon profiles fit modern data segmentation techniques. The Elexon profiles divide all electricity customers in the UK into seven distinct clusters, two for residential and 5 for industry. “The usefulness of these Elexon “profiles” for domestic customers is unsatisfactory. It has been reported that the use of the profiles has made about 9 × 10¹² W·h electricity losses yearly in the UK” [14]. Smart meter analytics will become increasingly important in the development of the electricity grid through consumption insights. Consumption profiles can aid in the construction of dynamic tariffs for more fair pricing [28] and smarter utilization of the existing grid by creating economic incentives for consumption flexibility. Survey and socio-economic data can further improve the understanding of consumers and optimize the electricity grid. It’s a good business case reducing costs while simultaneously reducing the carbon footprint from electricity production.
Some papers identify yearly seasonality, and are also able to identify distinct time periods during the week or day [29]. The inclusion of weather information is rare and when included it is for improving the model with temperature compensation [18,22]. Weather compensation is generally applied when the meter readings are collected in different regions or with high seasonal variations with varying consumption across the year.
Smart meter data evolves over time and can to some extend be expected to contain autocorrelation. Few of the papers apply time series techniques to leverage this. K-means evaluates time steps independently, and does not account for any correlation structure between the time steps. It is a fast and capable method which is implemented in all major statistical packages and simple to implement. It has drawbacks, such as getting trapped in local optima and not leveraging the correlation in the data. To account for autocorrelation or multicollinearity in the data, methods for dimensionality reduction are applied. Principal Component Analysis or Self-Organizing Maps removes correlation structures and maps the data to a reduced feature space, but it comes at a cost of interpretability of the final results. Paper [12] applies time series techniques through Fourier transformation of the meter data which results in a frequency spectrum for each meter, then applying K-means on the largest peak in the spectrum. Fast Fourier Transform stems from signal analysis; it converts data from time domain to frequency domain and lists the observed frequencies, which then can be considered as features. In the Fourier transform one would have to decide between time or frequency domain as there is no interpretable link between them. You would know the frequencies but not when they occur. Interestingly no paper looked at classical time series with ARIMA models and how to classify them. Finally, it would have been interesting to see Wavelets applied as they combine time and frequency information in contrast to Fourier transform. Furthermore, Wavelets are capable of reducing dimensionality and extracting features, which can be used as input in K-means classification.
The analysis of papers included in this review show that they vary greatly in the effort put into describing the data applied in their research. Most include information regarding country, supplier and recording frequency, prevalent in 33 out of 34 papers. Surprisingly only 50% of the papers report any information on encountering and handling missing values. The meters producing the time series can be subject to random issues with transmitting data, resulting in missing meter readings that need to be rectified. Some missing values can be imputed while others are more severe and need the entire meter series to be discarded from the study. If values were imputed, a clear description of the processes is needed to evaluate the implications. Discarding has an immediate effect on the final sample size. Both processes have implications on the data and the resulting analysis and deductions, and lack of description impacts reproducibility of the study. It is expected that any data set will contain imperfect data, and it is surprising that so many papers neglect to describe or acknowledge this phenomenon. Section 4.1 identifies papers with short and concise description of missing values and remedies which fit into scientific papers.
Over the past decades new household products that run on electricity have been introduced, elevating the individual average consumption of the population. Even though these new appliances improve in efficiency due to technological advances and the electricity consumption in the industrialized world is stabilizing. This stability can be offset by introduction of new technology like computers, or electrification of the transportation sector. Another important component relating to energy consumption is age compositions. In the 34 paper analyzed in this review there is no focus on consumer transition between classes. Classes are regarded as static, derived from data without considering the human behavior they depict can change over time. Suburban areas progress from families with toddlers to teens to elderly until the process repeats every 20–30 year with changing consumption patterns, and this time dependency and the implications of it needs to be investigated. Is it reasonable to assume the clusters identified today are valid in a different setting? Transitions between classes are relevant when planning for future power supply and the insights from smart meter analytics can help identify changes in consumption and transitions, which are valuable for the continued maintenance of the segmentation.
It is not only in households smart meters can have an effect. When electricity replaces fossil fuels in the transportation sector, the demand for electricity will increase substantially as will the variance in the demand. More demand can result in higher peak power through the existing cables, which are designed to cope with a smaller maximum load than the future potentially could demand. It is an expensive and possibly infeasible solution to upgrade the cables to comply with 3–4 times higher peak demand, which electrification of the transportation sector could require. This brings focus to smarter use of the existing grid and the importance of understanding consumption behavior. Peak shaving by moving consumption periods could help alleviate problems with increased demand. This is where smart meters could supply insight and help make the grid and tariffs even smarter.
Denmark projects to reach 84% renewable electricity in 2020 [30], Sweden has aimed high at becoming the first zero-emission welfare country [31]. Zero environmental impact electricity could potentially change consumption patterns to more and different consumption. Will Europeans continue to be energy conscious when there is an abundance of renewable electricity in the grid with no carbon footprint?

6. Conclusions

The proposed method for structured literature review outlined in [3] and demonstrated in this paper has supplied a structure and simple step-by-step guidelines for ensuring consistency, securing objective evaluation and selection of papers. The review applied 30 search phrases with relevance to smart meters, initially encompassing 2099 unique written pieces. Which after extensive screening of title and abstract and the inclusion of peer-reviewed papers, was reduced to 71 papers containing potential studies regarding electricity consumption classification using smart meter data. These 71 papers were thoroughly screened for purpose, data, method and results until a final list of 34 relevant papers concerning electricity consumption classification using smart meter data.
The 34 papers evaluated in this review have shown that electricity consumers are not one homogenous group but can be segmented—using only consumption data—into smaller more homogenous clusters. The clusters are vastly different from the previously used profiles that are built on socio-economic clustering.
Unsupervised learning techniques as the K-means family and hierarchical clustering are widely applied on smart meter data in these papers, either directly for classification or as performance benchmark for evaluation of more advanced methods as follow-the-leader, hidden Markov models and mixture models [10]. For hierarchical clustering the selection of link function influences the clustering performance, several different distance measures are applied.
It is generally concluded that smart meter data is very applicable for cluster analysis, with overall satisfactory performance for individual methods. K-means and hierarchical clustering are simple and fast techniques. While there is some discrepancy in the performance, but all methods introduced can perform satisfactory and meaningful classification of consumption regardless of households or MW consumers.
Having shown that simple classification algorithms like K-means and Hierarchical clustering works on different smart meter data sets we find it appropriate to move focus from simple classification of smart meter consumption data to how these findings provide value in a societal setting. This could be in tariff development or in consumption flexibility analysis. Keeping focus on the statistical classification a more thorough investigation of the statistical properties of the data is a much-needed addition to the standard classification analysis of the data encountered in the analyzed papers. Deeper investigation of the time series properties such as correlation structure and its impact on the classification may contribute to even better understanding of consumption in general.

Acknowledgments

This work is part of the CITIES (Centre for IT–Intelligent Energy System in Cities) project funded in part of the Danish Innovation found. Grant DSF 1305-00027B (Det Strategiske Forskningsråd). The authors wish to thank Pia Thomsen, Rikke Brinkø for helpful inputs, comments and proof reading.

Author Contributions

Alexander Martin Tureczek and Per Sieverts Nielsen conceived and designed the study; Alexander Martin Tureczek performed the literature search and the analysis; Alexander Martin Tureczek and Per Sieverts Nielsen wrote paper.

Conflicts of Interest

The authors declare no conflict of interest.

Appendix A. List of Search Phrases

Table A1. List of search phrases applied.
Search PhraseNon-Unique Hits
Electricity customer classification123
Electricity customer segmentation34
Residential electricity classification59
Residential electricity segmentation16
Smart meter analysis767
Smart meter analytics61
Smart meter big data65
Smart meter classification187
Smart meter clustering125
Smart meter consumption classification47
Smart meter consumption data704
Smart meter consumption profiling112
Smart meter consumption segmentation22
Smart meter customer classification25
Smart meter customer segmentation15
Smart meter data analysis443
Smart meter data mining46
Smart meter feature construction12
Smart meter feature extraction21
Smart meter learning117
Smart meter load monitoring262
Smart meter load profiling147
Smart meter machine learning47
Smart meter profiling280
Smart meter segmentation27
Smart meter statistical learning6
Smart meter statistics52
Smart meter supervised learning7
Smart meter time series86
Smart meter unsupervised learning7
Sum3922

Appendix B. Quantitative Summary Table

Papers reference number in column “Paper(s)” are linked to Appendix C.
Table A2. Data synthesis summary.
CategorySplitPaper(s)
Classification
K-means[1–23]
Hierarchical[1–3,10,15,17,19,20,22,24]
Fuzzy K-means[1,15,17,19]
Follow the leader[1,9,19,25,26]
K-medoid[9,14]
Mixture models[10,27,28]
Fast Fourier Transform[15]
Others[15–21,29]
Forecasting
Regression[8,13,27,30–33]
HMM[16,23]
Other[13,34]
Dimension reduction
Principal Components[16,34]
Self-organizing-Maps[2,9,11,19,21]
Validation
DBI[1,6,9–11,13,15,17,20,26]
CDI[1,10,17,18,22,25,26]
Dunn & Silhouette[11,13,14,20]
Entropy[19,21,22,28]
MIA[6,10,17,25,26]
Other[1–3,10,12–18,20–22,26,27,30]
Size
0–250[1,4,6,8,10,16,18,19,22,25,26,34]
250–500[17,24]
500–1000[5,23,27,30]
1000–2500[7,11,12,15,20,21]
2500–5000[2,9,13,14,28,29,31–33]
Other[3]
Region
Europe[1,2,4–6,9,10,13,14,16–20,24–26,28,29,31–33]
North America[3,8,12,23,27,30,34]
Asia[11,15,21,22]
Other[7]
Period
1 day[1,18,19,26]
1 month[7,21,22]
2–6 months[9,30]
7–12 months[17,23]
1 year[2,6,8,10,20,27,28,31,34]
1–2 years[3,5,13–15,29,32]
2+ years[11,24,33]
Missing[4,12,16,25]
Recording frequency
<1 min[10]
1 min[8,15]
10 min[16,23,30]
15 min[1,4,7,17–20,22,24–26]
30 min[9,13,14,28,29,31,32]
60 min[2,3,5,6,11,12,21,33,34]
24 h[27]
Type of customer
Industrial[1,12,17–20,22,25,26]
Residential[3–5,8–11,13–16,23,24,28–32,34]
Mix[2,6,7,21,27,33]

Appendix C. List of Articles

  • Chicco, G.; Napoli, R.; Piglione, F. Comparisons among clustering techniques for electricity customer classification. IEEE Trans. Power Syst. 2006, 21, 1–7.
  • Räsänen, T.; Voukantsis, D.; Niska, H.; Karatzas, K.; Kolehmainen, M. Data-based method for creating electricity use load profiles using large amount of customer-specific hourly measured electricity use data. Appl. Energy 2010, 87, 3538–3545.
  • Kwac, J.; Flora, J.; Rajagopal, R. Household energy consumption segmentation using hourly data. IEEE Trans. Smart Grid 2014, 5, 420–430.
  • Flath, C.; Nicolay, D.; Conte, T.; Van Dinther, C.; Filipova-Neumann, L. Cluster analysis of smart metering data: An implementation in practice. Bus. Inf. Syst. Eng. 2012, 4, 31–39.
  • Benítez, I.; Quijano, A.; Díez, J.; Delgado, I. Dynamic clustering segmentation applied to load profiles of energy consumption from Spanish customers. Int. J. Electr. Power Energy Syst. 2014, 55, 437–448.
  • López, J.J.; Aguado, J.A.; Martín, F.; Mu, F.; Rodríguez, A.; Ruiz, J.E. Hopfield—K-Means clustering algorithm: A proposal for the segmentation of electricity customers. Electr. Power Syst. Res. 2011, 81, 716–724.
  • Macedo, M.N.Q.; Galo, J.J.M.; De Almeida L.A.L.; Lima, A.C.D.C. Demand side management using artificial neural networks in a smart grid environment. Renew. Sustain. Energy Rev. 2015, 41, 128–133.
  • Rhodes, J.D.; Cole, W.J.; Upshaw, C.R.; Edgar, T.F.; Webber, M.E. Clustering analysis of residential electricity demand profiles. Appl. Energy 2014, 135, 461–471.
  • Mcloughlin, F.; Duffy, A.; Conlon, M. A clustering approach to domestic electricity load profile characterisation using smart metering data. Appl. Energy 2015, 141, 190–199.
  • Granell, R.; Axon, C.J.; Wallom, D.C.H. Impacts of raw data temporal resolution using selected clustering methods on residential electricity load profiles. IEEE Trans. Power Syst. 2015, 30, 3217–3224.
  • Park, S.; Ryu, S.; Choi, Y.; Kim, J.; Kim, H. Data-driven baseline estimation of residential buildings for demand response. Energies 2015, 8, 10239–10259.
  • Lavin, A.; Klabjan, D. Clustering time-series energy data from smart meters. Energy Effic. 2014, 8, 681–689.
  • Viegas, J.L.; Vieira, S.M.; Melício, R.; Mendes, V.M.F.; Sousa, J.M.C. Classification of new electricity customers based on surveys and smart metering data Commission for Energy Regulation. Energy 2016, 107, 804–817.
  • Al-otaibi, R.; Jin, N.; Wilcox, T.; Flach, P. Feature construction and calibration for clustering daily load curves from smart-meter data. IEEE Trans. Ind. Inform. 2016, 12, 645–654.
  • Ozawa, A.; Furusato, R.; Yoshida, Y. Determining the relationship between a household’s lifestyle and its electricity consumption in Japan by analyzing measured electric load profiles. Energy Build. 2016, 119, 200–210.
  • Basu, K.; Debusschere, V.; Douzal-chouakria, A.; Bacha, S. Time series distance-based methods for non-intrusive load monitoring in residential buildings. Energy Build. 2015, 96, 109–117.
  • Tsekouras, G.J.; Hatziargyriou, N.D.; Member, S.; Dialynas, E.N.; Member, S. Two-stage pattern recognition of load curves for classification of electricity customers. IEEE Trans. Power Syst. 2007, 22, 1120–1128.
  • Chicco, G.; Ionel, O.M.; Porumb, R. Electrical load pattern grouping based on centroid model with ant colony clustering. IEEE Trans. Power Syst. 2013, 28, 1706–1715.
  • Chicco, G.; Sumaili Akilimali, J. Renyi entropy-based classification of daily electrical load patterns. IET Gener. Transm. Distrib. 2010, 4, 736–745.
  • Ramos, S.; Duarte, J.M.; Duarte, F.J.; Vale, Z. A data-mining-based methodology to support MV electricity customers’ characterization. Energy Build. 2015, 91, 16–25.
  • Piao, M.; Shon, H.; Lee, J.; Ryu, K. Subspace projection method based clustering analysis in load profiling. IEEE Trans. Power Syst. 2014, 29, 2628–2635.
  • Kang, J.; Lee, J. Electricity customer clustering following experts’ principle for demand response applications. Energies 2015, 8, 12242–12265.
  • Albert, A.; Rajagopal, R. Smart meter driven segmentation: What your consumption says about you. IEEE Trans. Power Syst. 2013, 28, 4019–4030.
  • Gouveia, J.P.; Seixas, J. Unraveling electricity consumption profiles in households through clusters: Combining smart meters and door-to-door surveys. Energy Build. 2016, 116, 666–676.
  • Chicco, G.; Napoli, R.; Piglione, F.; Postolache, P.; Scutariu, M.; Toader, C. Load pattern-based classification of electricity customers. IEEE Trans. Power Syst. 2004, 19, 1232–1239.
  • Carpaneto, E.; Chicco, G.; Napoli, R.; Scutariu, M. Electricity customer classification using frequency—Domain load pattern data. Int. J. Electr. Power Energy Syst. 2006, 28, 13–20.
  • Coke, G.; Tsao, M. Random effects mixture models for clustering electrical load series. J. Time Ser. Anal. 2010, 31, 451–464.
  • Haben, S.; Singleton, C.; Grindrod, P. Analysis and clustering of residential customers energy behavioral demand using smart meter data. IEEE Trans. Smart Grid 2015, 7, 136–144.
  • Tong, X.; Li, R.; Li, F.; Kang, C. Cross-domain feature selection and coding for household energy behavior. Energy 2016, 107, 9–16.
  • Kavousian, A.; Rajagopal, R.; Fischer, M. Determinants of residential electricity consumption: Using smart meter data to examine the effect of climate , building characteristics, appliance stock and occupants’ behavior. Energy 2013, 55, 184–194.
  • Mcloughlin, F.; Duffy, A.; Conlon, M. Characterising domestic electricity consumption patterns by dwelling and occupant socio-economic variables: An Irish case study. Energy Build. 2012, 48, 240–248.
  • Jin, N.; Flach, P.; Wilcox, T.; Sellman, R.; Thumim, J.; Knobbe, A. Subgroup discovery in smart electricity meter data. IEEE Trans. Ind. Infrom. 2014, 10, 1327–1336.
  • Andersen, F.M.; Larsen H, V.; Boomsma, T.K. Long-term forecasting of hourly electricity load: Identification of consumption profiles and segmentation of customers. Energy Convers. Manag. 2013, 68, 244–252.
  • Ndiaye, D.; Gabriel, K. Principal component analysis of the electricity consumption in residential dwellings. Energy Build. 2011, 43, 446–453.

References

  1. EU Commission. Smart Grids and Meters. Available online: https://ec.europa.eu/energy/en/topics/markets-and-consumers/smart-grids-and-meters (accessed on 20 December 2016).
  2. Fink, A. Conducting Research Literature Reviews: From the Internet to Paper, 2nd ed.; Sage Publications: Thousand Oaks, CA, USA, 2005. [Google Scholar]
  3. Okoli, C. A guide to conducting a standalone systematic literature review. Commun. Assoc. Inf. Syst. 2015, 37, 879–910. [Google Scholar]
  4. Thomson Reuters. Web of Science 1 Billion Cited References and Counting. Thomson Reuters 2017. Available online: http://stateofinnovation.thomsonreuters.com/web-of-science-1-billion-cited-references-and-counting?utm_source=false&utm_medium=false&utm_campaign=false (accessed on 5 January 5 2017).
  5. Benítez, I.; Quijano, A.; Díez, J.; Delgado, I. Dynamic clustering segmentation applied to load profiles of energy consumption from Spanish customers. Int. J. Electr. Power Energy Syst. 2014, 55, 437–448. [Google Scholar] [CrossRef]
  6. Gouveia, J.P.; Seixas, J. Unraveling electricity consumption profiles in households through clusters: Combining smart meters and door-to-door surveys. Energy Build. 2016, 116, 666–676. [Google Scholar] [CrossRef]
  7. Kavousian, A.; Rajagopal, R.; Fischer, M. Determinants of residential electricity consumption: Using smart meter data to examine the effect of climate, building characteristics, appliance stock, and occupants’ behavior. Energy 2013, 55, 184–194. [Google Scholar] [CrossRef]
  8. Mcloughlin, F.; Duffy, A.; Conlon, M. Characterising domestic electricity consumption patterns by dwelling and occupant socio-economic variables: An Irish case study. Energy Build. 2012, 48, 240–248. [Google Scholar] [CrossRef]
  9. Flath, C.; Nicolay, D.; Conte, T.; Van Dinther, C.; Filipova-Neumann, L. Cluster analysis of smart metering data: An implementation in practice. Bus. Inf. Syst. Eng. 2012, 4, 31–39. [Google Scholar] [CrossRef]
  10. Chicco, G.; Napoli, R.; Piglione, F. Comparisons among clustering techniques for electricity customer classification. IEEE Trans. Power Syst. 2006, 21, 1–7. [Google Scholar] [CrossRef]
  11. Mcloughlin, F.; Duffy, A.; Conlon, M. A clustering approach to domestic electricity load profile characterisation using smart metering data. Appl. Energy 2015, 141, 190–199. [Google Scholar] [CrossRef]
  12. Ozawa, A.; Furusato, R.; Yoshida, Y. Determining the relationship between a household’s lifestyle and its electricity consumption in Japan by analyzing measured electric load profiles. Energy Build. 2016, 119, 200–210. [Google Scholar] [CrossRef]
  13. Granell, R.; Axon, C.J.; Wallom, D.C.H. Impacts of raw data temporal resolution using selected clustering methods on residential electricity load profiles. IEEE Trans. Power Syst. 2015, 30, 3217–3224. [Google Scholar] [CrossRef]
  14. Al-otaibi, R.; Jin, N.; Wilcox, T.; Flach, P. Feature construction and calibration for clustering daily load curves from smart-meter data. IEEE Trans. Ind. Inform. 2016, 12, 645–654. [Google Scholar] [CrossRef]
  15. Coke, G.; Tsao, M. Random effects mixture models for clustering electrical load series. J. Time Ser. Anal. 2010, 31, 451–464. [Google Scholar] [CrossRef]
  16. Chicco, G.; Sumaili Akilimali, J. Renyi entropy-based classification of daily electrical load patterns. IET Gener. Transm. Distrib. 2010, 4, 736–745. [Google Scholar] [CrossRef]
  17. Macedo, M.N.Q.; Galo, J.J.M.; De Almeida, L.A.L.; Lima, A.C.D.C. Demand side management using artificial neural networks in a smart grid environment. Renew. Sustain. Energy Rev. 2015, 41, 128–133. [Google Scholar] [CrossRef]
  18. Albert, A.; Rajagopal, R. Smart meter driven segmentation: What your consumption says about you. IEEE Trans. Power Syst. 2013, 28, 4019–4030. [Google Scholar] [CrossRef]
  19. Gulbinas, R.; Khosrowpour, A.; Taylor, J. Segmentation and classification of commercial building occupants by energy-use efficiency and predictability. IEEE Trans. Smart Grid 2015, 6, 1414–1424. [Google Scholar] [CrossRef]
  20. Viegas, J.L.; Vieira, S.M.; Melício, R.; Mendes, V.M.F.; Sousa, J.M.C. Classification of new electricity customers based on surveys and smart metering data Commission for Energy Regulation. Energy 2016, 107, 804–817. [Google Scholar] [CrossRef]
  21. Bishop, C.M. Pattern Recognition and Machine Learning, 1st ed.; Springer: New York, USA, 2007. [Google Scholar]
  22. Räsänen, T.; Voukantsis, D.; Niska, H.; Karatzas, K.; Kolehmainen, M. Data-based method for creating electricity use load profiles using large amount of customer-specific hourly measured electricity use data. Appl. Energy 2010, 87, 3538–3545. [Google Scholar] [CrossRef]
  23. Park, S.; Ryu, S.; Choi, Y.; Kim, J.; Kim, H. Data-driven baseline estimation of residential buildings for demand response. Energies 2015, 8, 10239–10259. [Google Scholar] [CrossRef]
  24. Friedman, J.; Hastie, T. The Elements of Statistical Learning, 1st ed.; Springer: New York, NY, USA, 2001. [Google Scholar]
  25. Kang, J.; Lee, J. Electricity customer clustering following experts’ principle for demand response applications. Energies 2015, 8, 12242–12265. [Google Scholar] [CrossRef]
  26. López, J.J.; Aguado, J.A.; Martín, F.; Mu, F.; Rodríguez, A.; Ruiz, J.E. Hopfield—K-Means clustering algorithm: A proposal for the segmentation of electricity customers. Electr. Power Syst. Res. 2011, 81, 716–724. [Google Scholar] [CrossRef]
  27. Tong, X.; Li, R.; Li, F.; Kang, C. Cross-domain feature selection and coding for household energy behavior. Energy 2016, 107, 9–16. [Google Scholar] [CrossRef]
  28. Simshauser, P.; Downer, D. On the inequity of flat-rate electricity tariffs. Energy J. 2016, 37, 199–229. [Google Scholar] [CrossRef]
  29. Haben, S.; Singleton, C.; Grindrod, P. Analysis and clustering of residential customers energy behavioral demand using smart meter data. IEEE Trans. Smart Grid 2015, 7, 136–144. [Google Scholar] [CrossRef]
  30. Dansk, E. Giv Energien Videre: Nye Energipolitiske Visioner Og Udfordringer 2020–2030; Dansk Energi: Copenhagen, Denmark, 2015. [Google Scholar]
  31. Governmental Offices of Sweden. Fossil Free Sweden N.D. Available online: http://www.government.se/government-policy/fossil-free-sweden/ (accessed on 27 January 2017).
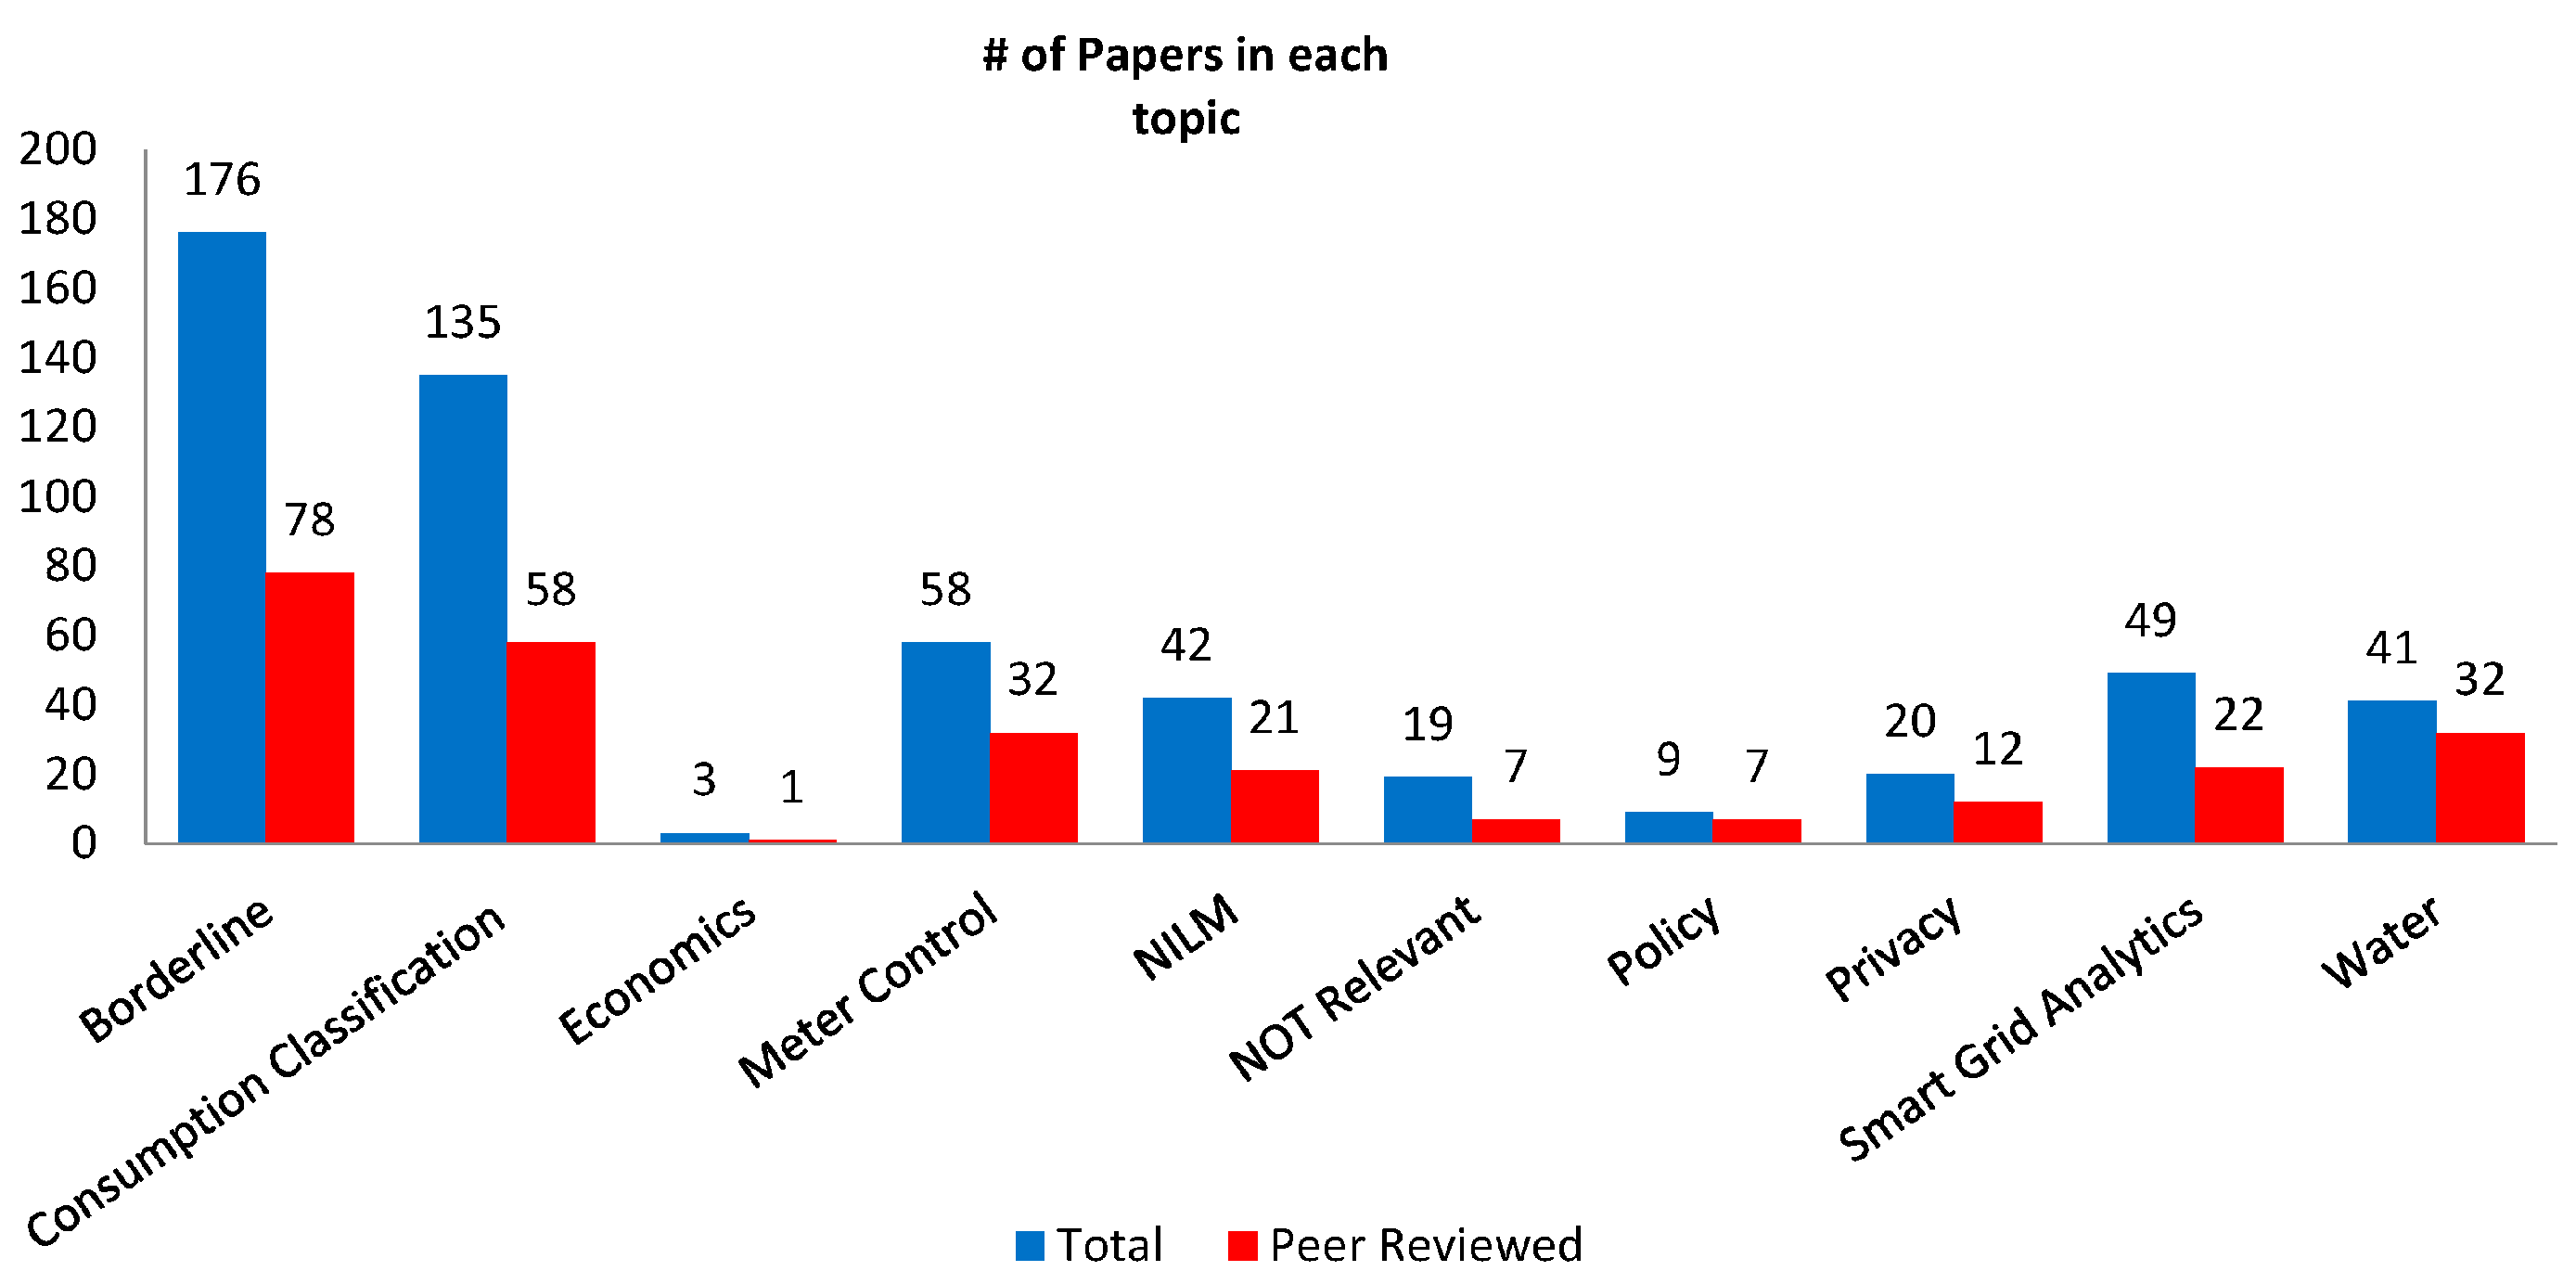
Figure 1. Category distribution after abstract screen. Total includes all types of written material from papers, conferences, workshops etc. Peer-reviewed only include journal papers.
Energies 10 00584 g001
Figure 2. Depiction of standard modelling structure. (Blue) Indicates the elements all papers go through (data, method selection, clustering and validation); (Red) Some papers charachterize the identified clusters, usually applying external data; (Green) Applying the identified clusters to classifify new consumption series to evaluate the applicability of the clusters.
Energies 10 00584 g002
Table 1. Waterfall statistics showing how many articles were excluded in each step of the screening process.
Waterfall StatisticsBulkReduced
Initial3922-
Unique20991823
Screening I: Title5521271
Screening II: Abstract311241
Removal of non-peer-reviewed136175
Screening III: Borderline revisited7165
Screening IV: Reading of articles3437
Final number of papers synthesized34-
Table 2. Data and method overview table showing the quantity of different datasets encountered in each country and the main attributes from the data description score, Country, Type, length, frequency, final sample size, and the most prevalent classification encountered in this review. Denmark has no method listed as the classification used is a combination of regression and survey data.
# of Different DatasetsCountryTypeLengthRecording FrequencyFinal Size (m)K-MeanHierarchicalFollow the LeaderMixture ModelsFourier Transform
1BrazilMix1 month15 min2000x----
2CanadaMix12 months60 min62,923---x
1DenmarkMix36 months60 min4500-----
1FinlandMix12 months60 min3989xx---
1FranceResidentialUNKNOWN10 min100x----
1GermanyResidentialUNKNOWN15 min215x----
1GreeceIndustrial10 months15 min292xx---
1IrelandResidential>24 months30 min3941, 3440, 3622, 3487x-xx-
1JapanResidential18 months1 min1072xx---
3KoreaMix27 months15 min, 60 min1735, 1205, 135xx---
2PortugalResidential48 months15 min265, 1022xx---
1RomaniaIndustrial1 day15 min234xxx--
2SpainMix24 months60 min711, 230x---x
2UKResidential18 months30 min5000x----
1UK, BulgarianResidential12 months7 s197xx-x-
5USAMix>8 months1 min, 10 min, 60 min952, 123,150, 952, 103, 2000xx---
Table 3. Example of the Data Description Score result on 2 articles, paper 7 has no referral and scores 12, while paper 8 has referral but no Provider information and equally scores 12.
Reference Article #[7][8]
Countryxx
Regionxx
Supplierx-
Initial Sizexx
Clear Reductionxx
Missing Valuesxx
Final Sizexx
Recording Frequencyxx
Startxx
Endxx
Lengthxx
Typexx
Referral-x
Table 4. Data Description Score comprising of 5 main categories with a total of 13 different attributes. Prevalence describes the number occurrences of the attribute in the 34 papers. Percent shows the prevalence percent of the 34 papers.
CategoryAttributePrevalencePrevalence%
Geographical informationCountry3397%
Region2779%
Origin2779%
Data InformationInitial Size3397%
Clear Reduction3294%
Missing Values1750%
Final Size3191%
Time InformationRecording Frequency3397%
Start2368%
End2265%
Length3088%
Type InformationType3294%
Referencing DataReferral1338%
Table 5. Distribution of papers for different scores.
ScoreQuantity
74
81
93
108
118
127
133
Grand Total34
Table 6. Overview of the most prevalent classification methods encountered in the 34 papers.
MethodAdvantagesCaveats
K-meansFast, well documented.Risk of Local optimum. Difficult to find optimum cluster number and interpret clusters.
HierarchicalVisual interpretation, fast.Careful selection of link function is required.
Follow-the-leaderNo initial number of clusters to fit.Needed Distance threshold is chosen by trial-and-error
Mixture ModelsAdvanced modelling of systems.Complex setup compared to K-means
Neural NetworkSupervised, taking into account prior knowledge.Risk of overfitting, needs prior knowledge
Table 7. Overview of the most prevalent distance measure encountered in the 34 papers, and their behavior.
Link FunctionDistance between ClustersCluster Behavior
Single (Euclidian)ClosestLong non-convex cluster shapes
AverageAverage-
CompleteLargestConvex clusters, sensitive to outliers
CentroidCluster centerRobust vs outliers
Wardsmallest varianceEqually sized clusters
Table 8. Popular cluster validation indices and how to interpret them.
IndexMathematicsInterpretation
DBI (Davies-Bouldin Indictor) 1 K i = 1 K max j i d i a m ( C i ) + d i a m ( C j ) d ( C i , C j ) d i a m ( C k ) is the average diameter of a cluster. And d ( C i , C j ) is the distance between centroids. K is the number of clusters. DBI relates the mean distance of each class with the distance to the closest class [26]. Smaller values of DBI implies that K-means clustering algorithm separates the data set properly [23]
CDI (Cluster Dispersion Indicator) 1 d ( C ) 1 K k = 1 K d 2 ( C k ) CDI prefers Long inter-cluster distance and short intra-cluster distance [25]. Small values indicate good clustering. d2 ( C k ) is the squared average distance within cluster k. High. While d ( C ) is max cluster distance in data.
Dunn min d ( C i , C j ) max d i a m ( C m )
where
d ( C i , C j ) = min x C i , y C j | | x y | |
and
d i a m ( C k ) = min x , y C k | | x y | |
The ratio between “minimum distance between clusters” and “maximum distance within clusters”. When minimum dissimilarity between clusters get large and max cluster diameter gets small the Dunn value gets large and indicates good separation. Ci is cluster i, d is distance and m is total number of clusters.
Silhouette c ( x ) c ( x ) max   { c ( x ) , c ( x ) } c ( x ) =   min y C ' d ( x , y ) c(x) is the average distance between vector x and all other vectors of the cluster c to which x belongs. c’(x) is the minimum distance between vector x and all other vectors in cluster   C C [23].
SI is between [–1, 1] higher is better. Negative is miss-clustering.
Entropy i = 1 c p ( i t ) · l o g 2 p ( i t ) p ( i t ) denotes the proportion of correct classified vector i in cluster t. Entropy is a supervised index as the true classes needs to be known. Entropy is used as a measure of misclassification in each cluster. Entropy is small when the clustering result is similar to the expected result [25]. c is total clusters.
MIA 1 K k = 1 K d 2 ( C k ) Average distance within class to class centroid, summarized across all classes. k is number of clusters; d2 ( C k ) is the squared average distance within cluster k. High MIA indicates large distances within the classes. e.g., large dispersion.

