Article

A Cost Optimized Fully Sustainable Power System for Southeast Asia and the Pacific Rim

School of Energy Systems, Lappeenranta University of Technology, Skinnarilankatu 34, 53850 Lappeenranta, Finland
*
Author to whom correspondence should be addressed.
Energies 2017, 10(5), 583; https://doi.org/10.3390/en10050583
Submission received: 2 March 2017 / Revised: 14 April 2017 / Accepted: 19 April 2017 / Published: 25 April 2017
(This article belongs to the Special Issue Sustainable Energy Technologies)

Abstract

:
In this paper, a cost optimal 100% renewable energy based system is obtained for Southeast Asia and the Pacific Rim region for the year 2030 on an hourly resolution for the whole year. For the optimization, the region was divided into 15 sub-regions and three different scenarios were set up based on the level of high voltage direct current grid connections. The results obtained for a total system levelized cost of electricity showed a decrease from 66.7 €/MWh in a decentralized scenario to 63.5 €/MWh for a centralized grid connected scenario. An integrated scenario was simulated to show the benefit of integrating additional demand of industrial gas and desalinated water which provided the system the required flexibility and increased the efficiency of the usage of storage technologies. This was reflected in the decrease of system cost by 9.5% and the total electricity generation by 5.1%. According to the results, grid integration on a larger scale decreases the total system cost and levelized cost of electricity by reducing the need for storage technologies due to seasonal variations in weather and demand profiles. The intermittency of renewable technologies can be effectively stabilized to satisfy hourly demand at a low cost level. A 100% renewable energy based system could be a reality economically and technically in Southeast Asia and the Pacific Rim with the cost assumptions used in this research and it may be more cost competitive than the nuclear and fossil carbon capture and storage (CCS) alternatives.

1. Introduction

Electricity is a significant factor for rapid industrialization, urbanization and improving quality of life [1]. In the 21st century, demand for electricity is rising and will continue to do so due to industrialization in developing and emerging countries. Providing affordable, accessible, reliable, low to zero carbon electricity in developing and emerging countries will be the main aim of electricity generation in the next decades [2]. The region of Southeast Asia and the Pacific Rim (from hereafter Southeast Asia and the Pacific Rim will be called Southeast Asia) consists of developed countries such as Australia, New Zealand and Singapore, as well as fast developing and emerging economies such as Brunei, Cambodia, Indonesia, Laos, Malaysia, Myanmar, Papua New Guinea, the Philippines, Thailand, Timor-Leste and Vietnam [3]. The developing region was home to approximately 630 million people in the year 2015 [4] and the need for energy has been higher and growing rapidly due to increasing population and industrialization since the Asian Financial Crisis of 1997–1998 [5,6,7]. To sustain growth and development, demand for electricity will be 3–4 times the demand of the year 2013 by 2040 [5]. On the other hand, Australia and New Zealand, which are well developed economies, have higher per capita electricity use than the Southeast Asian member states. Australia has one of the highest emissions per capita in the developed world due to its use of coal in electricity generation [8]. To overcome the above-mentioned challenges and meet the electricity demand for economic growth at least cost and with the lowest possible greenhouse gas emissions is a huge challenge for the Southeast Asian region [9]. Therefore, development of a 100% renewable energy (RE) based energy system is of utmost priority [10,11]. Northern and central regions of Australia are excellent in terms of solar resources and the southern, western and eastern coasts are good for wind [12,13]. New Zealand has a high potential for hydropower and geothermal energy [14,15]. In addition, the Association of Southeast Asian Nations (ASEAN) region as a whole is richly endowed with hydro, solar, geothermal, wind, and biomass resources which can be used for the generation of electricity [16]. The Asian Development Bank has estimated high technical potential for solar, wind, biofuel and biogas in the Greater Mekong Region [17] and provides an outline for various business models for investments in renewable energy (RE) for achieving its full potential [18].
The Southeast Asian region is rich in RE resources and their potential can be maximized if there is an infrastructure for interconnection of the region’s electricity grids [13]. There have been various studies undertaken on 100% RE or high share of RE based electricity systems in a specific country or combining some of the countries of Southeast Asian region. A brief summary of the studies undertaken is presented in Table 1.
The idea of an ASEAN supergrid [25,26] connecting Australia and New Zealand has already been discussed [27], taking European Union-Middle East and North Africa (EU-MENA) Desertec [28,29], Gobitec and a Northeast Asian supergrid as an initial template [30,31,32]. An example of the grid connection from Australia to the ASEAN countries is shown in Figure 1 [33]. However, integrating all the energy sectors, incorporating a spatial and temporal resolution of energy supply and demand, and fully considering energy infrastructure or constraints of sustainability criteria have never been done before for this region. For the modeling of real world conditions, all this has to be taken into account to obtain a comprehensive least cost energy system which will be based on 100% renewable energy. Using RE resources for power generation may often lead to excess power, which needs to be stored. This excess power can be used, for instance, in seawater reverse osmosis (SWRO) desalination to provide clean water in many countries. Other possibilities include Power-to-heat and heat storage technologies for industrial heating needs [34,35] and Power-to-gas [34,35,36,37], which can supply natural gas for transportation, chemical, fertilizers and other industrial sectors, and can function as an enabler of seasonal energy storage. The main aim of the paper is to design an optimal energy system based on 100% renewable energy by proper utilization of the renewable energy resources available in Southeast Asia.

2. Methodology

The model optimization of the energy system is based on linear optimization of the parameters which are applied to the system under known constraints with the assumption of a perfect foresight of RE power generation and power demand, storage technologies, as well as water desalination and synthetic natural gas (SNG) generation, which operate as flexible demands in the model. The model used in this study has been described in Bogdanov and Breyer [37] and the next sections do not include a detailed description of the model, its input data and the applied technologies. However, detailed information has been provided for all the additional assumptions considered in this study. Matching of the power generation and demand for every hour of the year 2030 is the key constraint for the optimization. The hourly resolution of the model significantly increases the computation time; however, it guarantees that for every hour of the year the total generation within a sub-region and electricity import cover the local electricity demand and enable a more precise system description including synergy effects of different system components for the power system balance. The set of applied technologies can be easily expanded, which is one of the main features of the used Lappeenranta University of Technology (LUT) energy system model.

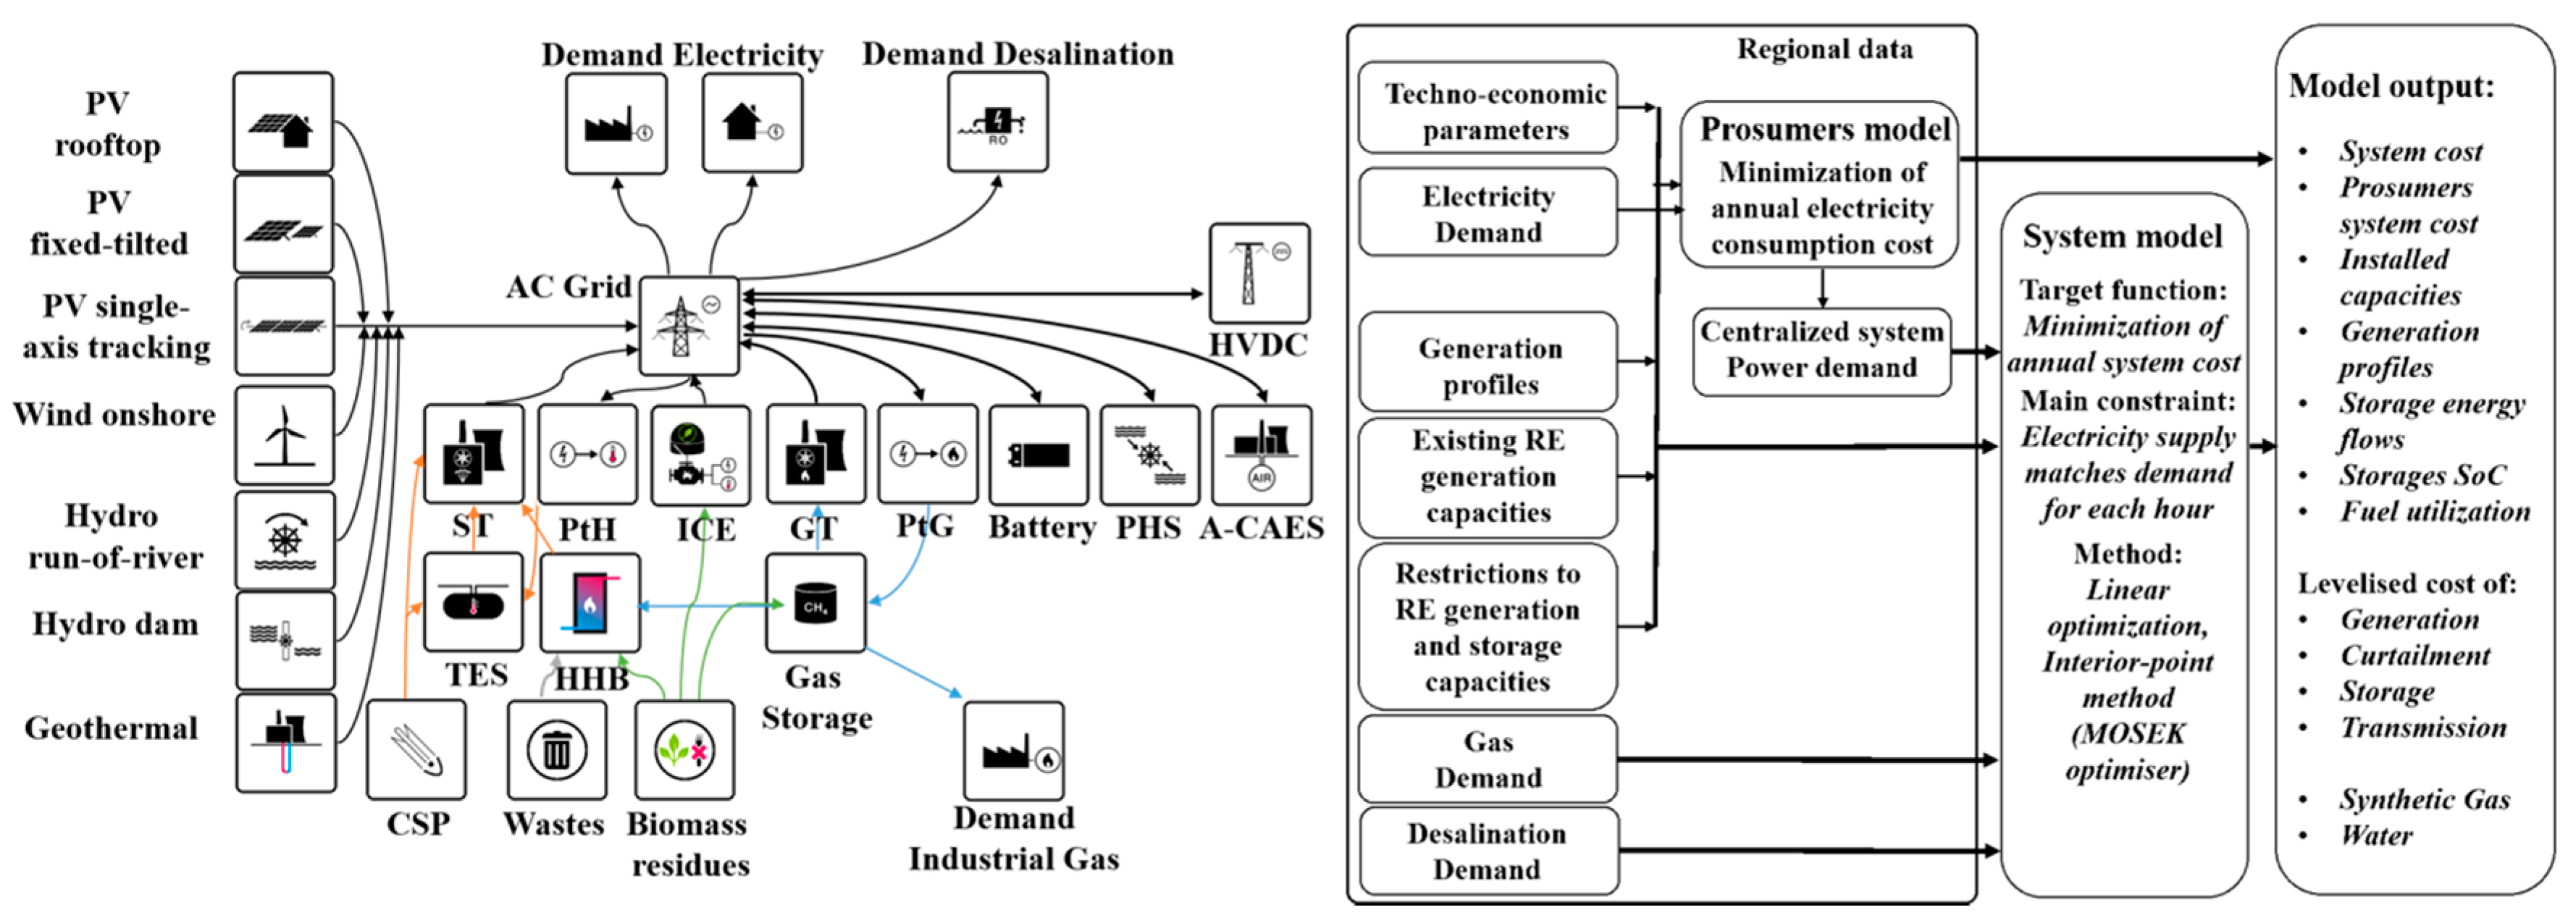
2.1. Summary of the Model

Minimization of the total annual energy system cost of the power sector and the additional flexibility demand sectors such as gas synthesis and water desalination is the main aim of the system optimization. This cost is calculated as the sum of the annual costs of installed capacities of the different technologies, costs of energy generation and generation ramping. In addition, included in the system are the distributed generation and self-consumption of residential, commercial and industrial electricity consumers (prosumers) by installing respective capacities of rooftop PV systems and batteries. For PV prosumers, minimizing the cost of consumed energy is the main target function, which is calculated as a sum of self-generation, annual cost and cost of electricity consumed from the grid, minus the benefits of selling excess electricity. The prosumers can sell electricity to the grid at 2 €ct/kWh; however, they have to satisfy their own demand before selling.

2.2. Input Data

The model is built on many types of different constraints and datasets. Additional information about all the input data for the model is given in Bogdanov and Breyer [37]. Data calculation for geothermal energy, desalinated water demand and industrial gas demand are described here.
(1)
The geothermal potential data for every sub-region is calculated based on the already available information on the surface heat flow rate [38,39] and the surface ambient temperature for the year 2005 globally. Extrapolation of the available heat flow data was performed for areas where surface heat flow data were not available. Based on these available data, different temperature levels and available heat at the mid-point of a 1 km thick deep layer, between the depths of 1 km to 10 km [40,41] globally with 0.45° × 0.45° spatial resolution are derived.
(2)
Industrial gas consumption data are based on IEA statistics for energy sector demand [42].
(3)
Projected water desalination demand was determined for every sub-region. Water desalination demand is calculated on projections for water consumption and water stress [43]. In the model, it is assumed that water stress of more than 50% will be covered by seawater desalination. The calculations for the technical constraints and financial cost of seawater reverse osmosis desalination are described in [44].

2.3. Applied Technologies

For the Southeast Asian energy system optimization, technologies applied can be divided into three main categories:
(1) Conversion of renewable energy sources into electricity
For electricity generation from renewable energy sources, technologies used are solar PV systems which are ground mounted (optimally tilted and single-axis north-south oriented horizontal continuous tracking) and rooftop PV, concentrating solar thermal power (CSP), onshore wind turbines, hydro power divided into run-of-river and dams, biomass plants (biogas and solid biomass), waste-to-energy power plants and geothermal power plants.
(2) Energy storage
The technologies used in this model for energy storage are battery storage, pumped hydro storage (PHS), adiabatic compressed air energy storage (A-CAES), thermal energy storage (TES) and power-to-gas (PtG) technology. The synthesis of SNG technologies are included in PtG. Technologies such as water electrolysis, methanation, CO2 scrubbing from air, gas storage, and both combined and open cycle gas turbines (CCGT, OCGT) are part of the synthesis of SNG and its reconversion to electricity. The PtG technologies have to be operated in synchronization because of the absence of hydrogen and CO2 storage. There is a 48-hour biogas buffer storage and part of the biogas can be upgraded to biomethane and introduced to the gas storage.
(3) Electricity transmission
The power distribution and transmission within the sub-regions is assumed to be based on alternating current (AC) grids and transmission grids between the regions are based on high voltage direct current (HVDC) technology. Loss of electricity due to the length of the power lines and losses in converter stations at the interconnection with the AC grid form the major component of the power losses in HVDC grids. The full block model diagram is presented in Figure 2.
(4) Energy sector bridging technologies
The SNG from the PtG technology can be used for industrial gas demand rather than storage for the electricity sector. In addition, SWRO desalination provides clean water with the use of renewable electricity. These two technologies provide the required flexibility to the system by reducing cost of curtailment and storage.

3. Scenario Assumptions

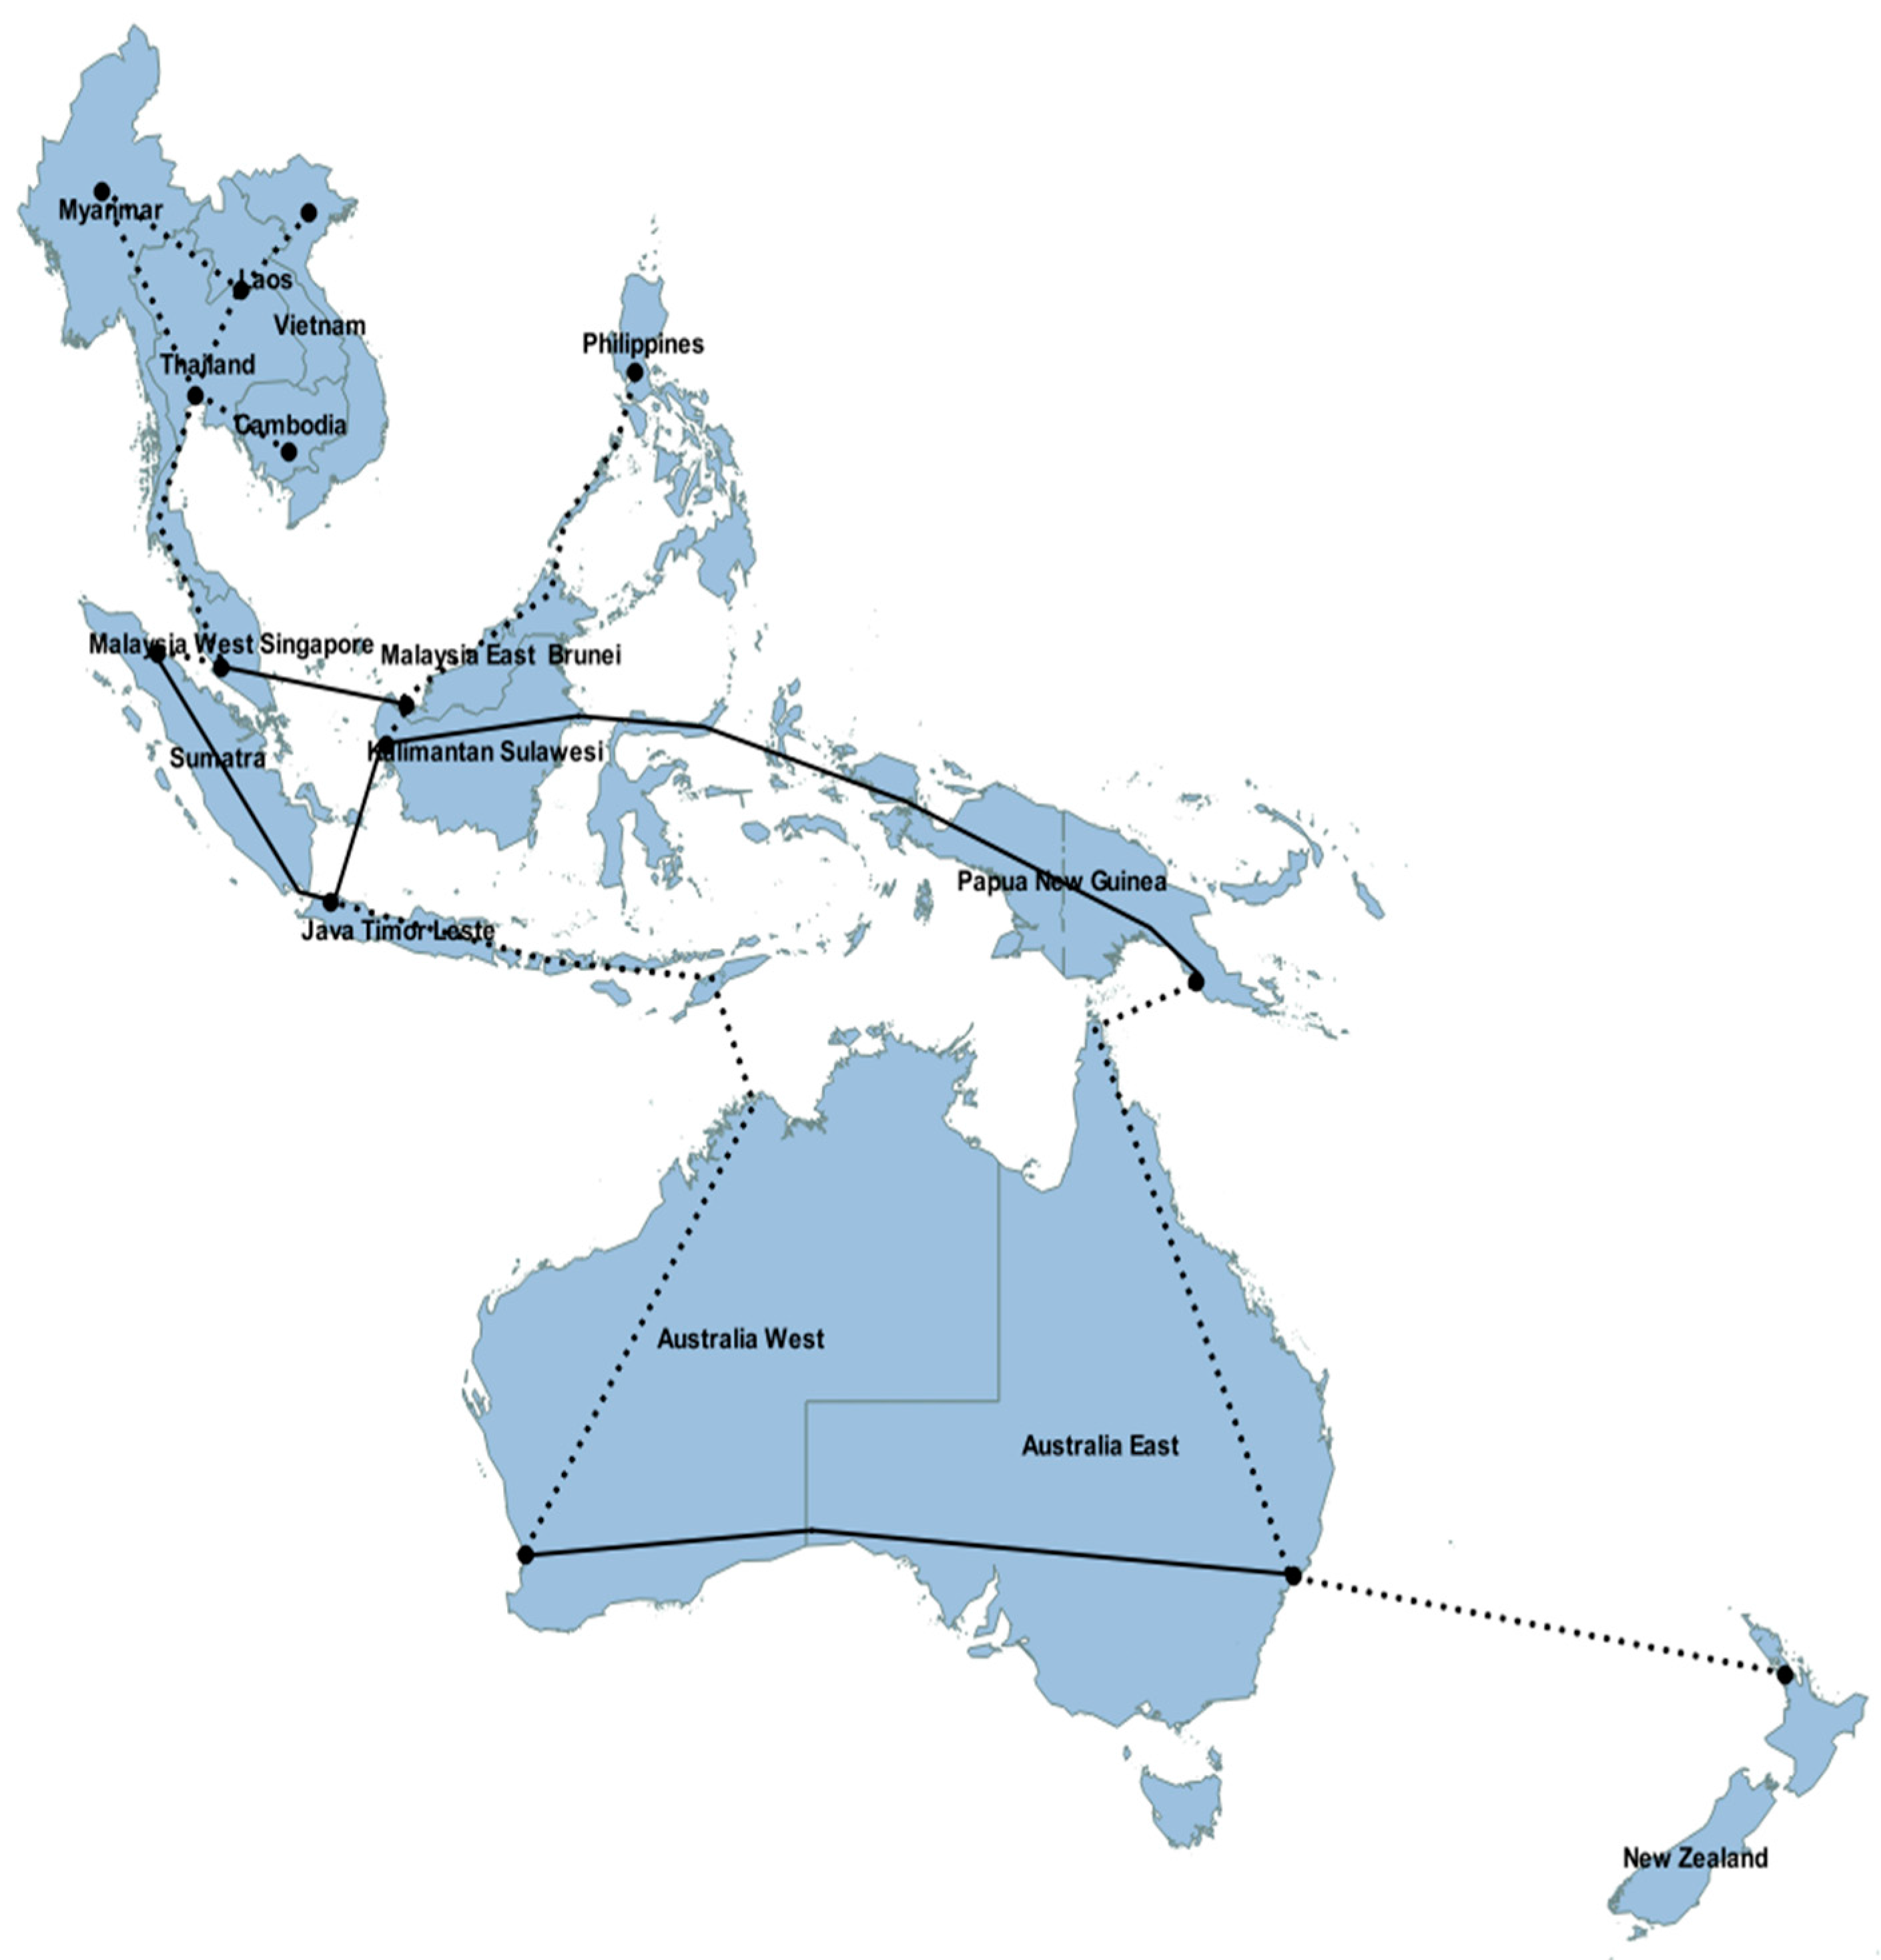
3.1. Subdivision of the Region and Grid Structure

The region of Southeast Asia and the Pacific is subdivided into 15 sub-regions according to the population distribution, electricity consumption and sub-region’s electricity grid structure. The sub-regions are: New Zealand, Australia is divided into East and West, Papua New Guinea and the Papua region of Indonesia are combined together (due to their geographical proximity, population and ease of grid connection), Indonesia Sumatra, Indonesia Java Bali (including Timor-Leste), Indonesia Kalimantan Sulawesi (all divided according to the national electricity operator Perusahaan Listrik Negara-PLN) [46], Malaysia is divided into the two sub-regions of East Malaysia (also including Brunei due to the geographical proximity) and West Malaysia (with Singapore), the Philippines, Myanmar, Thailand, Laos, Vietnam and Cambodia. The Pacific islands, representing less than 2% of the population of Southeast Asia and the Pacific region, are not included in this study. However, it had been found separately by Blechinger et al. [47] that a share of about 50% RE on the Pacific islands, mainly solar PV and wind energy, represent a local least cost solution.
The grid connection of the sub-regions in Southeast Asia is shown in Figure 3, which includes the interconnections within the countries and also between the countries, shown by dotted lines. The grid between the sub-regions of Indonesia Sumatra and Indonesia Java is based on the development plans to connect the two islands with HVDC cables [48]. The grid connections in the ASEAN region are based on the existing connections and future planning of the interconnections between these countries [25].

3.2. Applied Scenarios

The different scenarios taken into consideration in this paper for the analysis of the energy system of Southeast Asian regions are the following:
(1)
Region-wide open trade scenario, in which the regions are independent of each other and have no interconnections so the demand for electricity is covered by the respective regions’ own generation capacity.
(2)
Country-wide open trade scenario, in which there are interconnections with HVDC lines between the regions of the same country.
(3)
Area-wide open trade scenario, in which the energy systems of the countries are interconnected.
(4)
Integrated scenario: Area-wide scenario plus SWRO desalination and industrial gas demand, where PtG technology is used not only as a storage option but also covers industrial gas demand. This increases the flexibility of the system.

3.3. Financial and Technical Assumptions

The optimization of the model is carried out on an assumed cost basis and the state of technology for the year 2030. The capital expenditures (capex) and operational expenditures (opex) refer in general to a kW of electrical power, in case of water electrolysis to a kW of hydrogen thermal combustion energy, and for CO2 scrubbing and methanation it refers to the lower heating value of hydrogen and methane, respectively. The financial assumptions for the energy system components for the year 2030 are tabulated in Table 2. The cost assumptions for HVDC transmission lines and converter stations, which are given as net transmission capacity (NTC), are also included. Weighted average cost of capital (WACC) in real terms is set to 7% for all scenarios, but for residential PV prosumers, WACC is set to 4% due to lower financial return requirements. The financial assumptions for storage systems refer to a kWh of electricity and gas storage refers to a thermal kWh of methane at a lower heating value. Assumptions are mainly taken from Pleßmann et al. [49] and also from other sources [32,50,51,52,53,54,55,56]. The technical assumptions concerning energy to power ratios for storage technologies, efficiency numbers for generation and storage technologies and power losses in HVDC power lines [28] and converters are presented in Supplementary Materials (Tables S1–S3).
Prices of electricity for residential, commercial and industrial consumers for all the countries are applied in order to derive benefits due to the self-consumption of solar energy. Electricity prices for residential, commercial and industrial prosumers for Australia, Thailand, Indonesia and Malaysia are taken from Gerlach et al. [57]. The electricity price in Papua New Guinea and Timor-Leste are assumed to be similar to Indonesia. The electricity prices for Singapore and Brunei are assumed to be similar to Malaysia. The electricity prices for New Zealand, Philippines, Myanmar, Vietnam, and Cambodia are calculated according to assumptions from Werner et al. [58] that grid electricity prices rise by 5% per annum for <0.15 €/kWh, by 3% per annum for 0.15–0.30 €/kWh and by 1% per annum for >0.30 €/kWh. This assumption is based on the already observed increase in prices of grid electricity on annual basis, which is also expected to continue in the future. It should be noted that electricity prices only affect investment decision-making of PV prosumers in the model. The regional grid electricity costs are summarized in Supplementary Materials (Table S4). The excess electricity generated by the prosumers is assumed to be fed into the grid for a transfer selling price of 2 €ct/kWh. Prosumers cannot sell more power to the grid than their own annual consumption.

3.4. Biomass and Geothermal Potentials

The potentials for biomass and waste resources are taken from [59], i.e., no energy crops are taken into account, due to strict sustainability requirements. All biowaste is divided in three different components: solid waste, solid biomass and biogas. Solid wastes consists of municipal and industrial used wood; solid biomass includes straw, wood and coconut residues; biogas is comprised of excrement, municipal biowaste and bagasse. The costs for biomass are calculated using data from [60,61]. For solid fuels a 50 €/ton fee for the waste incineration is assumed.
The geothermal heat potentials for all the sub-regions were calculated based on the spatial data for available heat, temperature and geothermal plants for depths from 1 km to 10 km. For each 0.45° × 0.45° area and depth, levelized cost of electricity (LCOE) for geothermal is calculated and optimal depth is determined. The assumption for available geothermal heat is that only 25% of it will be utilized as an upper resource limit. The total available heat for all the regions is calculated using the same weighted average formula as for solar and wind feed-in, with an exception being the areas with geothermal LCOE exceeding 100 €/MWh, which are omitted. The calculated potentials for solid biomass, biogas, solid waste and respective costs, and geothermal heat potentials are provided in Supplementary Materials (Tables S5 and S6).

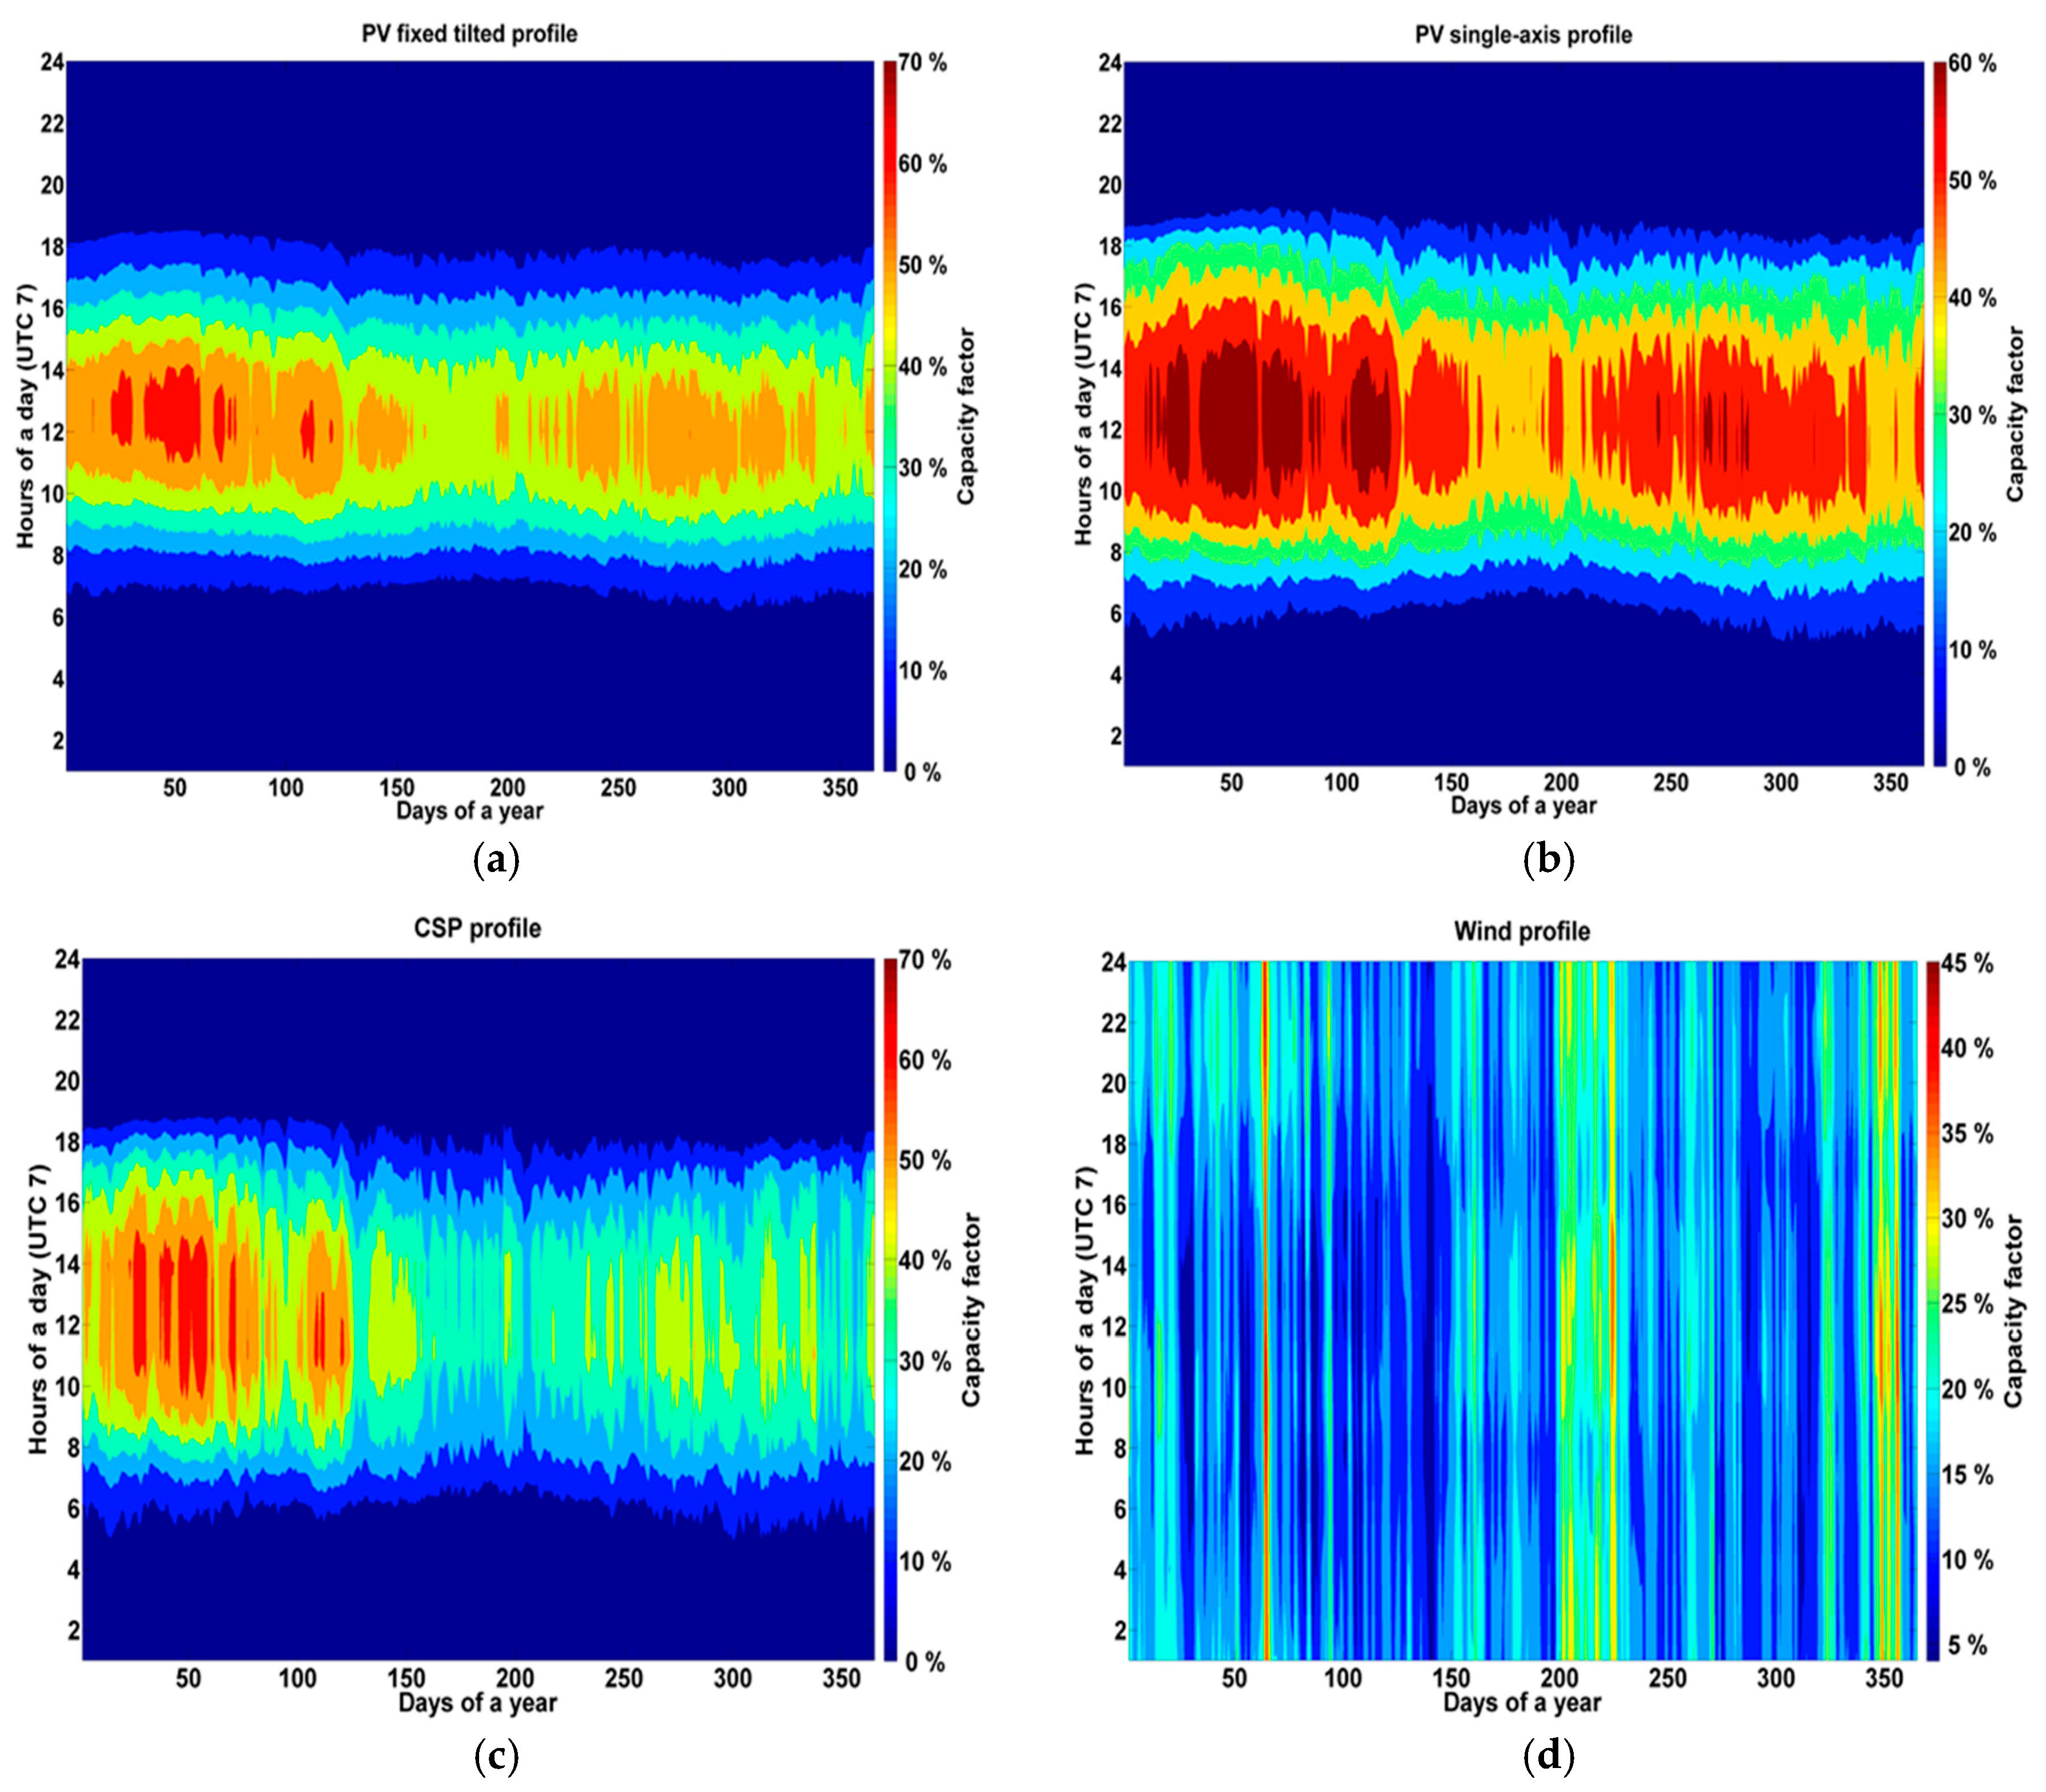
3.5. Feed-in for Solar and Wind Energy

The feed-in profiles for single-axis tracking PV, optimally tilted PV, solar CSP and wind energy were calculated according to Bogdanov and Breyer [37]. The calculated full load hours for single-axis tracking PV, optimally tilted PV, solar CSP and wind power plants are presented in Table 3. The aggregated profiles of solar PV generation (optimally tilted and single-axis tracking), CSP solar field and wind energy power generation normalized to maximum capacity averaged for Southeast Asia are presented in Figure 4.

3.6. Upper and Lower Limitations on Installed Capacities
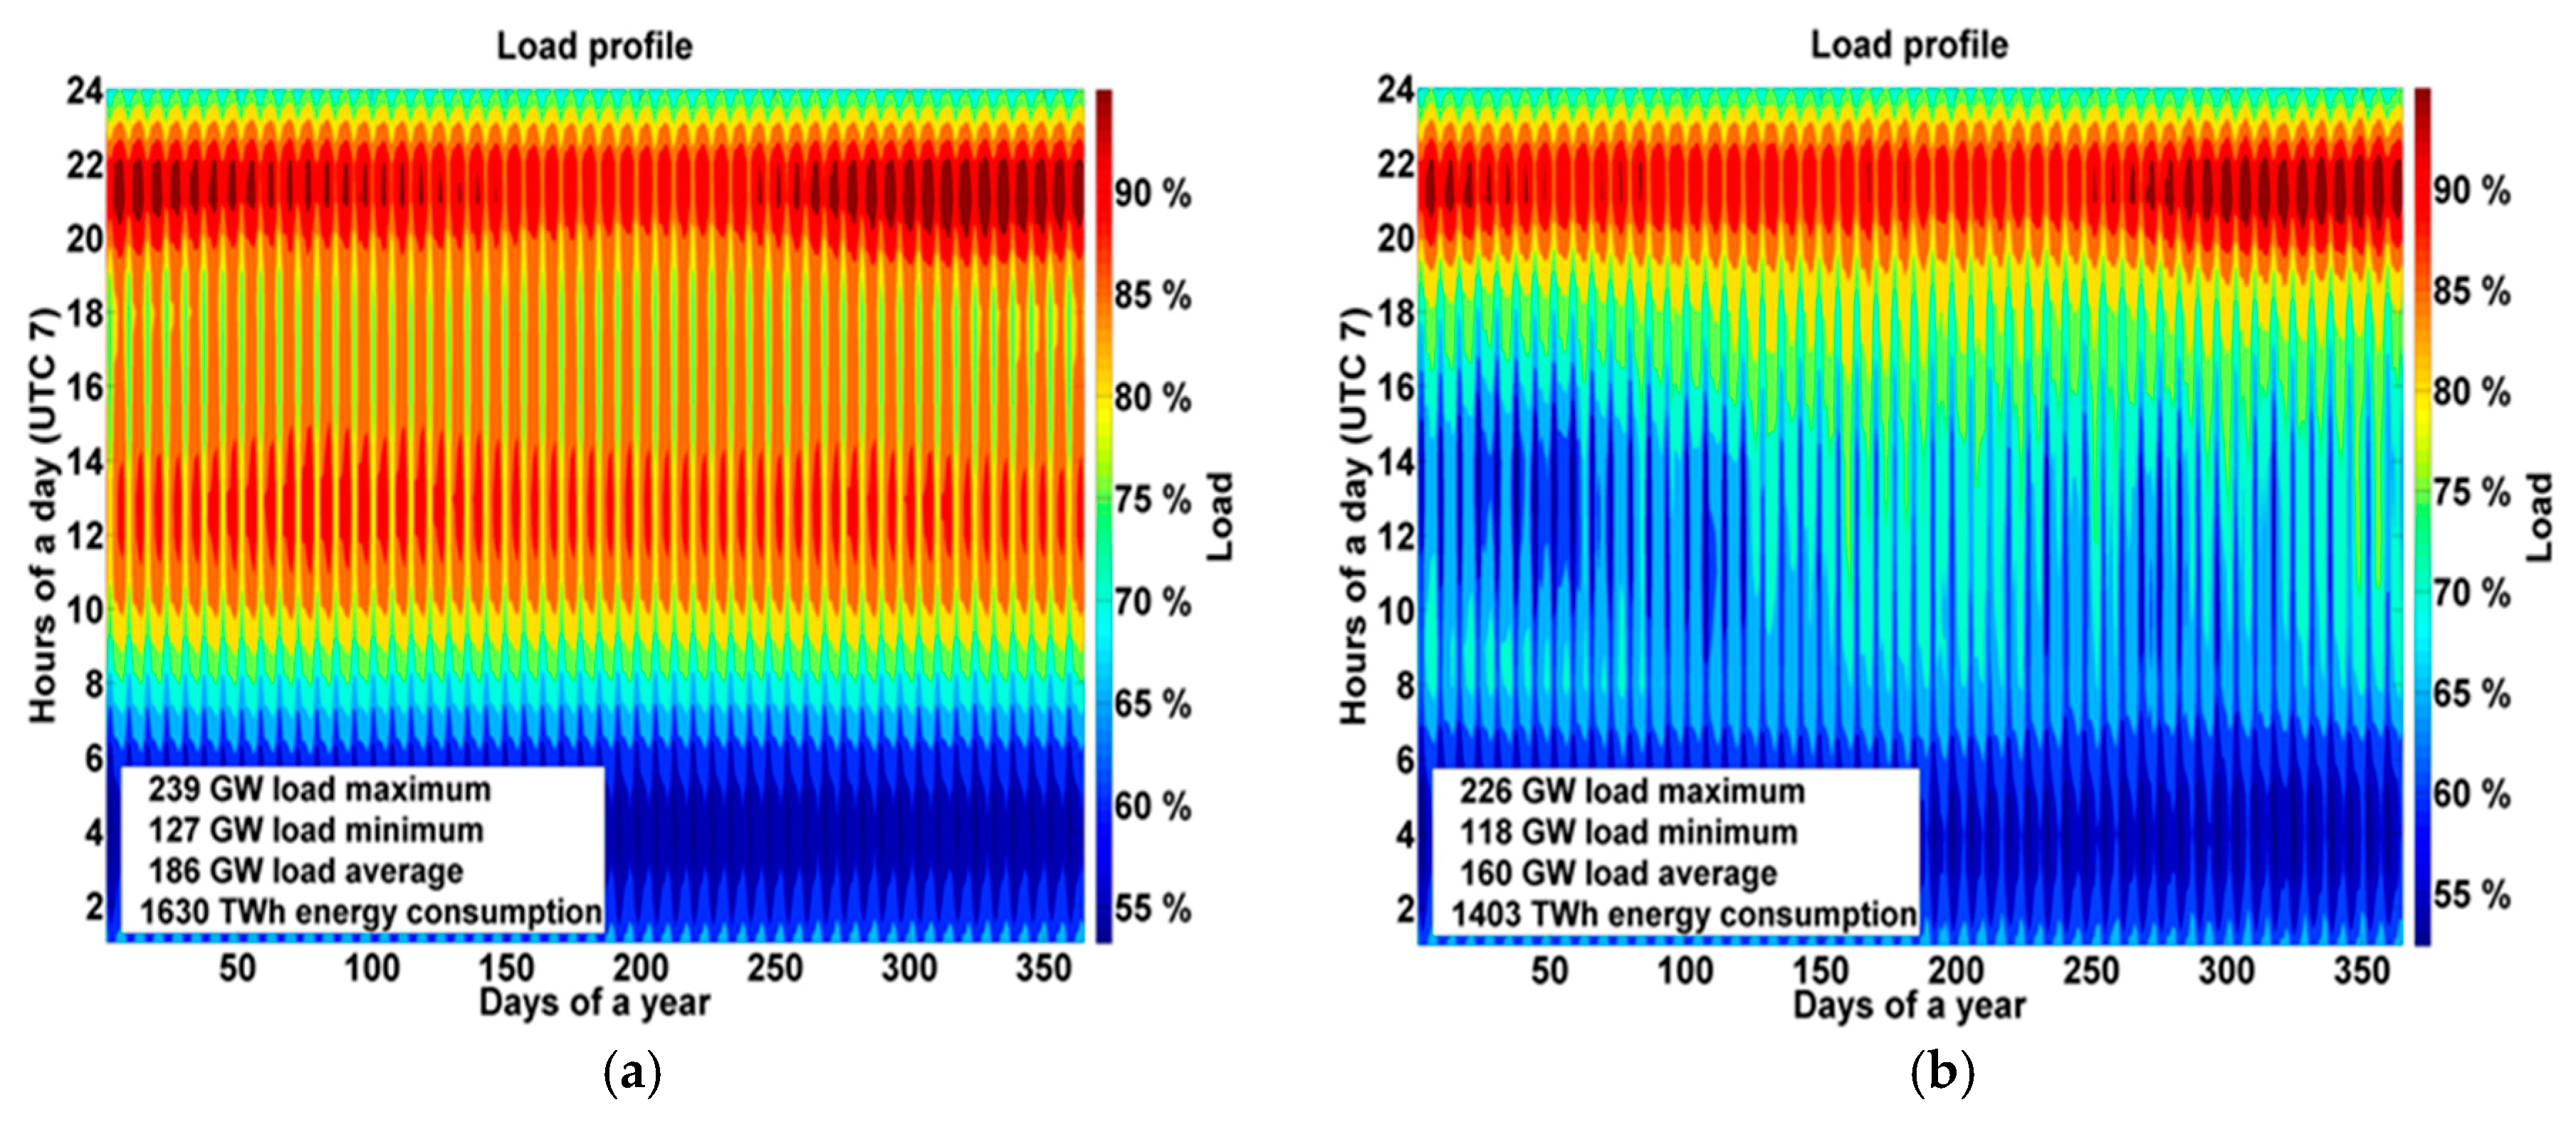
Lower and upper limitations are set for RE sources (optimally tilted PV, wind turbines, hydro power) and for pumped hydro storage, and were calculated according to Bogdanov and Breyer [37]. The data for already installed capacities (lower limits) for optimally tilted PV, wind turbines, hydro power and pumped hydro storage for Southeast Asian sub-regions are taken from Farfan and Breyer [62]. Supplementary Materials Table S7 gives the summary of the lower limits on already installed capacities in the Southeast Asian sub-regions.
For hydro power plants and PHS storage, upper limits on capacities are assumed to be 150% and 200% of the already installed capacities. The upper limits for all the RE technologies for Southeast Asian sub-region are summarized in Supplementary Materials (Table S8). The upper limits for all the other technologies are not specified. However, for biomass residues, biogas and waste to energy plants it is assumed, due to energy efficiency reasons, that the available and specified amount of the fuel as summarized in Supplementary Materials (Table S5) is utilized during the year.

3.7. Load

The load profiles for all the sub-regions are calculated as a fraction of the total demand in a country based on synthetic load data weighted by the sub-region’s population. The area aggregated demand for all the sub-regions in Southeast Asia is given in Figure 5. A significant impact is observed on the residual load demand due to solar PV prosumers in the energy system, which is shown in Figure 5b. The overall electricity demand and peak load are reduced by 13.9% and 5.4%, respectively.
The demand for gas by industries (not considered is the gas demand for electricity generation, residential and transportation sectors) and desalination water demand for Southeast Asian sub-regions are presented in Supplementary Materials (Table S9). The gas demand values are taken from IEA data [42]. The values for desalination are based on water stress and water consumption projections [44].

4. Results

The optimized electrical energy system configuration is derived for each scenario, which is characterized by optimized installed capacities for RE electricity generation, storage and transmission for every technology used in the model. This in turn leads to hourly generation of electricity, charging and discharging of storage technologies, import and export of electricity between regions or countries, and curtailment. The key average financial results for the different scenarios are presented in Table 4. The key numbers represent total system (LCOE) levelized cost of electricity (including PV self-consumption and the centralized system), levelized cost of electricity for primary generation (LCOE primary), levelized cost of curtailment (LCOC), levelized cost of storage technologies (LCOS), levelized cost of transmission (LCOT), total annualized cost, total capital expenditures, total renewables capacity and total primary generation.
Despite lower primary generation costs, the connection of different regions via HVDC power lines does not yield an expected benefit, since there is no transmission of power from Australia to the ASEAN countries. However, connection due to HVDC power lines still has a positive impact on the LCOE and total annual costs of the system. The LCOE is decreased from the region-wide to area-wide scenario by 4.5%, and the total annual costs of the system are decreased by 4.6%. The other benefits of grid utilization include a decrease in installed capacities by 7.6% and in total electricity generated by 3.7% from the region-wide to area-wide scenarios. Grid integration decreases the cost of storage technologies and leads to utilization of transmission capacities as the cost of transmission is relatively small in the regions where the cost of storage is not cost competitive with electricity transmission. The power line capacities for the electricity trade between the sub-regions for the area-wide open trade scenario is shown in Supplementary Materials (Figure S8 and Table S15).
The LCOE components and the import/export share in region-wide, country-wide, area-wide and integrated scenario are presented in Supplementary Materials (Table S10). The share of export is defined as the ratio of net exported electricity to the generated primary electricity of a sub-region and the share of import is defined as the ratio of imported electricity to the electricity demand. The average for the whole region is composed of sub-regional values weighted by the electricity demand.
A decrease in total installed capacities of RE is observed as grid utilization increases (Table 4). For PV, the installed capacities decrease by 10% from the region-wide to area-wide scenarios, and for wind they remain same even when the regions are interconnected. In the integrated scenario, installed capacities of PV and wind increase due to the additional demands of seawater desalination and industrial gas. For Southeast Asia, PV is the least cost RE source followed by wind energy. The shares of PV single-axis tracking and PV self-consumption in the total solar PV installed capacity for the area-wide scenario are 66.5% and 33.5%, respectively.
When comparing the region-wide and integrated scenarios, a decrease in total LCOE by 23.4% is observed due to the integration of desalination and industrial gas demands. A decrease of 48.5% is observed in the cost of storage technologies due to its reduced need, as additional electricity demand flexibility is provided to the system by industrial gas synthesis and the desalination sectors. Due to this flexible demand from two new sectors in the integrated scenario, there is an increase in installed capacities of low cost solar PV and wind power in comparison to area-wide scenario, and a slight decrease in biomass power plant capacities, as observed in Table 5. The share of hydro dams does not change as it also provides required flexibility to the system. The inter-regional electricity trade decreases between the regions due to the integration of the desalination and gas sectors, which leads to a decrease in electricity transmission costs by 50%.
The distribution of the system optimized sub-regional RE sources can be observed from Figure 6. Sub-regions with the best renewable resources are net exporters, and the others are net importers. In the case of the region-wide scenario, all individual sub-regions of Southeast Asia need to satisfy their demands using the available RE sources in that particular region. A division of regions into net importers and exporters can be observed for the area-wide scenario and the integrated scenario, which are presented in Figure 6. The difference observed between demand and generation is mainly due to import and export, but also due to storage losses. For the integrated scenario, this difference is due to energy consumption for SNG production, as shown is Figure 6. The net importer regions for Southeast Asia and Pacific are: Malaysia West and Singapore, Thailand, Malaysia East and Brunei. The net exporter regions are: Sumatra, Myanmar and Indonesia Kalimantan Sulawesi. Due to a high electricity demand for additional desalination and SNG production, the integrated scenario tends to show an increase in the electricity generation between the regions to fulfill the increased demand. Hourly resolved profiles for the net importing region Malaysia West and Singapore and net exporting region Sumatra are presented in Supplementary Materials (Figures S1 and S2, respectively).
Figure 7 gives an overview of the installed capacities for RE generation and storage technologies for all sub-regions for the region-wide, area-wide and integrated scenarios. For the region-wide scenario in the sub-regions of New Zealand, Australia East, Australia West and Vietnam, solar PV capacities exceed 40% of all installed RE capacities despite the full load hours (FLH) for wind being higher or comparable to PV full load hours. It is observed that in the sub-regions that have excellent wind conditions, low cost wind energy is the next preferred technology after solar PV, which is lowest in cost. When comparing the region-wide and area-wide scenarios, the interconnection of the sub-regions via HVDC transmission lines results in a decrease of the installed capacities of PV by 10.7%, as seen in Figure 7 and Table 5. In the case of the integrated scenario, installed capacities for PV and wind increase significantly, by 40.9% and 54.9%, respectively, compared to the area-wide scenario, due to a higher demand for electricity.
The connection of the regions via HVDC transmission lines, RE generation and demand greatly influence the total storage capacity required. In addition, they also change the combination of different storage technologies required for the energy system in the whole region. The throughput of batteries, A-CAES, and gas storage technologies decreases by 9.7%, 73.9% and 18.7%, respectively, from the region-wide to the area-wide scenario. State of charge profile diagrams for the area-wide scenario for battery, PHS, A-CAES and gas storage are given in Supplementary Materials (Figure S6). It is observed that batteries are utilized on a daily basis with charging in the noon and afternoon hours, with discharging in the evening and night hours to satisfy evening demand. Something similar is observed for pumped hydro storage, but the frequency of discharge is less than batteries. Further, gas storage discharges in the summer months, due to peak loads associated with cooling demands resulting from hot and humid conditions in the ASEAN region. At this time of the year, we see the utilization of gas storage and A-CAES. PV self-consumption plays a large role in Southeast Asia due to higher electricity prices. PV self-generation covers 62.8%, 59.9%, 54.2% of residential, commercial and industrial prosumers demand, respectively. An overview of PV self-consumption is provided in Supplementary Materials (Table S11).
The impact of A-CAES on the system parameters of Southeast Asia and Eurasia was studied in detail by Gulagi et al. [63]. A-CAES could emerge as a valuable component in a portfolio of different storage options, as found by Fthenakis et al. [64]. There is already long-term experience with the technology despite only two respective facilities. However, the geologic preconditions needed for A-CAES are available all over the world [65]. Integration of A-CAES in Southeast Asia (a region with low seasonal variation and low wind energy share) does have an effect on the system in a positive way. However, this effect is more dramatic in Eurasia (a region with high seasonal variation and high wind share). A summary of the important system parameters taken from [63] for Southeast Asia and Eurasia is given in Supplementary Materials (Table S12). The utilization of low cost A-CAES decreases overall cost of the system by decreasing the share of other storage technologies used. Battery, gas and PHS output of electricity decreased by 5.5%, 1.6% and 0.4% in Southeast Asia. The installation of HVDC lines had a positive impact and decreased the utilization of storage technologies. This is due to the fact that the cost of transmitting electricity is lower in many cases than the cost of storage options. Due to the expansion of the grid, installed capacities of batteries, PHS, A-CAES, heat storage, PtG and gas turbines decrease. An overview of the storage capacities, throughput of storage technologies, full cycles and utilization of available A-CAES potential for the four scenarios for Southeast Asia and Eurasia is presented in Supplementary Materials (Tables S13 and S14, respectively) [63].
The electricity generation curves for the area-wide scenario are presented in Supplementary Materials (Figure S7). A full year divided into 8760 h is represented and sorted according to the generation minus the load, which is represented by a black line. The storage technologies are charged for about 3800 h of the year due to higher electricity generation than demand. The reason for high electricity generation can be attributed to the inflexibility of solar and wind energy and favorable conditions for these technologies in these hours in Southeast Asia. As a result, other flexible options such as hydro dams, biomass, biogas and discharge of storage technologies are required. As observed for the other hours of the year, the inflexible electricity generation options are reduced significantly as the electricity demand decreases and there is a need for flexible electricity generation options, discharge of storage technologies and utilization of the grid. There is not much curtailment in the whole year and it takes place for some hundred hours since for all the other hours the HVDC lines enable the export of the electricity from the best RE producing sub-regions to other sub-regions with remaining demand.
The grid utilization profile for Southeast Asia can be found in Supplementary Materials (Figure S8). An interesting observation can be made from the grid profile that the grid is mostly utilized in the morning hours. A possible explanation that can be provided is the seasonal variation in the ASEAN region, where most of the trading of the electricity takes place. This region consists of two major climatic patterns, summer from January to May, and the rainy season from May to December. In the rainy months, due to the overcast and cloudy conditions, there is a decrease in solar radiation. Therefore, to satisfy the morning or afternoon demands, transmission of electricity takes place between the regions. The capacities and utilization of the transmission lines between various regions is presented in Supplementary Materials (Table S15). The energy flow of the system, from generation to demand in the integrated scenario, is presented in Figure 8. This flow diagram consists of RE resources, storage technologies for the generated energy and the transmission of this energy via HVDC grids. The end use of electricity for the integrated scenario consists of electricity, desalination and industrial gas demands. The usable heat generated and the losses incurred are comprised of curtailed electricity; heat produced by biomass, biogas and waste-to-energy power plants; and heat generated from electrolyzers for transforming power-to-hydrogen, from the methanation process transforming hydrogen-to-methane, and from methane-to-power in gas turbines. Efficiency losses occurred in A-CAES, PHS, battery storage and HVDC transmission. The energy flow diagrams for the region-wide and area-wide scenarios are presented in Supplementary Materials (Figures S9 and S10, respectively).

5. Discussion

5.1. Discussion of Results

The installation of HVDC lines enables a decrease in the cost of electricity in the RE-based system. However, the benefit due to grid integration is limited due to long distances and local storage technologies being more cost competitive. For example, the low cost RE from Australia cannot be exported to the high demand centers in Indonesia, and trading of electricity between the two Australian regions of East and West does not take place due to long distances and respective costs. Additionally, the available wind resource in Australia does not generate enough total benefits to justify the cost for the HVDC power lines. This observation is in line with another similar study, which showed that trading of RE-based SNG can reduce the total system cost without the help of power line based electricity export from Australia [66]. The total levelized cost of electricity in Southeast Asia and Pacific decreased from 66.7 €/MWh for the region-wide open trade scenario to 66.2 €/MWh for the country-wide open trade scenario and 63.5 €/MWh for the area-wide open trade scenario. The total annualized cost of the system decreased from 109 b€ to 104 b€ and the capital expenditure required for the system decreased from 919 b€ to 883 b€ for the region-wide to the area-wide open trade scenario. For the country-wide and the area-wide scenario, the cost incurred in the installation of HVDC transmission lines is compensated by a decrease in installed capacities of electricity generation sources and storage capacities. This enables lower efficiency losses and import of low cost electricity from other regions.
The integrated scenario presents a possibility to cover the projected natural gas demand in the industrial sector (except for demand in power generation and residential use) by flexible generation of SNG, and providing clean water in water stressed areas by SWRO desalination. The flexibility provided by the integrated scenario to the system is most useful in compensating seasonal fluctuations. The additional electricity demand for 572 TWhth (58.5 bcm) of SNG and 9.7 billion m3 of clean water is covered by the RE resources available in Southeast Asia. The additional electricity requirement of 1006 TWhel for gas synthesis and SWRO desalination is met by installing an additional 310 GW of PV and 140 GW of wind. Due to this, there is an increase in short term battery storage and a decrease in gas storage as a consequence of the higher flexibility of the electrolyzer units. These units are significantly increased by about 114 GW, equal to 96.6% compared to the area-wide scenario. As well, area substantial decreases in gas turbine and biomass power plant capacities. The total benefit for integrating the electricity, seawater desalination and industrial gas sectors is projected to be about 16 b€ in absolute and 9.5% in relative terms for annual system cost. Other benefits due to integrating the three sectors are a decrease in electricity demand by 149 TWh and electricity curtailment by 61 TWh. The main benefit of integrating the three sectors is the decrease of LCOE by 20.3%, to 51.1 €/MWh, when compared to the area-wide open trade scenario without any sector integration. In addition, the cost of desalinated water is affordable at 0.57 €/m3 for the Southeast Asia and Pacific region, and the cost for synthetic gas is 95 €/MWh.
The excess heat generated by the system as a byproduct of various processes such as biogas and biomass CHP plants, waste-to-energy incinerators, gas turbines, electrolyzers and methanation plants can be used to cover the heating demand in the industrial sector. In addition, the excess electricity curtailed by the system can be converted to heat, stored in heat storage and utilized for heat demand. For the area-wide open trade scenario, the usable heat generated is 325 TWhth per year, for the region-wide scenario it is 356 TWhth per year, and for the integrated scenario it is 456 TWhth per year. The higher usable heat in the integrated scenario is due to a higher absolute curtailment of electricity. The waste heat generated as a byproduct of biomass and biogas plants is evenly distributed over the year.
PV prosumers play an important role in the power sector and influence the system. For the latter the demand is assumed to be covered in a more centralized way. When the annualized costs are compared, the more centralized 100% RE system is 3.6%, 3.7% and 3.7% lower than decentralized system for the region-wide, country-wide and area-wide open trade scenarios, respectively. However, potential positive effects at the distribution grid level and a lower risk level of power cuts have been not taken into account. The additional cost for PV self-consumption is due to the different target function for the prosumers. The minimum annual costs of electricity consumption are often reached by the prosumers. For PV self-consumption to make an impact, its LCOE must be lower than the grid electricity purchase price but it can be higher than the total system LCOE. In addition to prosumers’ higher electricity generation cost, there is a tendency to increase the cost of the system by installing more flexible options, like low cost RE or more storage capacities, which induce a disturbance in the system demand profile. However, the peak demand of the entire system is reduced by about 5% (Figure 5), indicating that the highest cost hours in the system, which are mainly around noon, can be reduced by PV prosumers.
For a decentralized system, the positive impact of A-CAES is observed on the system parameters such as total LCOE, LCOS, storage losses and distribution of various storage technologies. In the case of Southeast Asia, a region with low wind share and low seasonal variation, the output of A-CAES was 1.9% of the total storage output [63]. The reason for the low output is due to the availability of sunlight all year around, such that batteries and PHS are used on a daily basis and followed by A-CAES and PtG for seasonal variation [63]. In a centralized system, the benefit due to A-CAES is reduced due to the transfer of electricity via grids being partly more economical than local storage technologies. In Southeast Asia, batteries are still the least cost storage technology on a daily basis and PtG is the least cost solution on a seasonal basis. As A-CAES lies in between daily and seasonal storage, it can be substituted by the continental grids.

5.2. Comparision with Other Future Scneario Studies for Southeast Asia and Pacific Rim

The key results and conclusions of the various scenarios described in the Introduction are taken here for comparison and discussion with the results of this study.
According to Blakers et al. [6] and Taggart et al. [13,22], transmission of electricity would be beneficial from Australia to Southeast Asia, but the findings from this research contradict the above authors’ expectations because these authors have not anticipated the low cost potential of storage technologies against the cost of transmission of electricity from Australia to ASEAN countries. Our findings suggest that local storage technologies can be a more cost effective option than transmission of electricity over distances of thousands of kilometers.
The IEA recently published its “Southeast Asia Energy Outlook 2015” [5], which projected a combined 4% share for solar PV and wind energy in the region for the year 2040. This is in drastic contrast to the findings of this study. The final outcome of any future scenario result is based on the input data and assumptions considered. The assumptions of the IEA for future solar PV and wind costs are also at odds with a current trend of their fast decline, as again found for the latest IEA WEO 2016 [67] summarized by Breyer [68]. Quite interesting are the IEA [5] year 2030 cost assumptions for wind onshore (1700 USD/kW) and large-scale solar PV (1600 USD/kWp), which are for the case of solar PV substantially higher than the respective 850 €/kWp already achieved in 2015 and expected 470 €/kWp in 2030 for European solar PV power plants [69]. This is a comparable price for such large-scale solar PV power plants all around the world. Non-governmental organization (NGOs), such as the Energy Watch Group [70], and also financial advisors such as Carbon Tracker [71] and Bloomberg [72] state that the market assumptions of the IEA for solar PV and wind energy are unrealistically low and conservative, mainly due to false assumptions for the growth pattern of these two major RE technologies [73]. The IEA expectations of a 77% fossil fuel share in the electricity sector for the year 2040 in Southeast Asia seem to be fully in conflict with the latest agreements at Conference of Parties (COP) 21 in Paris [74], whereby a substantial reduction of greenhouse gas emissions till the middle of the 21st century had been agreed. A recalculation of the IEA scenario for Southeast Asia assuming 2015 prices for fossil fuels leads to a LCOE of the power mix of about 73 USD/MWh, which is comparable to the 66 €/MWh of the country-wide 100% RE scenario in this study. However, the fossil-based mix includes a substantially higher risk, e.g., for stranded assets and further societal costs such as health costs due to air pollution.
The technical feasibility of a 100% RE system has been studied by Elliston et al. [19,21] for Australia (National Electricity Market region). The study points out that a 100% RE based system is a cost effective option. This is in agreement with our findings, although the mix of technologies that will power this system differs. According to Elliston et al., a 100% RE based system will be dominated by wind energy with small contributions from PV. However, from our findings, the least cost installed mix of technologies will be led by PV and closely followed by wind. Photovoltaics will play a major role in Australia, due to the favorable climatic conditions and high full load hours. Wind and CSP with thermal energy storage were found to be the least cost solution by Matthew and Patrick [20]. They mention that the above combination can be commercially deployed on a large scale in Australia. The findings of this paper suggest otherwise; wind will play an important role in the future for Australia, as will PV. This is due to the dramatic decrease in the cost of PV systems and batteries, in contrast to CSP, which is also indicated by Afanasyeva et al. [75]. According to Mason and Page [14], a 100% RE based system for New Zealand will be based on hydro and followed by wind. Our findings are in agreement that the system will involve hydro, but PV and wind will contribute equally in electricity generation.
For the ASEAN region, a 100% RE system will be based on PV as a major source according to Hearps and Gilbert [23]. Our findings for the ASEAN region correlate with this conclusion as PV will be the least cost option for powering the generation mix. According to Teske et al. [7], the share of renewables in the electricity generation mix till 2030 could be 60% and by 2050 it could be 92%. Moreover, the installed capacity of renewables could reach 427 GW in 2030 and 1184 by 2050. The comparable results obtained from this study indicate that a 100% RE based system is possible by 2030 with installed capacity of renewables of 722 GW for a centralized scenario.
Another study of the ASEAN region by Huber et al. [24] analyzes the cost optimal pathways towards a sustainable electricity system. The analysis is performed on an hourly basis for 12 weeks, with each week representing a month in a year. Our model goes further and analyses generation, demand, transmission and storage for every unique hour of the year. The assumptions for various technologies in Huber et al. are taken from IEA WEO 2013, which are rather conservative in comparison to the assumptions in this study. The results obtained for an optimal generation mix according to Huber et al. [24] for a zero carbon emissions scenario suggests that PV is a major source of electricity followed by wind and hydro. It is also mentioned that the region’s high geothermal potential is exploited, as it is a cost effective technology. Biomass will play an important role in balancing the fluctuations. Due to the high deployment of PV, batteries will play a vital role in storing this energy for later use. According to Huber et al. [24], grid connections will play an important role in a system with a high share of renewables due to their intermittency. Moreover, the grid connections allow the balancing of fluctuations across different regions through major export and import of electricity between the ASEAN countries. In such a case, Vietnam is seen as a net exporter. The major power trading lines are Myanmar West–Myanmar South, Vietnam–Cambodia (transport of offshore wind power to the main ASEAN region), Jakarta–Sumatra and Myanmar–Thailand. These results from a centralized scenario were compared with the alternative decentralized scenario. The conclusion was that a cost optimal mix involving very high share of renewables and integration of different areas for electricity trading are necessary to avoid large curtailment and higher costs of electricity. The above results are in agreement with the results of this study with regards to electricity generation mix and interconnections via grids being beneficial.

5.3. Discussion of the LCOE of Alternative Technologies

The results obtained for a 100% renewable energy based system for Southeast Asia and the Pacific region can be compared with recent alternatives to non-renewable technology options in Europe such as nuclear energy, natural gas and coal carbon capture and storage (CCS) [76]. These alternatives can also serve to comply with the climate change mitigation policy for a low carbon based energy system. However, the LCOE of alternatives as given in [76] are 112 €/MWh for new nuclear (assumed for 2023 in the UK and Czech Republic), 112 €/MWh for gas CCS (assumed for 2019 in the UK, and 126 €/MWh for coal CCS (assumed for 2019 in the UK). In addition, a report published by the European Commission [77] indicates that CCS technology will not be available till the year 2030, and a report by Citigroup questions whether it will ever be profitable at all [78]. The findings in this paper indicate a scenario based on 100% RE is possible and cheaper in cost than these higher risk options, which still have many disadvantages compared to renewable resources. These disadvantages include nuclear proliferation risk, nuclear melt-down, a lack of a solution to nuclear waste disposal, leftover CO2 emissions from power plants with CCS technology, health risks due to heavy metal emissions from coal fired power plants, and diminishing fossil fuel reserves. Another commonly mentioned option, nuclear fission, has limitations similar to those mentioned above. Moreover, the financial, and human research and development resources spent towards it will not solve the energy problems in the world [79]. The above-mentioned alternative options do not satisfy the criteria for low cost, fully sustainable pathways for the future.

6. Conclusions

Enough power can be generated from the RE technologies to cover all the electricity demand for the year 2030 on a cost level of 51–66 €/MWhel depending on geographical and sectorial integration. The cost parameter range when compared to non-renewable energy resources is significantly lower and the intermittency of renewables is effectively stabilized by grids and storage technologies to provide the hourly demand of electricity. In addition, the cost of primary energy generation is between 66–72% of the total cost depending on the scenario, which ensures that demand is always met at a modest cost. In addition to electricity demand, it is possible to cover the gas demand in the industrial sector by the PtG technology. The demand for heating in the industrial and residential sectors may be at least partly covered by the excess heat generated as a by-product of SNG generation and conversion of curtailed electricity. For all the scenarios, PV plays a major role followed by biomass and wind energy in all the regions apart from Australia, where PV and wind play an important role. For the region-wide scenario, the storage requirements are mainly based on batteries. The role of other storage technologies, especially A-CAES, has a vital role in the region-wide scenario as a mid-term storage between batteries and PtG particularly in areas of high wind share and high seasonal variation. The HVDC transmission grid plays a role in the trading of electricity in the ASEAN countries, where trading is more cost competitive than local storage technologies available. However, in some cases, due to long distances, local storage technologies are more cost competitive than transmission of electricity. This is also observed in the case of A-CAES, where grid integration reduces the economic benefit of this particular storage technology but other storage technologies such as batteries and PtG are still required. Due to this, the system configurations for a region-wide and area-wide open trade scenario are very similar. A slight increase of 3–4% in the total cost of electricity because of PV self-consumption is due to the utilization of solar electricity and in particular respective batteries for self-consumption at a higher cost level. In addition, disturbances in the system due to the excess electricity generated from prosumer increases system’s need for additional flexibility, while reducing the most costly peak hours in the year. In the case of an integrated scenario, it was found that seasonal SNG storage is largely substituted by industrial SNG generation for the electricity sector. In the case of energy deficit, instead of using gas turbines the system restricts SNG production as a major source of flexibility.
More research is required that investigates how to utilize the waste heat generated in the system and to better understand a fully integrated renewable energy system in Southeast Asia and the Pacific. However, this research indicates that a 100% RE system is reachable in Southeast Asia and the Pacific, and more cost competitive than a nuclear-fossil fuel option.

Supplementary Materials

Supplementary Materials are available online at www.mdpi.com/1996-1073/10/5/583/s1.

Acknowledgments

The authors gratefully acknowledge the public financing of Tekes, the Finnish Funding Agency for Innovation, for the “Neo-Carbon Energy” project under the number 40101/14. The first author would like to thank Fortum Foundation for the valuable scholarship. The authors would like to thank Michael Child for proofreading.

Author Contributions

Ashish Gulagi collected the input data, performed the research and simulations, generated the results, analyzed the results, and wrote the manuscript. Dmitrii Bogdanov did the coding for the model used in this research. Christian Breyer framed the research questions and scope of the work, checked the results, facilitated discussions, and reviewed the manuscript.

Conflicts of Interest

The authors declare no conflict of interest. The founding sponsors had no role in the design of the study; in the collection, analyses, or interpretation of data; in the writing of the manuscript, and in the decision to publish the results.

Abbreviations

A-CAESAdiabatic compressed air energy storage
ASEANAssociation for South East Nations
CapexCapital expenditure
CCGTCombined cycle gas turbine
CCSCarbon capture and storage
CSPConcentrating solar thermal power
FLHFull load hours
HVDCHigh-voltage direct current
IEAInternational Energy Agency
NEMNational Electricity Market
LCOCLevelized cost of curtailment
LCOELevelized cost of electricity
LCOGLevelized cost of gas
LCOSLevelized cost of storage
LCOTLevelized cost of transmission
OCGTOpen cycle gas turbine
OpexOperational expenditure
PHSPumped hydro storage
PtGPower-to-gas
RERenewable energy
SWROSeawater reverse osmosis
TESThermal energy storage
WACCWeighted average cost of capital

References

  1. Khare, V.; Nema, S.; Baredar, P. Status of solar wind renewable energy in India. Renew. Sustain. Energy Rev. 2013, 27, 1–10. [Google Scholar] [CrossRef]
  2. Cochran, J.; Miller, M.; Milligan, M.; Ela, E.; Arent, D.; Bloom, A. Market Evolution: Wholesale Electricity Market Design for 21st Century Power Systems; Technical Report, Contract No. DE-AC36-08GO28308; National Renewable Energy Laboratory: Golden, CO, USA, 2013.
  3. International Monetary Fund. World Economic Outlook Database; IMF: Washington, DC, USA, 2015. [Google Scholar]
  4. United Nations, Department of Economic and Social Affairs, Population Division. World Population Prospects: The 2015 Revision; United Nations: New York, NY, USA, 2015. [Google Scholar]
  5. International Energy Agency. Southeast Asia Energy Outlook; IEA Publications: Paris, France, 2015. [Google Scholar]
  6. Blakers, A.W.; Luther, J.; Nadolny, A. Asia Pacific Super Grid—Solar electricity generation, storage and distribution. Green 2012, 2, 189–202. [Google Scholar]
  7. Teske, S.; Pregger, T.; Simon, S.; Naegler, T.; O’Sullivan, M.; Sawyer, S.; Obusan, A.; Buakamsri, T. Energy [R]evolution: A Sustainable ASEAN Energy Outlook; Greenpeace International and European Renewable Energy Council (EREC): Amsterdam, The Netherlands, 2013. [Google Scholar]
  8. Garnaut, R. The Garnaut Review: Australia in the Global Response to Climate Change; Cambridge University Press: Cambridge, UK, 2011. [Google Scholar]
  9. Koh, S.L.; Lim, Y.S. Meeting energy demand in a developing economy without damaging the environment—A case study in Sabah, Malaysia, from technical, environmental and economic perspectives. Energy Policy 2010, 38, 4719–4728. [Google Scholar] [CrossRef]
  10. Mathiesen, B.V.; Lund, H.; Karlsson, K. 100% Renewable energy systems, climate mitigation and economic growth. Appl. Energy 2011, 88, 488–501. [Google Scholar] [CrossRef]
  11. Lund, H.; Mathiesen, B.V. Energy system analysis of 100% renewable energy systems—The case of Denmark in years 2030 and 2050. Energy 2009, 34, 524–531. [Google Scholar] [CrossRef]
  12. Yusaf, T.; Goh, S.; Borserio, J.A. Potential of renewable energy alternatives in Australia. Renew. Sustain. Energy Rev. 2011, 15, 2214–2221. [Google Scholar] [CrossRef]
  13. Taggart, S. A Pan-Asian Energy Infrastructure by 2050; Grenatec: Sydney, Australia, 2013. [Google Scholar]
  14. Mason, I.G.; Page, S.C.; Williamson, A.G. A 100% renewable electricity generation system for New Zealand utilising hydro, wind, geothermal and biomass resources. Energy Policy 2010, 38, 3973–3984. [Google Scholar] [CrossRef]
  15. Kelly, G. History and potential of renewable energy development in New Zealand. Renew. Sustain. Energy Rev. 2011, 15, 2501–2509. [Google Scholar] [CrossRef]
  16. Lidula, N.W.A.; Mithulananthan, N.; Ongsakul, W.; Widjaya, C.; Henson, R. ASEAN towards clean and sustainable energy: Potentials, utilization and barriers. Renew. Energy 2007, 32, 1441–1452. [Google Scholar] [CrossRef]
  17. Asian Development Bank. Rural Renewable Energy Initiative in the Greater Mekong Subregion; ADB: Manila, Philippines, 2015. [Google Scholar]
  18. Asian Development Bank. Business Models to Realize the Potential of Renewable Energy and Energy Efficiency in the Greater Mekong Subregion; ADB: Manila, Philippines, 2015. [Google Scholar]
  19. Elliston, B.; Diesendorf, M.; MacGill, I. Simulations of scenarios with 100% renewable electricity in the Australian National Electricity Market. Energy Policy 2012, 45, 606–613. [Google Scholar] [CrossRef]
  20. Matthew, W.; Patrick, H. Zero Carbon Australia Stationary Energy Plan; Melbourne Energy Institute: Melbourne, Australia, 2010. [Google Scholar]
  21. Elliston, B.; MacGill, I.; Diesendorf, M. Least cost 100% renewable electricity scenarios in the Australian National Electricity Market. Energy Policy 2013, 59, 270–282. [Google Scholar] [CrossRef]
  22. Taggart, B.S.; James, G.; Dong, Z.; Russell, C. The future of renewables linked by a transnational Asian grid. Proc. IEEE 2011, 100, 348–359. [Google Scholar] [CrossRef]
  23. Hearps, P.; Gilbert, S.C. An Energy Revolution is Possible; Friends of the Earth International: Amsterdam, The Netherlands, 2015. [Google Scholar]
  24. Huber, M.; Roger, A.; Hamacher, T. Optimizing long-term investments for a sustainable development of the ASEAN power system. Energy 2015, 88, 180–193. [Google Scholar] [CrossRef]
  25. Association of Southeast Nations. ASEAN Plan of Action for Energy Cooperation 2010–2015; ASEAN Centre for Energy Impact of Global Economic Crisis: Jakarta, Indonesia, 2012. [Google Scholar]
  26. Chang, Y.; Li, Y. Power generation and cross-border grid planning for the integrated ASEAN electricity market: A dynamic linear programming model. Energy Strateg. Rev. 2013, 2, 153–160. [Google Scholar] [CrossRef]
  27. Taggart, S. A grand vision for power in Asia. Renew. Energy Focus 2011, 12, 57–59. [Google Scholar] [CrossRef]
  28. Dii GmbH. Desert Power 2050: Perspectives on a Sustainable Power System for EUMENA; Dii GmbH: Munich, Germany, 2012. [Google Scholar]
  29. Desertec Foundation. Clean Power from Deserts—The DESERTEC Concept for Energy, Water and Climate Security; Desertec Foundation: Hamburg, Germany, 2007. [Google Scholar]
  30. International Energy Agency Photovoltaics Power Systems Programme. Energy from the Desert—Very Large Scale PV Power Plants for Shifting to Renewable Energy Future; Report IEA-PVPS; IEA-PVPS: St. Ursen, Switzerland, 2015. [Google Scholar]
  31. Mano, S.; Ovgor, B.; Samadov, Z.; Pudlik, M.; Julich, V.; Sokolov, D.; Yong Yoon, J. Gobitec and Asian Super Grid for Renewable Energies in Northeast Asia, Report Prepared by Energy Charter Secretariat; Energy Economics Institute of the Republic of Korea: Ulsan, Korea; Energy Systems Institute of the Russian Federation: Irkutsk, Russia; Ministry of Energy of Mongolia: Ulaanbaatar, Mongolia; Japan Renewable Energy Foundation: Tokyo, Japan, 2014.
  32. Komoto, K.; Enebish, N.; Song, J. Very large scale PV systems for North-East Asia: Preliminary project proposals for VLS-PV in the Mongolian Gobi desert. In Proceedings of the 39th Photovoltaic Specialists Conference (PVSC), Tampa, FL, USA, 16–21 June 2013. [Google Scholar]
  33. Mella, S. Does Australia Energy Export Future Lie with the Asian Supergrid? Available online: http://nautilus.org/napsnet/napsnet-policy-forum/does-australia-energy-export-future-lie-with-the-asian-supergrid/ (accessed on 1 February 2017).
  34. Baumann, C.; Schuster, R.; Moser, A. Economic potential of power-to-gas energy storages. In Proceedings of the 2013 10th International Conference on the European Energy Market (EEM), Stockholm, Sweden, 27–31 May 2013; pp. 1–6. [Google Scholar]
  35. Ibrahim, H.; Ilinca, A.; Perron, J. Energy storage systems-Characteristics and comparisons. Renew. Sustain. Energy Rev. 2008, 12, 1221–1250. [Google Scholar] [CrossRef]
  36. Breyer, C.; Tsupari, E.; Tikka, V.; Vainikka, P. Power-to-Gas as an emerging profitable business through creating an integrated value chain. Energy Procedia 2015, 73, 182–189. [Google Scholar] [CrossRef]
  37. Bogdanov, D.; Breyer, C. North-East Asian Super Grid for 100% Renewable Energy supply: Optimal mix of energy technologies for electricity, gas and heat supply options. Energy Convers. Manag. 2016, 112, 176–190. [Google Scholar] [CrossRef]
  38. International Association of Seismology and Physics of the Earth’s Interior. The International Heat Flow Commission; IHFC Database; IASPEI: Boulder, CO, USA, 2015. [Google Scholar]
  39. American Association of Petroleum Geologists. Global Heat Flow Database; American Association of Petroleum Geologists: Tulsa, OK, USA, 2015. [Google Scholar]
  40. Chamorro, C.R.; García-Cuesta, J.L.; Mondéjar, M.E.; Linares, M.M. An estimation of the enhanced geothermal systems potential for the Iberian Peninsula. Renew. Energy 2014, 66, 1–14. [Google Scholar] [CrossRef]
  41. Huenges, E. Geothermal Energy Systems, Exploration, Development and Utilization, 2nd ed.; John Wiley & Sons: Weinheim, Germany, 2012. [Google Scholar]
  42. International Energy Agency. Energy Balances of OECD Countries; IEA: Paris, France, 2013. [Google Scholar]
  43. Luck, M.; Landis, M.; Gassert, F. Aqueduct Water Stress Projections: Decadal Projections of Water Supply and Demand Using CMIP5 GCMs; World Resources Institute: Washington, DC, USA, 2015. [Google Scholar]
  44. Caldera, U.; Bogdanov, D.; Breyer, C. Local cost of seawater RO desalination based on solar PV and wind energy: A global estimate. Desalination 2016, 385, 207–216. [Google Scholar] [CrossRef]
  45. Barbosa, L.S.N.S.; Bogdanov, D.; Vainikka, P.; Breyer, C. Hydro, wind and solar power as a base for a 100% Renewable Energy supply for South and Central America. PLoS ONE 2017, 12, e0173820. [Google Scholar] [CrossRef] [PubMed]
  46. Perusahaan Listrik Negara. Towards New Performance Level; PLN: Jakarta, Indonesia, 2014. [Google Scholar]
  47. Blechinger, P.; Cader, C.; Bertheau, P.; Huyskens, H.; Seguin, R.; Breyer, C. Global Analysis of the Techno-Economic Potential of Renewable Energy Hybrid Systems on Small Islands. Energy Policy 2016, 98, 674–687. [Google Scholar] [CrossRef]
  48. Faizal, R.; Nurdin, M.; Hariyanto, N.; Pack, S.; Plesch, J. Sumatra-Java HVDC transmission system modelling and system impact analysis. In Proceedings of the IEEE PowerTech 2015, Eindhoven, The Netherlands, 29 June–2 July 2015; pp. 1–6. [Google Scholar]
  49. Pleßmann, G.; Erdmann, M.; Hlusiak, M.; Breyer, C. Global energy storage demand for a 100% renewable electricity supply. Energy Procedia 2014, 46, 22–31. [Google Scholar] [CrossRef]
  50. Agora Energiewende. Stromspeicher in der Energiewende. Agora Energiewende: Berlin, 2014. Available online: www.agora-energiewende.de/themen/optimierung/detailansicht/article/studie-die-energiewende-muss-nicht-auf-stromspeicher-warten/ (accessed on 1 February 2017).
  51. UBS. Q-Series—Global Utilities, Autos & Chemicals—Will Solar, Batteries and Electric Cars Re-Shape the Electricity System? UBS: Basel, Switzerland, 2014. [Google Scholar]
  52. Hoffmann, W. Importance and evidence for cost effective electricity storage. In Proceedings of the 29th European Photovoltaic Solar Energy Conference and Exhibition (EU PVSEC), Amsterdam, The Netherlands, 22–26 September 2014. [Google Scholar]
  53. Fraunhofer Institute for Solar Energy Systems. Current and Future Cost of Photovoltaics. Long-term Scenarios for Market Development, System Prices and LCOE of Utility-Scale PV Systems; Fraunhofer Institute for Solar Energy Systems: Freiburg, Germany, 2015. [Google Scholar]
  54. United Nations. World Urbanization Prospects, the 2014 Revision; UN: New York, NY, USA, 2014. [Google Scholar]
  55. Urban, W.; Lohmann, H.; Girod, K. Abschlussbericht fur das BMBF-Verbundprojekt Biogaseinspeisung. Fraunhofer UMSICHT, 2009. Available online: www.biogaseinspeisung.de/download/Abschlussbericht_Biogaseinspeisung_Band_4_Technik_Biogasaufbereitung_AP2.pdf (accessed on 1 February 2017). (In German).
  56. European Commission. ETRI 2014—Energy Technology Reference Indicator Projections for 2010–2050; EC Joint Research Centre Institute for Energy and Transport: Petten, The Netherlands, 2014. [Google Scholar]
  57. Gerlach, A.; Werner, C.; Breyer, C. Impact of financing costs on global grid-parity dynamics till 2030. In Proceedings of the 29th European Photovoltaic Solar Energy Conference and Exhibition (EU PVSEC), Amsterdam, The Netherlands, 22–26 September 2014. [Google Scholar]
  58. Werner, C.; Breyer, C.; Gerlach, A.; Beckel, O. Photovoltaic with energy storage: An overview on economics, system design and politics. In Proceedings of the 27th European Photovoltaic Solar Energy Conference (EU PVSEC), Frankfurt, Germany, 24–28 September 2012. [Google Scholar]
  59. German Biomass Research Centre. Regionale und Globale Räumliche Verteilung von Biomassepotenzialen; German Biomass Research Centre: Leipzig, Germany, 2009. (In German) [Google Scholar]
  60. International Energy Agency. Technology Roadmap—Bioenergy for Heat and Power; IEA Publications: Paris, France, 2012. [Google Scholar]
  61. Intergovernmental Panel on Climate Change. Special Report on RE Sources and CC Mitigation; Intergovernmental Panel on Climate Change: Geneva, Switzerland, 2011. [Google Scholar]
  62. Farfan, J.; Breyer, C. Structural Changes of the global power generation capacity towards sustainability and the risk of stranded investments supported by a sustainability indicator. J. Clean. Prod. 2017, 141, 370–384. [Google Scholar] [CrossRef]
  63. Gulagi, A.; Aghahosseini, A.; Bogdanov, D.; Breyer, C. Comparison of the potential role of adiabatic compressed air energy storage (A-CAES) for a fully sustainable energy system in a region of significant and low seasonal variations. In Proceedings of the 10th International Renewable Energy Storage Conference, Düsseldorf, Germany, 15–17 March 2016. [Google Scholar]
  64. Fthenakis, V.; Mason, J.E.; Zweibel, K. The technical, geographical, and economic feasibility for solar energy to supply the energy needs of the US. Energy Policy 2009, 37, 387–399. [Google Scholar] [CrossRef]
  65. Aghahosseini, A.; Breyer, C. Assessment of Adiabatic Compressed Air Energy Storage Geological Resource Potential for the Global Electricity Supply. Energy 2017. submitted. [Google Scholar]
  66. Gulagi, A.; Bogdanov, D.; Fasihi, M.; Breyer, C. Can Australia power the energy-hungry Asia with renewable energy? Sustainability 2017, 9, 233. [Google Scholar] [CrossRef]
  67. International Energy Agency. World Energy Outlook 2016; IEA Publications: Paris, France, 2016. [Google Scholar]
  68. Breyer, C. Comments on the IEA World Energy Outlook 2016. In Proceedings of the WEC Finland’s Breakfast Meeting: IEA World Energy Outlook 2016, Helsinki, Finland, 23 November 2016. [Google Scholar]
  69. Vartiainen, E.; Masson, G.; Breyer, C. PV LCOE in Europe 2015–2050. In Proceedings of the 31st European Photovoltaic Solar Energy Conference (EU PVSEC), Hamburg, Germany, 14–18 September 2015. [Google Scholar]
  70. Energy Watch Group. IEA Creates Misleading Future Scenarios for Solar Power Generation, Berlin. 27 November 2015. Available online: http://energywatchgroup.org/iea-creates-misleading-future-scenarios-solar-power-generation/ (accessed on 1 February 2017).
  71. Carbon Tracker. Lost in Transition: How the Energy Sector Is Missing Potential Demand Destruction; Carbon Tracker: London, UK, 2015. [Google Scholar]
  72. Liebreich, M. Future of Energy Summit; Bloomberg New Energy Finance: Shanghai, China, 2015. [Google Scholar]
  73. Metayer, M.; Breyer, C.; Fell, H.-J. The projections for the future and quality in the past of the World Energy Outlook for solar PV and other Renewable Energy technologies. In Proceedings of the 31st European Photovoltaic Solar Energy Conference (EU PVSEC), Hamburg, Germany, 14–18 September 2015. [Google Scholar]
  74. United Nations Framework Convention on Climate Change. Adoption of the Paris Agreement—Proposal by the President; UNFCCC: Paris, France, 2015. [Google Scholar]
  75. Afanasyeva, S.; Breyer, C.; Engelhard, M. Impact of battery cost on the economics of hybrid photovoltaic power plants. Energy Procedia 2016, 99, 157–173. [Google Scholar] [CrossRef]
  76. Agora Energiewende. Comparing the Cost of Low-Carbon Technologies: What Is the Cheapest Option? Agora Energiewende: Berlin, Germany, 2014. [Google Scholar]
  77. European Commission. Integration of Renewable Energy in Europe. Study Prepared by KEMA Consulting, DNV GL; Energy, Imperial College and NERA Economic Consulting on behalf of DG Energy: Brussels, Belgium, 2014; pp. 7–8, 54. [Google Scholar]
  78. Citi Research Equities. Paris Climate Change Agreement; Citi Research Equities: Sydney, Australia, 2015. [Google Scholar]
  79. Dittmar, M. Nuclear energy: Status and future limitations. Energy 2012, 37, 35–40. [Google Scholar] [CrossRef]
Figure 1. An example of grid connection between Australia and ASEAN. Figure taken from [33].
Energies 10 00583 g001
Figure 2. Block diagram of the energy system model (left); and the model flowchart (right) for Southeast Asia [45]. ST: steam turbine; PtH: power-to-heat done by heating rod; ICE: internal coombustion engine; GT: gas turbine; PtG: power-to-gas; PHS: pumped hydro storage; HVDC: high voltage direct current; A-CAES: adiabatic compressed air energy storage; TES: thermal energy storage; HHB: hot heat burner; and CSP: concentrating solar thermal power.
Energies 10 00583 g002
Figure 3. Southeast Asian subdivision and HVDC grid configuration.
Energies 10 00583 g003
Figure 4. Aggregated feed-in profiles for: (a) optimally tilted PV; (b) single-axis tracking PV; (c) CSP solar field; and (d) wind power plant in Southeast Asia.
Energies 10 00583 g004
Figure 5. (a) Aggregated load curve; and (b) load curve with PV prosumers influence for Southeast Asia for the year 2030.
Energies 10 00583 g005
Figure 6. Annual import and export of electricity diagrams for: (a) area-wide; and (b) integrated scenario.
Energies 10 00583 g006
Figure 7. Installed capacities RE generation (left) and storage capacities (right) for: (a) region-wide; (b) area-wide; and (c) integrated scenarios for Southeast Asia and Pacific regions.
Energies 10 00583 g007aEnergies 10 00583 g007b
Figure 8. System energy flow for the integrated scenario.
Energies 10 00583 g008
Table 1. Various studies undertaken on 100% renewable energy (RE) for Southeast Asian region. NEM: national electricity market; CSP: concentrating solar thermal power; PV: photovoltaic; HVDC: high voltage direct current; OECD: Organisation for Economic Co-operation and Development; and ASEAN: Association of Southeast Asian Nations.
StudyScopeKey Findings
Elliston et al., 2012 [19]Australia (NEM region)100% RE system technically feasible based on available RE resources for the year 2012. CSP and PV to satisfy about half of the total annual electricity demand
Matthew and Patrick, 2010 [20]AustraliaWind and CSP with heat storage provide the least cost effective combination that is commercially available and can be deployed on a large scale in Australia
Elliston et al., 2013 [21]Australia (NEM region)Least cost options for 100% RE supply in 2030, dominated by wind with smaller contributions from photovoltaics
Mason et al., 2010 [14]New Zealand100% RE system based on 53–60% hydro, 22–25% wind, 12–14% geothermal, 0.2–0.3% gasification or PHS, 0.8–0.9% wood thermal and 0.2–0.3% biogas generation is possible replacing the current system of 32% fossil fueled thermal generation
Blakers et al., 2012 [6]Southeast Asia and AustraliaTransmission of solar electricity from Australia is cost competitive. Demand for electricity in Southeast Asia in 2050 would be satisfied by solar electricity from Australia and supplemented by locally produced electricity from renewable and conventional sources
Taggart et al., 2012 [22]Asia: connecting Australia-Southeast Asia-ChinaDecrease in cost of electricity from interregional connections and decrease in regions total emission cost
Taggart, 2013 [13]Asia: connecting Australia-Southeast Asia-ChinaNetwork of highly efficient HVDC lines connecting all countries in 2050. Introduction of carbon pricing
Hearps and Gilbert, 2015 [23]includes all Asian countries except OECD Asia, China and IndiaElectricity mix for Southeast Asia in 2030, Solar PV (55%) in small grids and stand-alone systems and geothermal (20%)
Teske et al., 2011 [7]ASEANThe share of renewables in the electricity generation would be 60% by 2030 and 92% by 2050
Huber et al., 2015 [24]ASEANCheapest options for electricity generation are hydro, biomass and geothermal. Interconnections between the countries are beneficial
Table 2. Financial assumptions for major energy system components.
TechnologyCapex [€/kW]Opex Fix [€/(kW∙a)]Opex Var [€/kWh]Lifetime [a]
PV optimally tilted5508035
PV single-axis tracking6209035
PV rooftop81312035
Wind onshore100020025
CSP (solar field)52811025
Hydro run-of-river2560115.20.00560
Hydro dam1650660.00360
Geothermal energy486087030
Water electrolysis380130.001230
Methanation23450.001530
CO2 scrubbing356140.001330
CCGT77519.40.00130
OCGT47514.250.00130
Steam turbine60012030
Hot heat burner1002030
Heating rod200.40.00130
Biomass CHP25001750.00130
Biogas CHP37014.80.00130
Waste incinerator5240235.80.00720
Biogas digester68027.2020
Biogas upgrade25020020
TechnologyCapex [€/kWh]Opex Fix [€/(kWh∙a)]Opex Var [€/kWh]Lifetime [a]
Battery150100.000210
PHS70110.000250
A-CAES310.40.001240
TES242020
Gas storage0.050.001050
TechnologyCapex [€/(kWNTC∙km)]Opex Fix [€/(kWNTC∙km∙a)]Opex Var [€/kWhNTC]Lifetime [a]
HVDC line on ground0.6120.0075050
HVDC line submarine0.9920.0010050
TechnologyCapex [€/kWNTC]Opex Fix [€/(kWNTC∙a)]Opex Var [€/kWhNTC]Lifetime [a]
HVDC converter pair1801.8050
TechnologyCapex [€/(m3∙a)]Opex Fix [€/(m3 a)]Opex Var [€/m3]Lifetime [a]
Water desalination2.230.09030
TechnologyCapex [€/(m3∙h∙km)]Opex Fix [€/(m3∙h∙km∙a)]Opex Var [€/m3∙h∙km]Lifetime [a]
Horizontal pumping and pipes19.30.39030
Vertical pumping and pipes15.50.31030
Table 3. Average full load hours and levelized cost of electricity (LCOE) for single-axis tracking PV, optimally tilted PV, solar CSP and wind power plants in Southeast Asian regions. Pop.: population; mio.: million; Electr.: electricity and FLH: full load hours.
RegionPop. [mio. Pop]Electr. Demand [TWh]PV-Single-Axis FLHPV Optimally Tilted FLHCSP FLHWind FLHPV Single-Axis LCOE [€/MWh]PV Optimally Tilted LCOE [€/MWh]CSP LCOE [€/MWh]Wind LCOE [€/MWh]
Total area74616301905152915521565303379142
New Zealand554176514301541412232357626
Australia East25245231617332261350025295230
Australia West438239717642424378224294828
Indonesia Papua + Papua New Guinea1216181614651300118231349090
Sumatra58100174614451193440333598240
Java + Timor-Leste166148220316832008122526305886
Indonesia East3732186915031467394303480269
Malaysia West + Singapore34169183514851298454313490233
Malaysia East + Brunei972181014891373170313485623
Philippines13898192915031585179929347459
Myanmar5940184315391591847313374125
Thailand69184179414951360155932348668
Laos926167714391248934343594113
Vietnam102385176414561287183832359158
Cambodia1921181015121340123031338786
Table 4. Key financial results for the four scenarios applied for Southeast Asian region.
2030 ScenariosTotal LCOELCOE PrimaryLCOCLCOSLCOTTotal Ann. CostTotal CAPEXRE CapacitiesGenerated Electricity
€/MWh€/MWh€/MWh€/MWh€/MWhb€b€GWTWh
Region-wide66.744.41.920.40.01099197631780
Country-wide66.244.31.819.90.21089147551773
Area-wide63.545.61.115.81.01048837051714
Integrated scenario51.139.11.010.50.5153133911512794
Table 5. Results on the installed RE technologies and storage capacities for the four scenarios.
TechnologyUnitRegion-WideCountry-WideArea-WideIntegrated Scenario
PV self-consumption(GW)150150150150
PV optimally tilted(GW)5555
PV single-axis tracking(GW)347341294604
PV total(GW)502495448758
CSP(GW)0000
Wind energy(GW)115115115255
Biomass power plants(GW)31303130
MSW incinerator(GW)3333
Biogas power plants(GW)25252120
Geothermal power(GW)11121715
Hydro Run-of-River(GW)28282727
Hydro dams(GW)38383939
Battery PV self-consumption(GWh)172172172172
Battery System(GWh)591588507580
Battery total(GWh)763759678752
PHS(GWh)9996
A-CAES(GWh)847780205269
Heat storage(GWh)0000
PtG electrolyzers(GWel)11104118
CCGT(GW)2423188
OCGT(GW)2220
Steam Turbine(GW)0000

