
A Novel Multi-Objective Optimal Approach for Wind Power Interval Prediction


Abstract
:1. Introduction
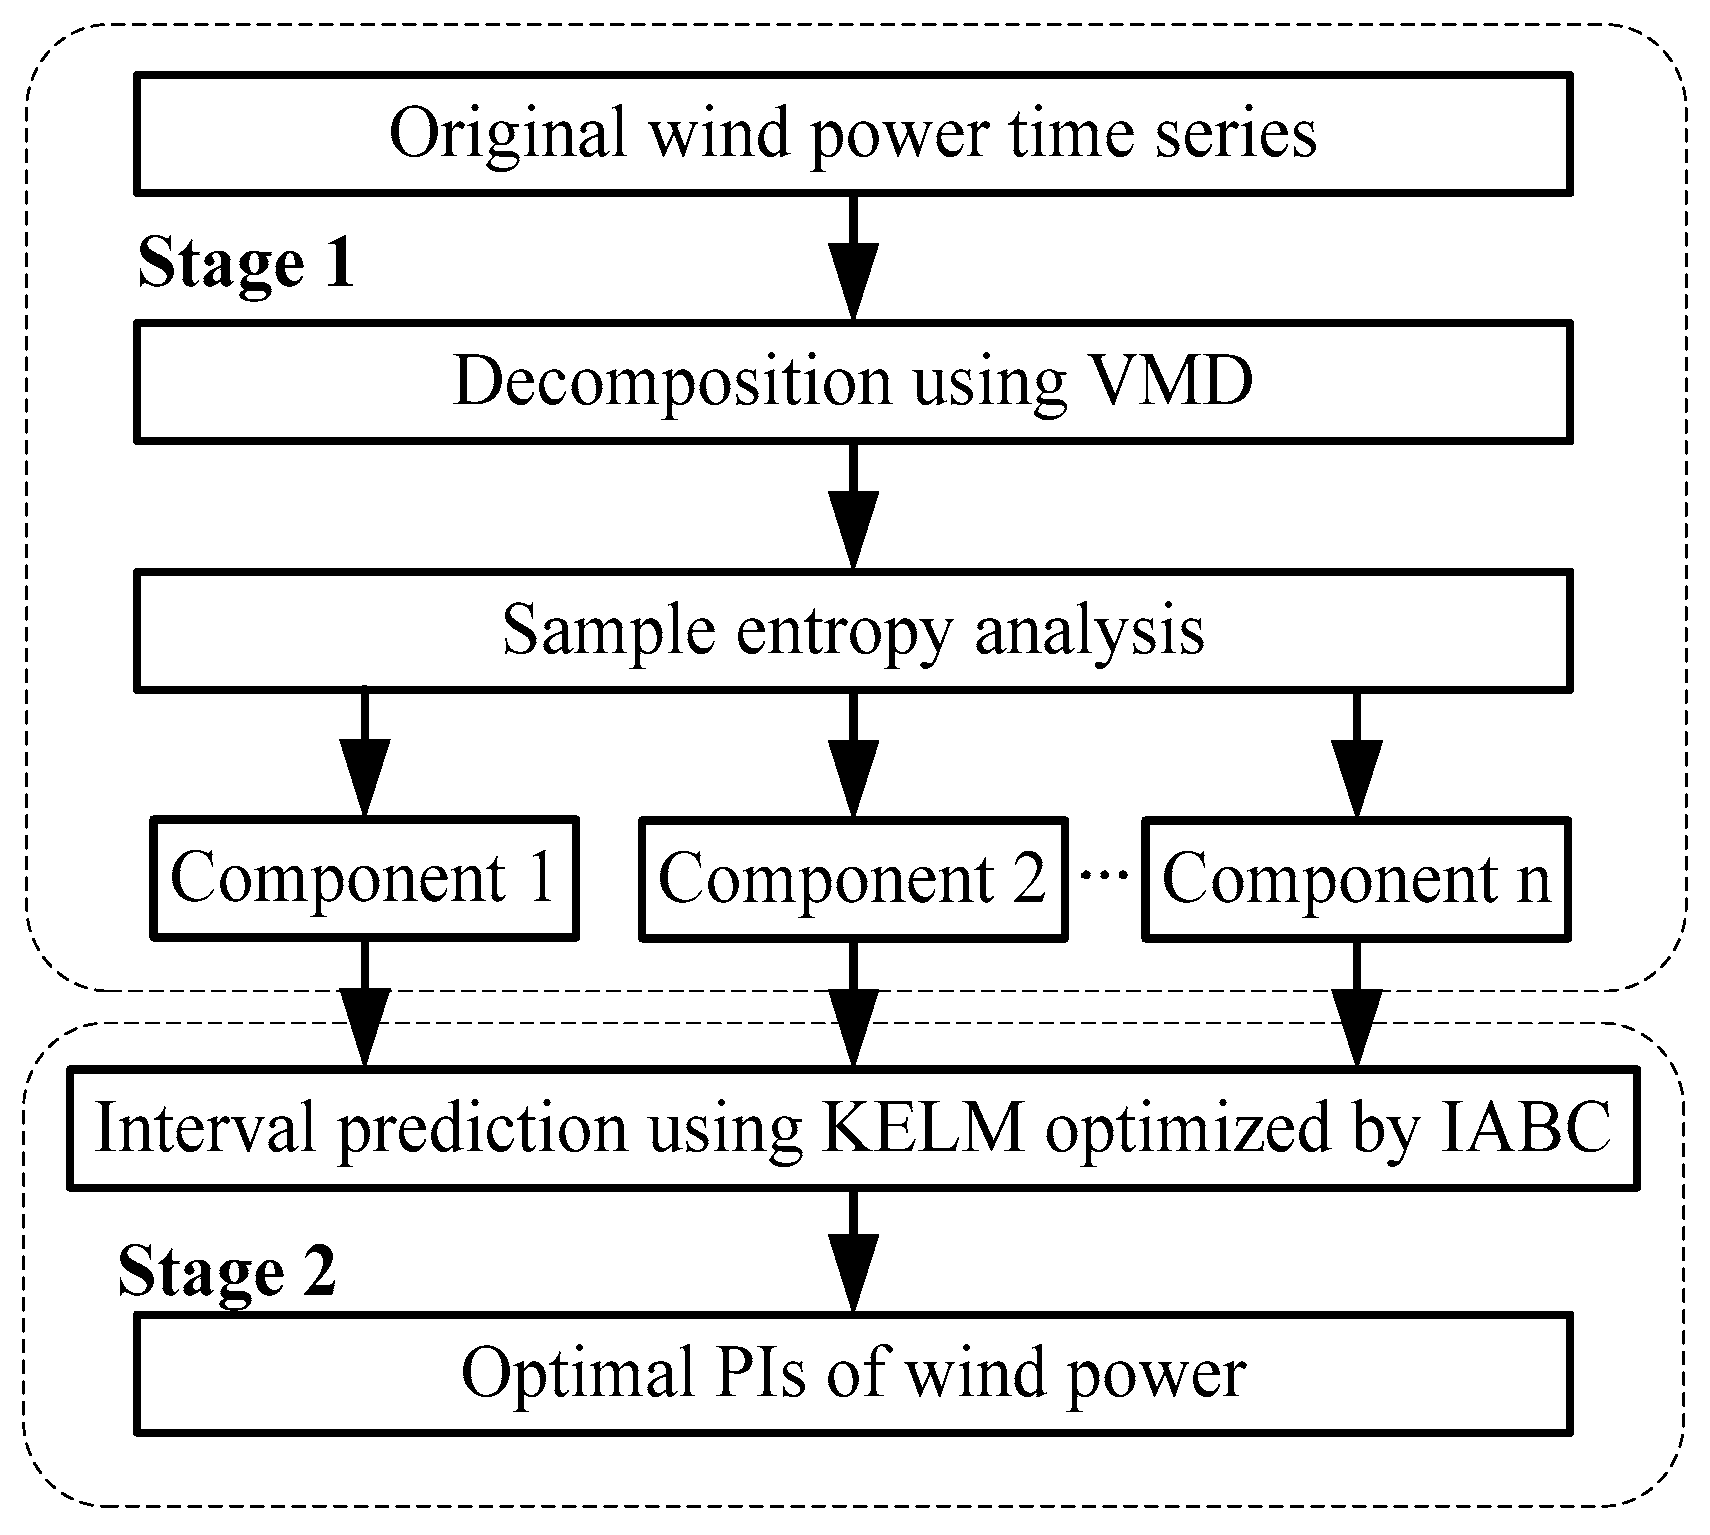
2. Proposed Approach for Forecasting Wind Power Intervals
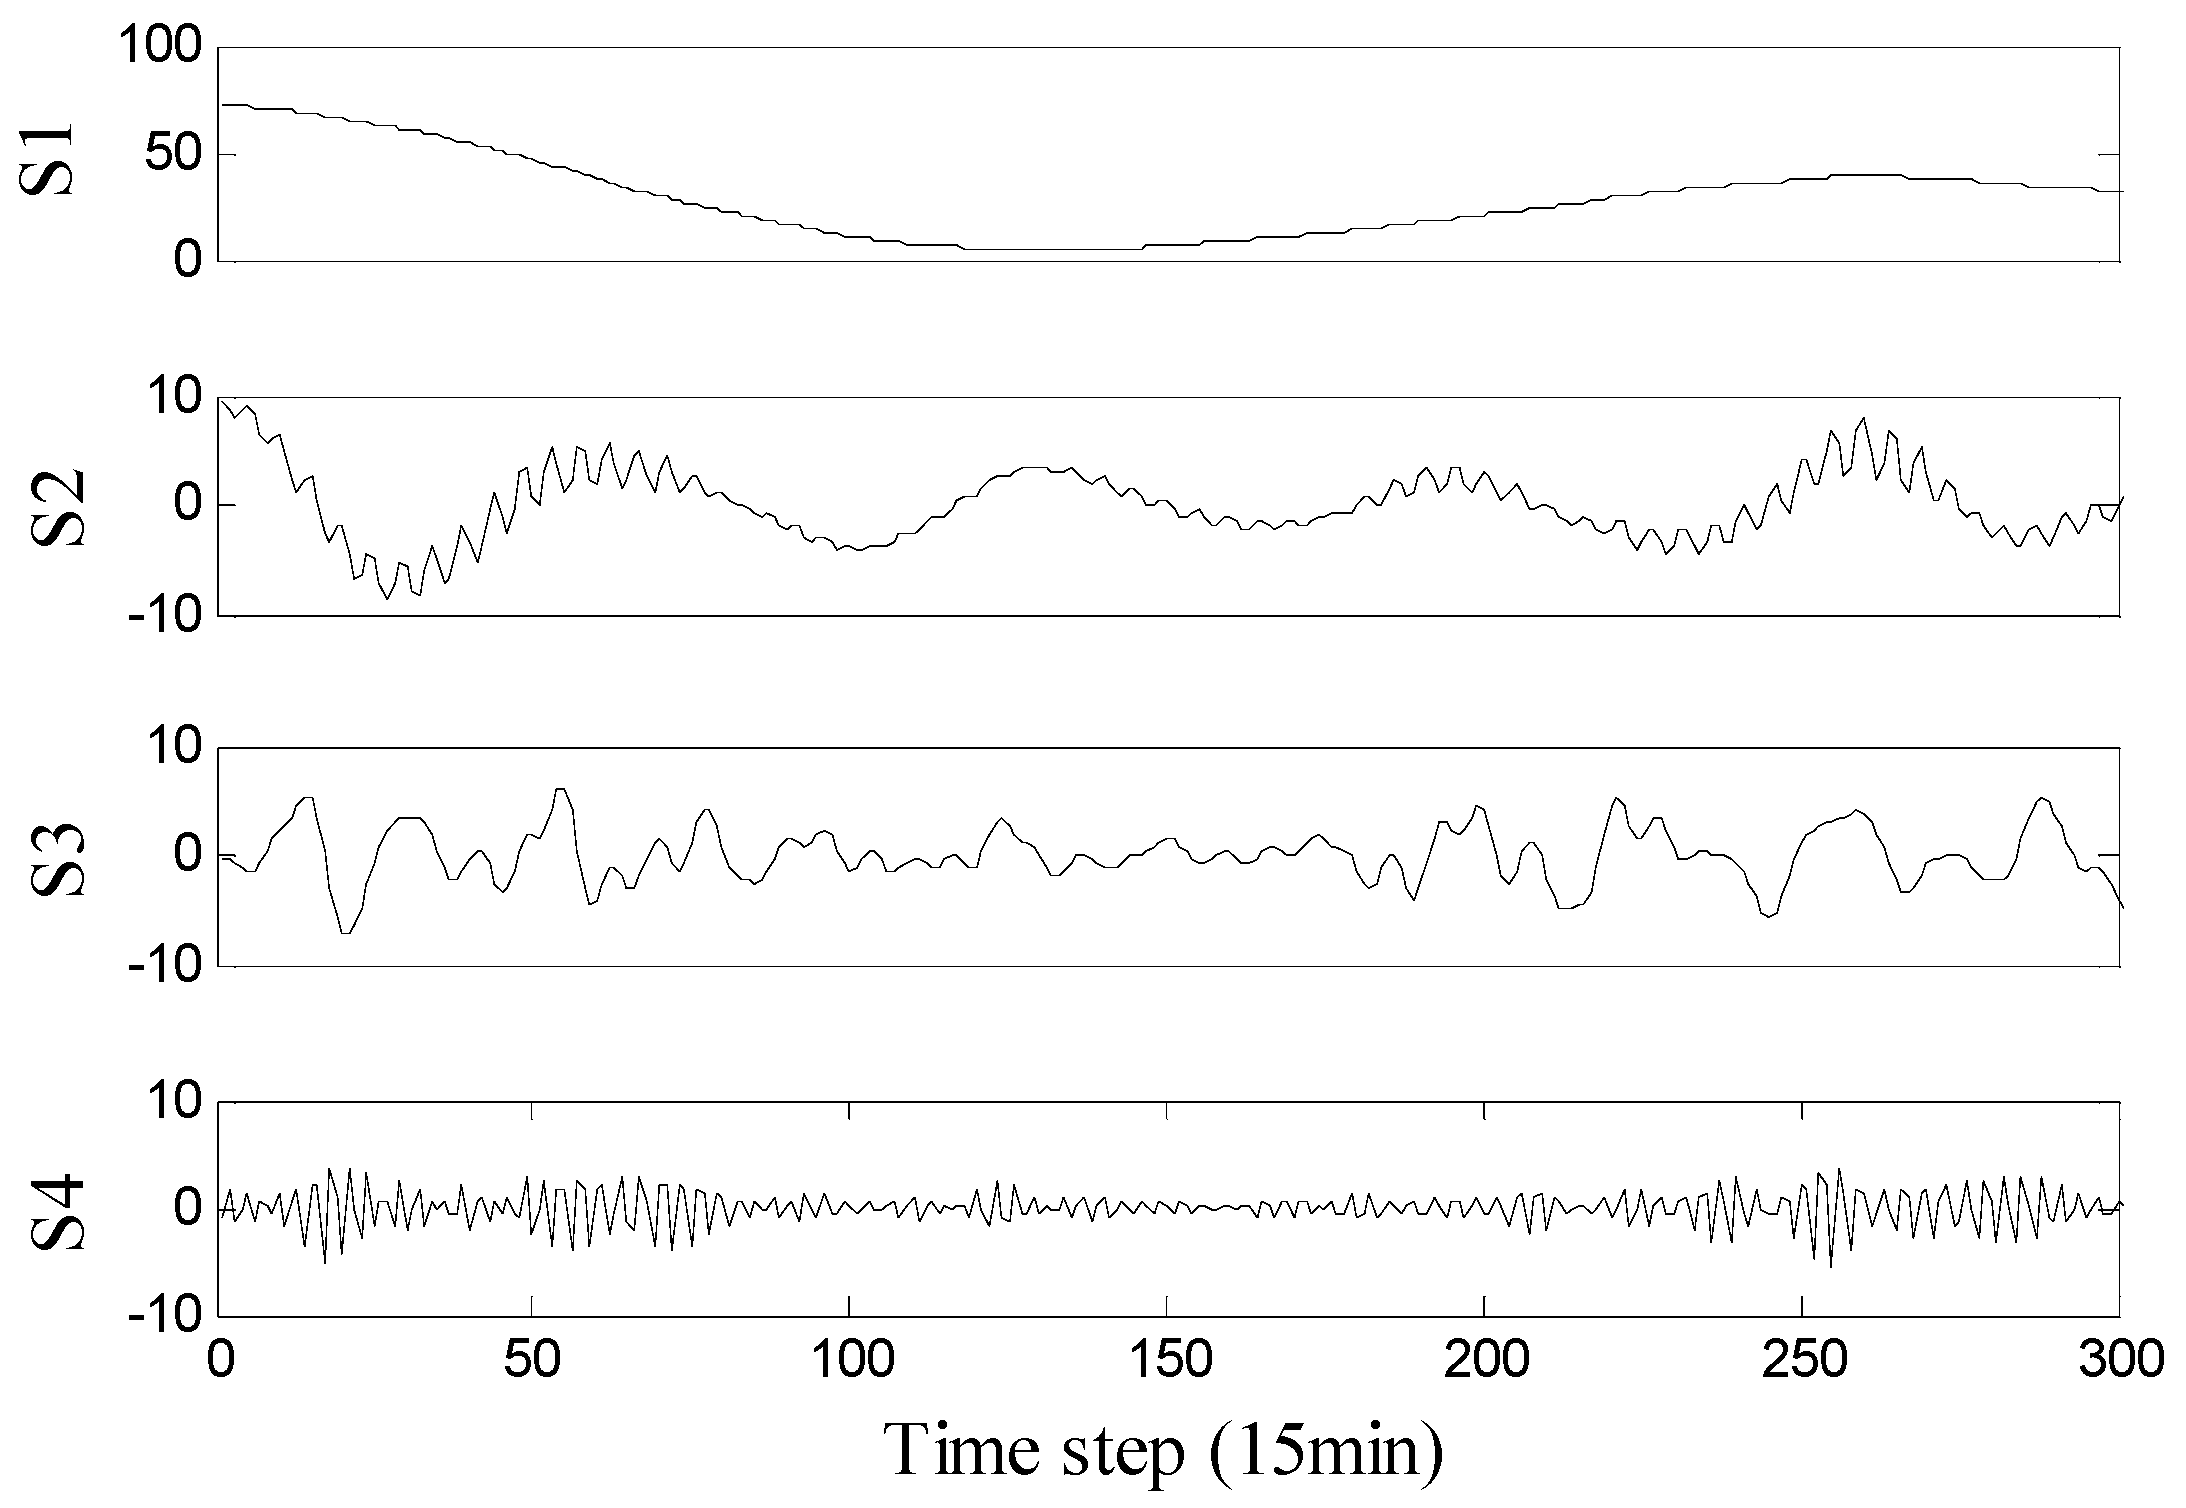
2.1. Variational Mode Decomposition
| Algorithm 1 Process of VMD |
| Initialize , , , |
| repeat |
| for do Update for all : Update : end for Dual ascent for all : |
| until convergence: |
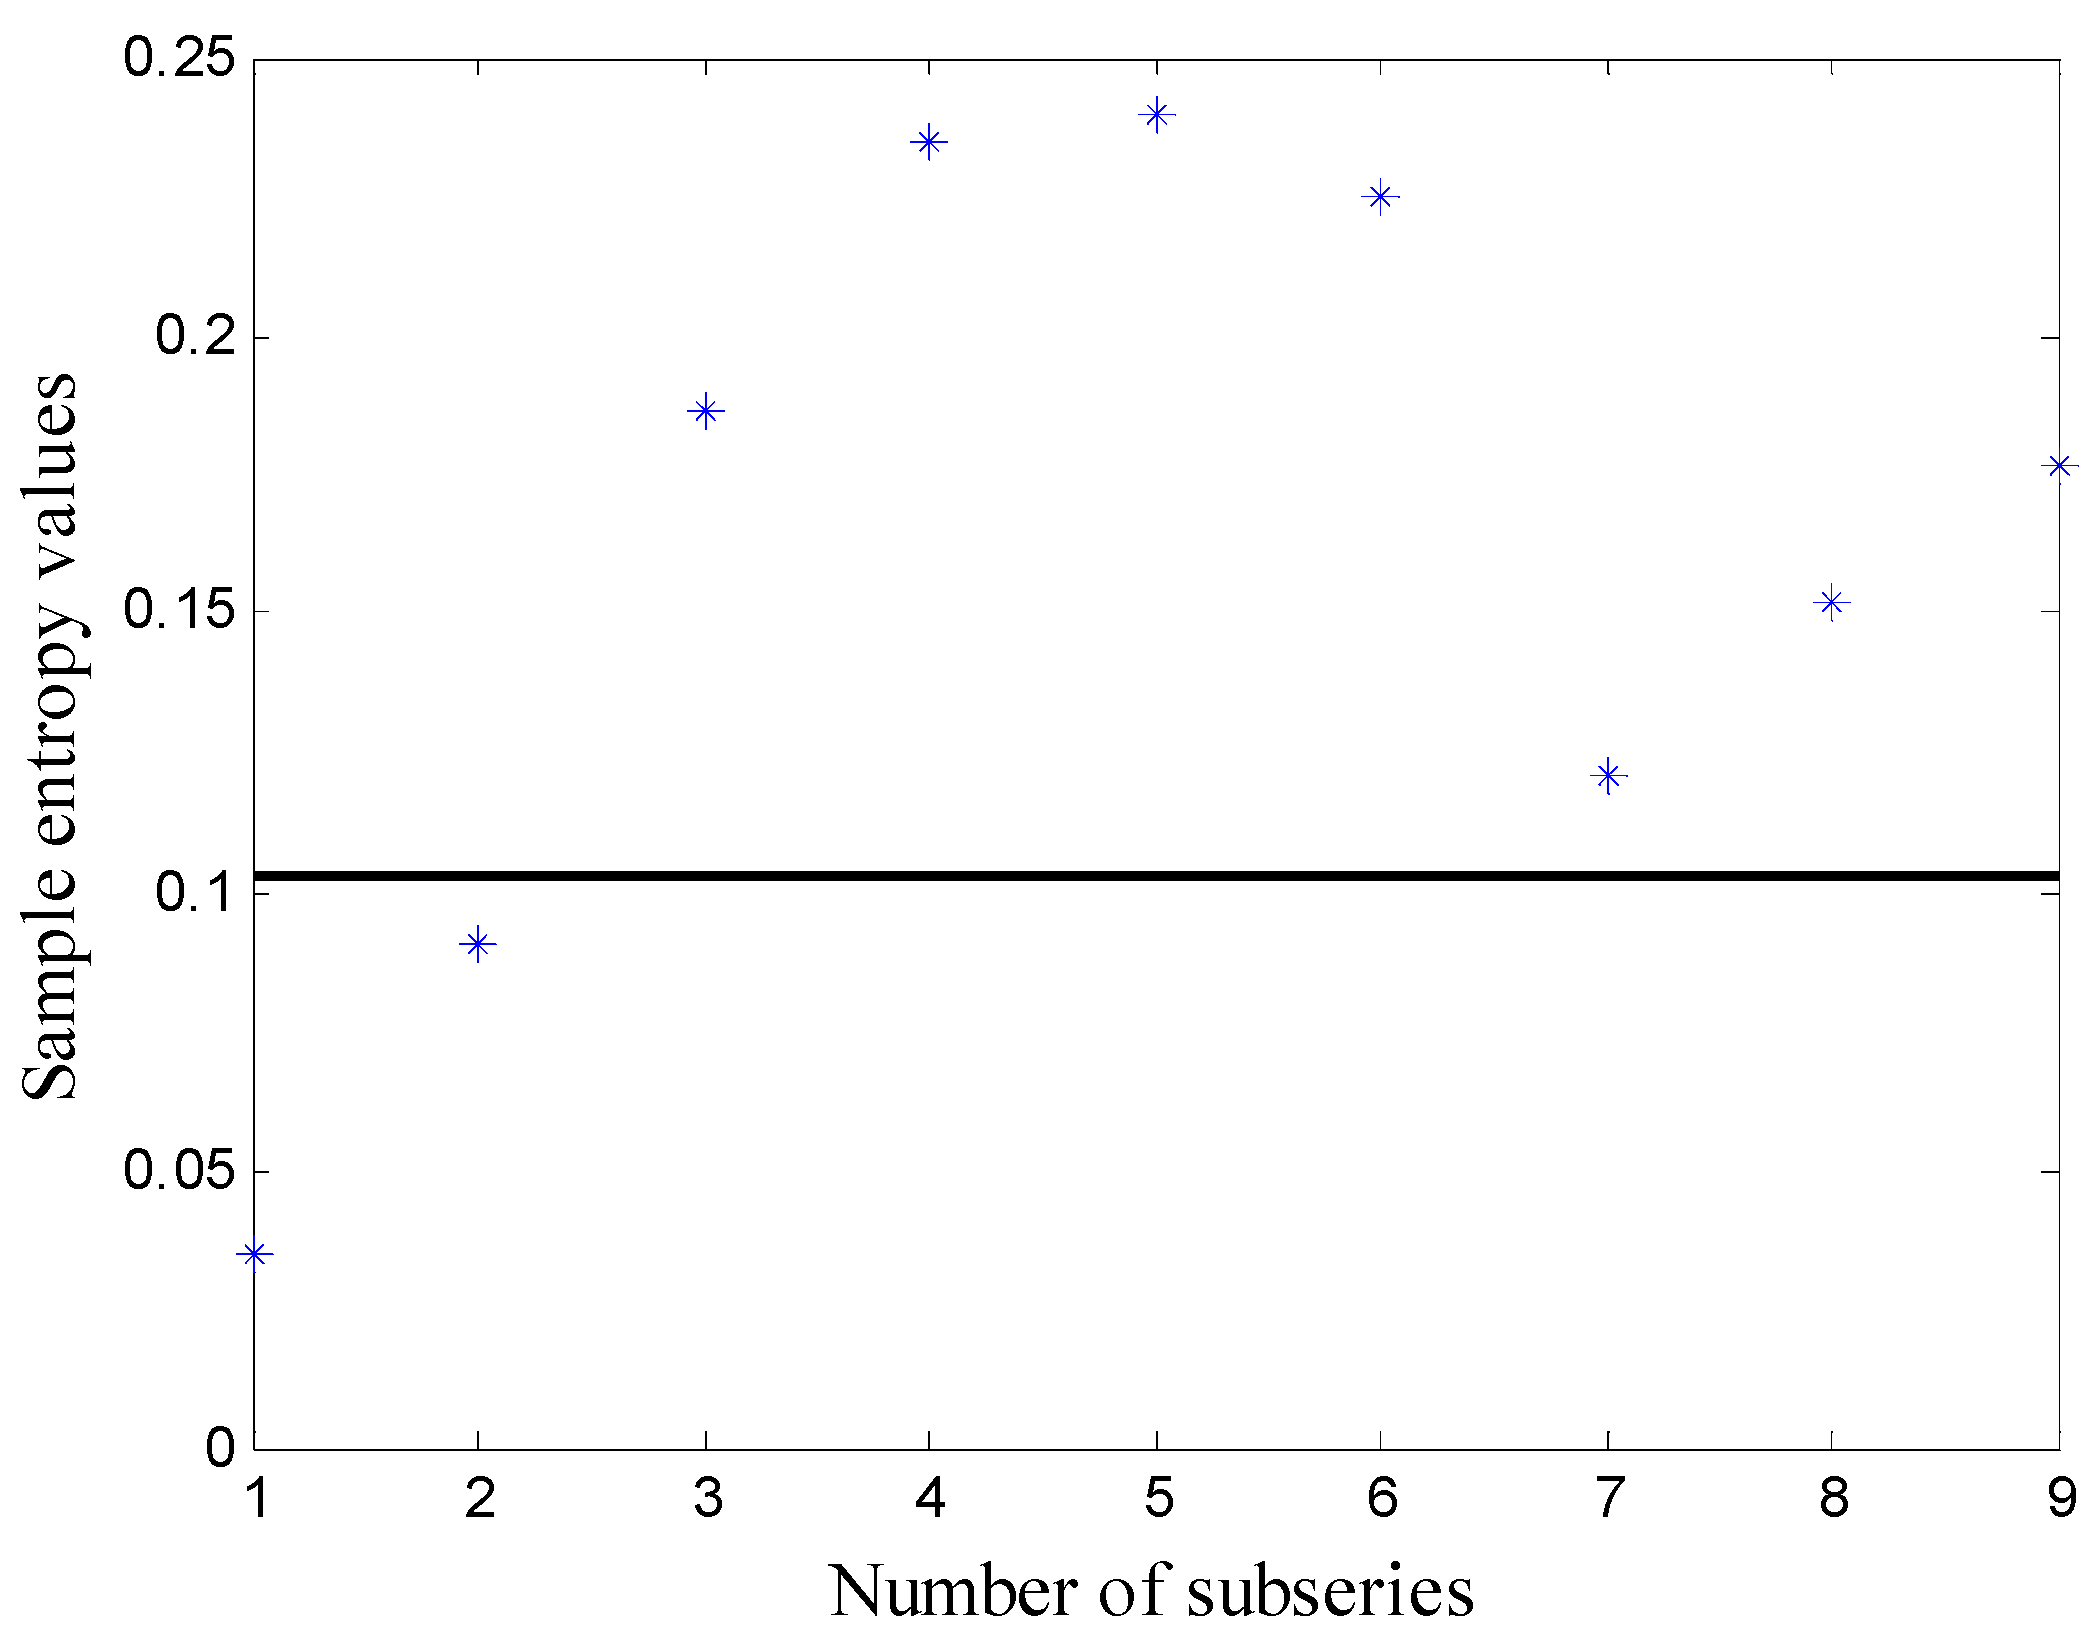
2.2. Sample Entropy
2.3. Kernel Extreme Learning Machine
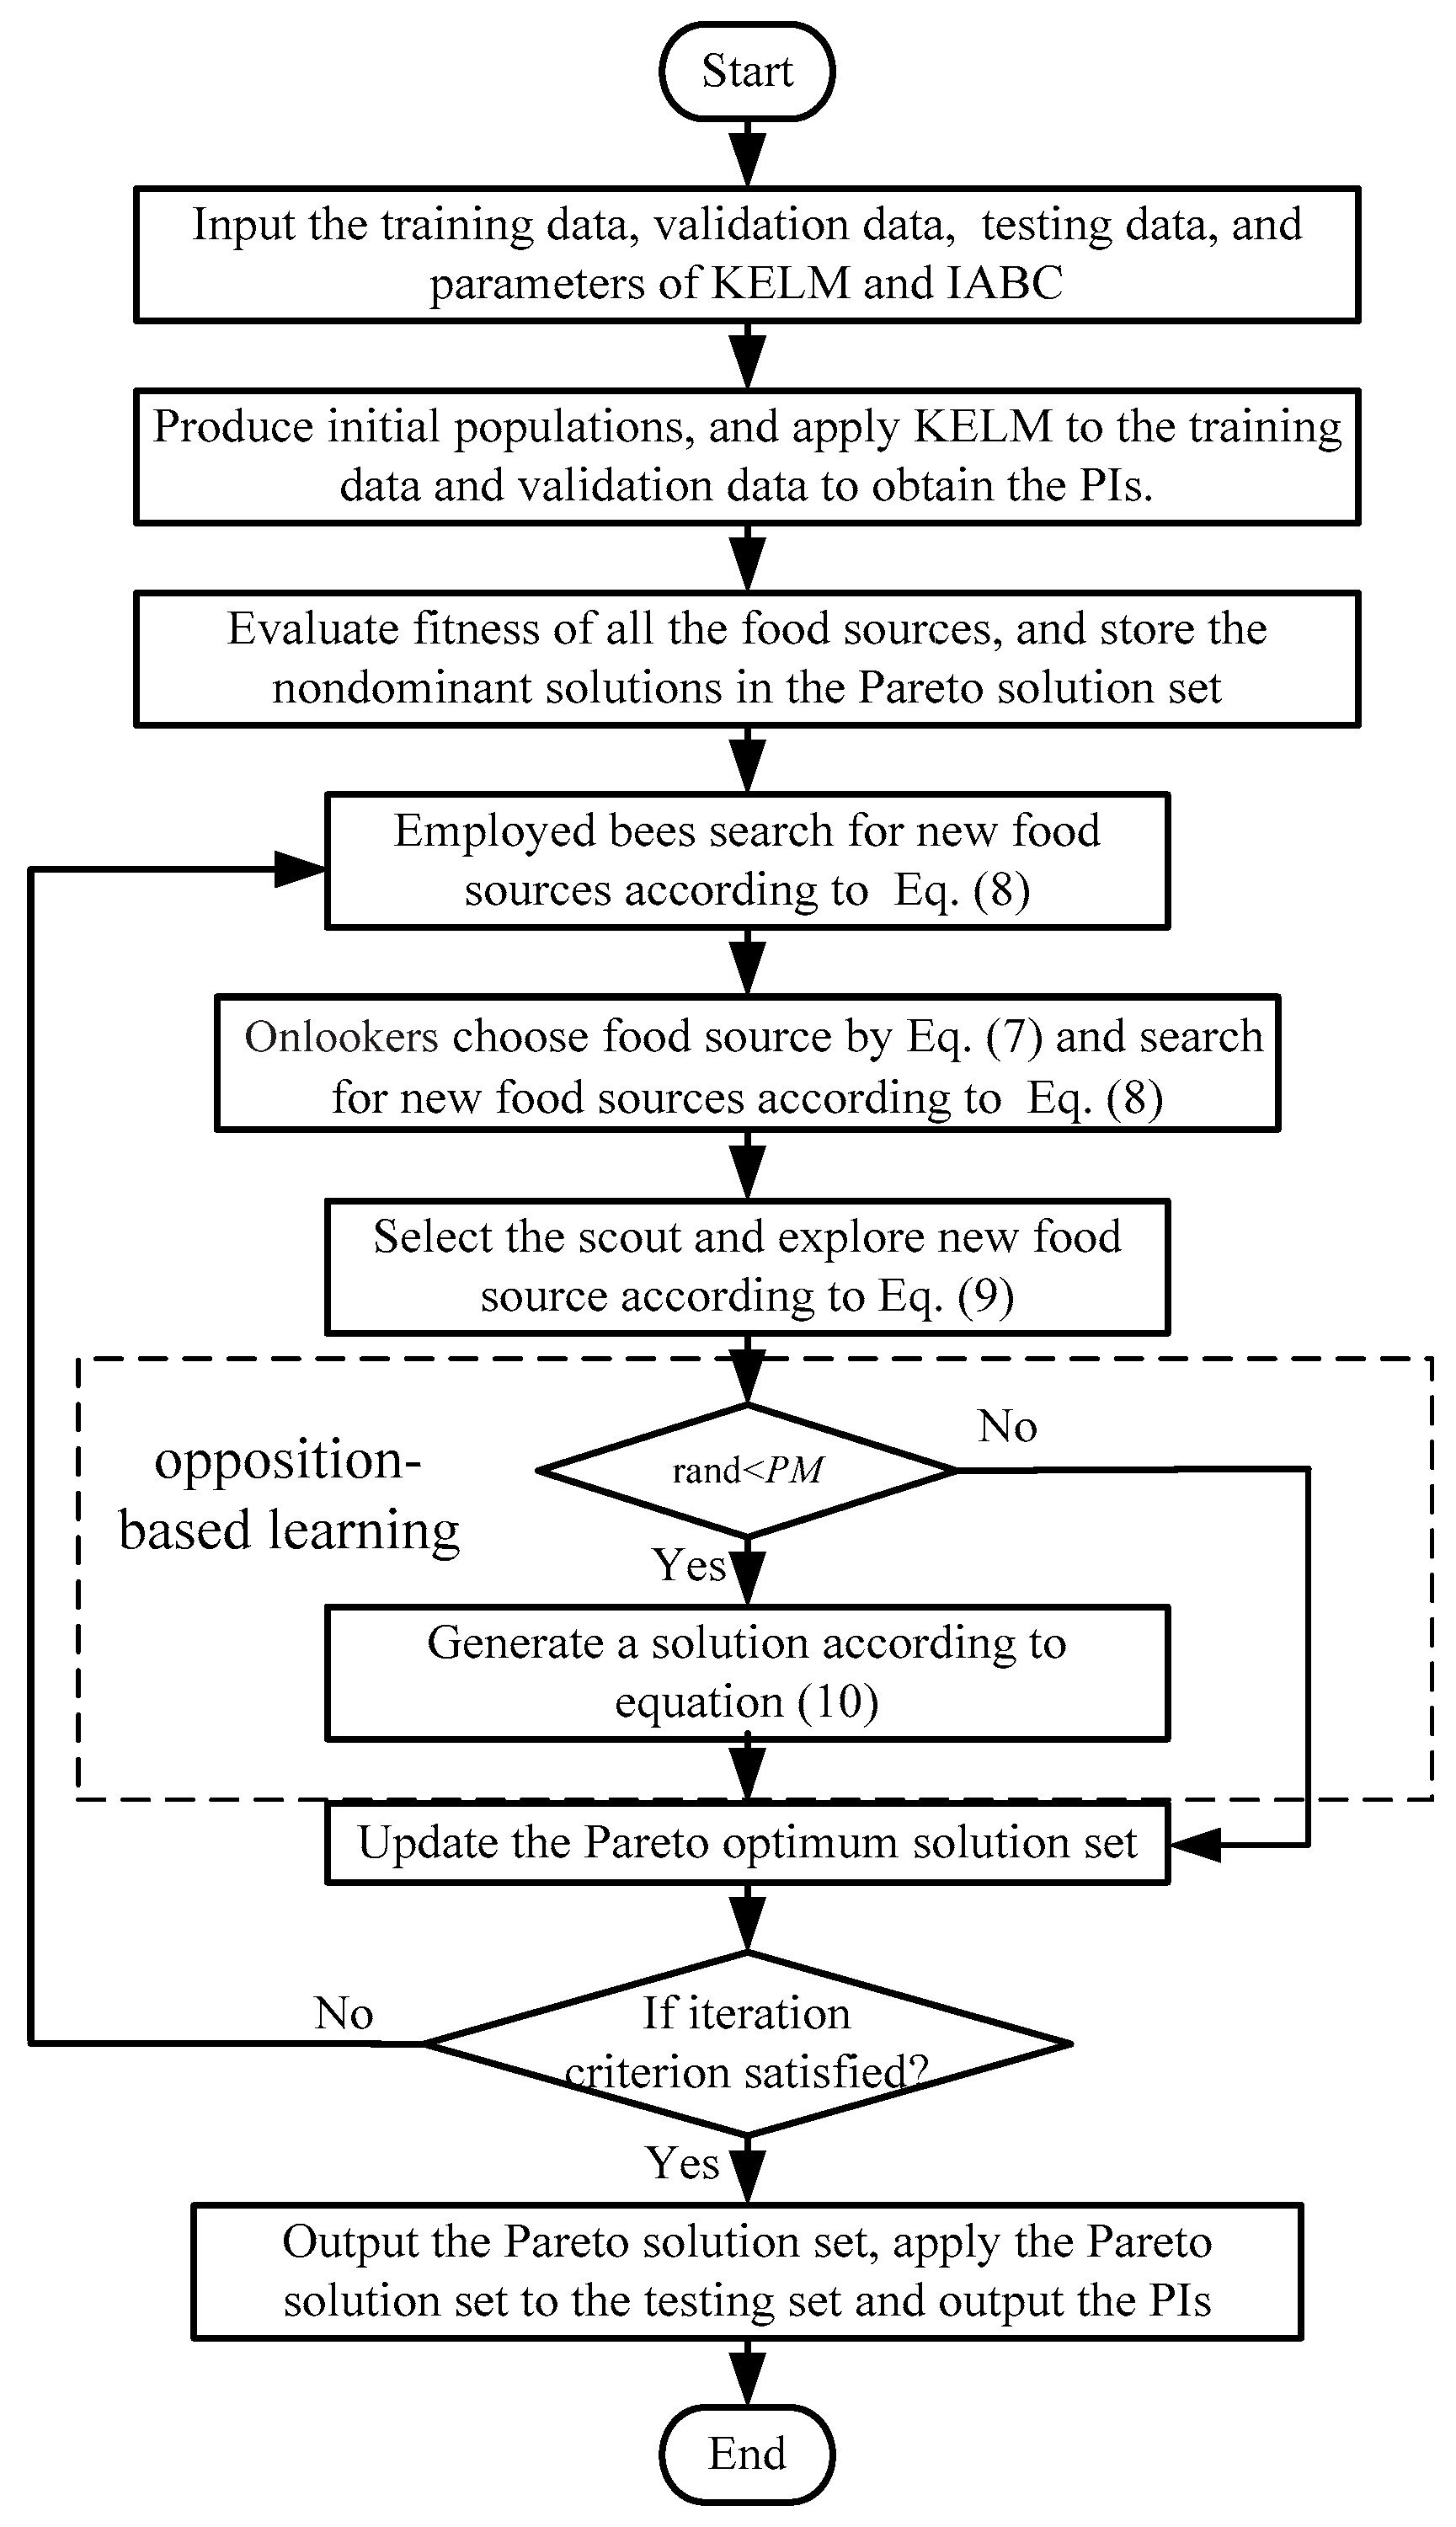
2.4. Artificial Bee Colony Algorithm and Its Modification
3. Construction of Optimal PIs
3.1 Reliability and Sharpness of PIs
- 1
- Prediction interval coverage probability (PICP)where N denotes the number of prediction points, = 1 when the target value in which Li and Ui are the lower and upper bound of each PI, otherwise = 0.
- 2
- Prediction interval normalized average width (PINAW)where R is the range of the target values and is used to normalize the average width of PIs.PICP is used to describe the reliability of the constructed PIs, and PINAW is used to characterize the sharpness of the PIs. However, these two indices are not enough to evaluate the PIs. For example, when the and of two PIs are the same, the optimal PI cannot be judged if the real data are not covered by the PIs and the deviation from the upper bound (or lower bound) is different. Therefore, the normalized average deviation was introduced in this study.
- 3
- Normalized average deviation (NAD)The NAD is used to express the deviation of the data which are not covered by the PI.where the expression of is as follows:
3.2. The Objective Function of PIs
3.3. Prediction Process
4. Numerical Results and Discussions
4.1. Dataset and Parameter Settings
4.2. Numerical Results and Analysis
4.2.1. Comparison of KELM and ELM
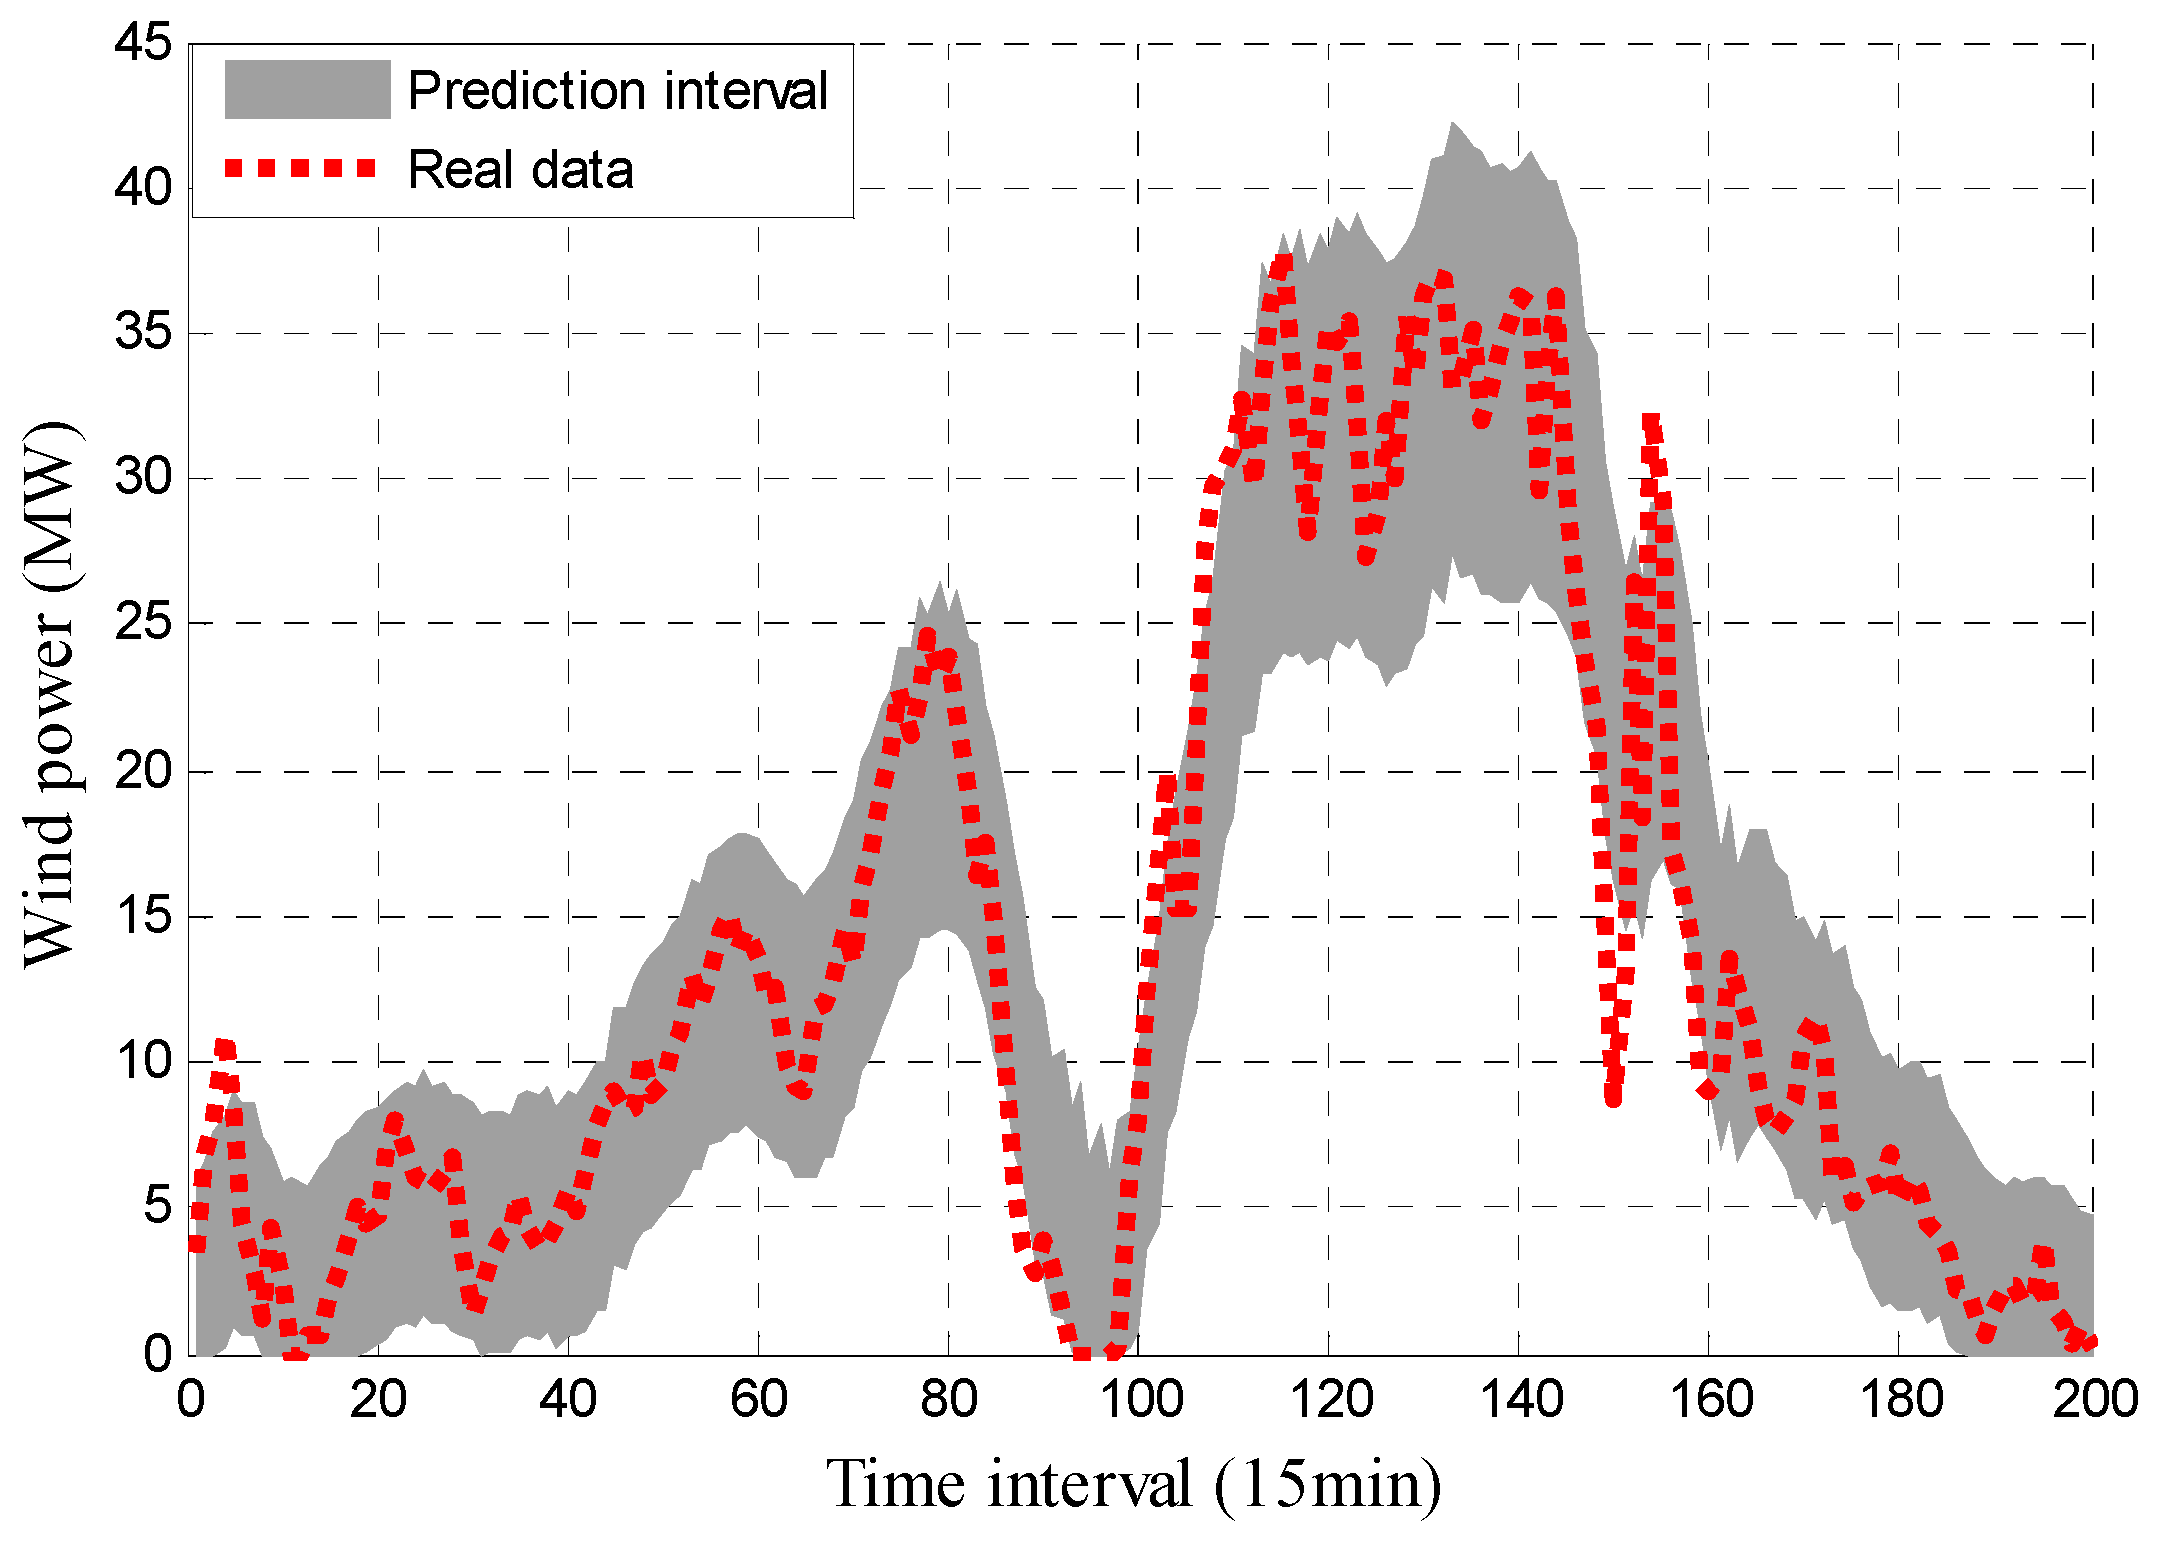
4.2.2. Analysis of Forecasting Results
- 1
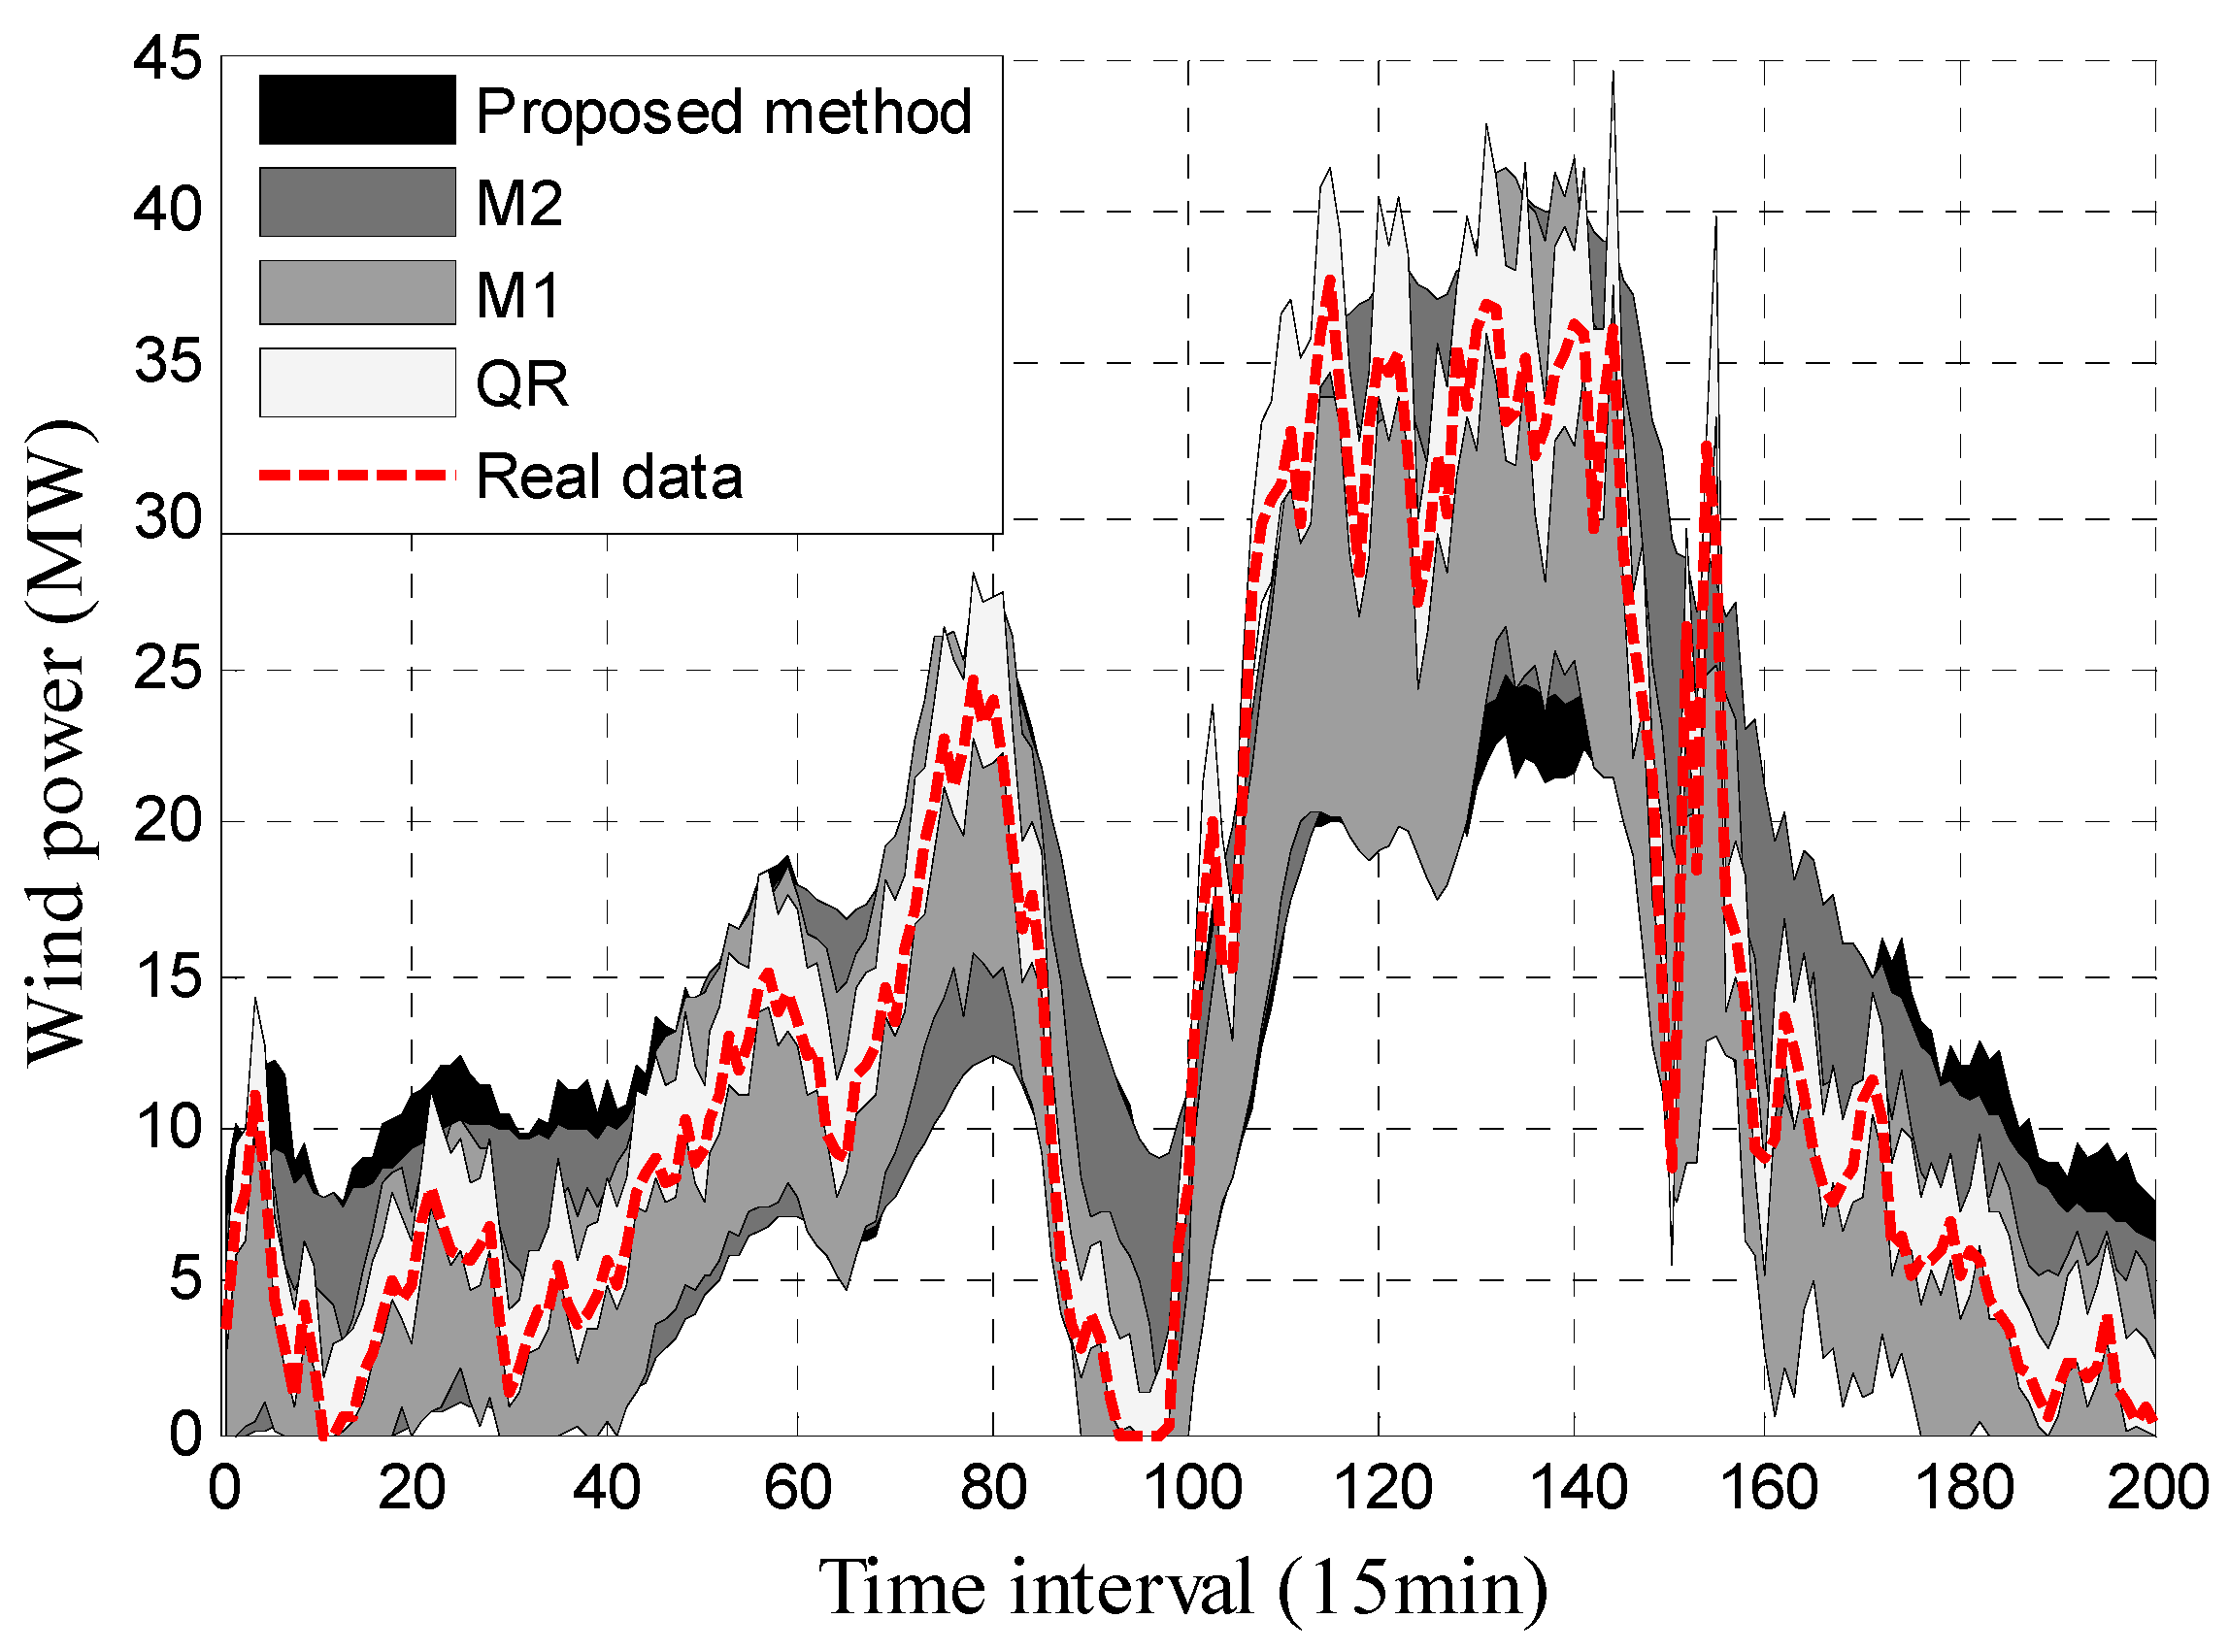
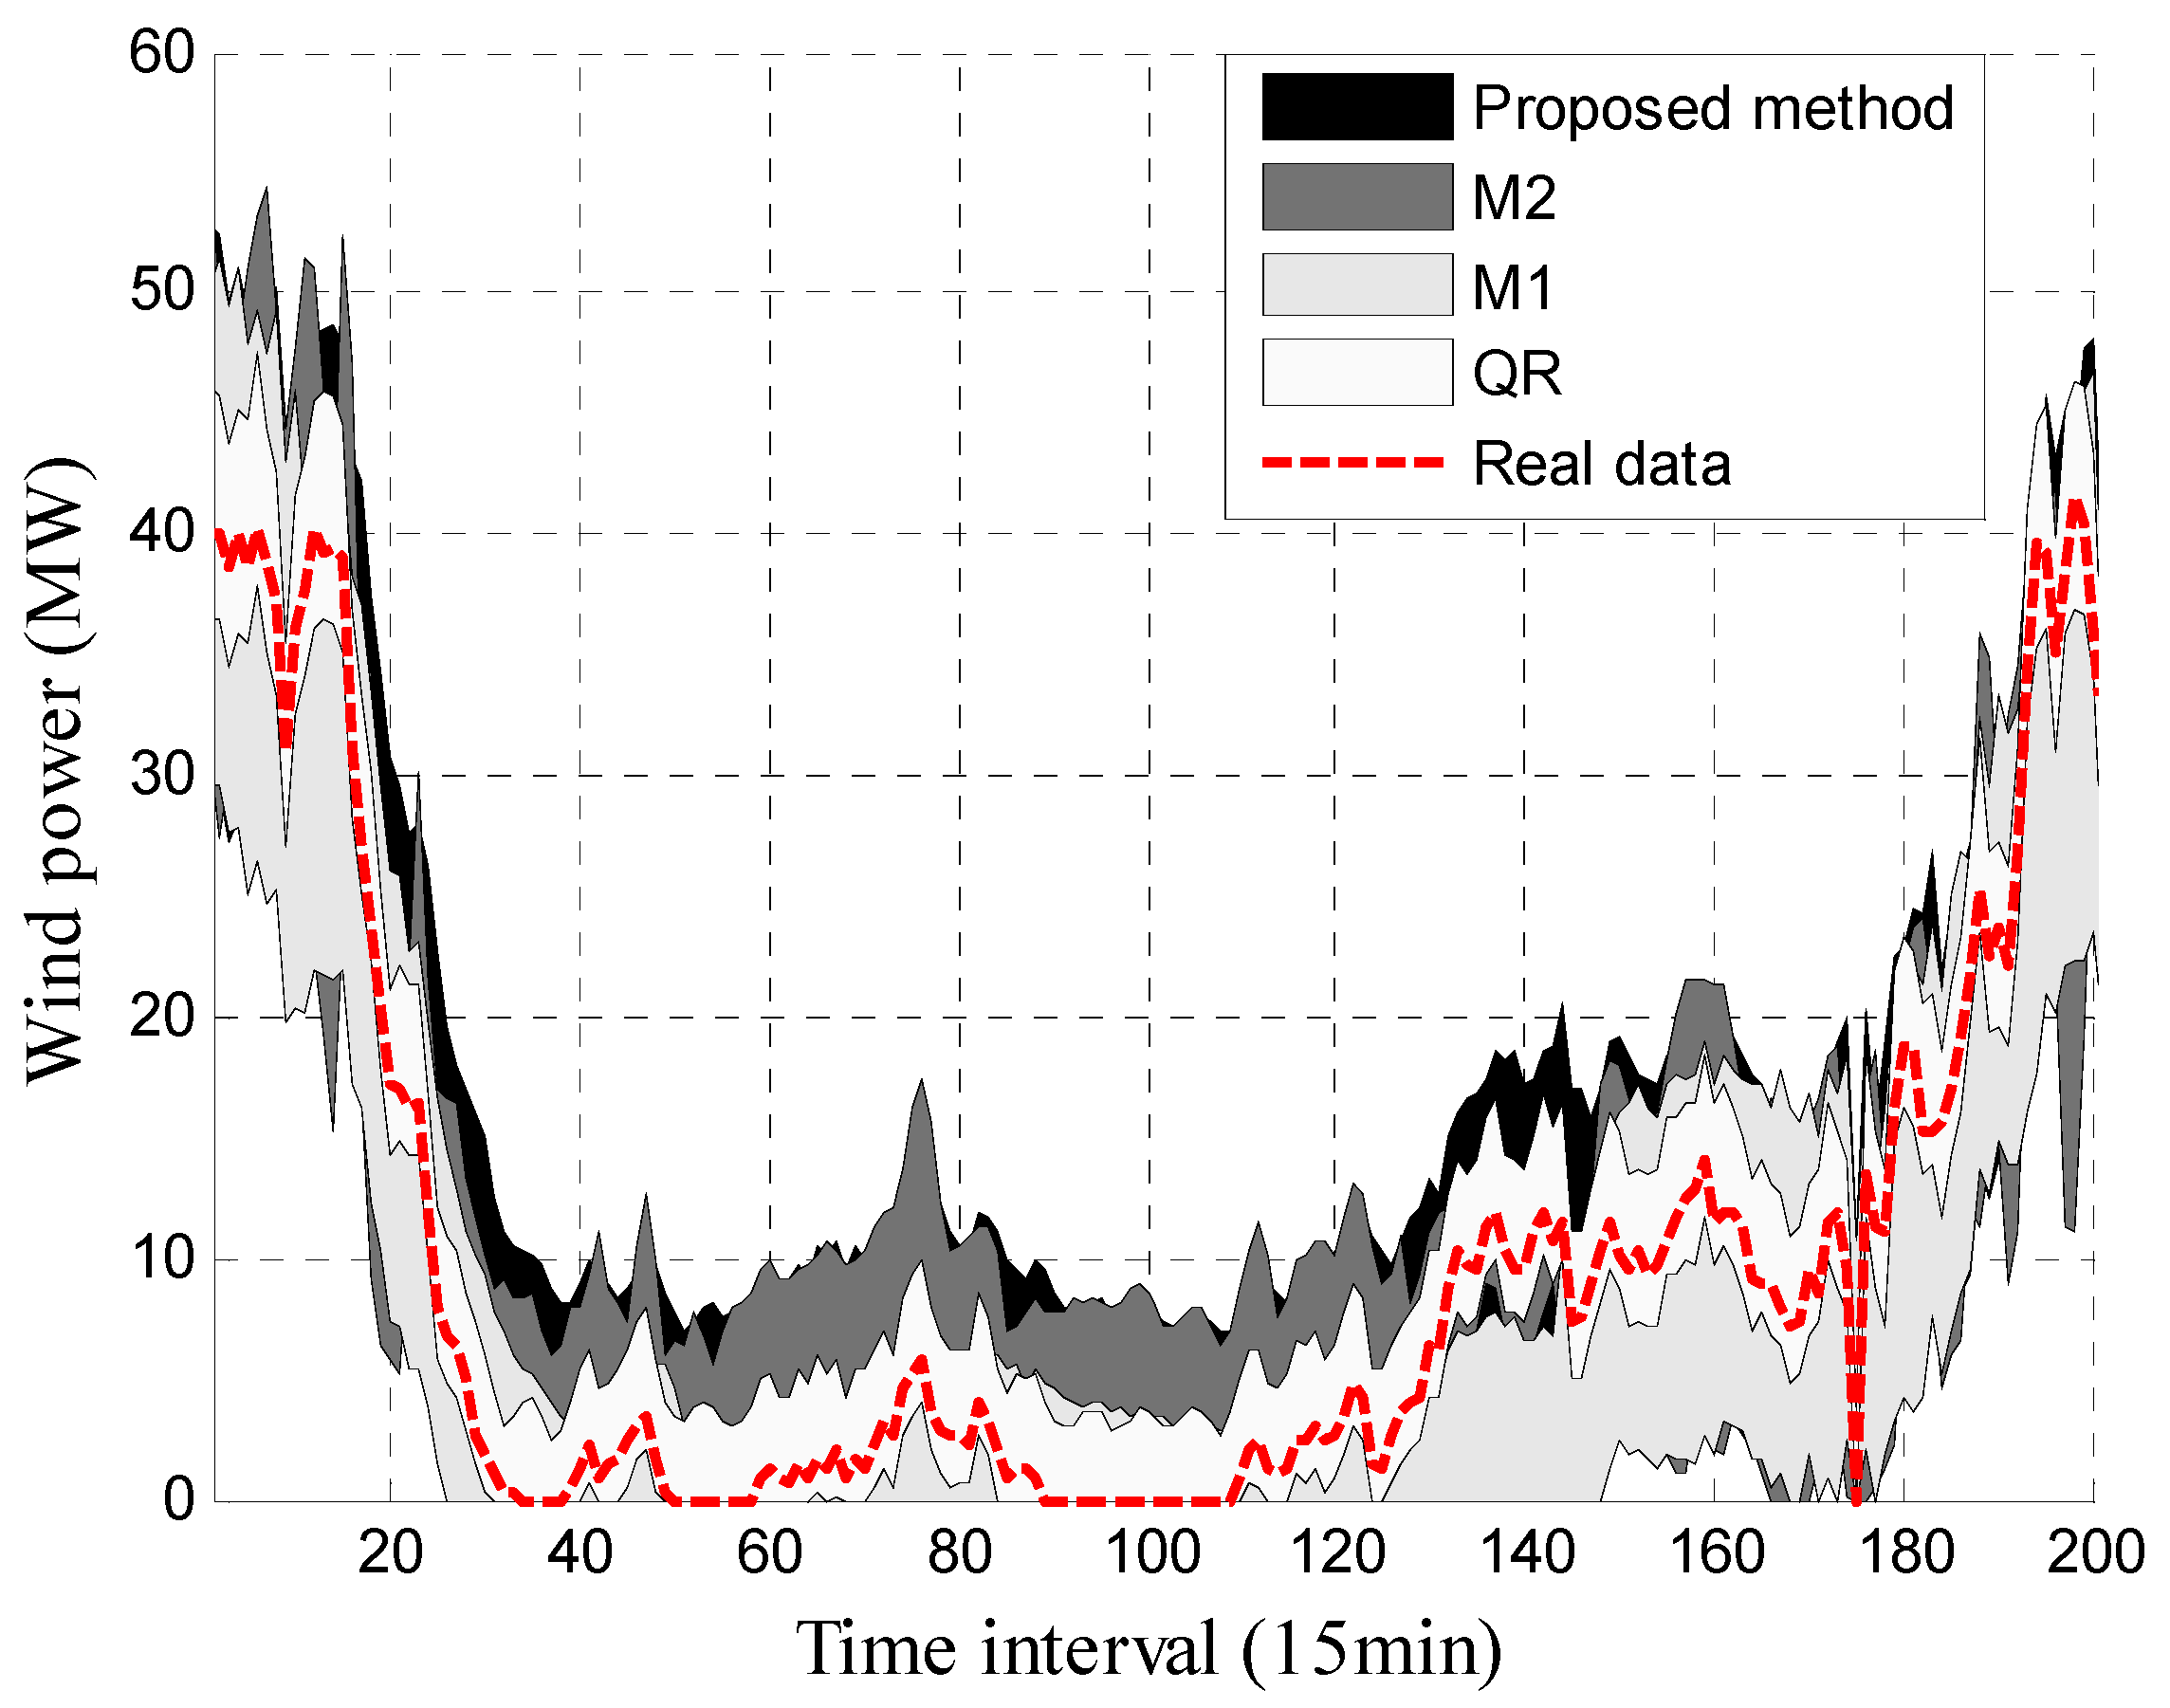
- In terms of the reliability (the closer the PICP is to the PINC, the better), almost all the predicted results of the proposed method, M1 and M2 are closer to 90% than the results of QR. The maximum values of the proposed method, M1, M2 and QR are 92.5%, 92.54%, 92.65% and 100%, respectively, and the minimum values of the proposed method, M1, M2 and QR are 88.25%, 87.5%, 87.54% and 82.72%, respectively. The ACPE values of the proposed method, M1, M2 and QR are 1.514, 1.56, 1.531 and 6.209, respectively, indicating that the overall reliability of the proposed method is comparable to that of M1 or M2, and the performance of the proposed method is slightly better than the other two methods. It can also be deduced that the QR approach has the worst performance as its ACPE value is the biggest.
- 2
- In terms of the PINAW (the smaller the better), the maximum, mean and minimum values of the proposed method are 0.284, 0.217 and 0.116, respectively; the maximum, mean and minimum values of M1 are 0.328, 0.251 and 0.148, respectively; the maximum, mean and minimum values of EEMD are 0.291, 0.225 and 0.132, respectively. From the overall level of view, the proposed method performs the best.
- 3
- In terms of the NAD (the smaller the better), the maximum, mean and minimum values of the proposed method are 0.093, 0.026 and 0.002, respectively; the maximum, mean and minimum values of M1 are 0.187, 0.084 and 0.005, respectively; the maximum, mean and minimum values of M2 are 0.192, 0.11 and 0.035, respectively. It can be concluded that the overall performance of the proposed method is superior to the others.
5. Conclusions
Author Contributions
Conflicts of Interest
References
- Monteiro, C.; Keko, H.; Bessa, R.; Miranda, V.; Botterud, A.; Wang, J.; Conzelmann, G.; Porto, I. A Quick Guide to Wind Power Forecating: State-of-the-Art 2009, Technical report, Argonne National Laboratory. Available online: http://www.dis.anl.gov/pubs/65614.pdf (accessed on 9 January 2017).
- Jung, J.; Broadwater, R.P. Current status and future advances for wind speed and power forecasting. Renew. Sustain. Energy Rev. 2014, 31, 762–777. [Google Scholar] [CrossRef]
- Croonenbroeck, C.; Ambach, D. A selection of time series models for short- to medium-term wind power forecasting. J. Wind Eng. Ind. Aerodyn. 2015, 136, 201–210. [Google Scholar] [CrossRef]
- Zhang, G.; Wu, Y.; Wong, K.P.; Xu, Z.; Dong, Z.Y.; Iu, H.H. An advanced approach for construction of optimal wind power prediction intervals. IEEE Trans. Power Syst. 2015, 30, 2706–2715. [Google Scholar] [CrossRef]
- Hodge, B.M.; Milligan, M. Wind power forecasting error distributions over multiple timescales. In Proceedings of the IEEE Power and Energy Society General Meeting, Detroit, MI, USA, 24–29 July 2011. [Google Scholar]
- Haque, A.U.; Nehrir, M.H.; Mandal, P. A hybrid intelligent model for deterministic and quantile regression approach for probabilistic wind power forecasting. IEEE Trans. Power Syst. 2014, 29, 1663–1672. [Google Scholar] [CrossRef]
- Bessa, R.J.; Miranda, V.; Botterud, A.; Zhou, Z.; Wang, J. Time-adaptive quantile-copula for wind power probabilistic forecasting. Renew. Energy 2012, 40, 29–39. [Google Scholar] [CrossRef]
- Kou, P.; Gao, F.; Guan, X.; Wu, J. Prediction Intervals for wind power forecasting: Using sparse warped gaussian process. In Proceedings of the IEEE Power and Energy Society General Meeting, San Diego, CA, USA, 22–26 July 2012. [Google Scholar]
- Yan, J.; Li, K.; Bai, E.; Deng, J.; Foley, A.M. Hybrid Probabilistic Wind Power Forecasting Using Temporally Local Gaussian Process. IEEE Trans. Sustain. Energy 2015, 7, 1–9. [Google Scholar] [CrossRef]
- Khosravi, A.; Nahavandi, S.; Creighton, D. A neural network-GARCH-based method for construction of Prediction Intervals. Electr. Power Syst. Res. 2013, 96, 185–193. [Google Scholar] [CrossRef]
- Pinson, P.; Tastu, J. Discussion of “Prediction intervals for short-term wind farm generation forecasts” and “Combined nonparametric prediction intervals for wind power generation”. IEEE Trans. Sustain. Energy 2014, 5, 1019–1020. [Google Scholar] [CrossRef]
- Gneiting, T.; Raftery, A.E. Strictly Proper Scoring Rules, Prediction, and Estimation. J. Am. Stat. Assoc. 2007, 102, 359–378. [Google Scholar] [CrossRef]
- Wan, C.; Xu, Z.; Pinson, P.; Dong, Z.Y.; Wong, K.P. Optimal Prediction Intervals of Wind Power Generation. IEEE Trans. Power Syst. 2014, 29, 1166–1174. [Google Scholar] [CrossRef]
- Hou, Z.J.; Etingov, P.V.; Makarov, Y.V.; Samaan, N.A. Uncertainty Reduction in Power Generation Forecast Using Coupled Wavelet-ARIMA. In Proceedings of the IEEE PES General Meeting | Conference & Exposition, National Harbor, MD, USA, 27–31 July 2014. [Google Scholar]
- Zhang, Y.; Liu, K.; Qin, L.; An, X. Deterministic and probabilistic interval prediction for short-term wind power generation based on variational mode decomposition and machine learning methods. Energy Convers. Manag. 2016, 112, 208–219. [Google Scholar] [CrossRef]
- Quan, H.; Srinivasan, D.; Khosravi, A. Short-term load and wind power forecasting using neural network-based prediction intervals. IEEE Trans. Neural Netw. Learn. Syst. 2014, 25, 303–315. [Google Scholar] [CrossRef] [PubMed]
- Wan, C.; Xu, Z.; Pinson, P.; Dong, Z.Y.; Wong, K.P. Probabilistic forecasting of wind power generation using extreme learning machine. IEEE Trans. Power Syst. 2014, 29, 1033–1044. [Google Scholar] [CrossRef]
- Huang, G.B. An Insight into Extreme Learning Machines: Random Neurons, Random Features and Kernels. Cogn. Comput. 2014, 6, 376–390. [Google Scholar] [CrossRef]
- Dragomiretskiy, K.; Zosso, D. Variational mode decomposition. IEEE Trans. Signal Process. 2014, 62, 531–544. [Google Scholar] [CrossRef]
- Jiang, Y.; Mao, D.; Xu, Y. A fast algorithm for computing sample entropy. Adv. Adapt. Data Anal. 2011, 03, 167–186. [Google Scholar] [CrossRef]
- Karaboga, D.; Basturk, B. On the performance of artificial bee colony (ABC) algorithm. Appl. Soft Comput. 2008, 8, 687–697. [Google Scholar] [CrossRef]
- Bi, X.; Wang, Y. An improved artificial bee colony algorithm. In Proceedings of the International Conference on Computer Research and Development, Shanghai, China, 11–13 March 2011; pp. 174–177. [Google Scholar]
- Pinson, P.; Nielsen, H.A.; Møller, J.K.; Madsen, H.; Kariniotakis, G.N. Non-parametric probabilistic forecasts of wind power: Required properties and evaluation. Wind Energy 2007, 10, 497–516. [Google Scholar] [CrossRef]
- Kavousi-Fard, A.; Khosravi, A.; Nahavandi, S. A new fuzzy-based combined prediction interval for wind power forecasting. IEEE Trans. Power Syst. 2015, 31, 18–26. [Google Scholar] [CrossRef]
- Wan, C.; Niu, M.; Song, Y.; Xu, Z. Pareto optimal prediction intervals of electricity price. IEEE Trans. Power Syst. 2016, 32, 817–819. [Google Scholar] [CrossRef]
- Asrari, A.; Lotfifard, S.; Payam, M.S. Pareto dominance-based multiobjective optimization method for distribution network reconfiguration. IEEE Trans. Smart Grid 2015, 7, 1401–1410. [Google Scholar] [CrossRef]
- Chen, W. On the Problem and Elimination of Rank Reversal in the Application of TOPSIS Method. Oper. Res. Manag. Sci. 2005, 14, 39–43. [Google Scholar]
- Huang, N.; Yuan, C.; Cai, G.; Xing, E. Hybrid Short Term Wind Speed Forecasting Using Variational Mode Decomposition and a Weighted Regularized Extreme Learning Machine. Energies 2016, 9, 989. [Google Scholar] [CrossRef]
- Sun, G.; Chen, T.; Wei, Z.; Sun, Y.; Zang, H.; Chen, S. A Carbon Price Forecasting Model Based on Variational Mode Decomposition and Spiking Neural Networks. Energies 2016, 9, 54. [Google Scholar] [CrossRef]


| Number | ELM | KELM | ||||
|---|---|---|---|---|---|---|
| IPICP | IPINAW | INAD | IPICP | IPINAW | INAD | |
| 1 | 92 | 0.195 | 0.188 | 89.5 | 0.164 | 0.187 |
| 2 | 91.5 | 0.188 | 0.191 | 90.25 | 0.152 | 0.175 |
| 3 | 94.25 | 0.208 | 0.178 | 90.75 | 0.171 | 0.183 |
| 4 | 91.25 | 0.194 | 0.193 | 91.75 | 0.191 | 0.176 |
| 5 | 97.25 | 0.245 | 0.111 | 90.5 | 0.166 | 0.182 |
| 6 | 99 | 0.208 | 0.196 | 91.25 | 0.165 | 0.187 |
| 7 | 96.25 | 0.199 | 0.187 | 89.75 | 0.169 | 0.132 |
| 8 | 99.75 | 0.247 | 0.006 | 92 | 0.161 | 0.187 |
| 9 | 91.25 | 0.198 | 0.187 | 91.5 | 0.195 | 0.171 |
| 10 | 92.25 | 0.21 | 0.178 | 91.75 | 0.171 | 0.179 |
| Mean | 94.475 | 0.209 | 0.1615 | 90.9 | 0.171 | 0.176 |
| Std | 3.332 | 0.021 | 0.06 | 0.883 | 0.013 | 0.016 |
| Month | QR | M1 | M2 | Proposed Method | ||||||||
|---|---|---|---|---|---|---|---|---|---|---|---|---|
| IPICP | IPINAW | INAD | IPICP | IPINAW | INAD | IPICP | IPINAW | INAD | IPICP | IPINAW | INAD | |
| Jan. | 98.23 | 0.083 | 0.005 | 89.75 | 0.161 | 0.086 | 90.71 | 0.181 | 0.062 | 91.25 | 0.193 | 0.048 |
| Feb. | 96.75 | 0.115 | 0.011 | 92.23 | 0.271 | 0.086 | 92.5 | 0.251 | 0.192 | 88.36 | 0.25 | 0.002 |
| Mar. | 100 | 0.121 | 0 | 89.15 | 0.283 | 0.155 | 90.58 | 0.232 | 0.038 | 90.5 | 0.223 | 0.021 |
| Apr. | 82.72 | 0.079 | 0.002 | 91.52 | 0.19 | 0.061 | 87.54 | 0.179 | 0.13 | 91.75 | 0.154 | 0.003 |
| May | 79.75 | 0.101 | 0.001 | 88.75 | 0.26 | 0.187 | 88.3 | 0.215 | 0.101 | 88.25 | 0.216 | 0.012 |
| Jun. | 87.28 | 0.072 | 0.02 | 92.54 | 0.148 | 0.042 | 92.65 | 0.132 | 0.179 | 92.25 | 0.116 | 0.093 |
| Jul. | 90 | 0.086 | 0.049 | 89.35 | 0.209 | 0.022 | 89.5 | 0.221 | 0.161 | 90.5 | 0.205 | 0.02 |
| Aug. | 99 | 0.137 | 0 | 92.33 | 0.328 | 0.005 | 91.97 | 0.291 | 0.035 | 91.75 | 0.284 | 0.003 |
| Sep. | 98.74 | 0.135 | 0 | 88.25 | 0.322 | 0.147 | 91.95 | 0.233 | 0.15 | 91.78 | 0.223 | 0.042 |
| Oct. | 95.25 | 0.095 | 0.003 | 88.73 | 0.235 | 0.057 | 88.75 | 0.227 | 0.065 | 90.25 | 0.214 | 0.009 |
| Nov. | 92.76 | 0.149 | 0.033 | 87.5 | 0.276 | 0.107 | 89.26 | 0.259 | 0.057 | 92.5 | 0.249 | 0.05 |
| Dec. | 93.53 | 0.151 | 0.072 | 91.58 | 0.324 | 0.049 | 88.64 | 0.275 | 0.154 | 92.25 | 0.272 | 0.011 |
| Mean | 92.834 | 0.11 | 0.016 | 90.14 | 0.251 | 0.084 | 90.196 | 0.225 | 0.11 | 90.949 | 0.217 | 0.026 |
| ACPE | 6.209 | / | / | 1.56 | / | / | 1.531 | / | / | 1.514 | / | / |
| Season | QR | M1 | M2 | Proposed Method | ||||||||
|---|---|---|---|---|---|---|---|---|---|---|---|---|
| IPICP | IPINAW | INAD | IPICP | IPINAW | INAD | IPICP | IPINAW | INAD | IPICP | IPINAW | INAD | |
| Summer | 94.3 | 0.097 | 0.002 | 93.54 | 0.175 | 0.182 | 93.53 | 0.23 | 0.003 | 91.75 | 0.224 | 0.004 |
| Autumn | 99.8 | 0.151 | 0 | 88.3 | 0.266 | 0.004 | 88.65 | 0.167 | 0.001 | 89.75 | 0.156 | 0 |
| Winter | 99.3 | 0.09 | 0 | 87.28 | 0.208 | 0.14 | 93.27 | 0.21 | 0.033 | 93.25 | 0.216 | 0.016 |
| Spring | 99.5 | 0.049 | 0 | 92.75 | 0.105 | 0.01 | 89.72 | 0.11 | 0.032 | 88.25 | 0.107 | 0.001 |
| Mean | 98.225 | 0.097 | 0.001 | 90.468 | 0.189 | 0.084 | 91.293 | 0.179 | 0.017 | 90.75 | 0.176 | 0.005 |
| ACPE | 8.225 | / | / | 2.678 | / | / | 2.108 | / | / | 1.75 | / | / |
| Season | QR | M1 | M2 | Proposed Method | ||||||||
|---|---|---|---|---|---|---|---|---|---|---|---|---|
| IPICP | IPINAW | INAD | IPICP | IPINAW | INAD | IPICP | IPINAW | INAD | IPICP | IPINAW | INAD | |
| Summer | 88.2 | 0.098 | 0.124 | 87.28 | 0.208 | 0.102 | 88.79 | 0.207 | 0.111 | 88.59 | 0.226 | 0.008 |
| Autumn | 99.56 | 0.151 | 0 | 91.05 | 0.387 | 0.016 | 91.23 | 0.358 | 0.007 | 91.25 | 0.349 | 0.004 |
| Winter | 95.22 | 0.091 | 0.002 | 90.51 | 0.221 | 0.016 | 89.25 | 0.217 | 0.08 | 89.7 | 0.214 | 0.012 |
| Spring | 90.75 | 0.05 | 0.101 | 92.3 | 0.102 | 0.025 | 93.75 | 0.114 | 0.013 | 92.25 | 0.106 | 0.015 |
| Mean | 93.433 | 0.098 | 0.057 | 90.285 | 0.23 | 0.04 | 90.755 | 0.224 | 0.053 | 90.448 | 0.224 | 0.01 |
| ACPE | 4.333 | / | / | 1.645 | / | / | 1.735 | / | / | 1.303 | / | / |
| Season | QR | M1 | M2 | Proposed Method | ||||||||
|---|---|---|---|---|---|---|---|---|---|---|---|---|
| IPICP | IPINAW | INAD | IPICP | IPINAW | INAD | IPICP | IPINAW | INAD | IPICP | IPINAW | INAD | |
| Summer | 84.71 | 0.199 | 0.015 | 92.91 | 0.209 | 0.083 | 92.88 | 0.244 | 0.097 | 92.85 | 0.239 | 0.004 |
| Autumn | 91.73 | 0.153 | 0.005 | 91.23 | 0.37 | 0.014 | 92.5 | 0.37 | 0.016 | 90.98 | 0.356 | 0.001 |
| Winter | 83.46 | 0.121 | 0.025 | 87.44 | 0.222 | 0.056 | 88.7 | 0.205 | 0.101 | 88.42 | 0.205 | 0.047 |
| Spring | 81.93 | 0.1 | 0.131 | 90.48 | 0.205 | 0.031 | 89.72 | 0.103 | 0.032 | 88.97 | 0.115 | 0.01 |
| Mean | 85.458 | 0.143 | 0.044 | 90.515 | 0.252 | 0.046 | 90.95 | 0.231 | 0.062 | 90.305 | 0.229 | 0.016 |
| ACPE | 5.408 | / | / | 1.795 | / | / | 1.74 | / | / | 1.61 | / | / |
| Proportion | IPICP | IPINAW | INAD |
|---|---|---|---|
| PPM>M1 | 62.5% | 70.83% | 95.83% |
| PPM>M2 | 58.33% | 75% | 91.67% |
| PPM>QR | 91.67% | 0% | 33.33% |
© 2017 by the authors. Licensee MDPI, Basel, Switzerland. This article is an open access article distributed under the terms and conditions of the Creative Commons Attribution (CC BY) license (http://creativecommons.org/licenses/by/4.0/).
Share and Cite
Hu, M.; Hu, Z.; Yue, J.; Zhang, M.; Hu, M. A Novel Multi-Objective Optimal Approach for Wind Power Interval Prediction. Energies 2017, 10, 419. https://doi.org/10.3390/en10040419
Hu M, Hu Z, Yue J, Zhang M, Hu M. A Novel Multi-Objective Optimal Approach for Wind Power Interval Prediction. Energies. 2017; 10(4):419. https://doi.org/10.3390/en10040419
Chicago/Turabian StyleHu, Mengyue, Zhijian Hu, Jingpeng Yue, Menglin Zhang, and Meiyu Hu. 2017. "A Novel Multi-Objective Optimal Approach for Wind Power Interval Prediction" Energies 10, no. 4: 419. https://doi.org/10.3390/en10040419
APA StyleHu, M., Hu, Z., Yue, J., Zhang, M., & Hu, M. (2017). A Novel Multi-Objective Optimal Approach for Wind Power Interval Prediction. Energies, 10(4), 419. https://doi.org/10.3390/en10040419