Article

Research on Unstructured Text Data Mining and Fault Classification Based on RNN-LSTM with Malfunction Inspection Report

1
School of Electrical Engineering, Wuhan University, Wuhan 430072, China
2
School of Electrical Engineering and Telecommunications, University of NSW, Sydney 2052, Australia
3
Department of Electrical Engineering and Computer Science, The University of Tennessee, Knoxville, TN 37996, USA
*
Author to whom correspondence should be addressed.
Energies 2017, 10(3), 406; https://doi.org/10.3390/en10030406
Submission received: 23 December 2016 / Revised: 10 February 2017 / Accepted: 8 March 2017 / Published: 21 March 2017

Abstract

:
This paper documents the condition-based maintenance (CBM) of power transformers, the analysis of which relies on two basic data groups: structured (e.g., numeric and categorical) and unstructured (e.g., natural language text narratives) which accounts for 80% of data required. However, unstructured data comprised of malfunction inspection reports, as recorded by operation and maintenance of the power grid, constitutes an abundant untapped source of power insights. This paper proposes a method for malfunction inspection report processing by deep learning, which combines the text data mining–oriented recurrent neural networks (RNN) with long short-term memory (LSTM). In this paper, the effectiveness of the RNN-LSTM network for modeling inspection data is established with a straightforward training strategy in which we replicate targets at each sequence step. Then, the corresponding fault labels are given in datasets, in order to calculate the accuracy of fault classification by comparison with the original data labels and output samples. Experimental results can reflect how key parameters may be selected in the configuration of the key variables to achieve optimal results. The accuracy of the fault recognition demonstrates that the method we proposed can provide a more effective way for grid inspection personnel to deal with unstructured data.

1. Introduction

With the higher requirements of the economy and safety of the power grid, online condition-based maintenance (CBM) of power transformers without power outages is an inevitable trend for equipment maintenance mode [1,2]. The transformer CBM analysis relies on two basic groups: structured (e.g., numeric and categorical) and unstructured (e.g., natural language text narratives). Using structured data analysis, researchers have proposed a variety of transformer fault diagnosis algorithms such as the Bayesian method [3,4,5], evidence reasoning method [6], grey target theory method [7], support vector machine (SVM) method [8,9,10], artificial neural network method [11,12], extension theory method [13], etc. These algorithms have achieved good results in engineering practice. However, for more unstructured data found in practice [14,15,16,17] (i.e., the malfunction inspection report), traditional artificial means of massive original document annotation and classification are not only time-consuming, but are also unable to achieve the desired results. For this reason, it has not been possible to adapt development of network information needs to the grid. Therefore, compared with structured data processing, it is more comprehensive for grid inspection personnel to effectively identify the massive unstructured text in the inspection malfunction report.
Deep learning achieved great success in speech recognition, natural language processing (NLP), machine vision, multimedia, and other fields in recent years. The most famous was the face recognition test set Labeled Faces in the Wild [18], in which the final recognition rate of a non-deep learning algorithm was 96.33% [19], whereas deep learning could reach 99.47% [20].
Deep learning also consistently exhibits an advantage in regards to NLP. After Mikolov et al. [21] presented language modeling using recurrent neural networks (RNNs) in 2010, he then proposed two novel model architectures (Continuous Bag-of-Words and Skip-gram) for computing continuous vector representations of words from very large data sets in 2013 [22]. However, the model is not designed to capture the fine-grained sentence structure. When using the back-propagation algorithm to learn the model parameters, RNN needs to expand into the parameter-sharing multi-layer feed-forward neural network with the length of historical information corresponding to the number of layers to expand. Many layers not only make the training speed become very slow, but the most critical problem is also the disappearance of the gradient and the explosion of the gradient [23,24,25].
Long short-term memory (LSTM) networks were developed in [26] to address the difficulty of capturing long-term memory in RNNs. It has been successfully applied to speech recognition, which achieves state-of-the-art performance [27,28]. In text analysis, LSTM-RNN treats a sentence as a sequence of words with internal structures, i.e., word dependencies. Tai et al. [29] introduce the Tree-LSTM, a generalization of LSTMs to tree-structured network topologies. Tree-LSTMs outperform all existing systems and strong LSTM baselines on two tasks: predicting the semantic relatedness of two sentences and sentiment classification. Li et al. [30] explored an important step toward this generation task: training an LSTM auto-encoder to preserve and reconstruct multi-sentence paragraphs. They introduced an LSTM model that hierarchically builds a paragraph embedding from that of sentences and words, and then decodes this embedding to reconstruct the original paragraph. Chanen [31] showed how to use ensembles of word2vec (word to vector) models to automatically find semantically similar terms within safety report corpora and how to use a combination of human expertise and these ensemble models to identify sets of similar terms with greater recall than either method alone. In Chanen’s paper, an unsupervised method was shown for comparing several word2vec models trained on the same data in order to estimate reasonable ranges of vector sizes to induce individual word2vec models. This method is based on measuring inter-model agreement on common word2vec similar terms [31]. Palangi [32] developed a model that addresses sentence embedding, a hot topic in current NLP research, using RNN with LSTM cells.
In the above papers, the RNN-LSTM is continuously improved and developed in the process of deep learning applied to NLP. At present, RNN-LSTM has many applications in NLP, but it has not been applied to the unstructured data in the grid. Unstructured data accounts for about 80% of power grid enterprises, which contain important information about the operation and management of the grid. In the malfunction inspection report, the unstructured data processing method is urgently needed to analyze the effective information.
The primary objective of this paper is to provide insight on how to apply the principles of deep learning via NLP to the unstructured data analysis in grids based on RNN-LSTM. The remaining parts in the paper are organized as follows. In Section 2 and Section 3, the description of the text data mining–oriented RNN and LSTM model are presented. In Section 4, the malfunction inspection report analysis method based on RNN-LSTM is proposed. Experimental results are provided to demonstrate the proposed method in Section 5. Conclusions are drawn in Section 6.

2. Text Data Mining–Oriented Recurrent Neural Network

2.1. Text Model Representation

For the vector form of voice and text in the mathematical model, each word represents a vector, and each dimension of the vector represents a single word. If the word appears in the text, it is set to 1; otherwise, it is set to 0. The number of vectors is equal to the dimension of the vocabulary words.
d j = ( w 1 , j , w 2 , j , ... , w t , j )

2.2. Recurrent Neural Networks

In the past, voice text processing was usually a combination of a neural network and a hidden Markov model. Taking advantage of algorithms and computer hardware, the acoustics model established through deep forward-propagation networks has made considerable progress in recent years. Taking sound into account, text processing is an internal dynamic processing, and a RNN can be used as one of its candidate models. Dynamic means that the currently processed text vector is associated with the context of the content, and it cannot be an independent analysis of the current sample, but should be set before and after the memory unit of the text information for a comprehensive analysis of the semantic information. This approach applies a larger data state space and a more abundant model dynamic performance.
In a neural network, each neuron is a processing unit which is connected to the output of its node as the input. Before the output is issued, each neuron will first apply a nonlinear activation function. It is precisely because of this activation function that neural networks have the ability to model nonlinear relationships. However, the general neural model cannot clearly simulate the time relationship. All data points are composed of a fixed-length vector hypothesis. When there is a strong correlation with the input phasor, the model will greatly reduce the processing effect. Therefore, we introduce the recurrent neural network by given the ability of modeling with explicit time. The explicit time can not only into the output, but also in the next time step hidden layer, by adding across time points from the hidden layer and hidden layer feedback connection.
The traditional neural network has no middle layer of the cycle process. When the specified input x 0 , x 1 , x 2 , ... , x t , after the process of neurons there will be some corresponding output, h 0 , h 1 , h 2 , ... , h t . In each training, no information needs to transfer between the neurons. The difference between RNNs and traditional neural networks is that in every training for RNN, neurons need to transfer some information. In this training, the neurons need to use the role of the last neuron after the stated information, similar to the recursive function. The basic structure of the RNN is shown in Figure 1, and the expansion is shown in Figure 2, where A is the hidden layer; x i is the input vector; h i is the output of the hidden layer. As can be seen from Figure 2, the output of each hidden layer is input as an input vector to the next hidden layer. The output on the impact of the following can be considered in the next paragraph of the unstructured text. The algorithm of the model is analyzed in the Appendix A.

3. Long Short-Term Memory Model

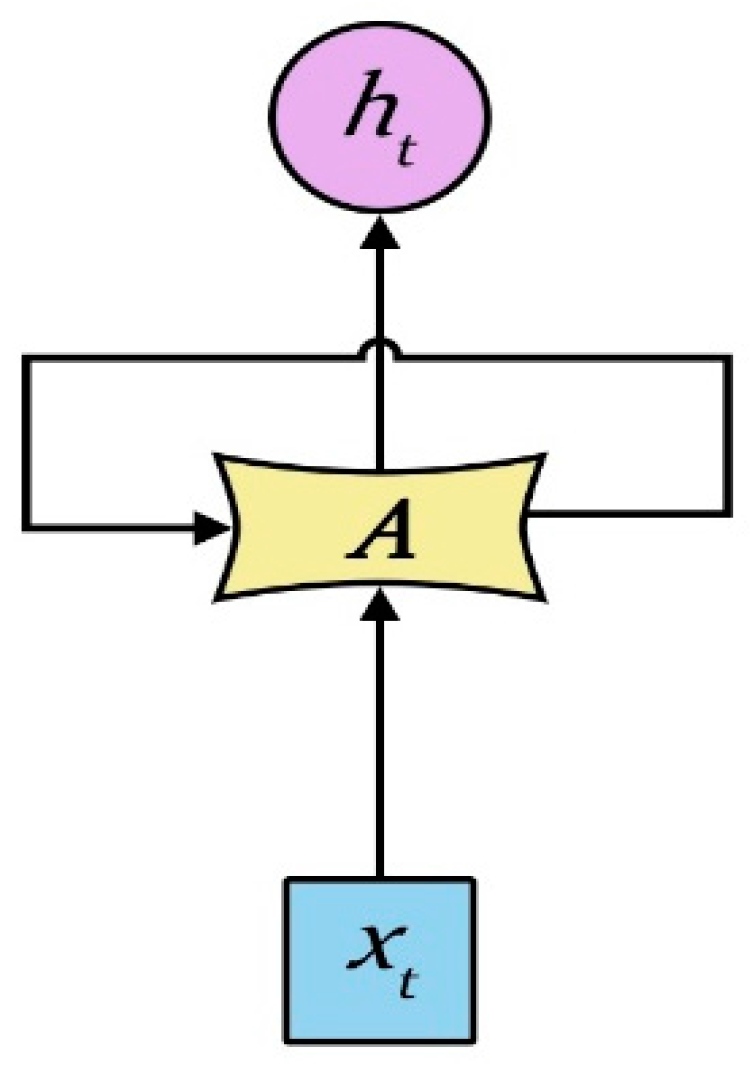
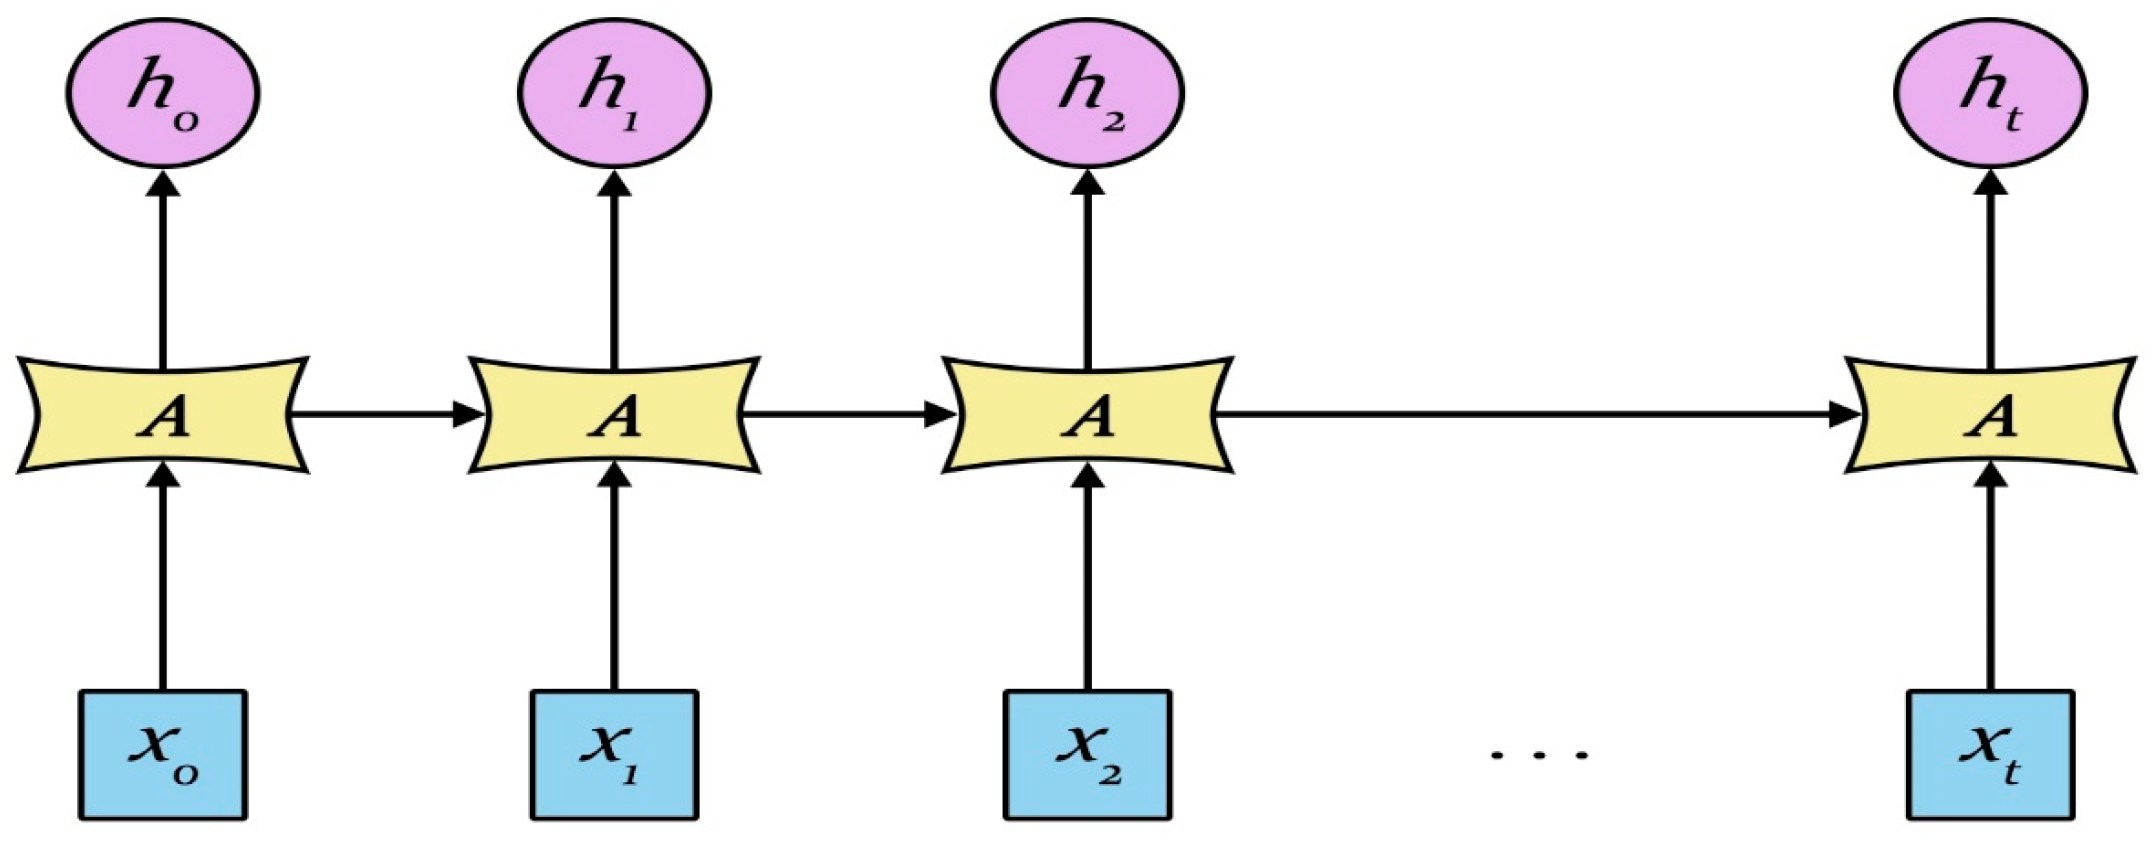
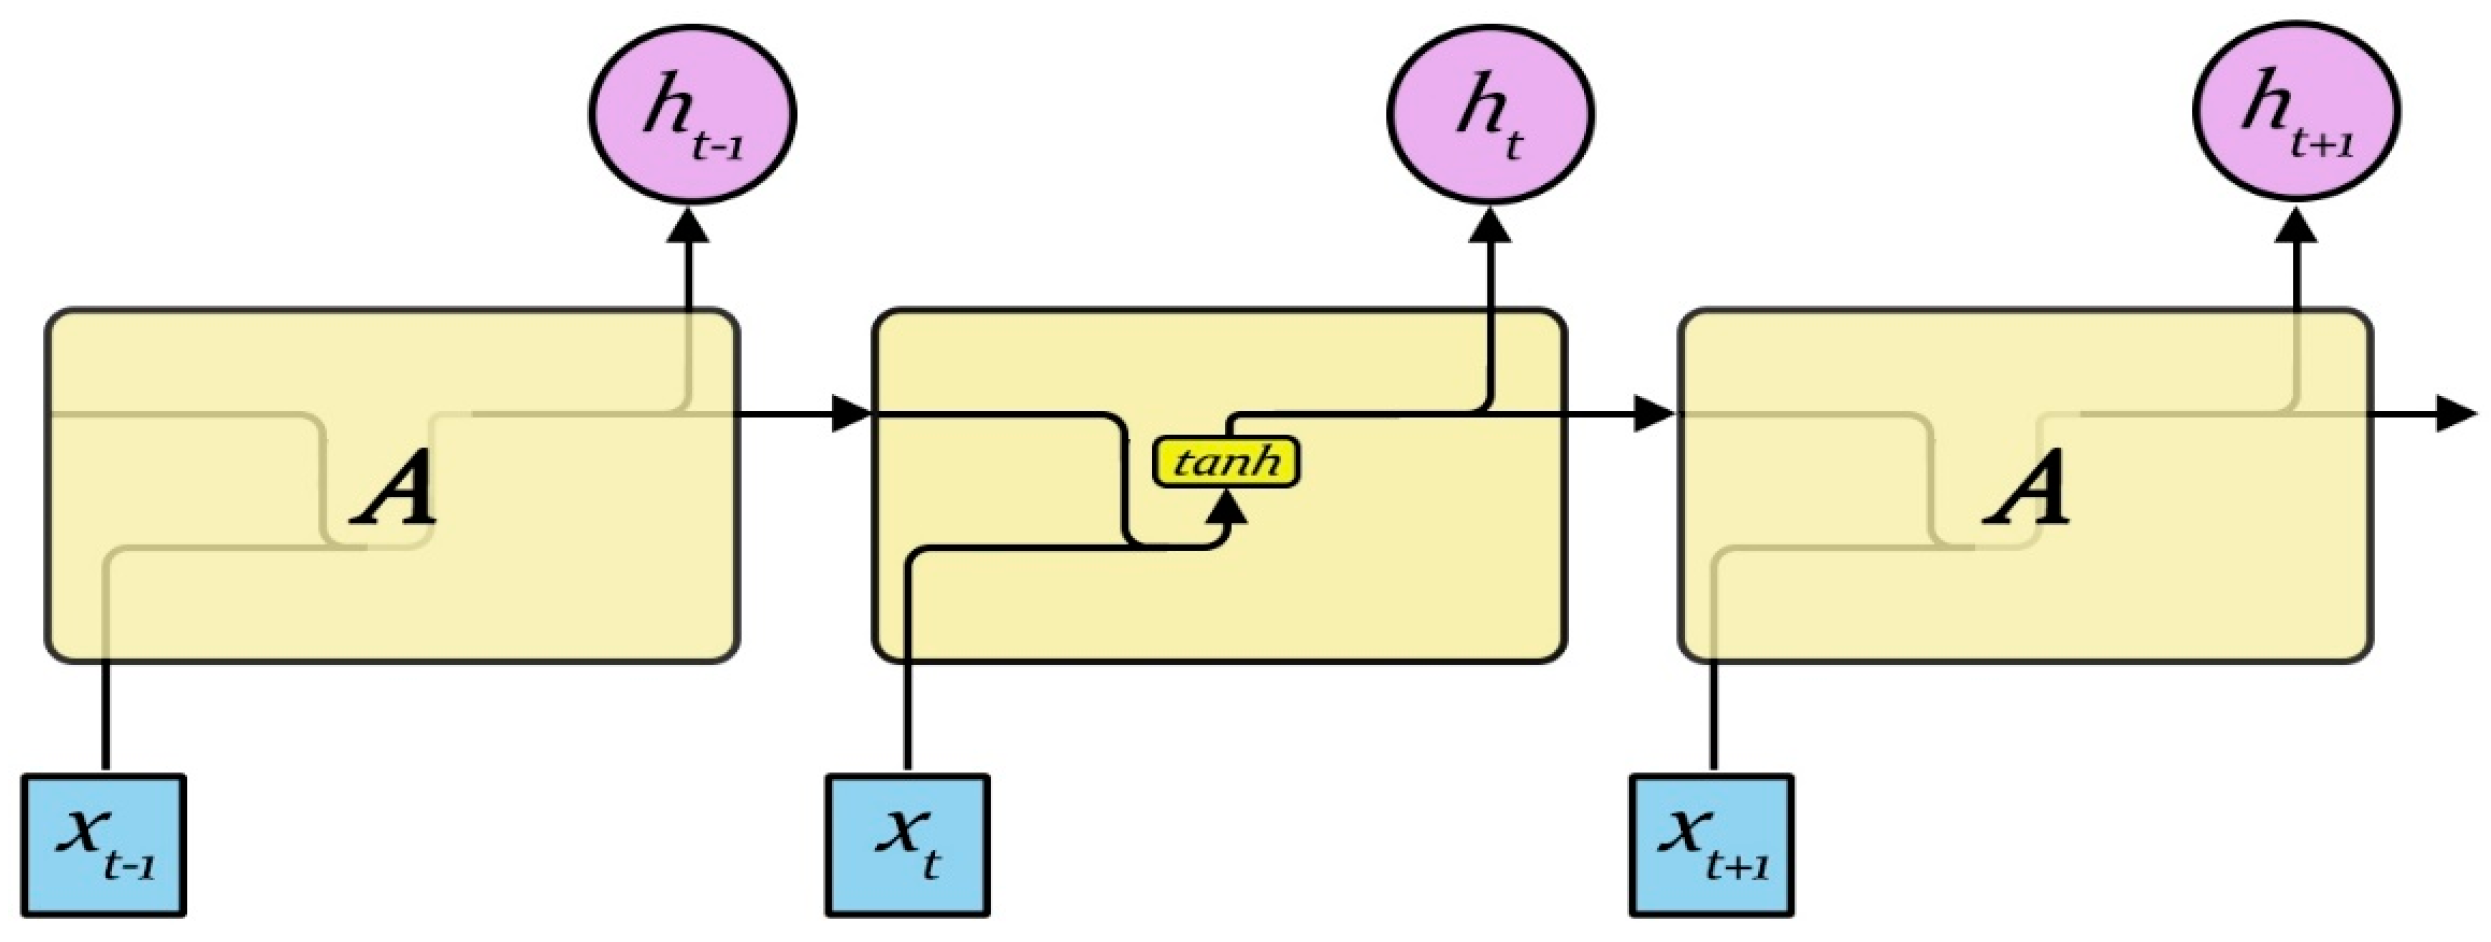
Although the RNN performs the transformation from the sentence to a vector in a principled manner, it is generally difficult to learn the long-term dependency within the sequence due to the vanishing gradients problem. The RNN has two limitations: first, the text analysis is in fact associated with the surrounding context, while the RNN only contacts the previous text, but not the following text; second, compared to the time step, RNN has more difficulties in the learning time correlation. A bidirectional LSTM (BLSTM) network can be used in the first problem, while the LSTM model can be used for the second. The RNN repeats the module as shown in 
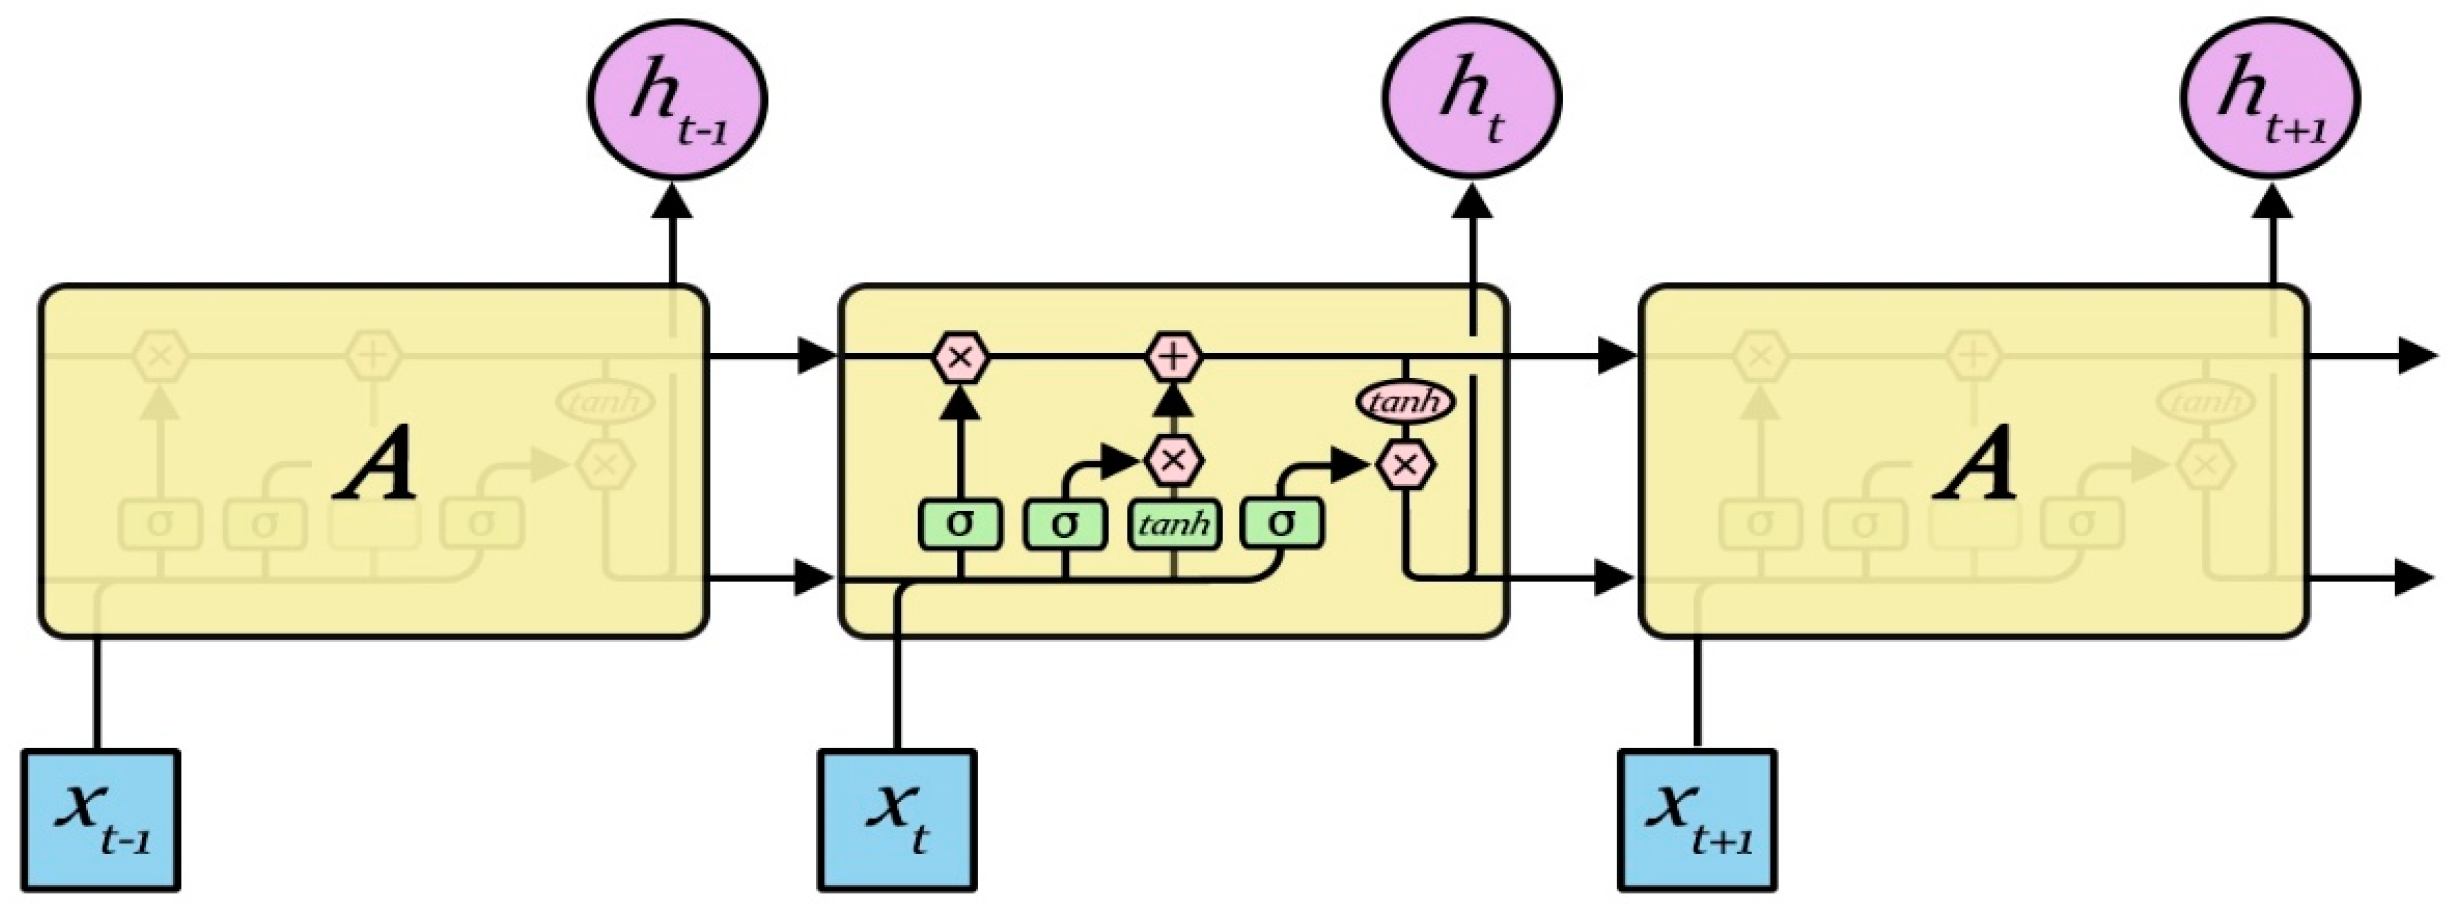
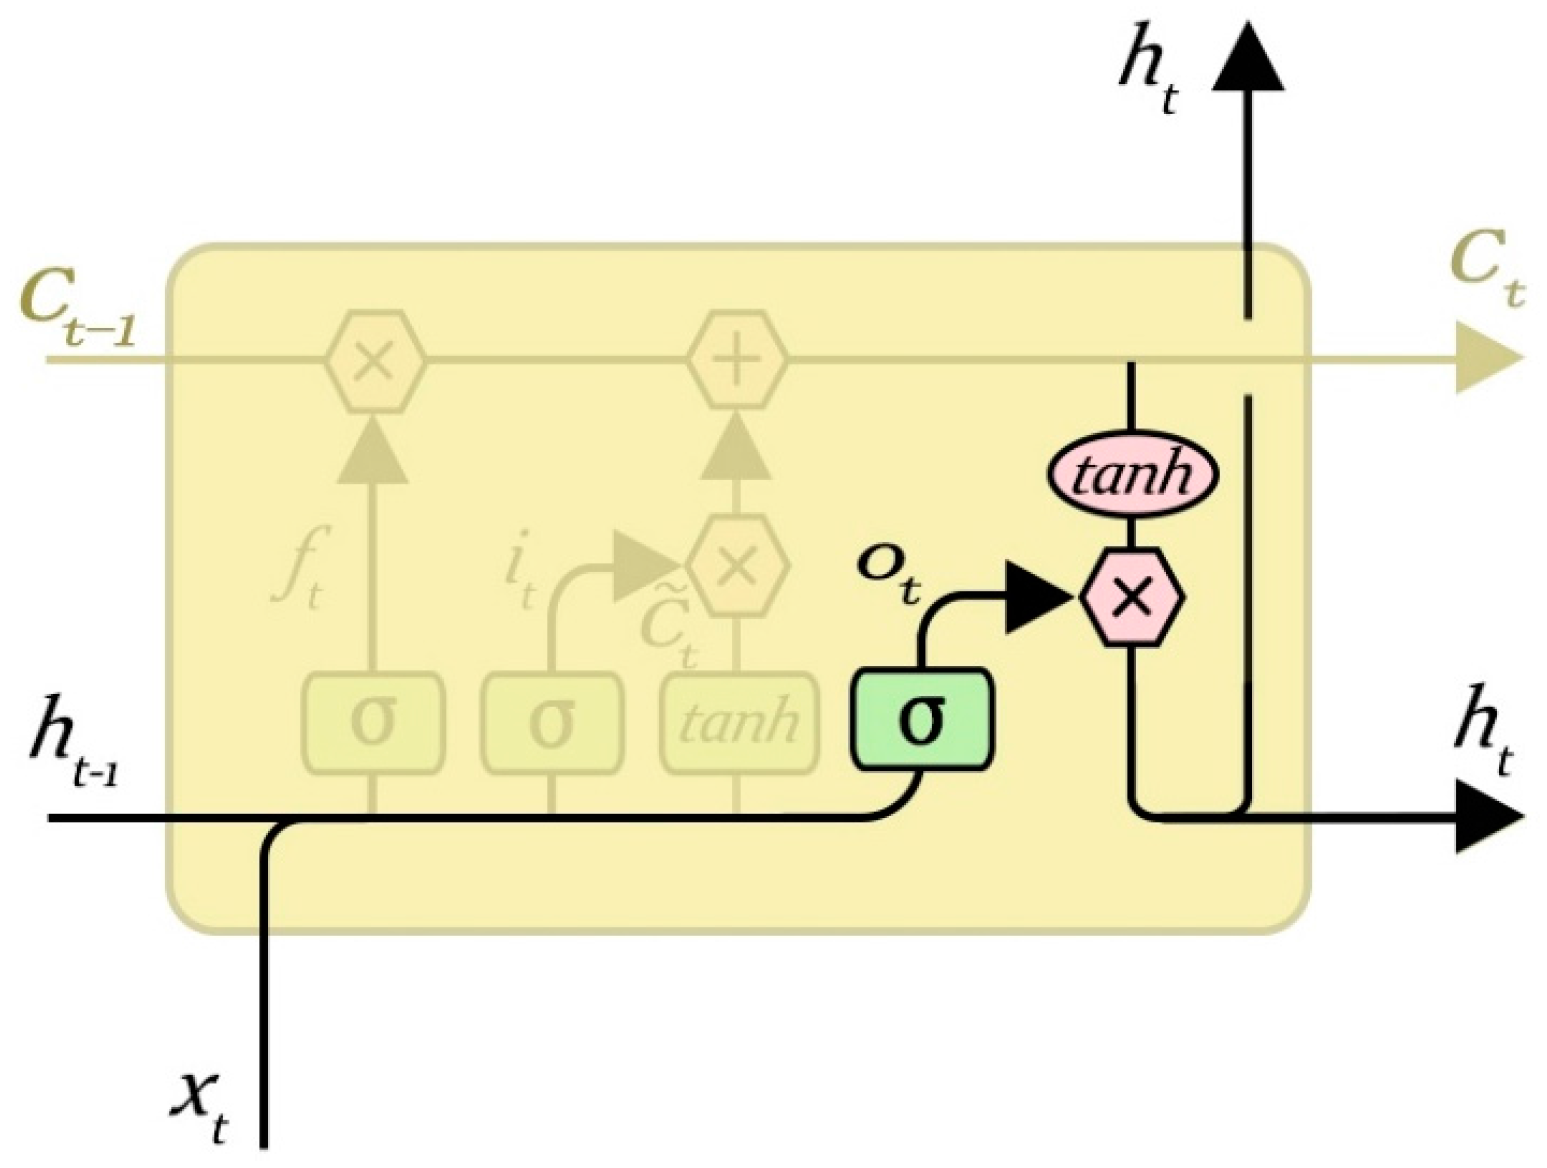
Figure 3, which only contains one neuron. The LSTM model is an improvement of the traditional RNN model; based on the RNN model, the cellular control mechanism is added to solve the long-term dependence problem of the RNN and the gradient explosion problem caused by the long sequence. The model can make the RNN model memorize long-term information by designing a special structure cell. In addition, through the design of three kinds of “gate” structures, the forget gate layer, the input gate layer, and the output gate layer, it can selectively increase and remove the information through the cell structure when controlling information through the cell. These three “gates” act on the cell to form the hidden layer of the LSTM, also known as the block. The LSTM repeat module is shown in Figure 4, which contains four neurons.
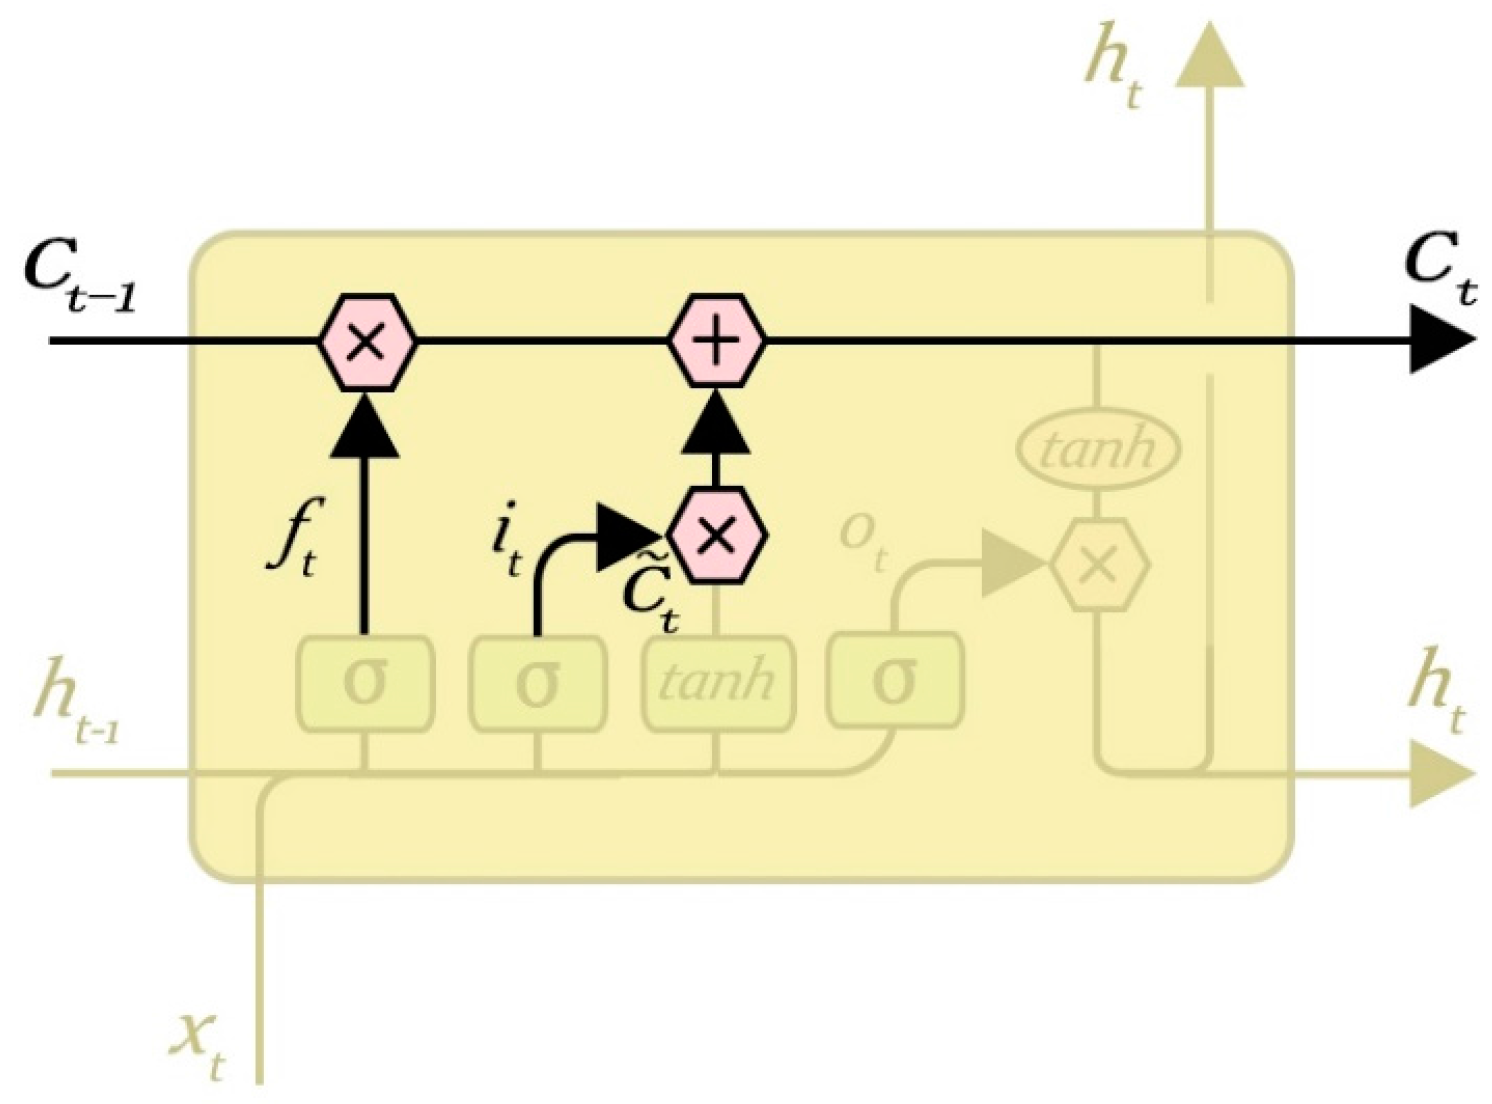
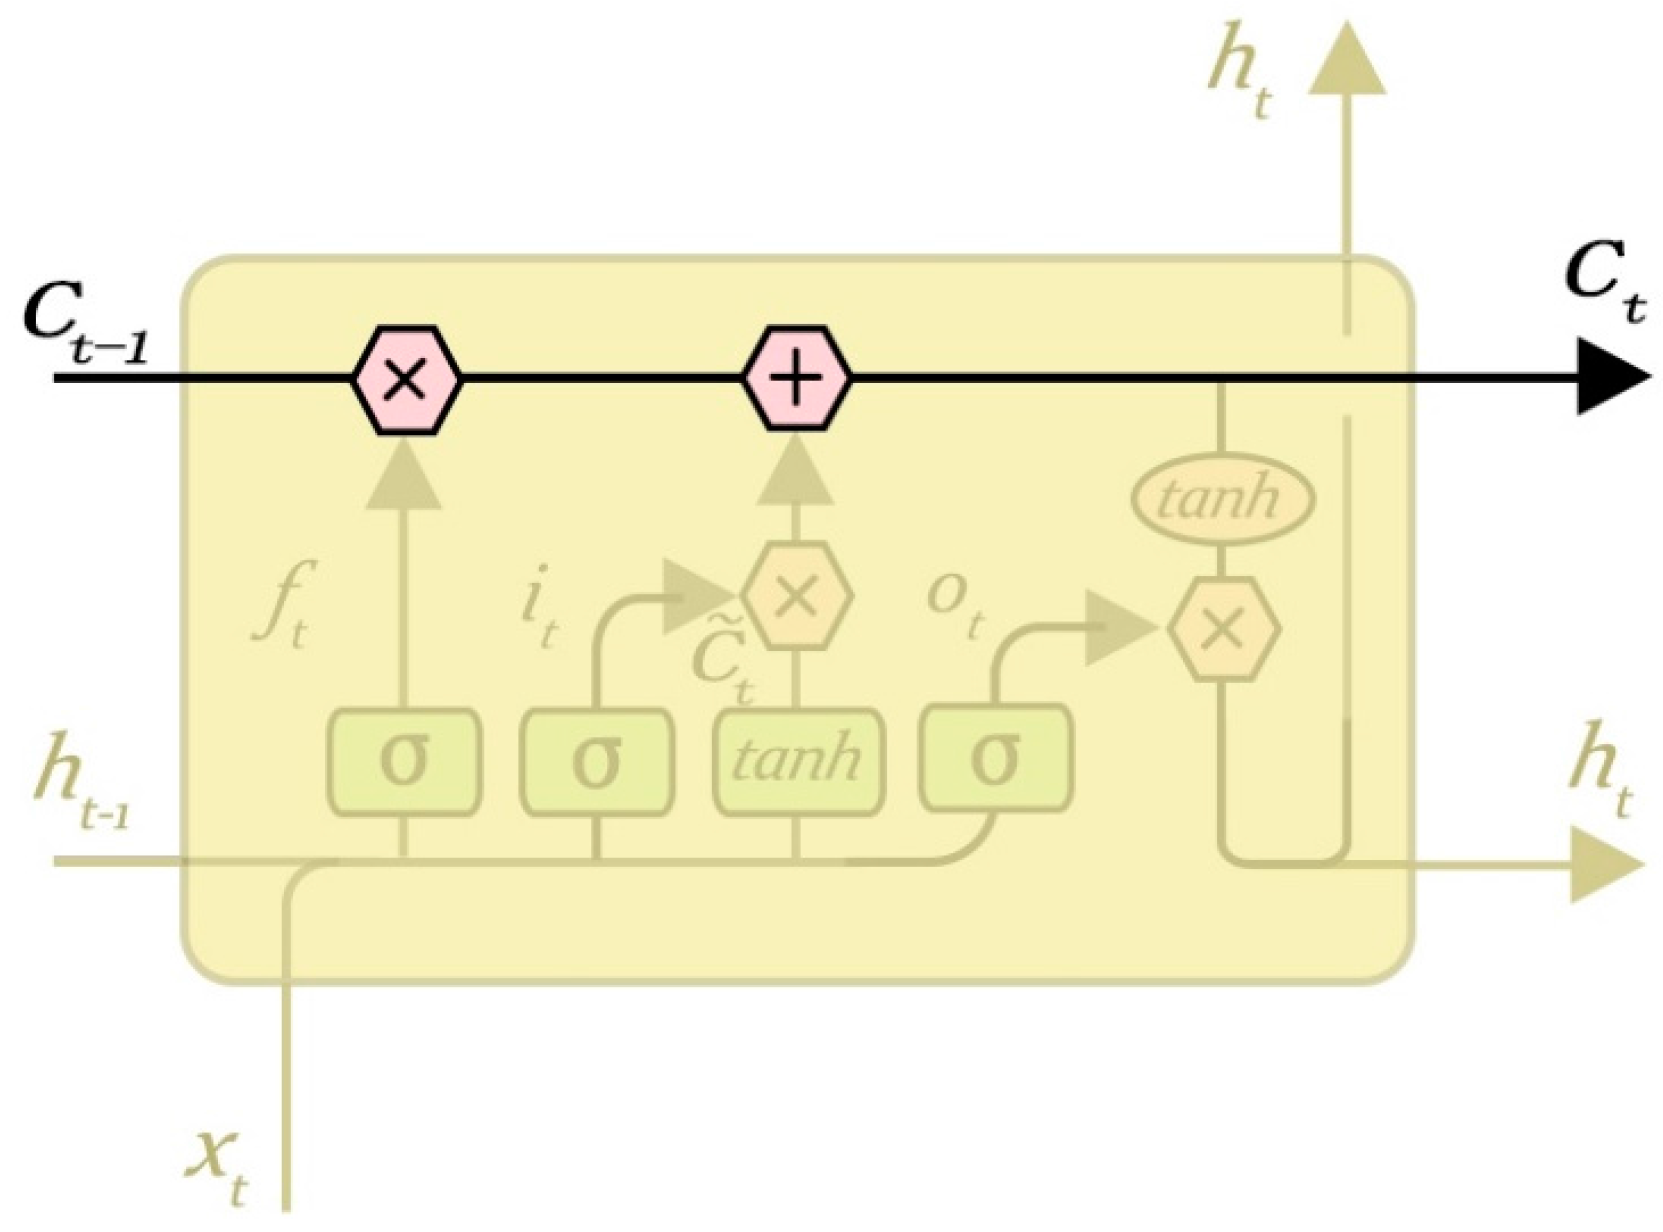
3.1. Core Neuron

LSTM is used to control the transmission of information, it is usually expressed by sigmoid function. The key to LSTMs is the cell state, the horizontal line running through the top of the diagram. The cell state is kind of like a conveyor belt. It runs straight down the entire chain, with only some minor linear interactions. It is very easy for information to just flow along it unchanged. The LSTM does have the ability to remove or add information to the cell state, carefully regulated by structures called gates. Gates are a way to optionally let information through. They are composed of a sigmoid neural net layer and a pointwise multiplication operation. The state of the LSTM core neuron is shown in Figure 5.

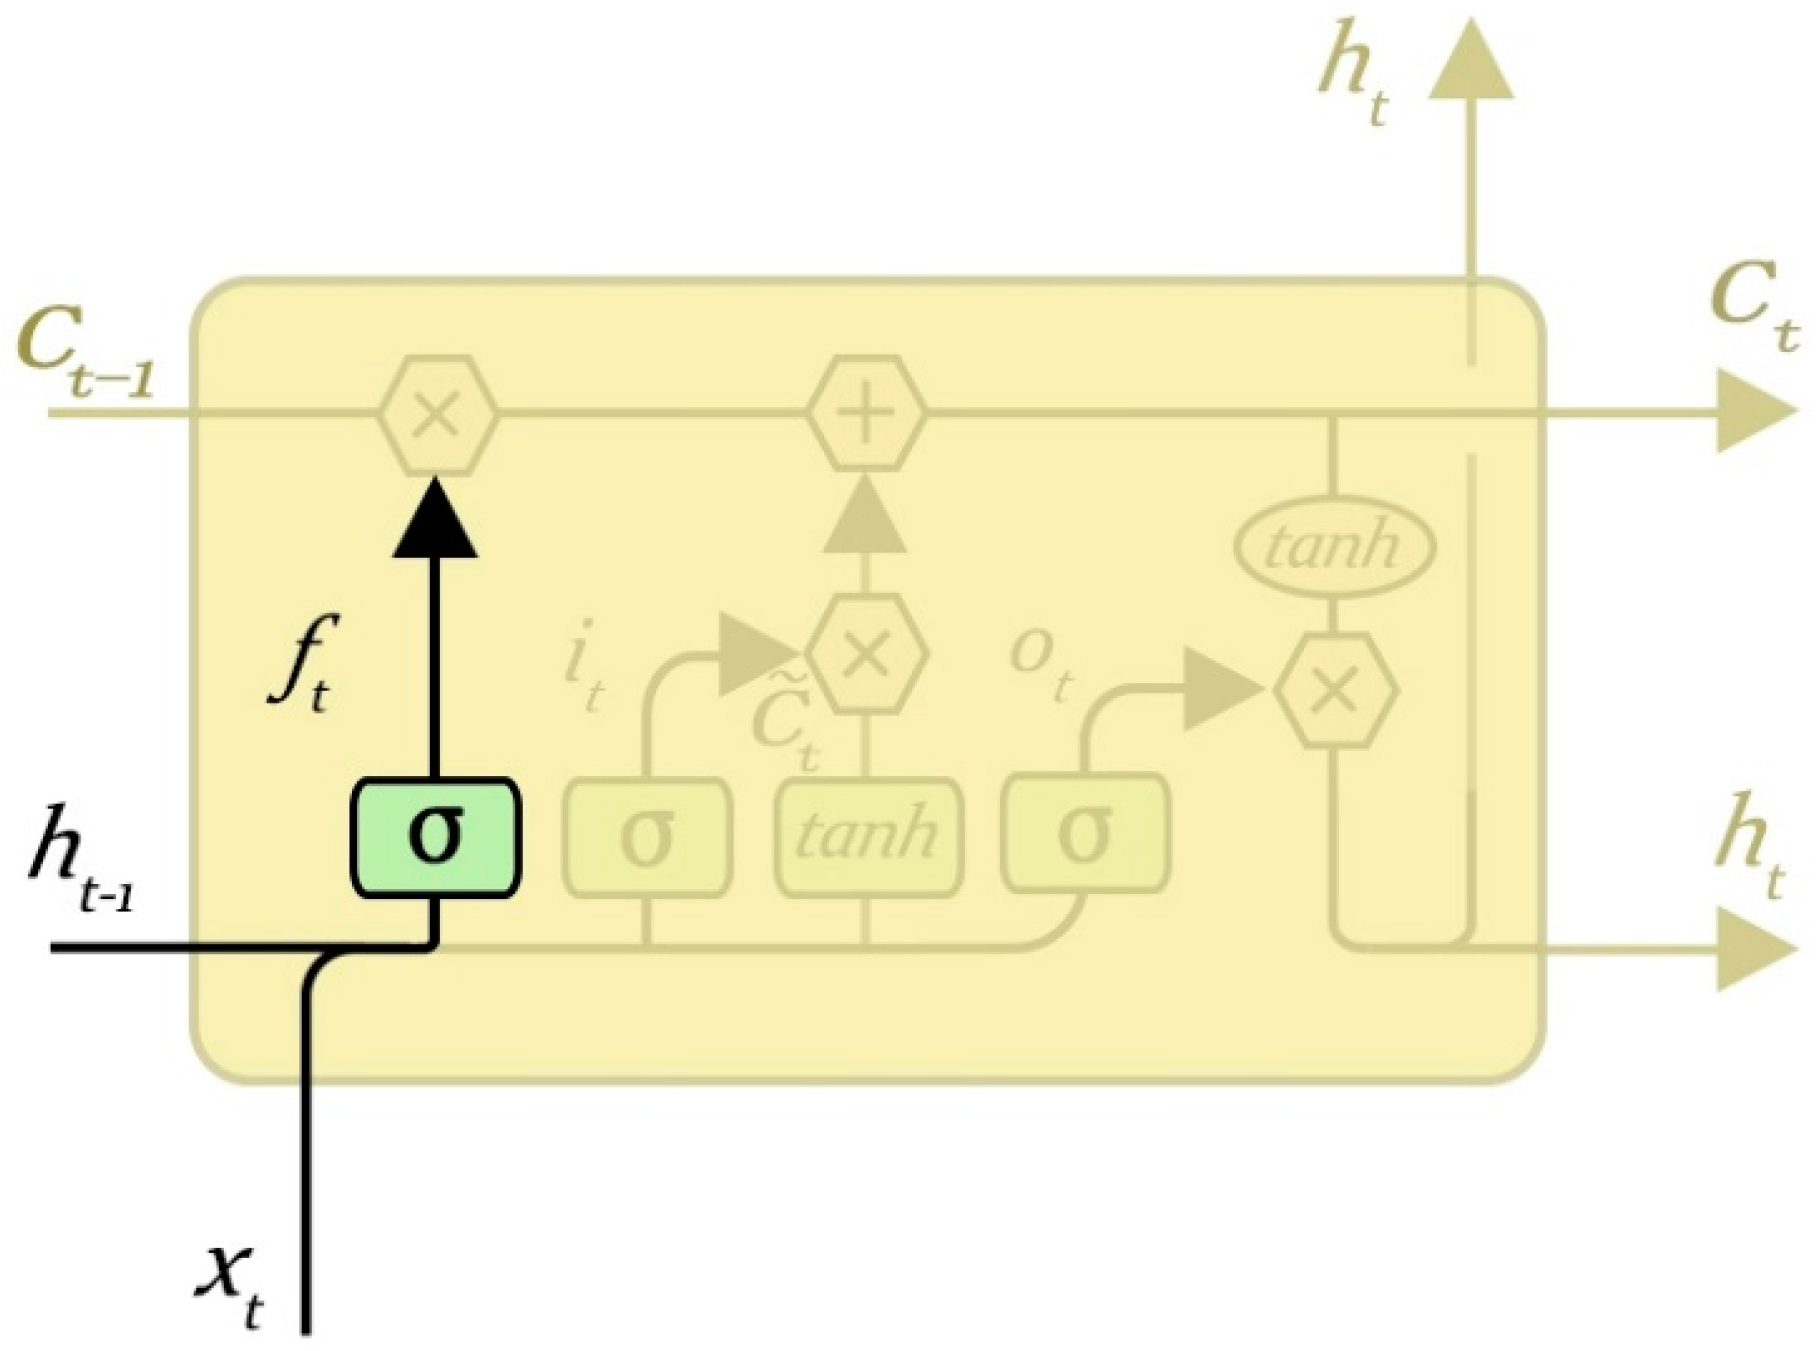
3.2. Forget Gate Layer

The role of the gate layer is to determine the upper layer of input information which may be discarded, and it is used to control the hidden layer nodes stored in the last moment of historical information. The forget gate computes a value between 0 and 1 according to the state of the hidden layer at the previous time and the input of the current time node, and acts on the state of the cell at the previous time to determine what information needs to be retained and discarded. The value “1” represents “completely keep”, while “0” represents “completely get rid of information”. The output of the hidden layer cell (historical information) can be selectively processed by the processing of the forget gate.
The forget gate layer is shown in Figure 6, when the input is h t 1 and the output is x t :
f t = σ ( W f [ h t 1 , x t ] + b f )

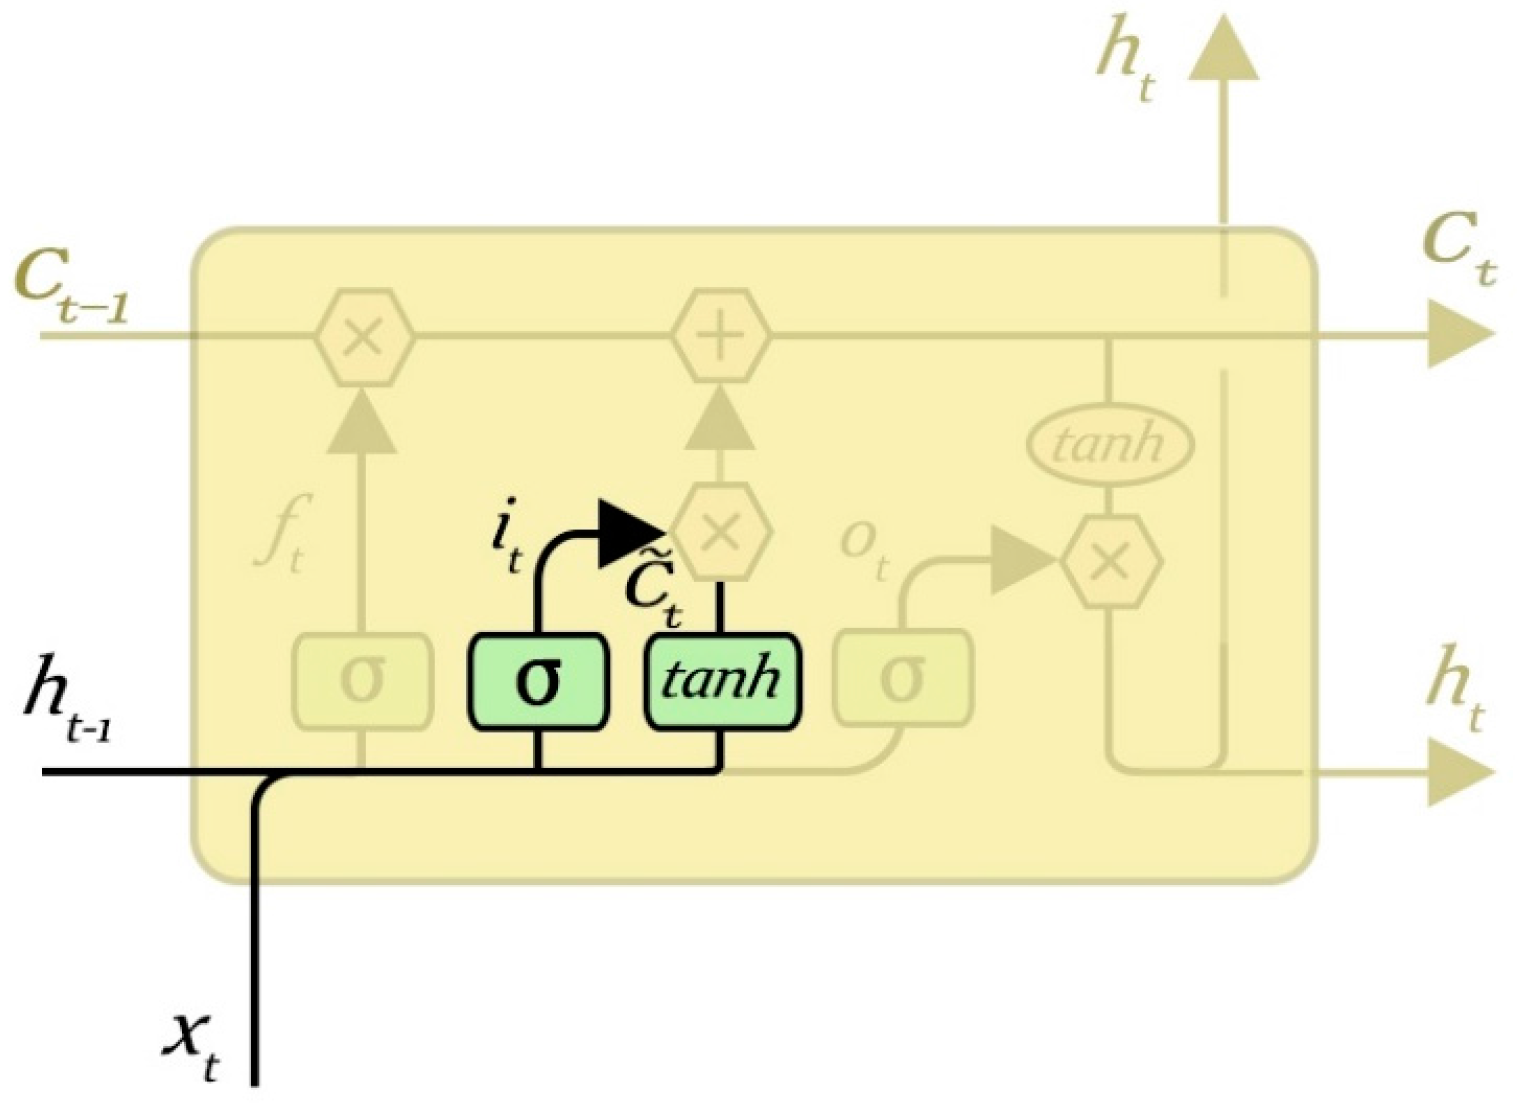
3.3. Input Gate Layer

The output gate layer is used to control the input of the cell state of the hidden gate layer. It can input the information through a number of operations to determine what needs to be retained to update the current cell state. First the input gate layer is established through a sigmoid function to determine which information should be updated. The output of the input gate layer is a value between 0 and 1 of the sigmoid output, and then it acts on the input information to determine whether to update the corresponding value of the cell state, where 1 indicates that the information is allowed to pass, and the corresponding value needs to be updated, and 0 indicates that it may not be allowed as the corresponding values do not need to be updated. It can be seen that the input gate layer can remove some unnecessary information. Then a t a n h layer can be established by adding the candidate state of the neuron phase phasor, and the two jointly calculate the updated value. The input gate layer is shown in Figure 7.
i t = σ ( W i [ h t 1 , x t ] + b i )
C ˜ t = t a n h ( W C [ h t 1 , x t ] + b C )

3.4. Update the State of Neurons

It is time to update the old cell state, C t 1 , into the new cell state C t . The previous steps already decided what to do, and now we just need to actually do it. Multiply the old state by f t , forgetting the information we decided to forget earlier; then add i t × C ˜ t . These are the new candidate values, scaled by how much we decided to update each state value. In the case of the language model, this is where we would actually drop the information about the old subject’s gender and add the new information, as we decided in the previous steps. The neurons’ state update process is shown in Figure 8.
C t = f t C t 1 + i t C ˜ t

3.5. Output Gate Layer

The output gate layer is used to control the output of the current hidden layer node, and to determine whether to output to the next hidden layer or output layer. Through the output of the control, we can determine which information needs to be output. The value of its state is “0” or “1”. The value “1” represents a need to output, and “0” represents that it does not require output. Output control information on the current state of the cell for some sort of value can be found after the final output value.
Determine the output of the neurons as (6) and (7), and the output gate layer is shown in Figure 9.
o t = σ ( W o [ h t 1 , x t ] + b o )
h t = o t t a n h ( C t )

4. Malfunction Inspection Report Analysis Method Based on RNN-LSTM

To learn a good semantic representation of the input sentence, our objective is to make the embedding vectors for sentences of similar meanings as close as possible, and to make sentences of different meanings as far apart as possible. This is challenging in practice since it is hard to collect a large amount of manually labeled data that give the semantic similarity signal between different sentences. Nevertheless, a widely used commercial web search engine is able to log massive amounts of data with some limited user feedback signals. For example, given a particular query, the click-through information about the user-clicked document among many candidates is usually recorded and can be used as a weak (binary) supervision signal to indicate the semantic similarity between two sentences (on the query side and the document side). We try to explain how to leverage such a weak supervision signal to learn a sentence embedding vector that achieves the aforementioned training objective. The above objective to make sentences with similar meaning as close as possible is similar to machine translation tasks where two sentences belong to two different languages with similar meanings, and we want to make their semantic representation as close as possible.
In this paper, the algorithm, parameter setting and experimental environment are introduced as follows:
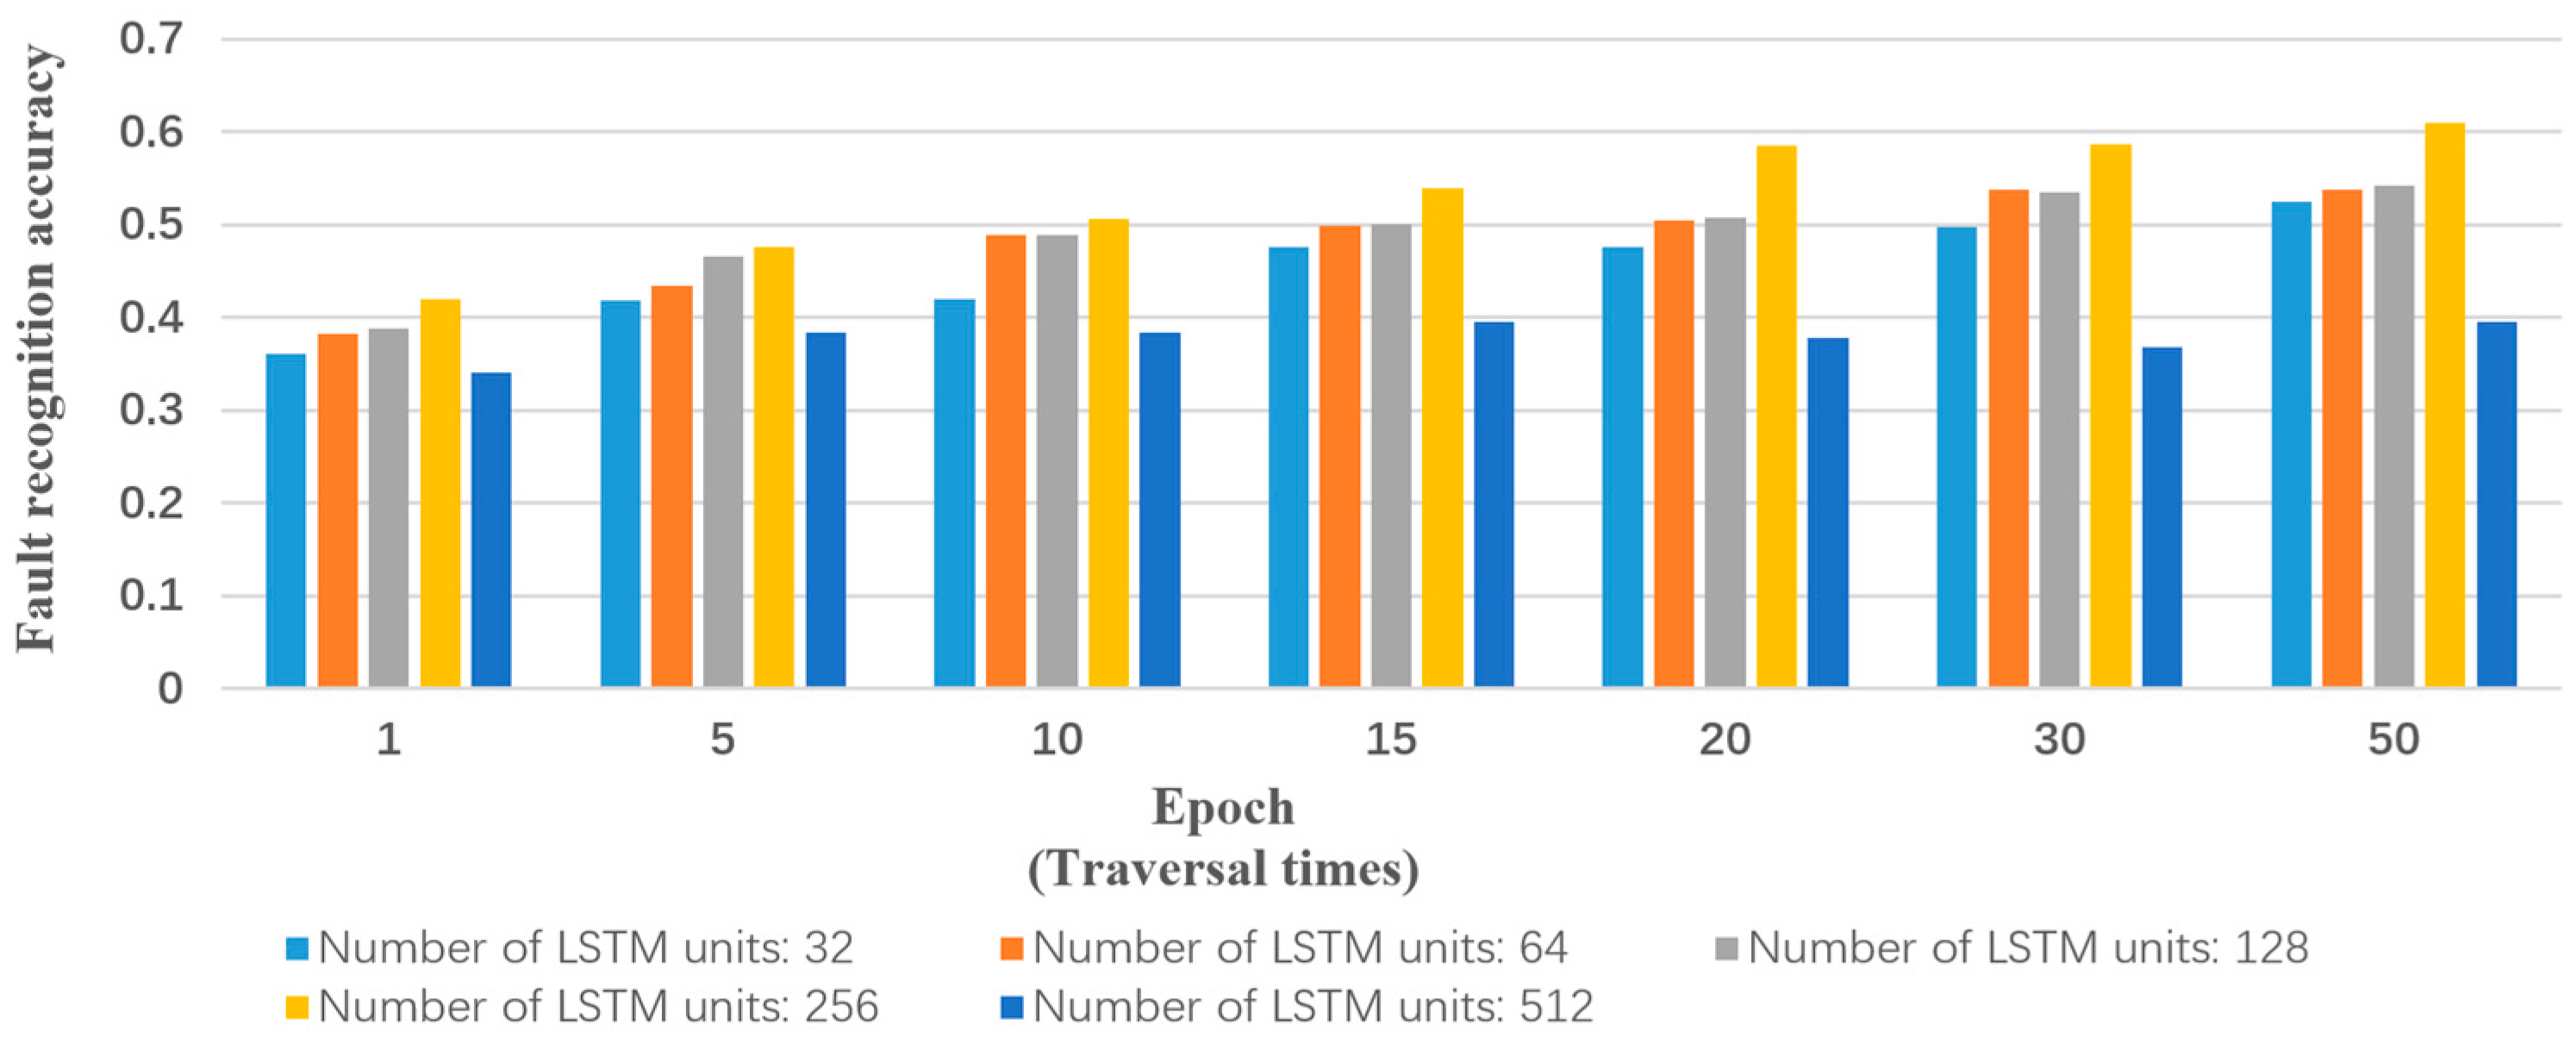
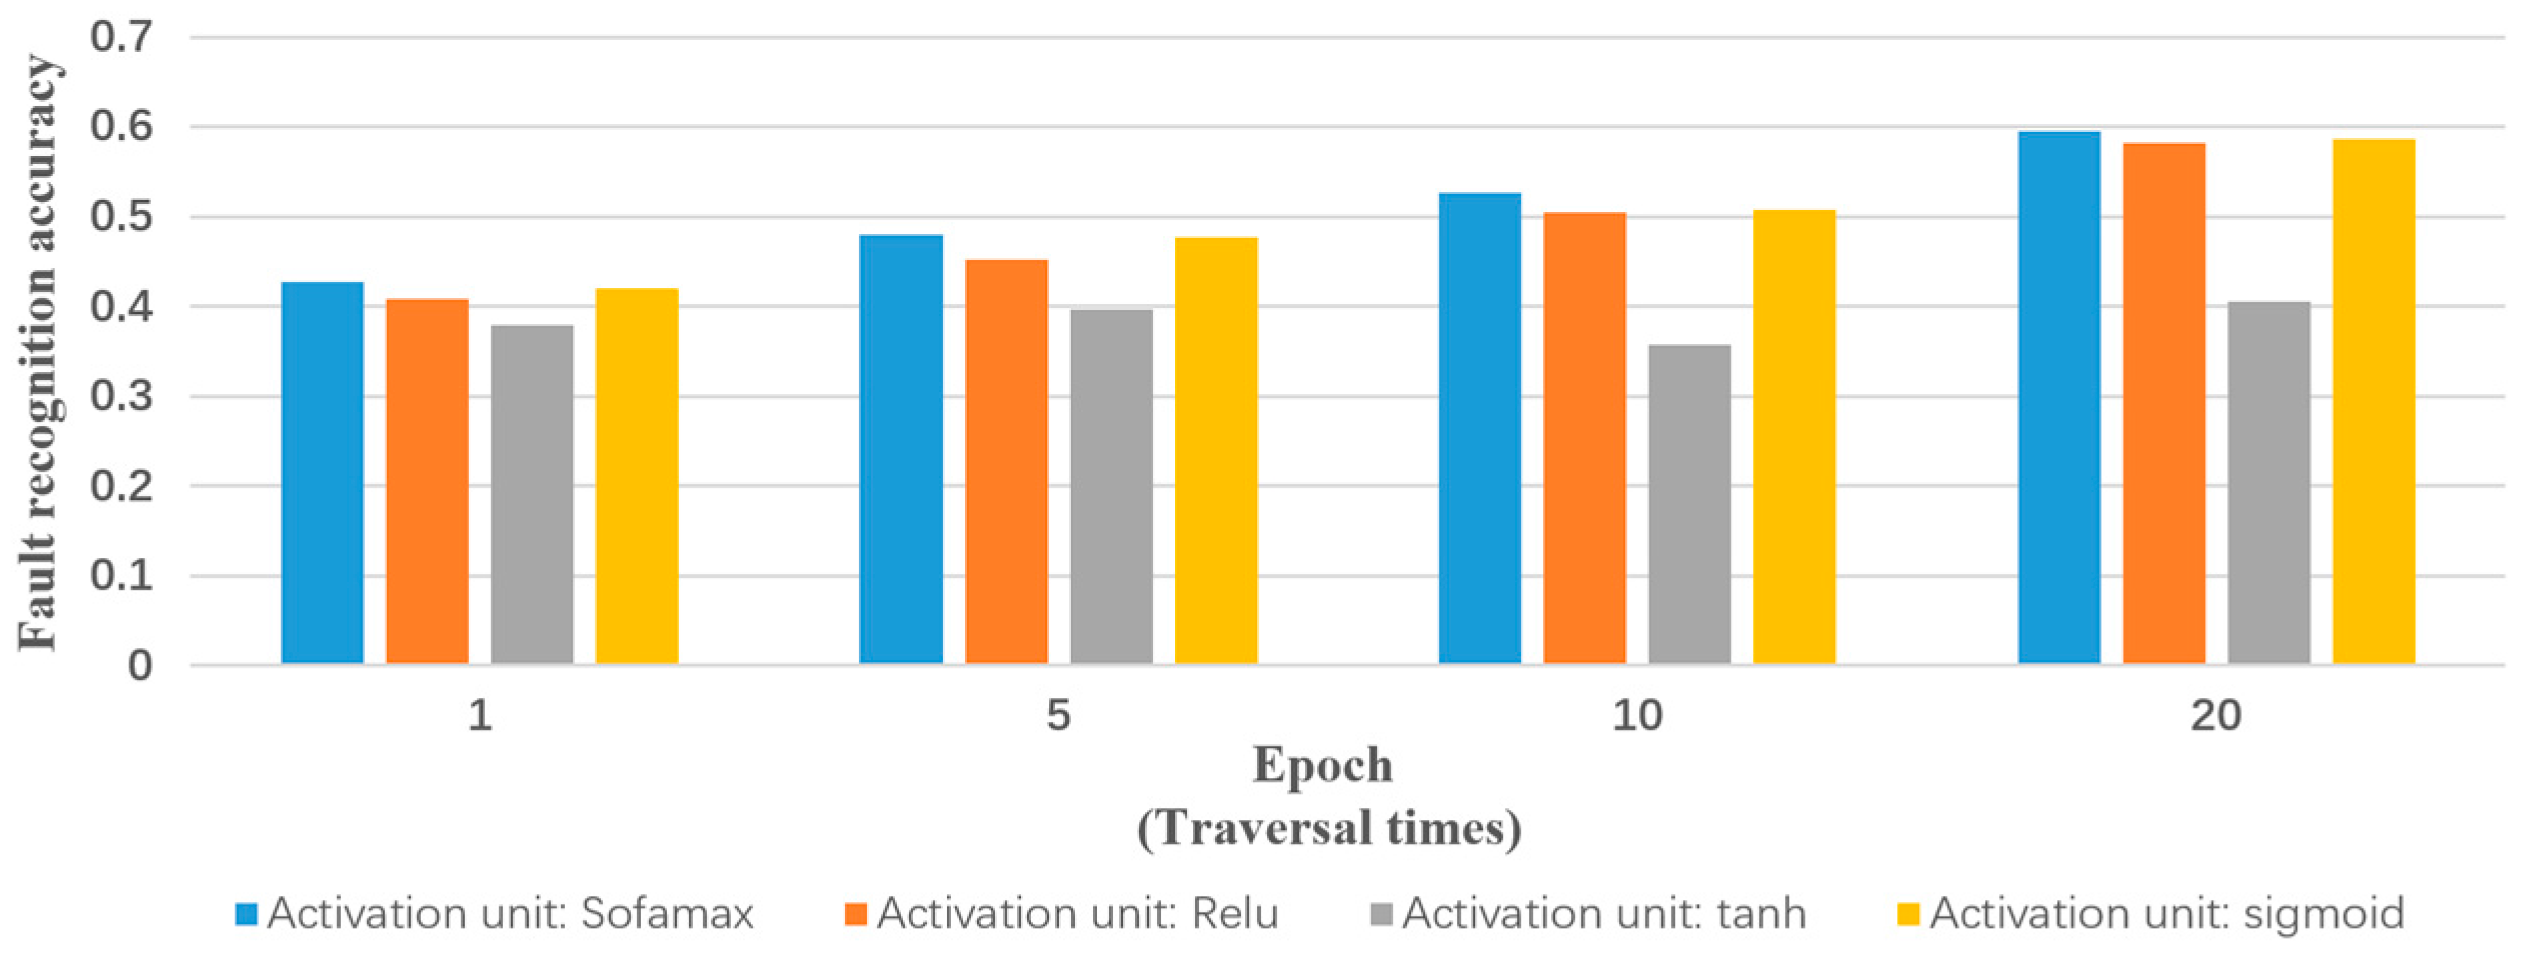
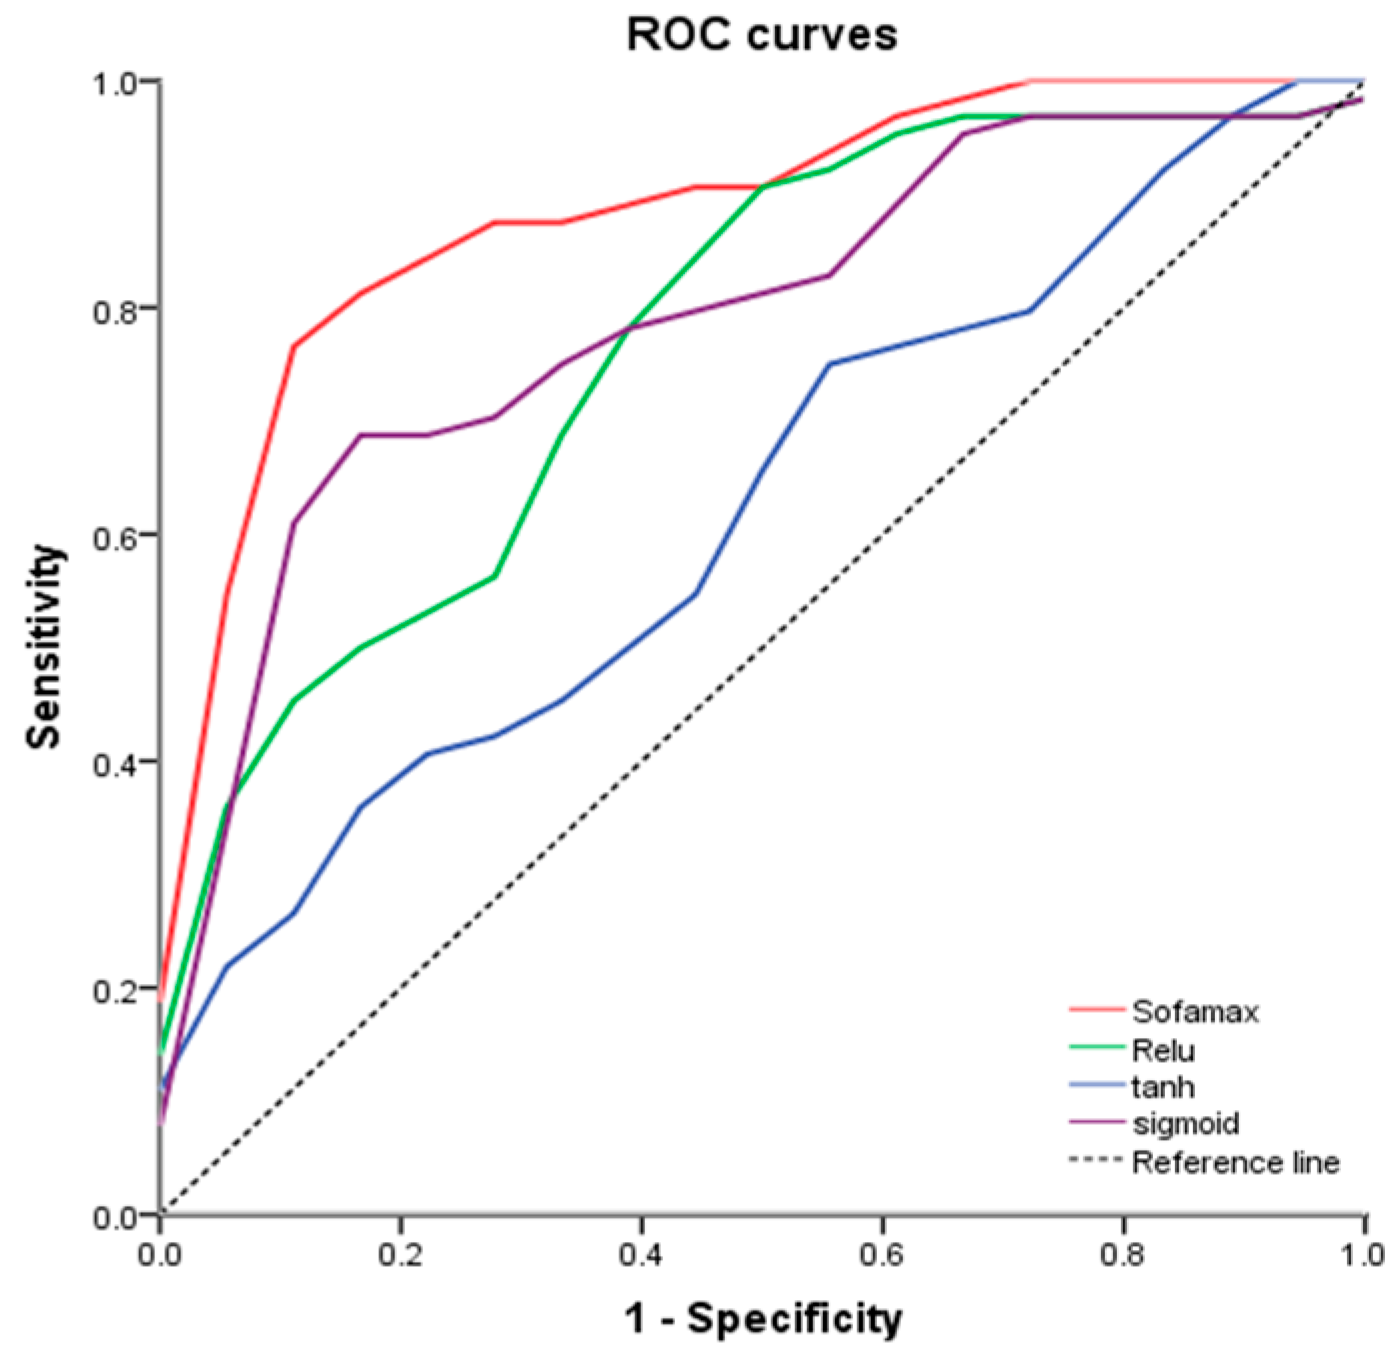
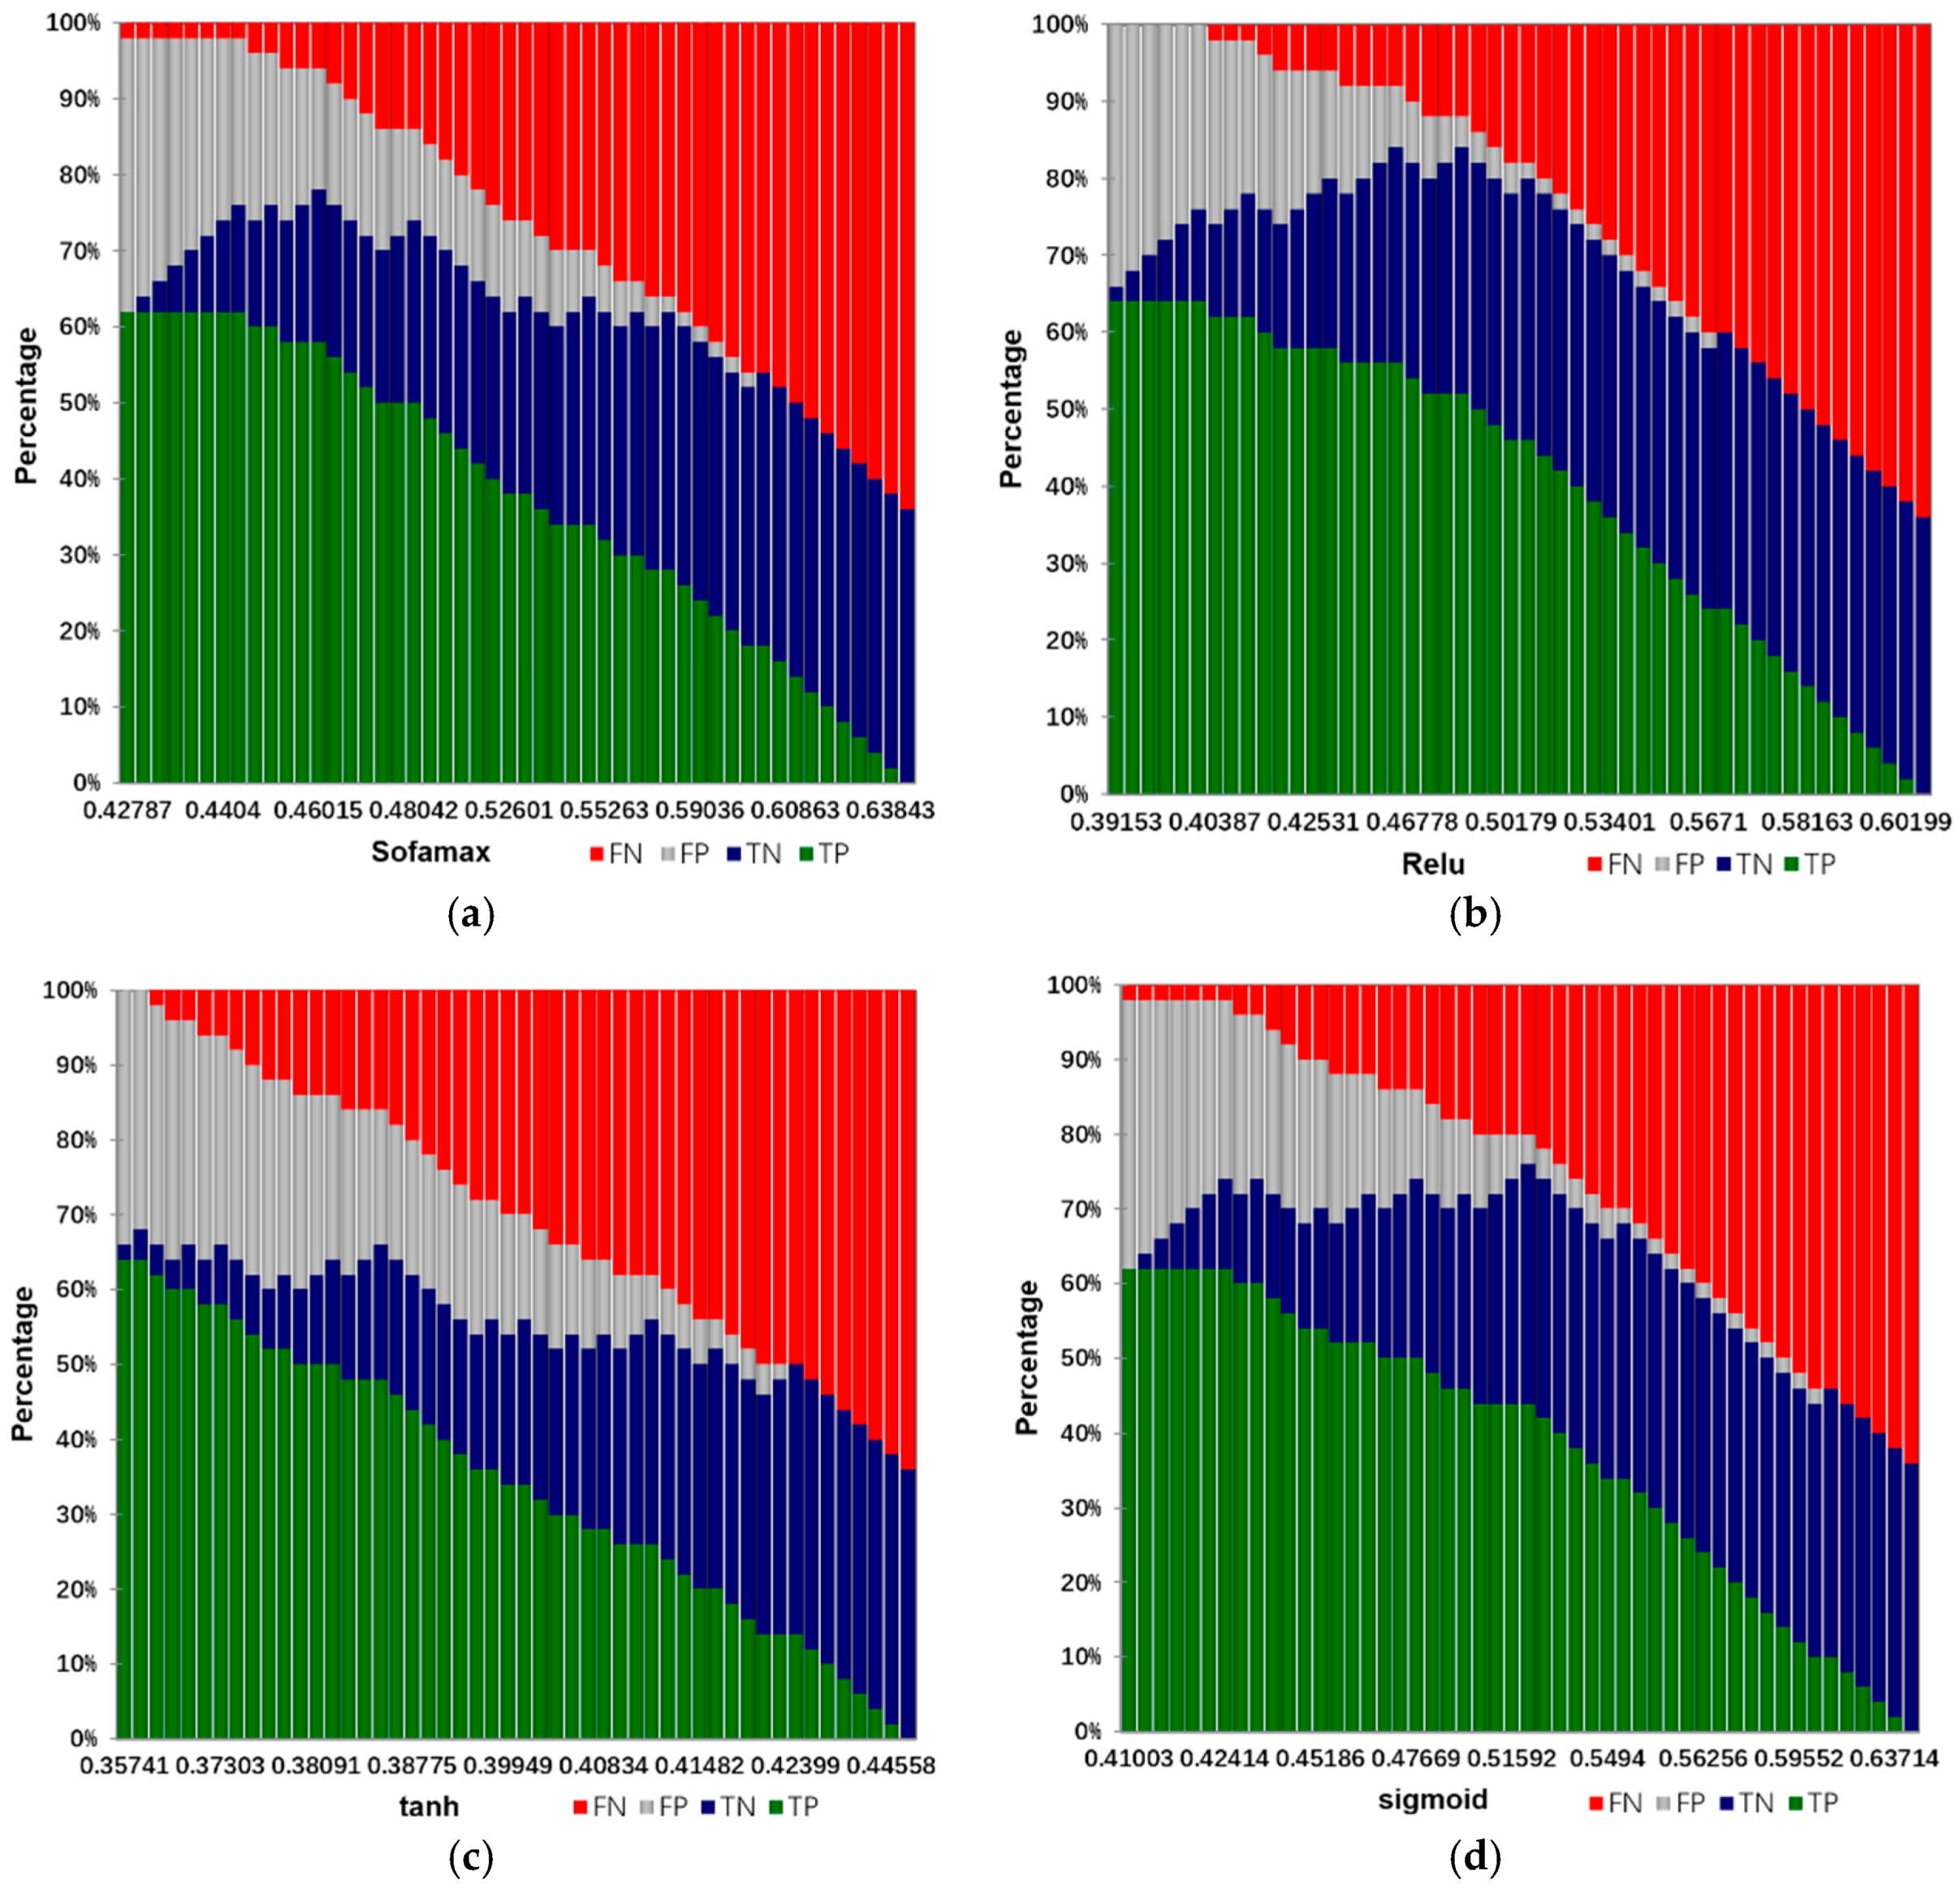
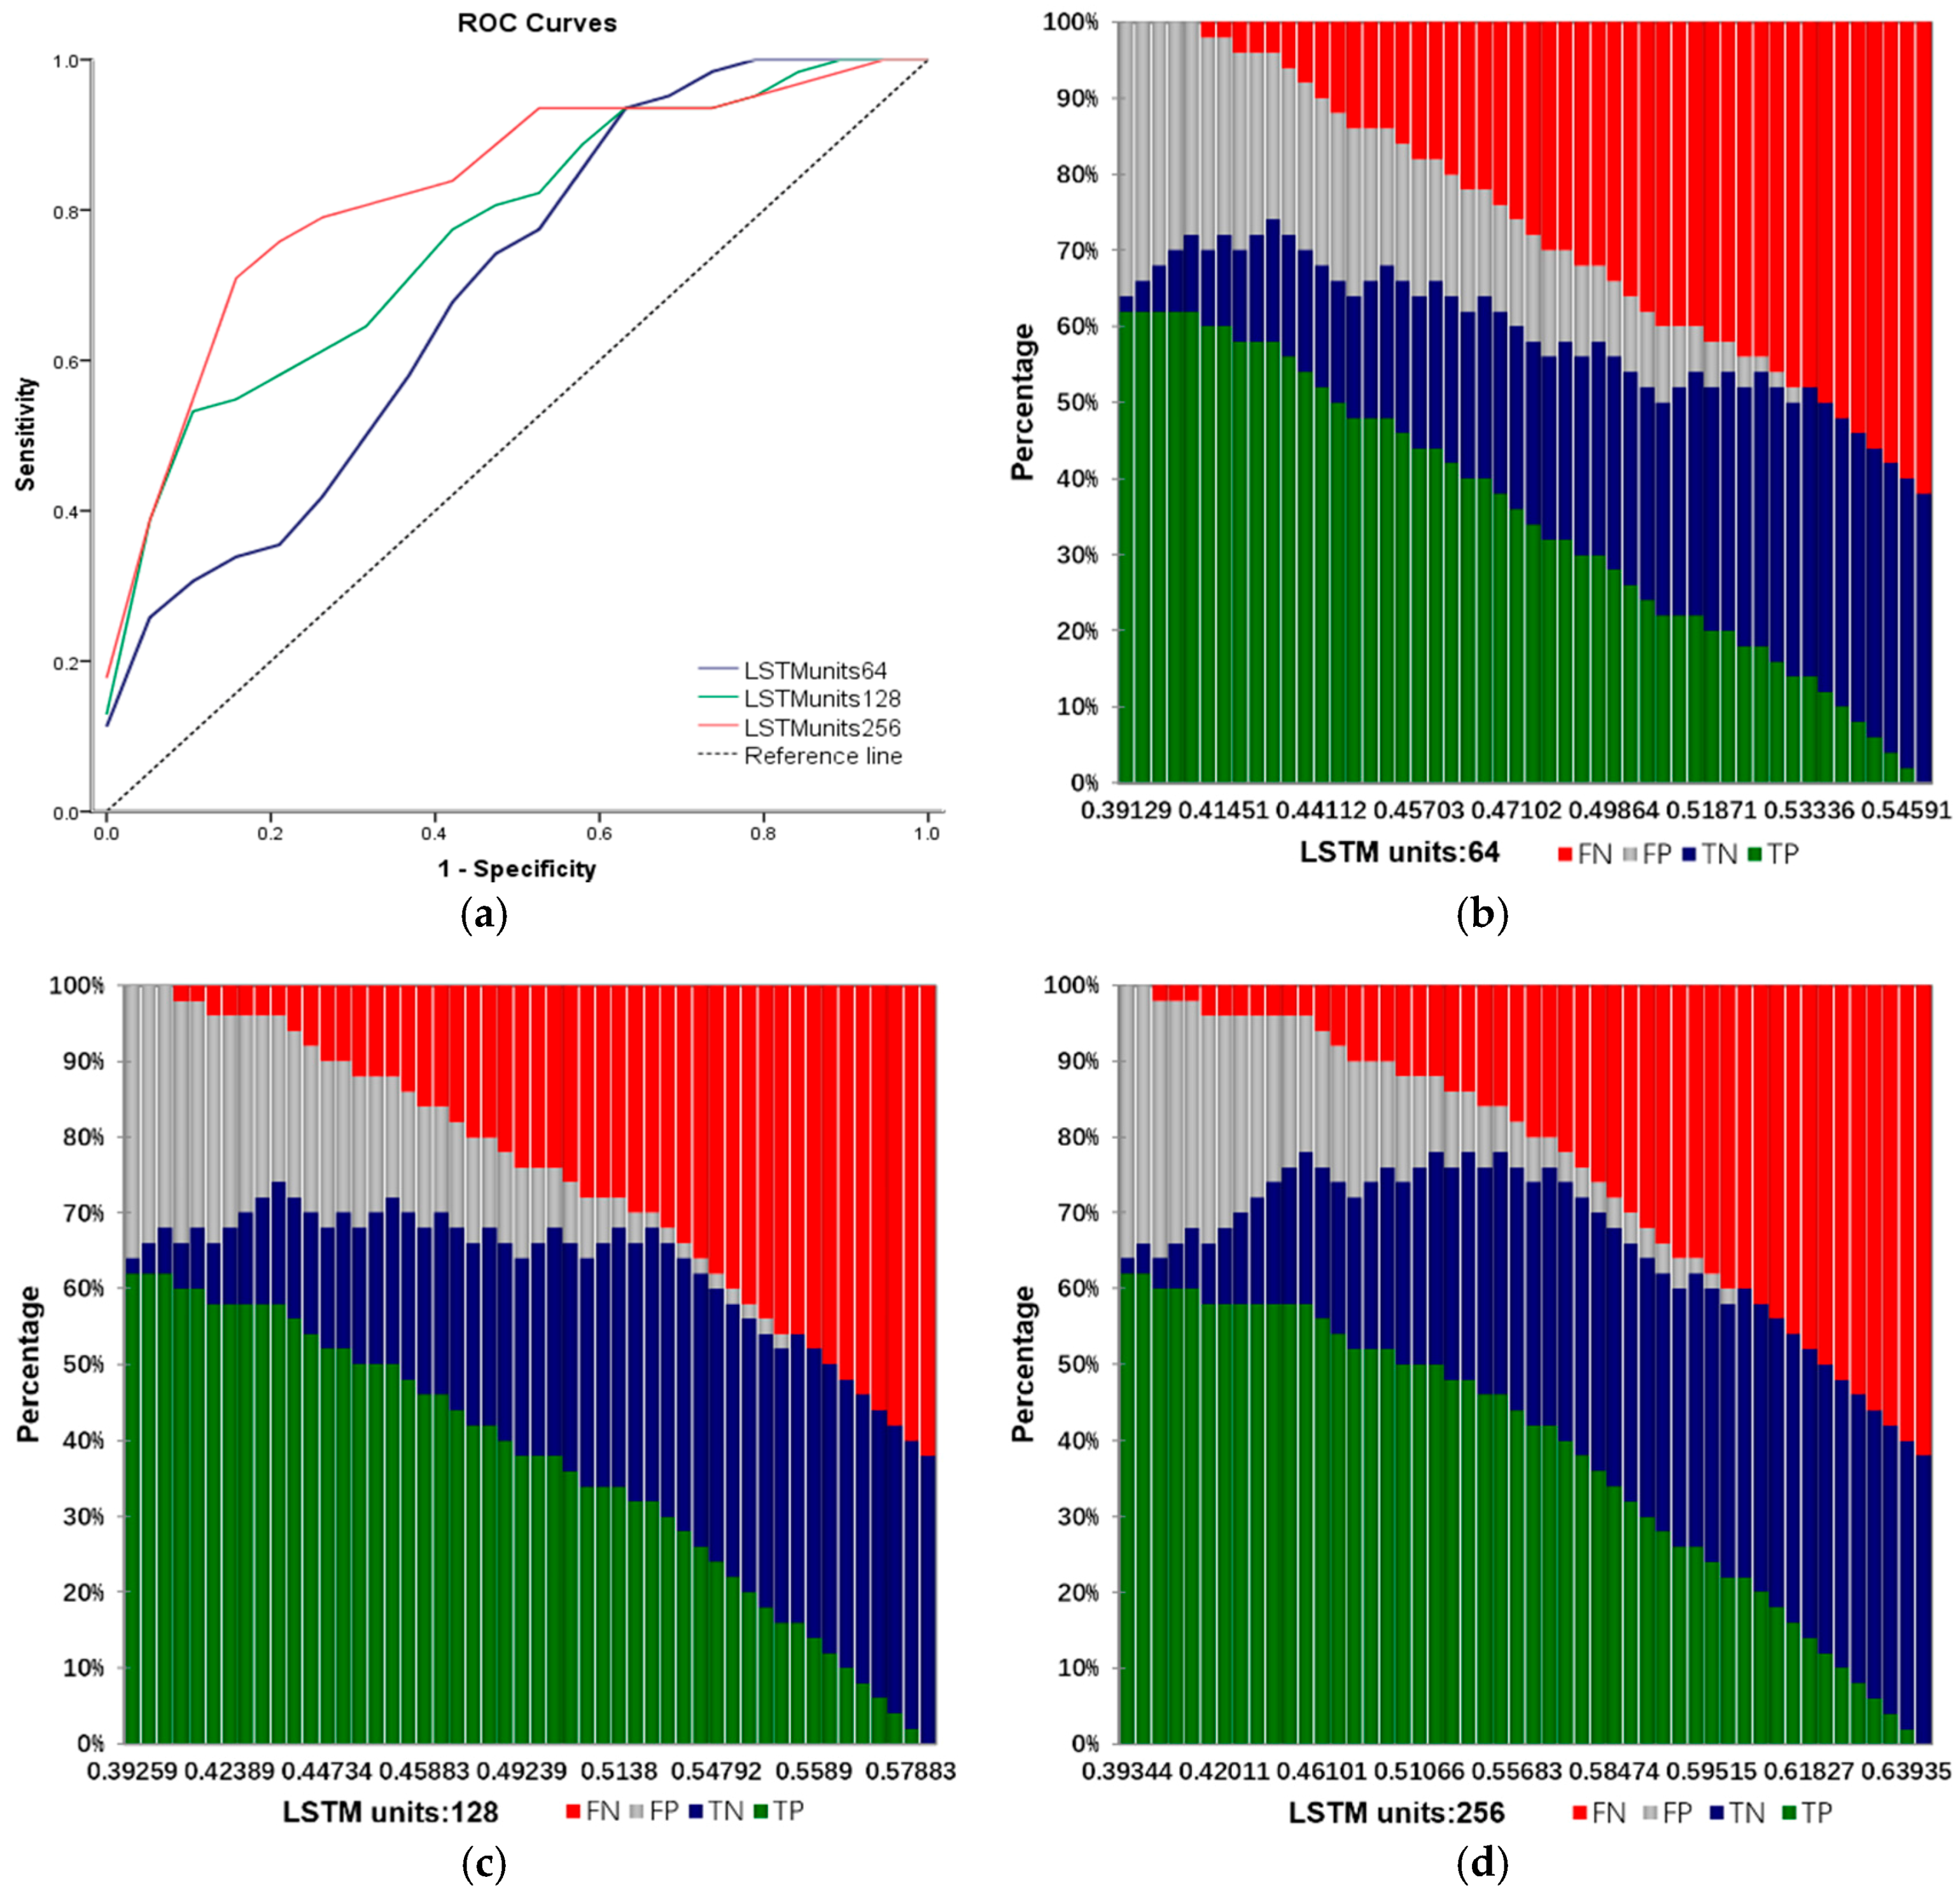
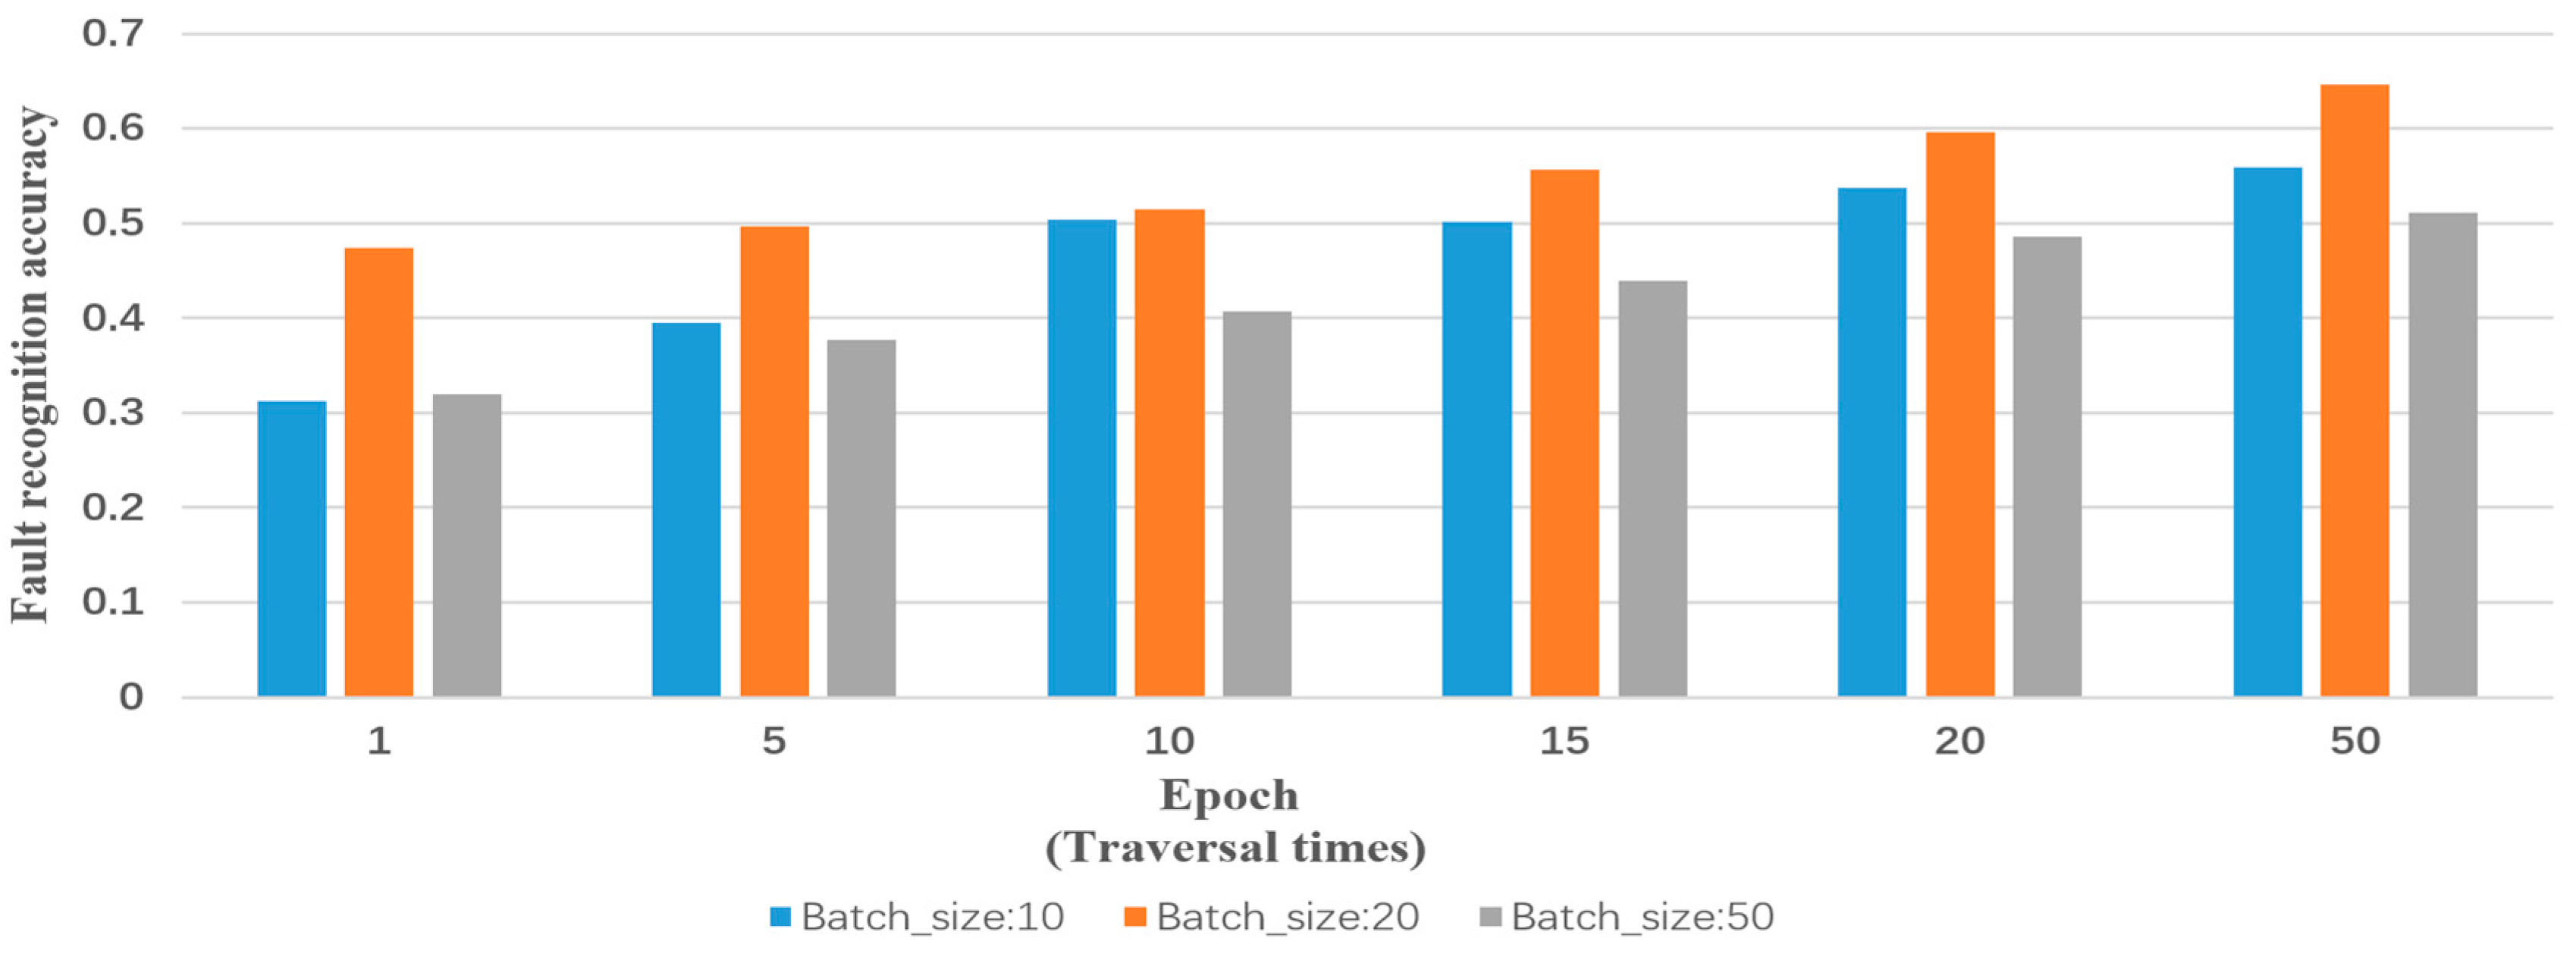
Input: training samples and test sample (including various types of reports and their labels). The number of truncated words: maxlen = 200. Minimum number of words: min_count = 5. The parameters of the model: Dropout = 0.5, Dense = 1. Activation function type: Sofamax, Relu, tanh and sigmoid. Number of LSTM units: 32; 64; 128; 259; 512. Output: classification results and fault recognition accuracy of test samples. Initialization: set all parameters of the model to small random numbers.
Experimental operating environment: operating system: Windows 10; RAM: 32 G; CPU: XeonE5 8-core; graphics: NVIDIA 980M; program computing environment: Theano and Keras.
The process of the training method for RNN-LSTM is presented in Appendix B.

5. Experimental Verification Based on Malfunction Inspection Report

The full learning formula for all the model parameters was elaborated on in the previous section. The training method was described in Section 4. In this section, we will take the power grid malfunction inspection report of a regional power grid in the China Southern Power Grid as the object of analysis. Through RNN-LSTM processing, we can use machine learning to classify and analyze the unstructured data in different situations.

5.1. Database

The description of the corpus is as follows. The malfunction inspection report records come in from the grid personnel by the inspection of the power grid equipment, lines, and protection devices during daily maintenance. The accumulation of fault-by-statement constitutes the main body of the report. Among them, the information in the malfunction inspection report is mainly composed of six main information bodies such as “DeviceInfo”, “TripInfo”, “Faultinfo”, “DigitalStatus”, “DigitalEvent”, “SettingValue”, and other common information. The TripInfo information body can contain multiple optional FaultInfo information. The FaultInfo information body indicates the current and voltage of the action, and it can clearly reflect and display the fault condition and the operation process through the report. The content source of DeviceInfo information can be a fixed value or a configuration file. The information of Faultinfo, DigitalStatus, DigitalEvent, and SettingValue can be different according to the type of protection or manufacturers. Faultinfo can be used as the auxiliary information of a single action message or as a fault parameter of the whole action group. The contents of each message are as follows:
(1)
DeviceInfo: Description information portion of the recording apparatus.
(2)
TripInfo: Partially records protection action events during the failure process.
(3)
FaultInfo: Records the fault current, fault voltage, fault phase, fault distance and other information in the process of recording the fault.
(4)
DigialStatus: Records the signal before the device into the self-test signal status.
(5)
DigitalEvent: Records the change of events such as the self-test signal during the process of fault protection; all the switches are sorted according to the action time, and the action time and return time are recorded at the same time.
(6)
SettingValue: Records the actual value of the device setting at the fault time.
According to the dynamic fault records of the power system, we divide all the faults into the following five categories and give the corresponding labels after each record: mechanical fault; electrical fault; secondary equipment fault; fault caused by external environment; fault caused by human factors.
We have selected the malfunction inspection report of the China Southern Power Grid for nearly 10 years as the data set of this paper. In the used data set, the specific types of faults and causes of faults, and the percentage of their statistics, are shown in Table 1. A single sample data size range is between 21 kb to 523 kb. Training samples and test samples were randomly selected to ensure the versatility of the model test.
In the semantic analysis, we also analyze the data sets used. In this paper, nine categories were selected to cover the semantic relations among most pairs of entities, and they make no overlap between them. However, there are some very similar relationships that can cause difficulties in recognition tasks, such as Entity-Origin (EO), Entity-Destination (ED), and Content-Container (CC), often appearing in one sample at the same time. Similarly, there are Component-Whole (CW) and Member-Collection (MC). Nine types of relationship profiles and examples are as follows:
(1)
Cause-Effect (CE): Those cancers were caused by radiation exposures.
(2)
Instrument-Agency (IA): Phone operator.
(3)
Product-Producer (PP): A factory manufactures suits.
(4)
Content-Container (CC): A bottle full of honey was weighted.
(5)
Entity-Origin (EO): Letters from foreign countries.
(6)
Entity-Destination (ED): The boy went to bed.
(7)
Component-Whole (CW): My apartment has a large kitchen.
(8)
Member-Collection (MC): There are many trees in the forest.
(9)
Message-Topic (MT): The lecture was about semantics.
The specific distribution of the number of samples in each category is shown in Table 2.

5.2. Result and Analysis

Based on the RNN-LSTM training with massive single-fault samples, the test set is imported for fault-type accuracy testing. In this paper, three variables were selected. By comparing the fault recognition results under three different variables and the fault report, we obtained the fault recognition accuracy. When the other two variables are fixed, the test samples are verified by using different traverse times. These three variables are: number of LSTM units, type of activation unit, batch size. Batch size is the size of each batch processing data and unique training methods of deep learning. The proper adjustment of Batch size not only can reduce the weight adjustment times to prevent over-fitting, also speeding up training.

5.2.1. Fault Recognition Accuracy and Number of LSTM Units

This experiment takes the activation unit and batch size at a constant rate, while the number of LSTM units gradually increases, and improves the number of traversals in the same LSTM units’ number conditions. The number of LSTM training samples is 10,000, and the number of test samples is 3000; the activation unit is a sigmoid; the batch size is 20. The relationship between the accuracy rate and the number of LSTM units is shown in Table 3, and its trend is shown in Figure 10.
As can be observed from Table 3 and Figure 10, when the number of units in the LSTM remains constant, with the increase of the number of traversals, the higher the fault recognition accuracy rate is. When the number of LSTM units is the same, the greater the number of LSTM units, and the better the performances; however, a significant decline in the accuracy rate emerges when the number of LSTM units stays at 512. The reason for the decrease of the accuracy rate is that, as the required data volume increases, if more than 512 LSTM units are needed, the parameters need to be adjusted and optimized.
To further analyze the data, the receiver operating characteristic (ROC) curve system is added to the results. Due to the different performances by different numbers of LSTM units, we repeated experiments under different epoch conditions and chose three worth analyzing: 64, 128, 256. The area under the curve (AUC) reflects the ability of the recognition algorithm to correctly distinguish two types of targets. The larger the AUC is, the better the performance of the algorithm is. False negative (FN), false positive (FP), true negative (TN), and true positive (TP) are important parameters in the ROC curve. Specificity is defined as the true negative rate (TNR), and sensitivity is defined as the true positive rate (TPR). In the following experiment, the threshold was set to 0.5. The test was positive if the accuracy of the fault recognition under different activation units was higher than the threshold value. As can be seen from Table 4 and Figure 11, in the proposed algorithm, the performance of the algorithm tends to be better in a certain interval with the increase of the number of LSTM units.

5.2.2. Fault Recognition Accuracy and Activation Unit Type

This experiment keeps the number of LSTM units and the batch size at a constant rate, while selecting four different activation units, and improving the number of traversals in the same activation unit conditions. The number of LSTM training samples is 10,000, and the number of test samples is 3000; the number of LSTM units is 128; the batch size is 20. The relationship between the accuracy rate and the different activation units is shown in Table 5, and its trend is shown in Figure 12.
As can be observed from Table 5 and Figure 12, under the same activation unit condition, with the increase of the number of traversals, the fault recognition accuracy is higher. With the same number of traversals, the use of Sofamax and the sigmoid activation unit will obtain a better accuracy, the Relu’s performance followed. It can be seen that the greater the number of traversals, the Relu and sigmoid performances become closer, but the results obtained using the tanh change are not obvious. Thus, in the choice of activation function, Sofamax and sigmoid are more suitable for text processing.
We also selected the above four activation functions for ROC analysis by repeated experiments under different epoch conditions. In the following experiment, threshold was set to 0.5. The test was positive if the accuracy of the fault recognition under different activation units was higher than the threshold value. As can be seen from Table 6 and Figure 13 and Figure 14, Sofamax and sigmoid activation performed the best. It also confirms the above conclusions.

5.2.3. Accuracy of Fault Recognition and Batch Size

This experiment keeps the number of LSTM units and the activation unit at a constant rate, while the single-batch processing data size gradually increases, and improves the number of traversals in the same batch size condition. The number of LSTM training samples is 10,000, and the number of test samples is 3000; the number of LSTM units is 128; and the activation unit is sigmoid. The relationship between the accuracy rate and the different batch sizes is shown in Table 7, and its trend is shown in Figure 15.
As can be observed from Table 7 and Figure 15, under the same batch size conditions, with the increase of the number of traversals, the fault recognition accuracy is higher. With the same number of traversals, when the batch size was valued at 20, the accuracy was higher than with the other two sizes. When the batch size was valued 10, the accuracy rate increased with the increase of the number of traversals, but the lack of continuous improvement was an under-fitting state. When the batch size was valued at 50, the accuracy rate was significantly decreased compared to the previous two sizes, as too much data in each batch processing caused an over-fitting phenomenon.
We also selected the above three batch sizes for ROC analysis by repeated experiments under different epoch conditions. In the following experiment, the threshold was set to 0.48. The test was positive if the accuracy of the fault recognition under different batch sizes was higher than the threshold value. As can be seen from Table 8 and Figure 16, when the batch size was valued at 20, it performed best. However, when the batch size was valued at 50, the overall ROC curve tended to be smoother. It should be noted that, for different datasets showing different characteristics, the batch size should not have a fixed range of selection. As the inspection report requires a certain word length that can express the corresponding characteristics, the best value for the batch size is 20.
In this paper, three key parameters are selected as experimental variables, and the experimental results can be reflected: the unstructured data processing method based on RNN-LSTM proposed in this paper can achieve the current research level in machine learning when it is applied to malfunction inspection reports. This means that this method can provide a more effective way for grid inspectors to deal with unstructured text.

6. Conclusions

How to efficiently handle large numbers of unstructured text data such as malfunction inspection reports is a long-standing problem faced by operation engineers. This paper proposes a deep learning method for malfunction inspection report processing by using the text data mining–oriented RNN-LSTM. An effective training strategy for an effective RNN-LSTM network for modeling inspection data is presented. From the obtained results, and an effectiveness analysis, it was demonstrated that RNN-LSTM, especially with target replication, can successfully classify diagnoses of labeled malfunction inspection reports given unstructured data. It is emphasized that the experiment via different variables can be reflected in the configuration of key variables in how we should select parameters to achieve optimal results, including the selection of the maximum LSTM unit number, the processing capacity of the activation unit and the prevention of over-fitting. In this paper, we used fault labels without timestamps, but we are obtaining timestamped diagnoses, which will enable us to train models to perform early fault diagnosis by predicting future conditions in a larger inspection data set.

Acknowledgments

The authors are grateful for the projects supported by the National Natural Science Foundation of China No. 51477121 and the China Southern Power Grid No. GZ2014-2-0049.

Author Contributions

Daqian Wei, Gang Lin and Bo Wang designed the main parts of the study, including RNN-LSTM modeling and the implementation of the algorithms, the neural network training process and the experiments. Daqian Wei, Gang Lin and Hesen Liu mainly contributed to the writing of the paper. Yilu Liu was responsible for guidance, a number of key suggestions, and manuscript editing. Zhaoyang Dong and Dichen Liu were also responsible for some constructive suggestions.

Conflicts of Interest

The authors declare no conflict of interest.

Appendix A. The Detailed Description of Recurrent Neural Network

Appendix A.1. Forward Propagation

u = W x h × x
h t = t a n h ( W h h × h t 1 + u ) = t a n h ( z t + u )
u = W h y × h
y = u
where u is the input of the hidden layer, h is the output of the hidden layer, u is the input of the output layer, y is the input of the input layer, and because the output layer is linear, y = u . Specific calculation of each neuron is as follows:
u i = j = 1 V W x h ( i , j ) × x j
z i t = j = 1 H W h h ( i , j ) × h j t 1
h i = t a n h ( u i + z i t )
u i = j = 1 H W h y ( i , j ) × h j
y i = u i

Appendix A.2. Loss Function

There are two kinds of loss function: quadratic error function and cross-entropy error function. Assuming that t is the true value of the training sample, y is the output of the neural network, and a training sample is ( x , t ) .
(1) Quadratic error function
E ( t , y ) = 1 2 ( t y ) 2
(2) Cross-entropy error function
E ( t , y ) = [ t ln ( y ) + ( 1 t ) ln ( 1 y ) ]
When the activation function does not adopt through the output layer of the neural network, the quadratic error function should be used, which can give relatively fast gradient parameter estimation. If the output layer uses the sigmoid activation function, we use the cross-entropy error function to estimate the parameters. As long as the sigmoid activation function is selected, the cross-entropy error function can be used to eliminate the sigmoid function at the time of derivation, which can speed up the gradient descent.
(3) Partial derivation of error to the output of the output layer
(a) Quadratic error function
E y = y 1 2 ( t y ) 2 = y t
(b) Cross-entropy error function
E y = y ( [ t ln ( y ) + ( 1 t ) ln ( 1 y ) ] ) = t y + 1 t 1 y = t ( 1 y ) + y ( 1 t ) y ( 1 y ) = y t y ( 1 y )
(4) Partial derivation of error to the input of the output layer
(a) Linear output layer
If the output layer is without an activation function, the different cost functions are solved separately: E u = E y .
(b) Sigmoid output layer
Calculate the derivative of the error on input to the output layer, z denotes the input to the output layer, z = u , y = s i g m o i d ( z ) . In the neural network, the error of the output layer is defined as the derivative of the loss function to the input layer, denoted by δ L .
Sigmoid function: σ ( x ) = 1 1 + e x , where the partial derivative of the sigmoid function is: σ ( x ) x = σ ( x ) ( 1 σ ( x ) ) .
δ L = E z = E y y z = y t y ( 1 y ) y z = y t y ( 1 y ) σ ( z ) ( 1 σ ( z ) ) = y t y ( 1 y ) y ( 1 y ) = y t

Appendix A.3. Back Propagation

(1) Partial derivation of the error to the input of the output layer.
E y i = y i 1 2 ( t i y i ) 2 = y i t i
Matrix obtained:
E y = y 1 2 ( t y ) 2 = y t
(2) Partial derivation of the error to the output of the output layer
If the output layer does not use the activation function, then u i = y i
E u i = E y i = y i t i
Matrix obtained:
E u = E y = y t
(3) Partial derivative of the error to W h y
E W h y ( i , j ) = E u i u i W h y ( i , j ) = ( y i t i ) W h y ( i , j ) ( j = 1 H W h y ( i , j ) h j ) = ( y i t i ) h j
Matrix obtained:
E W h y = E y H T
(4) Partial derivation of the error to the hidden layer output
Since h is affected by the following two Equations (A21) and (A22), when calculating the partial derivative of the loss function to the hidden layer output, it is necessary to compute the partial derivatives of h with respect to both formulas.
h i t + 1 = t a n h ( u i t + z i t ) , z i t = j = 1 H W h h ( i , j ) h j t 1 , u i = j = 1 V W x h ( i , j ) x j
u i = j = 1 H W h h ( i , j ) h j
The matrix of Equation (A21): u i t + 1 = u i t + z i t , u t + 1 = W h h h t + W h x x , d n e x t is defined as the partial derivative of the error to the hidden layer input at the next moment.
E h i = k = 1 V E u k u k h i = k = 1 V E y k u k h i = k = 1 V ( y k t k ) u k h i = k = 1 V ( y k t k ) W h y ( k , i )
d h n e x t = E h i t = j = 1 H E u j t + 1 u j t + 1 h i t = j = 1 H E u j t + 1 h i t ( i = 1 H W h h ( j , i ) h i t + i = 1 V W x h ( j , i ) x i ) = j = 1 H E u j t + 1 ( h i t i = 1 H W h h ( j , i ) h i t + h i t i = 1 V W x h ( j , i ) x i ) = j = 1 H E u j t + 1 ( h i t i = 1 H W h h ( j , i ) h i t + 0 ) = j = 1 H E u j t + 1 ( W h h ( j , i ) + 0 ) = j = 1 H E u j t + 1 W h h ( j , i )
Matrix obtained:
d h n e x t = W h h T E u
E h = W h y T E u + d h n e x t
E h = W h y T E y + d h n e x t
(5) Partial derivation of the loss function to the hidden layer input
E u i = E h i h i u i = E h i u i ( t a n h ( u i ) ) = E h i ( 1 ( t a n h ( u i ) 2 ) )
Matrix obtained:
E u = ( 1 h h ) E h
(6) Partial derivation of the error to W x h
E W x h ( i , j ) = u i u i W x h ( i , j ) = u i W x h ( i , j ) ( j = 1 V W x h ( i , j ) x j ) = u i x j
As known u i = j = 1 V W x h ( i , j ) x j , matrix obtained:
E W x h = E u x T
(7) Partial derivation of the error to W h h ( i , j )
E W h h ( i , j ) = E u i u i W h h ( i , j ) = u i t W h h ( i , j ) ( i = 1 H W h h ( j , i ) h i t 1 + i = 1 V W x h ( j , i ) x i ) = u i t ( W h h ( i , j ) i = 1 H W h h ( j , i ) h i t 1 + W h h ( i , j ) i = 1 V W x h ( j , i ) x i ) = u i t ( W h h ( i , j ) i = 1 H W h h ( j , i ) h i t 1 + 0 ) = u i t h i t 1
where u i t = i = 1 H W h h ( j , i ) h i t 1 + i = 1 V W x h ( j , i ) x i , matrix obtained:
E W h h = E u ( h t 1 ) T
By calculating the partial derivatives of all the parameter matrices with respect to the errors, the parameters can be updated according to the gradient descent of the partial derivatives.
E W h y = E y H T
E W x h = E u x T
E W h h = E u ( h t 1 ) T
E u = ( 1 h h ) E h
E h = W h y T E y + d h n e x t
d h n e x t = W h h T E u

Appendix B. The Process of the Training Method for RNN-LSTM

The forward pass process of the training method is shown in Table A1.
Table A1. Forward pass process.
Process 1: Forward Pass
input units: y = current external input;
roll over: activation: y ^ = y ; cell state: s ^ c j v = s c j v ;
  Loop over memory blocks, indexed j
  Step 1a: input gates (1):
   n e t i n j = m w i n j m y ^ m + v = 1 S j w i n j c j v s ^ c j v ; y i n j = f i n j ( n e t i n j ) ;
  Step 1b: forget gate (2):
   n e t φ j = m w φ j m y ^ m + v = 1 S j w φ j c j v s ^ c j v ; y φ j = f φ j ( n e t φ j ) ;
  Step 1c: the cell states (3):
  Loop over the S j cells in blocks j , index v
    { n e t c j v = m w c j v m y ^ m ; s c j v = y φ j s ^ c j v + y i n j g ( n e t c j v ) };
  Step 2:
  Output gate activation (4):
   n e t o u t j = m w o u t j m y ^ m + v = 1 S j w o u t j c j v s c j v ; y o u t j = f o u t j ( n e t o u t j ) ;
  Cell outputs (5):
  Loop over the S j cells in block j , indexed v
    { y c j v = y o u t j s c j v };
End loop over memory blocks
Output units (6): n e t k = m w k m y m ; y k = f k ( n e t k ) ;
The partial derivatives process of the training method is shown in Table A2.
Table A2. Partial derivatives process.
Process 2: Partial Derivatives
Loop over memory blocks, index j
  {Loop over the S j cells in block j , indexed v
    {Cells, ( d S c m j v : = s c j v w c j v m ) :
     d S c m j v = d S c m j v y φ j + g ( n e t c j v ) y i n j y ^ m ;
    Input gates, d S i n , m j v : = s c j v w i n j m , d S i n , c j v j v : = s c j v w i n j c j v ;
     d S i n , m j v = d S i n , m j v y φ j + g ( n e t c j v ) f i n j ( n e t i n j ) y ^ m ;
    Loop over peephole connections from all cells, indexed v
      { d S i n , c j v j v = d S i n , c j v j v y φ j + g ( n e t c j v ) f i n j ( n e t i n j ) s ^ c v ;};
      Forget gates, ( d S φ m j v : = s c j v w φ j m , d S φ c j v j v : = s c j v w φ j c j v )
       d S φ m j v = d S φ m j v y φ j + s ^ c j v f φ j ( n e t φ j ) y ^ m ;
      Loop over peephole connections from all cells, indexed v
        { d S φ c j v j v = d S φ c j v j v y φ j + s ^ c j v f φ j ( n e t φ j ) s ^ c v ;}}}
End loops over cells and memory blocks
The backward pass process of the training method is shown in Table A3.
Table A3. Backward pass process.
Process 3: Backward Pass (If Error Injected)
Errors and δ S :
Injected error: e k = t k y k ;
δ S of output units: δ k = f k ( n e t k ) e k ;
  Loop over memory blocks, indexed j
    { δ S of output gates:
     δ o u t j = f o u t j ( n e t o u t j ) ( v = 1 S j s c j v k w k c j v δ k ) ;
    Internal state error:
    Loop over the S j cells in blocks j , indexed v
      { e s c j v = y o u t j ( k w k c j v δ k ) ;}}
End loop over memory blocks
The weight updates process of the training method is shown in Table A4.
Table A4. Weight updates process.
Process 4: Weight Updates
Output units: Δ w k m = α δ k y m ;
Loop over memory blocks, indexed j
  {Output gates:
   Δ w o u t , m = α δ o u t y ^ m ; Δ w o u t , c j v = α δ o u t s c j v ;
  Input gates:
   Δ w i n , m = α v = 1 S j e s c j v d S i n , m j v ;
  Loop over peephole connections from all cells, indexed v
    { Δ w i n , c j v = α v = 1 S j e s c j v d S i n , c j v j v ;}
  Forget gates:
   Δ w φ m = α v = 1 S j e s c j v d S φ m j v ;
  Loop over peephole connections from all cells, indexed v
    { Δ w φ c j v = α v = 1 S j e s c j v d S φ c j v j v ;}
  Cells:
  Loop over the S j cells in block j , indexed v
    { Δ w c j v m = α e s c j v d S c m j v ;}}
End loop over memory blocks

References

  1. Besnard, F.; Bertling, L. An approach for condition-based maintenance optimization applied to wind turbine blades. IEEE Trans. Sustain. Energy 2010, 1, 77–83. [Google Scholar] [CrossRef]
  2. Ahmad, R.; Kamaruddin, S. An overview of time-based and condition-based maintenance in industrial application. Comput. Ind. Eng. 2012, 63, 135–149. [Google Scholar] [CrossRef]
  3. Carita, A.J.Q.; Leita, L.C.; Junior, A.P.P.M.; Godoy, R.B.; Sauer, L. Bayesian networks applied to failure diagnosis in power transformer. IEEE Lat. Am. Trans. 2013, 11, 1075–1082. [Google Scholar]
  4. Su, H.; Li, Q. A hybrid deterministic model based on rough set and fuzzy set and Bayesian optimal classifier. In Proceedings of the First International Conference on Innovative Computing, Information and Control (ICICIC), Beijing, China, 30 August–1 September 2006; Volume 2, pp. 175–178.
  5. Zheng, G.; Yongli, Z. Research of transformer fault diagnosis based on Bayesian network classifiers. In Proceedings of the International Conference Computer Design and Applications (ICCDA), Qinhuangdao, China, 25–27 June 2010; Volume 3, pp. 382–385.
  6. Tang, W.H.; Spurgeon, K.; Wu, Q.H.; Richardson, Z.J. An evidential reasoning approach to transformer condition assessments. IEEE Trans. Power Deliv. 2004, 19, 1696–1703. [Google Scholar] [CrossRef]
  7. Li, J.; Chen, X.; Wu, C. Power transformer state assessment based on grey target theory. In Proceedings of the International Conference Measuring Technology and Mechatronics Automation, Zhangjiajie, China, 11–12 April 2009; Volume 2, pp. 664–667.
  8. Ma, H.; Ekanayake, C.; Saha, T.K. Power transformer fault diagnosis under measurement originated uncertainties. IEEE Trans. Dielectr. Electr. Insul. 2012, 19, 1982–1990. [Google Scholar] [CrossRef]
  9. Shintemirov, A.; Tang, W.; Wu, Q.H. Power transformer fault classification based on dissolved gas analysis by implementing bootstrap and genetic programming. IEEE Trans. Syst. Man Cybern. Part C Appl. Rev. 2009, 39, 69–79. [Google Scholar] [CrossRef]
  10. Koley, C.; Purkait, P.; Chakravorti, S. Wavelet-aided SVM tool for impulse fault identification in transformers. IEEE Trans. Power Deliv. 2006, 21, 1283–1290. [Google Scholar] [CrossRef]
  11. Miranda, V.; Castro, A.R.G.; Lima, S. Diagnosing faults in power transformers with autoassociative neural networks and mean shift. IEEE Trans. Power Deliv. 2012, 27, 1350–1357. [Google Scholar] [CrossRef]
  12. Wu, H.R.; Li, X.H.; Wu, D.N. RMP neural network based dissolved gas analyzer for fault diagnostic of oil-filled electrical equipment. IEEE Trans. Dielectr. Electr. Insul. 2011, 18, 495–498. [Google Scholar] [CrossRef]
  13. Wang, M.H. A novel extension method for transformer fault diagnosis. IEEE Trans. Power Deliv. 2003, 18, 164–169. [Google Scholar] [CrossRef]
  14. Reshmy, A.K.; Paulraj, D. An efficient unstructured big data analysis method for enhancing performance using machine learning algorithm. In Proceedings of the International Conference on Circuit, Power and Computing Technologies (ICCPCT), Nagercoil, India, 19–20 March 2015; pp. 1–7.
  15. Yuanhua, T.; Chaolin, Z.; Yici, M. Semantic presentation and fusion framework of unstructured data in smart cites. In Proceedings of the 10th IEEE Conference on Industrial Electronics and Applications (ICIEA 2015), Auckland, New Zealand, 5–17 June 2015; Volume 10, pp. 897–901.
  16. Goth, G. Digging deeper into text mining: Academics and agencies look toward unstructured data. IEEE Internet Comput. 2012, 16, 7–9. [Google Scholar] [CrossRef]
  17. Alifa, N.P.; Saiful, A.; Wikan, D.S. Public facilities recommendation system based on structured and unstructured data extraction from multi-channel data sources. In Proceedings of the International Conference on Data and Software Engineering (ICoDSE), Yogyakarta, Indonesia, 25–26 November 2015; pp. 185–190.
  18. Huang, G.B.; Mattar, M.; Berg, T.; Learned-Miller, E. Labeled faces in the wild: A database for studying face recognition in unconstrained environments. In Proceedings of the Workshop on Faces in ‘Real-Life’ Images: Detection, Alignment, and Recognition, Marseille, France, 12–18 October 2008.
  19. Chen, D.; Cao, X.; Wen, F.; Sun, J. Blessing of dimensionality: High-dimensional feature and its efficient compression for face verification. In Proceedings of the IEEE Conference on Computer Vision and Pattern Recognition (CVPR), Portland, OR, USA, 23–28 June 2013; pp. 3025–3032.
  20. Sun, Y.; Wang, X.; Tang, X. Deeply learned face representations are sparse, selective, and robust. In Proceedings of the IEEE Conference on Computer Vision and Pattern Recognition (CVPR), Boston, MA, USA, 7–12 June 2015; pp. 2892–2900.
  21. Mikolov, T.; Karafiát, M.; Burget, L.; Cernocký, J.; Khudanpur, S. Recurrent neural network based language Model. In Proceedings of the Annual Conference of the International Speech Communication Association, Chiba, Japan, 26–30 September 2010; pp. 1045–1048.
  22. Mikolov, T.; Chen, K.; Corrado, G.; Dean, J. Efficient Estimation of Word Representations in Vector Space. 2013. Available online: arxiv.org/abs/1301.3781 (accessed on 7 Sepember 2013).
  23. Hochreiter, S. Untersuchungen zu Dynamischen Neuronalen Netzen. Master’s Thesis, Technische Universität München, Munich, Germany, 1991. [Google Scholar]
  24. Hochreiter, S.; Bengio, Y.; Frasconi, P.; Schmidhuber, J. Gradient Flow in recurrent nets: The difficulty of learning long-term dependencies. In A Field Guide to Dynamical Recurrent Neural Networks; Kremer, S.C., Kolen, J.F., Eds.; IEEE Press: Piscataway, NJ, USA, 2001. [Google Scholar]
  25. Bengio, Y.; Simard, P.; Frasconi, P. Learning long-term dependencies with gradient descent is difficult. IEEE Trans. Neural Netw. 1994, 5, 157–166. [Google Scholar] [CrossRef] [PubMed]
  26. Hochreiter, S.; Schmidhuber, J. Long short-term memory. Neural Comput. 1997, 9, 1735–1780. [Google Scholar] [CrossRef] [PubMed]
  27. Graves, A.; Mohamed, A.; Hinton, G. Speech recognition with deep recurrent neural networks. In Proceedings of the IEEE International Conference on Acoustics, Speech and Signal Processing (ICASSP), Vancouver, BC, Canada, 26–31 May 2013.
  28. Sak, H.; Senior, A.; Beaufays, F. Long short-term memory recurrent neural network architectures for large scale acoustic modeling. In Proceedings of the Annual Conference of International Speech Communication Association (INTERSPEECH), Singapore, 14–18 September 2014.
  29. Tai, K.S.; Socher, R.; Manning, C.D. Improved Semantic Representations from Tree-Structured Long Short-Term Memory Networks. 2015. Available online: arxiv.org/abs/1503.00075 (accessed on 30 May 2015).
  30. Li, J.; Luong, M.T.; Jurafsky, D. A Hierarchical Neural Autoencoder for Paragraphs and Documents. 2015. Available online: arxiv.org/abs/1506.01057 (accessed on 6 June 2015).
  31. Chanen, A. Deep learning for extracting word-levesl meaning from safety report narratives. In Proceedings of the Integrated Communications Navigation and Surveillance (ICNS), Herndon, VA, USA, 19–21 April 2016; pp. 5D2-1–5D2-15.
  32. Palangi, H.; Deng, L.; Shen, Y. Deep sentence embedding using long short-term memory networks: Analysis and application to information retrieval. IEEE/ACM Trans. Audio Speech Lang. Process. 2016, 24, 694–707. [Google Scholar] [CrossRef]
Figure 1. Recurrent neural network (RNN) basic structure.
Energies 10 00406 g001
Figure 2. Recurrent neural network expansion.
Energies 10 00406 g002
Figure 3. The repeating module in a standard RNN contains a single layer.
Energies 10 00406 g003
Figure 4. The repeating module in a long short-term memory (LSTM) contains four interacting layers.
Energies 10 00406 g004
Figure 5. Neuron state transfer.
Energies 10 00406 g005
Figure 6. Forget gate layer.
Energies 10 00406 g006
Figure 7. Input gate layer.
Energies 10 00406 g007
Figure 8. Neuron status update.
Energies 10 00406 g008
Figure 9. Output gate layer.
Energies 10 00406 g009
Figure 10. Accuracy of fault recognition under different LSTM units.
Energies 10 00406 g010
Figure 11. (a) Comparison of ROC curves under different LSTM unit numbers. The percentage of FN/FP/TN/TP under (b) 64 LSTM units; (c) 128 LSTM units; and (d) 256 LSTM units. FN/FP/TN/TP: false negative/false positive/true negative /true positive.
Energies 10 00406 g011
Figure 12. Accuracy of fault recognition under different activation units.
Energies 10 00406 g012
Figure 13. Comparison of ROC curves under different activation units.
Energies 10 00406 g013
Figure 14. The percentage of FN/FP/TN/TP under the activation unit of (a) Sofamax; (b) Relu; (c) tanh; and (d) sigmoid.
Energies 10 00406 g014
Figure 15. Accuracy of fault recognition under different batch size.
Energies 10 00406 g015
Figure 16. (a) Comparison of ROC curves under different batch sizes. The percentage of FN/FP/TN/TP under batch size (b) 10; (c) 20; and (d) 50.
Energies 10 00406 g016aEnergies 10 00406 g016b
Table 1. Different fault type statistics in the dataset.
Fault CategoryFault ReasonAmountPercentage
Mechanical FaultTurbine cooler fault273625.6%29.2%
Switch mechanism oil leakage3122.9%
Monitor computer fault390.3%
Low air pressure of equipment440.4%
Electrical FaultCircuit breakers, disconnectors fault337531.3%43.5%
Capacitor fault5024.7%
Unbalanced voltage and current4294.0%
Arrester fault870.8%
Voltage and current transformer fault1261.2%
Battery fault550.6%
Insulators blew970.9%
Fault caused by human factorsWire facilities or referrals stolen4324.0%4.0%
Fault caused by external environmentLines and trees are too close199118.6%18.6%
Secondary equipment faultElectromagnetic locking fault550.6%4.7%
Remote control fault4454.1%
Test sample321730%
Training sample750870%
Total10725100%
Table 2. Statistical distribution of relationship categories in samples.
RelationSample QuantityProportion of Sample
Cause-Effect (CE)133112.4%
Instrument-Agency (IA)125311.7%
Product-Producer (PP)113710.6%
Content-Container (CC)9749.1%
Entity-Origin (EO)9488.8%
Entity-Destination (ED)9238.6%
Component-Whole (CW)8958.4%
Member-Collection (MC)7326.8%
Message-Topic (MT)6606.2%
Other187217.4%
Total10725100%
Table 3. Accuracy of fault recognition under different LSTM units.
Epoch (Traversal Times)Number of LSTM Units
3264128256512
10.360450.382960.388470.419470.34154
50.418320.434410.465470.476690.38457
100.420520.489520.489520.507120.38457
150.476330.499030.500580.539640.39541
200.476330.505670.508560.585850.37854
300.498170.538110.535850.586840.36845
500.525760.538110.542730.610580.39574
Table 4. Area under the curve (AUC) analysis of receiver operating characteristic (ROC) curves under different LSTM unit numbers.
Number of LSTM UnitsAUCStandard ErrorLower Bound (95%)Upper Bound (95%)
640.69940.07850.54560.8533
1280.77240.06660.64190.9030
2560.83190.05880.71650.9473
Table 5. Accuracy of fault recognition under different activation units.
Epoch (Traversal Times)Activation UnitActivation UnitActivation UnitActivation Unit
SofamaxRelutanhSigmoid
10.427970.408680.379740.41947
50.480420.452590.396840.47669
100.526690.504780.357410.50712
200.595720.581630.405870.58585
Table 6. AUC analysis of ROC curves under different activation units.
Activation UnitAUCStandard ErrorLower Bound (95%)Upper Bound (95%)
Sofamax0.88890.04770.79530.9824
Relu0.77430.06920.63860.9099
tanh0.62670.08170.46650.7868
sigmoid0.79160.06670.66070.9225
Table 7. Accuracy of fault recognition under different batch sizes.
Epoch (Traversal Times)Batch Size: 10Batch Size: 20Batch Size: 50
10.311890.473690.31947
50.394510.496870.37669
100.503210.514760.40712
150.501470.556840.43964
200.536970.595480.48585
500.558760.645870.51058
Table 8. AUC analysis of ROC curves under different batch sizes.
Batch SizeAUCStandard ErrorLower Bound (95%)Upper Bound (95%)
100.69960.07730.54810.8512
200.91070.03860.83490.9865
500.88140.04770.78780.9751

