Article

Exploring the Micromechanical Sliding Behavior of Typical Quartz Grains and Completely Decomposed Volcanic Granules Subjected to Repeating Shearing

by
Chitta Sai Sandeep
and
Kostas Senetakis
*
Department of Architecture & Civil Engineering, City University of Hong Kong, Kowloon Tong, Hong Kong, China
*
Author to whom correspondence should be addressed.
Energies 2017, 10(3), 370; https://doi.org/10.3390/en10030370
Submission received: 15 January 2017 / Revised: 12 March 2017 / Accepted: 13 March 2017 / Published: 15 March 2017
(This article belongs to the Special Issue Unconventional Natural Gas (UNG) Recoveries)

Abstract

:
The micromechanical behavior at grain contacts subjected to tangential and normal forces is of major importance in geotechnical engineering research and practice. The development of the discrete element method (DEM) over the past three decades necessitated a more systematic study on the experimental grain contact behavior of real soil grains as DEM simulations use as input tangential and normal load–displacement relationships at grain contacts. In this study, experimental results conducted at the City University of Hong Kong are presented exploring the tangential load–displacement behavior of geological materials. The focus of the study is to explore the possible effect of repeating the shearing test to the same grains on the inter-particle coefficient of friction accounting for the level of the applied normal load. Additionally, the study reports on the frictional behavior of different geological materials including quartz sand grains, denoted as Leighton Buzzard sand (LBS) in the study and completely decomposed volcanic granules denoted as CDV. Quartz grains may find applications as proppant in petroleum engineering, whilst the CDV granules consisted of a material taken from a recent landslide in Hong Kong, whose applications are related to debris flow. Through the micromechanical sliding experiments, the inter-particle coefficient of friction was quantified following shearing paths of about 60 to 200 microns. While at the smallest vertical load of 1 N, there was not observed a notable effect of the repeating shearing for the LBS grains, it was noticed that for small to medium vertical loads, between 2 and 5 N, the repeating shearing reduced the friction at the contacts of the LBS grains. This trend was clear between the first and second shearing, but additional cycles did not further alter the frictional response. However, at greater vertical loads, between 7 and 10 N, the results showed a continuous increase in the dynamic inter-particle friction for the LBS grains with repeating shearing. It was also noticed that at 7 and 10 N of vertical load, there was absence of a peak state in the tangential force–displacement plot, whereas a peak state was observed at smaller loads particularly for the first shearing cycle. These observations might be explained by the possible plowing effects at greater vertical loads which resulted in an increase of the inter-particle coefficient of friction when the shearing test was repeated. For the CDV granules, only the first shearing cycle gave a peak state and, in general, the effect of repeating the shearing was small but with an increase of the inter-particle friction from the first to the second cycle. Overall, during the repeating shearing the LBS grains had a dynamic inter-particle coefficient of friction that ranged between about 0.18 and 0.38, but the CDV granules exhibited much greater friction with values that corresponded to the steady state sliding that ranged between 0.54 and 0.66 . The observed trends in the study might be due to mechanisms that take place at the atomic level and the possible more pronounced distortion of the surfaces for the CDV granules which are much softer than the LBS grains.

1. Introduction

The quantification of the behavior of geomaterials at their contacts has been the subject of a few experimental efforts over the past decades. From the first works published in 1960s and 1970s, for example by Horn and Deere [1] or Procter and Barton [2], to recent studies by Cole et al. [3], Cavarretta et al. [4], Senetakis et al. [5,6,7] or Nardelli et al. [8] some discrepancies with respect to the measured friction at the interface of geological materials have been noticed. Previous works had a particular focus on the development of laboratory apparatus quantifying the frictional response at the interface of geological materials, for example the studies by Cavarretta [4] or Yang et al. [9]. However, the inter-particle stiffness could not be captured in laboratory tests until the recent works by Cole et al. [3] and Senetakis et al. [6,7]. This might be because of limitations of the capabilities of those laboratory systems to quantify micro-quantities at the contacts of grains which would require extremely high resolution of forces and displacements on the onset of about half a micron of shearing path. These difficulties were overcame in recent research works, for example the studies by Senetakis and Coop [10,11], allowing measurements of micro-quantities at very small sliding displacements to be conducted quantifying properly friction and stiffness of geological materials through grain-to-grain sliding tests.
Recent developments in discrete element modeling (DEM) of particulate media [12] necessitated more advanced experimental facilities to be developed in order to provide a quantification of variable properties at the grain scale. This would further advance modelers to develop, for example, more precise contact mechanics models [13,14]. Thus, the development of micromechanical type facilities that allow experimental testing of small sand grains at their contacts following the sphere-sphere (or grain-to-grain) type became a necessity throughout the last years.
Two of the key properties at the grain scale are the inter-particle coefficient of friction and contact response at the interfaces of grains, with immediate applications in modeling the behavior and understanding the micro-mechanisms of granular materials [15,16]. Other applications may be found in petroleum engineering technologies and the energy sector [9,17], deep ground engineering and geothermal engineering [18] as well as understanding energy dissipation mechanisms and damping in soils [19,20] or understanding the mechanisms and modeling stability problems in geotechnical engineering, for example related to landslides [21]. Overall, the understanding of surface properties, processes, interactions and contact mechanics of geological interfaces may be considered as a fundamental step in a variety of problems and applications in geomechanics which are beyond the soil mechanics applications. As an example can be considered the study of fluid flow through the ground [22,23]. In this case, the deformability and response of geological surfaces is crucial affecting partly the porous size and distribution of fractured and particulate media.
In this study, preliminary results are presented exploring the inter-particle coefficient of friction at the contacts of different types of geological materials which would find different applications in engineering practice. One type consisted of quartz sand grains which are typical materials used as fracturing proppant [9]. The second type consisted of a geo-material taken from a landslide which is closer to applications related to debris flows. In their previous works, Senetakis et al. [5,6] and Senetakis and Coop [10,11] investigated the behavior of quartz type grains subjected to repeating loading. In this paper, the study on the frictional response of geological materials and the role of repeating loading were extended conducting tests in a wider range of normal forces. This allowed a study into the possible effect of the magnitude of the applied confining force as well as the study of different types of geological materials with substantially different properties and morphological characteristics. On the other hand, the previous works exploring the behavior of sand grain contacts [5,6] were more limited on that a narrow range of normal forces were considered.

2. Materials, Experimental Methods and Program
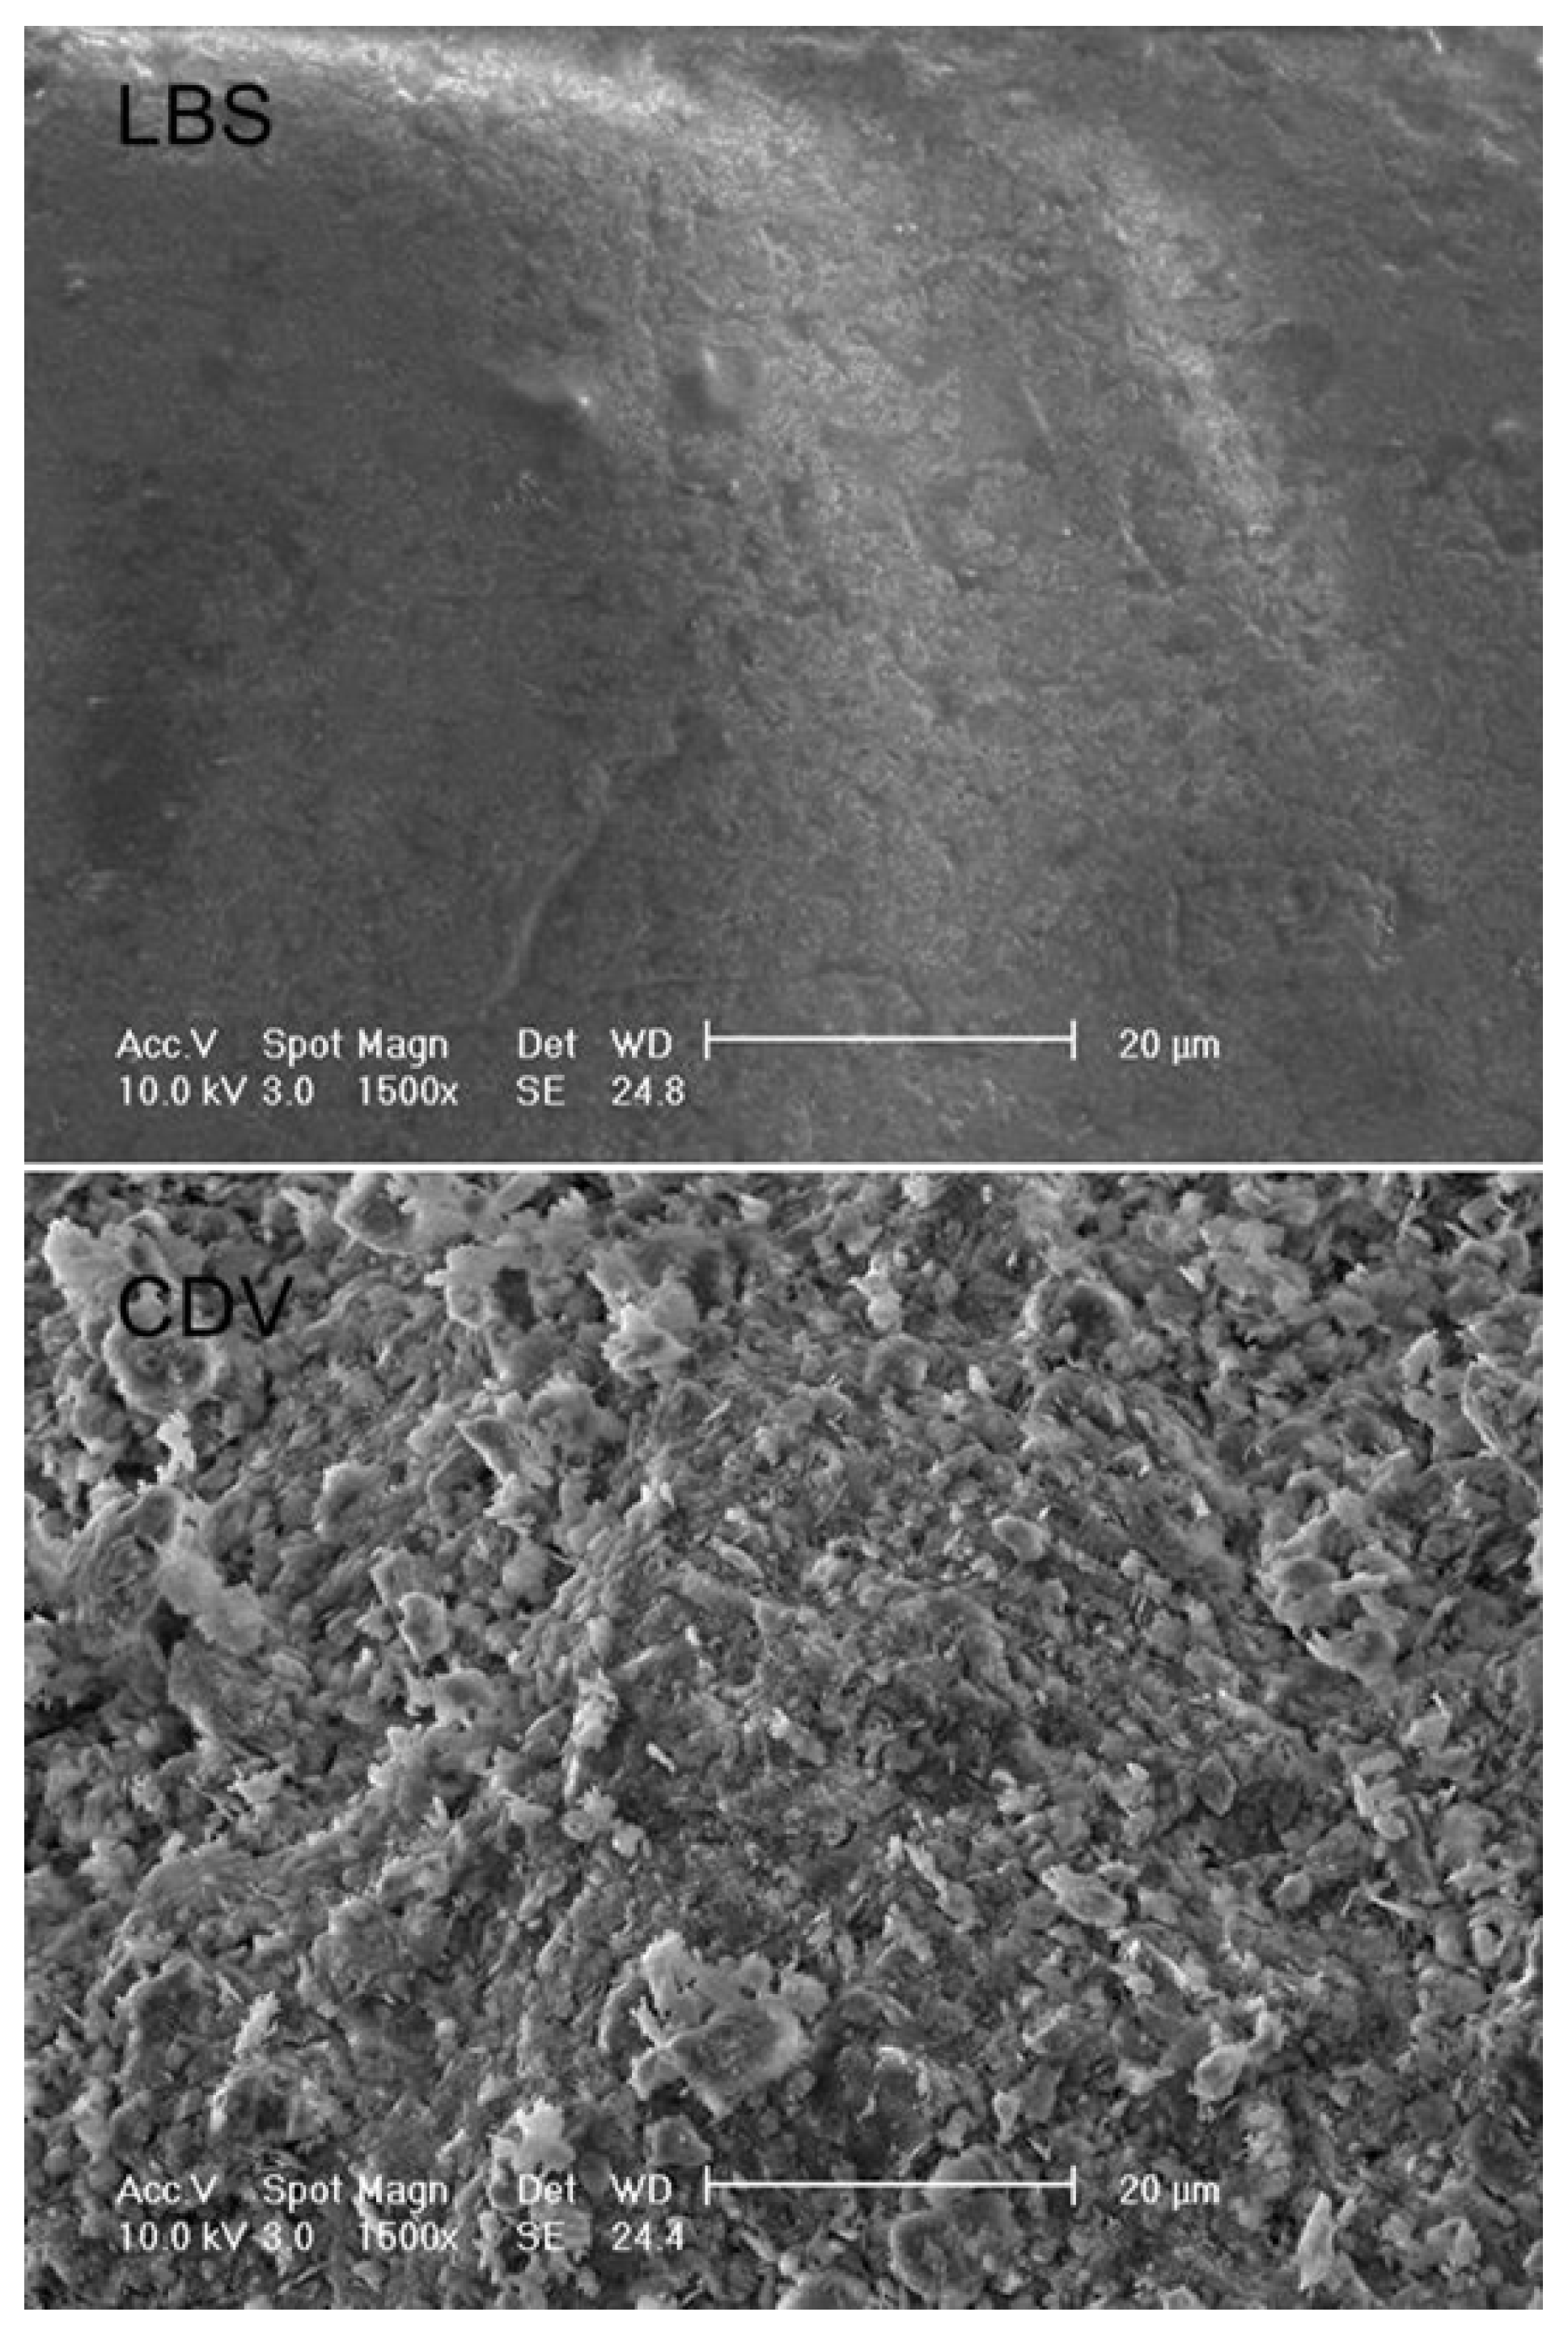
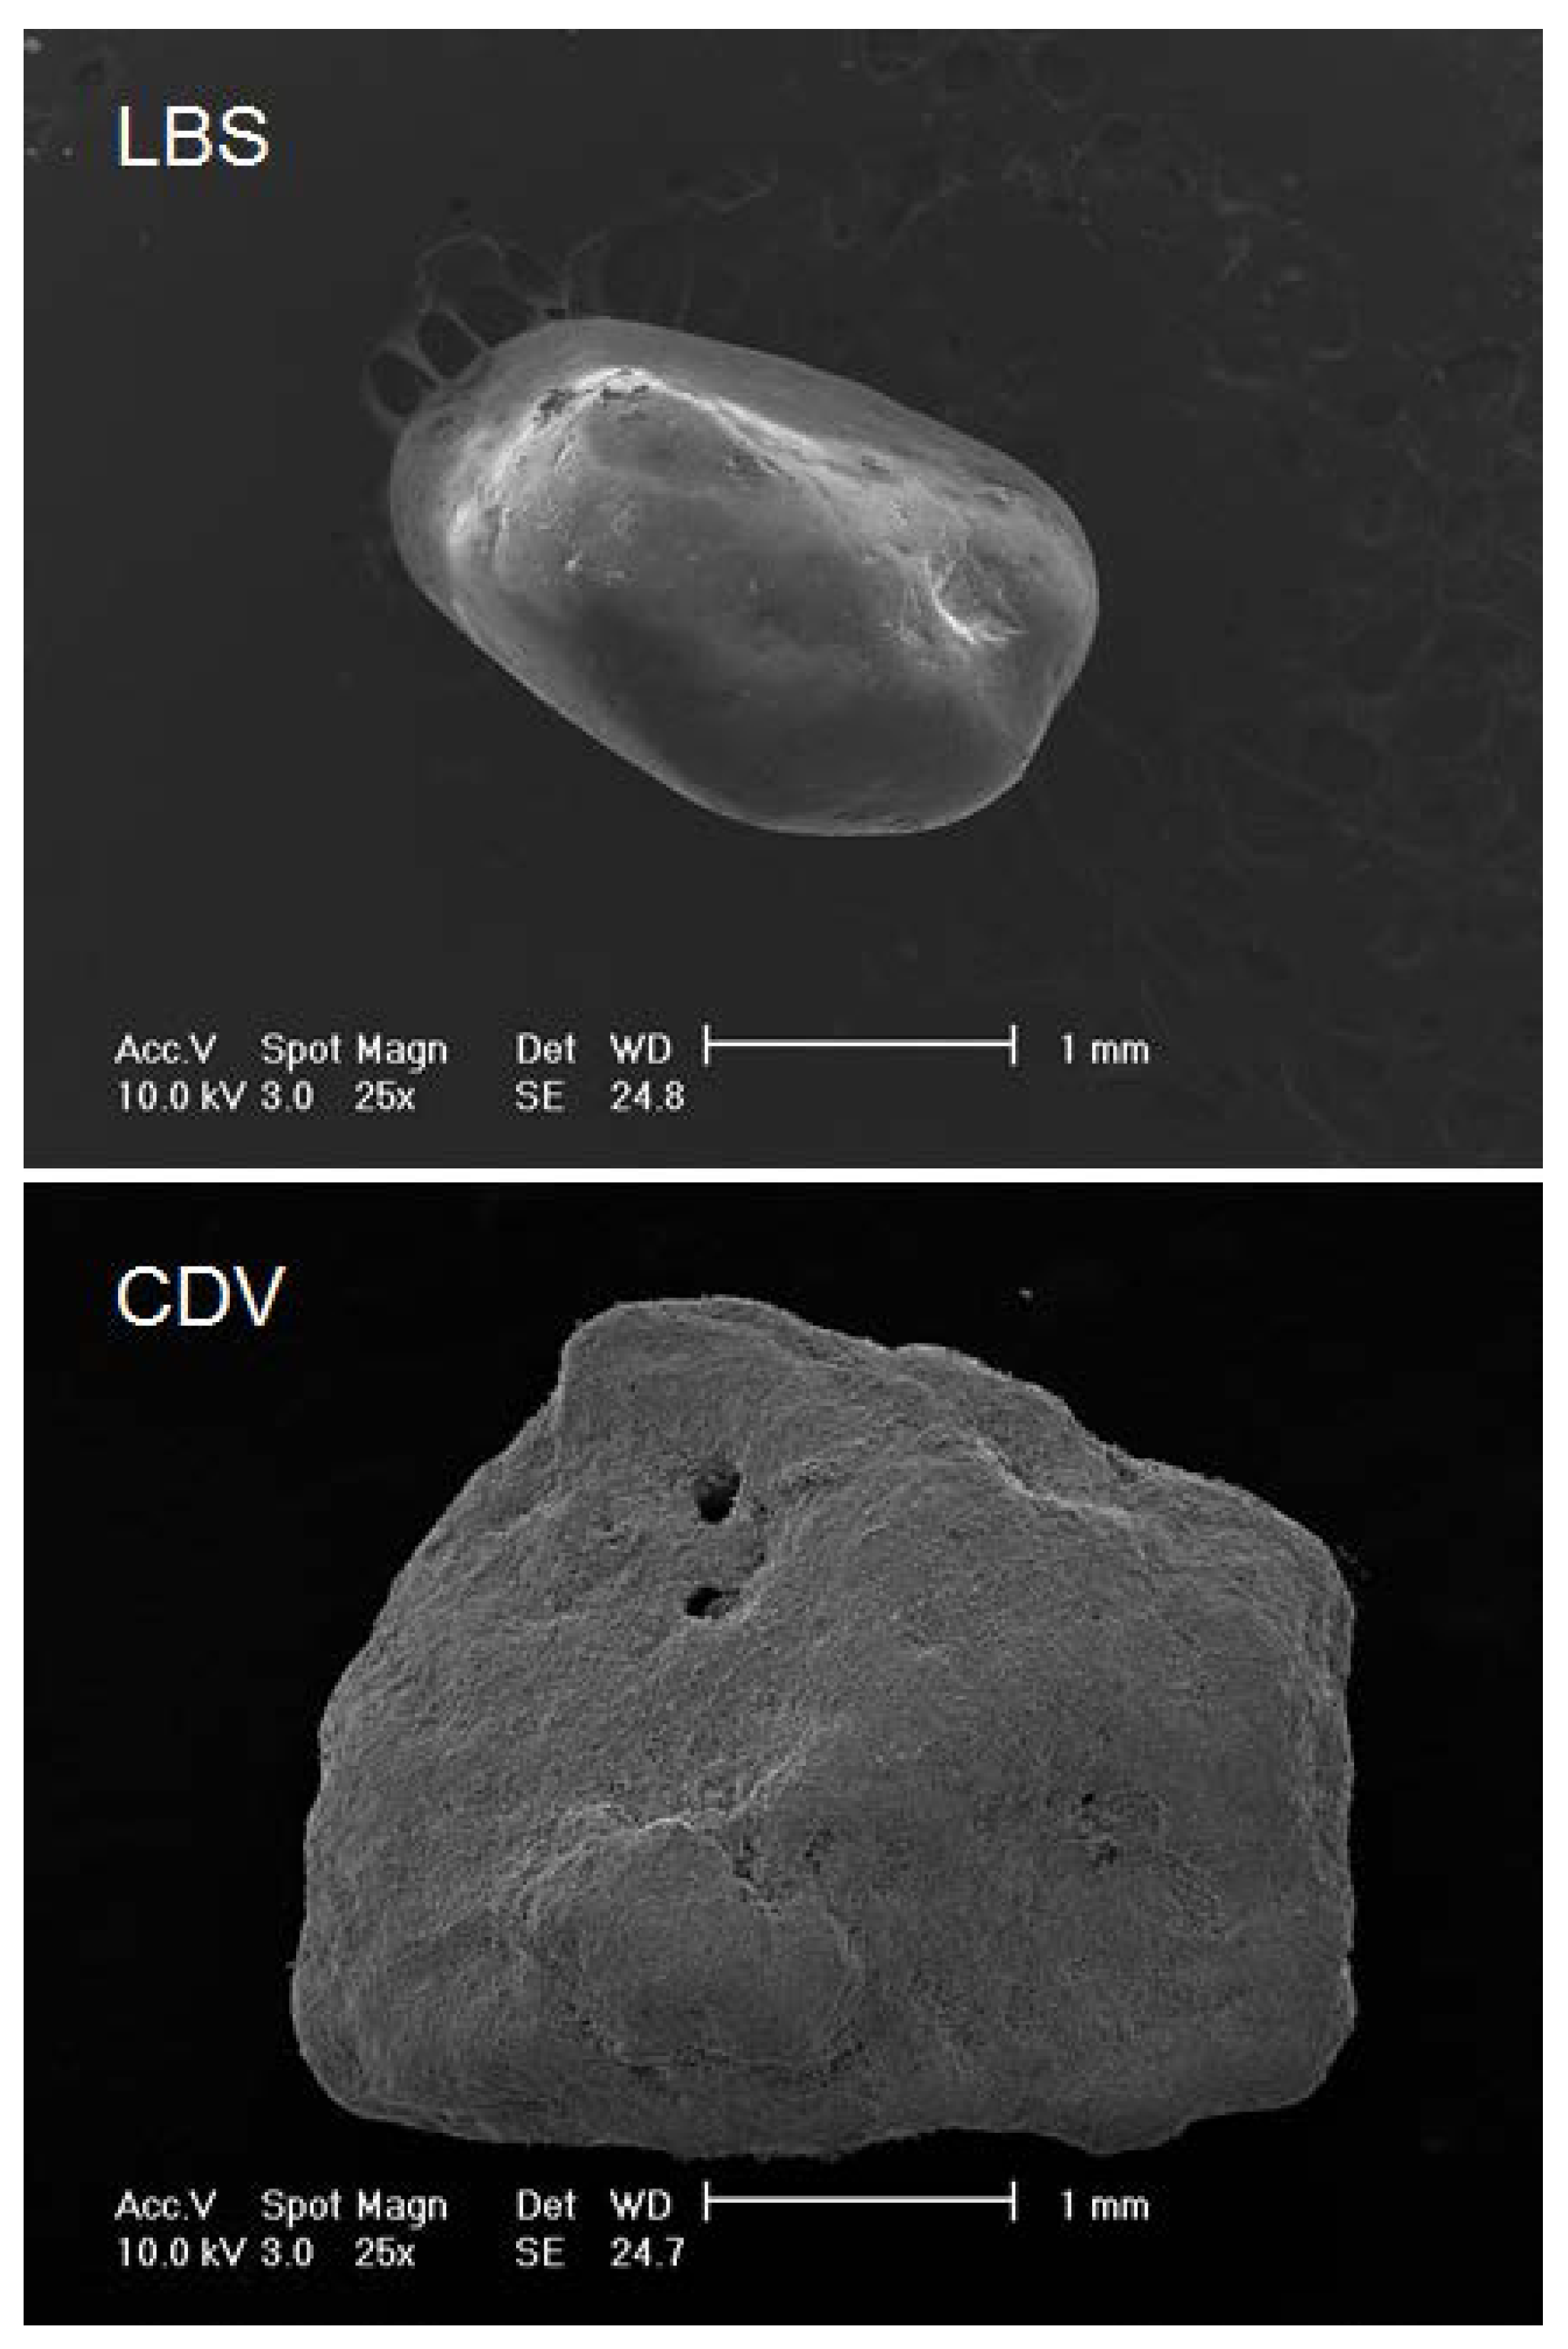
2.1. Materials

Two different geological materials were used in the study; Leighton Buzzard sand (LBS) which is a quartz sand of relatively smooth surface and consistent characteristics and completely decomposed volcanic (CDV) granules which are rougher and softer than the LBS grains. Senetakis et al. [5] quantified the root mean square deviation of the heights of the surface (roughness) denoted as Sq using white light interferometry for the LBS grains. Based on a number of tests on a representative set of LBS grains, they reported an average value of Sq equal to 0.38 microns. Scanning electron microscope (SEM) image of a typical LBS grain included in the study is given in Figure 1 (top image). The LBS grains tested in the study are relatively rounded with a size between about 2 to 3 mm. A close view of the surface of a representative LBS grain is given in Figure 2 (top image), which image was taken from SEM analysis which clearly indicated that the surface of the grain is relatively smooth. The CDV granules were taken from the bottom of a recent landslide in Hong Kong. SEM images of a representative CDV granule are given in Figure 1 and Figure 2 (bottom images). These images indicated that the CDV granules have much rougher surface than the LBS grains, relatively angular shape and a size between about 2 to 3 mm for the particular grains included in this study.

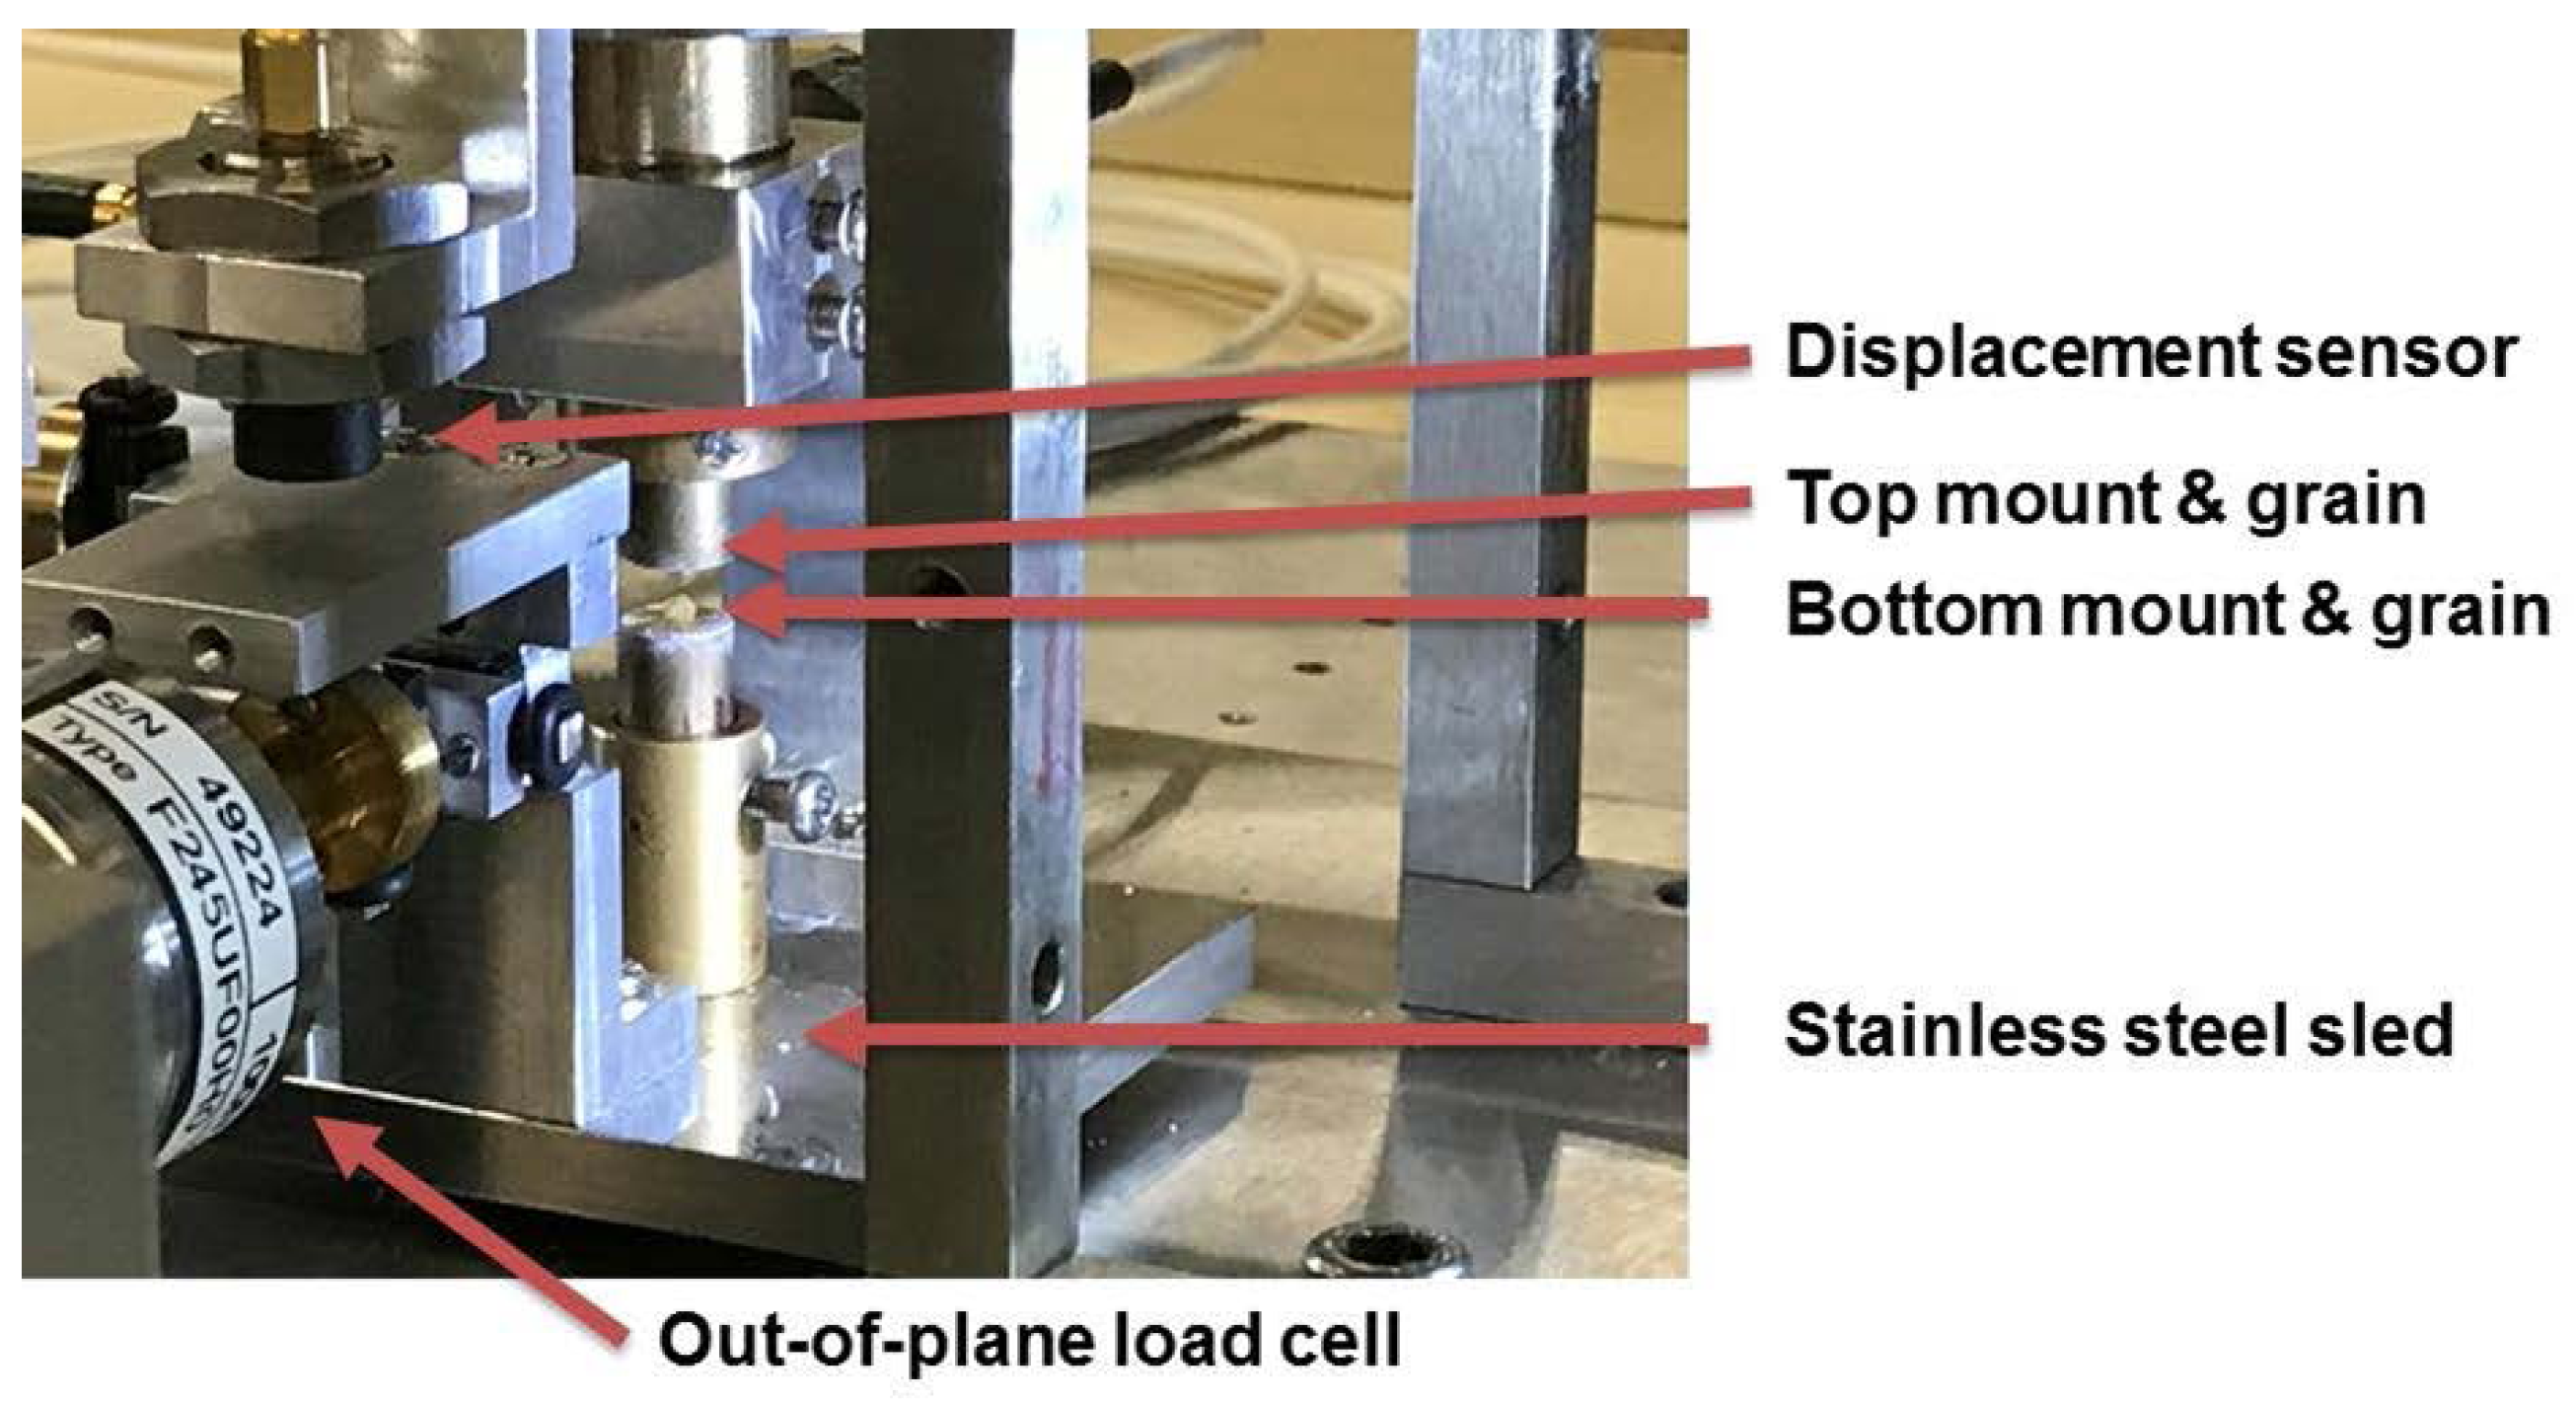
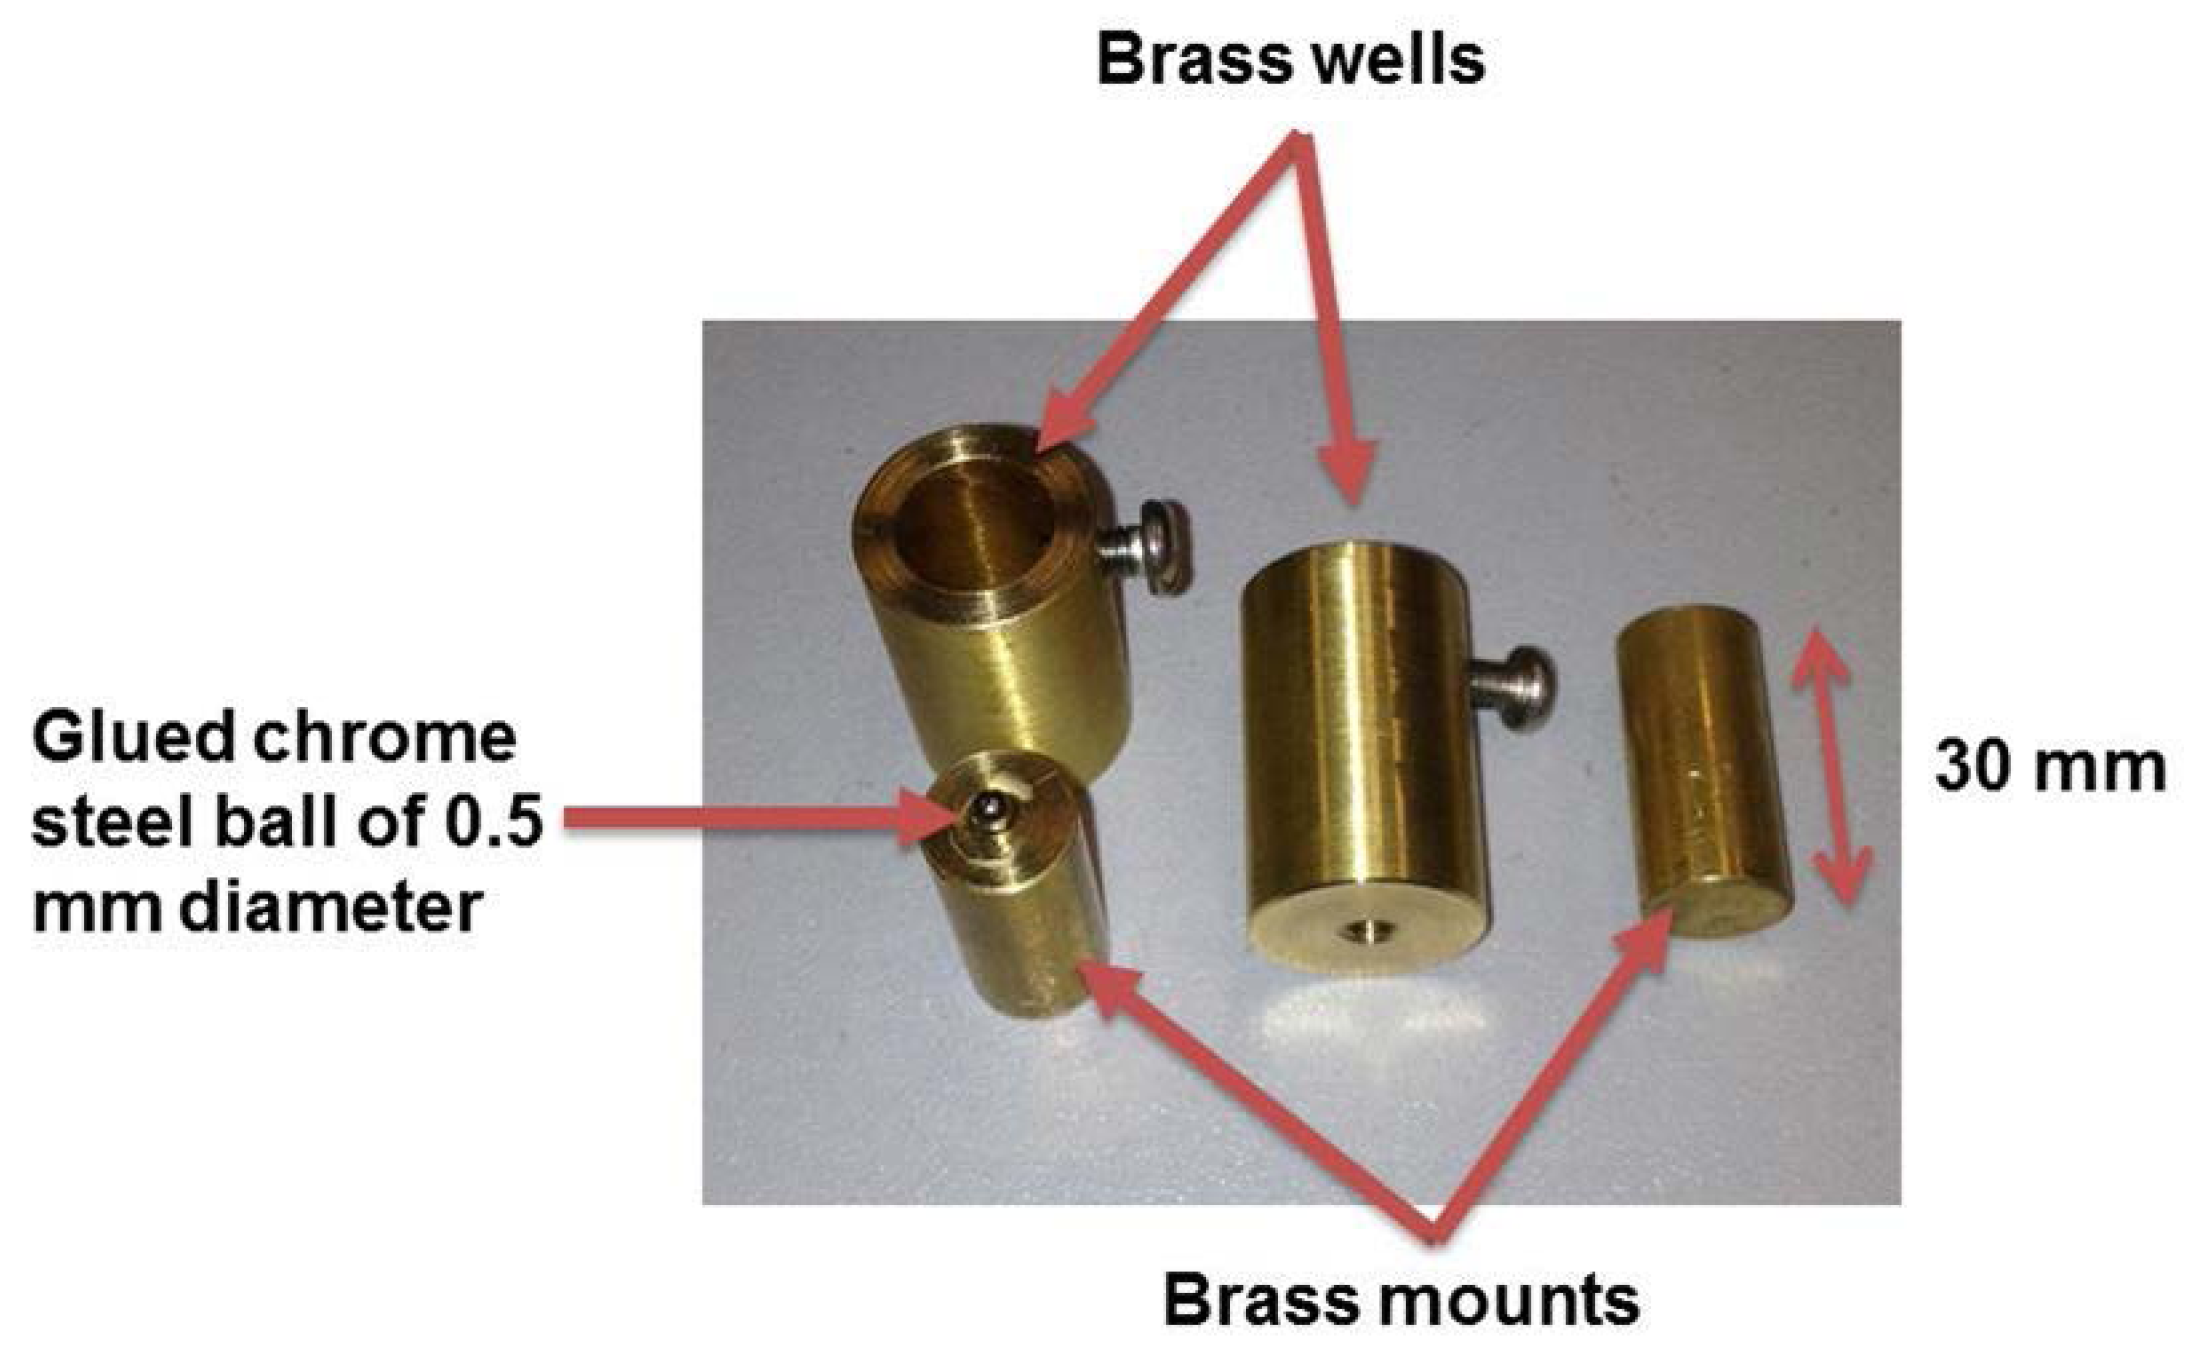
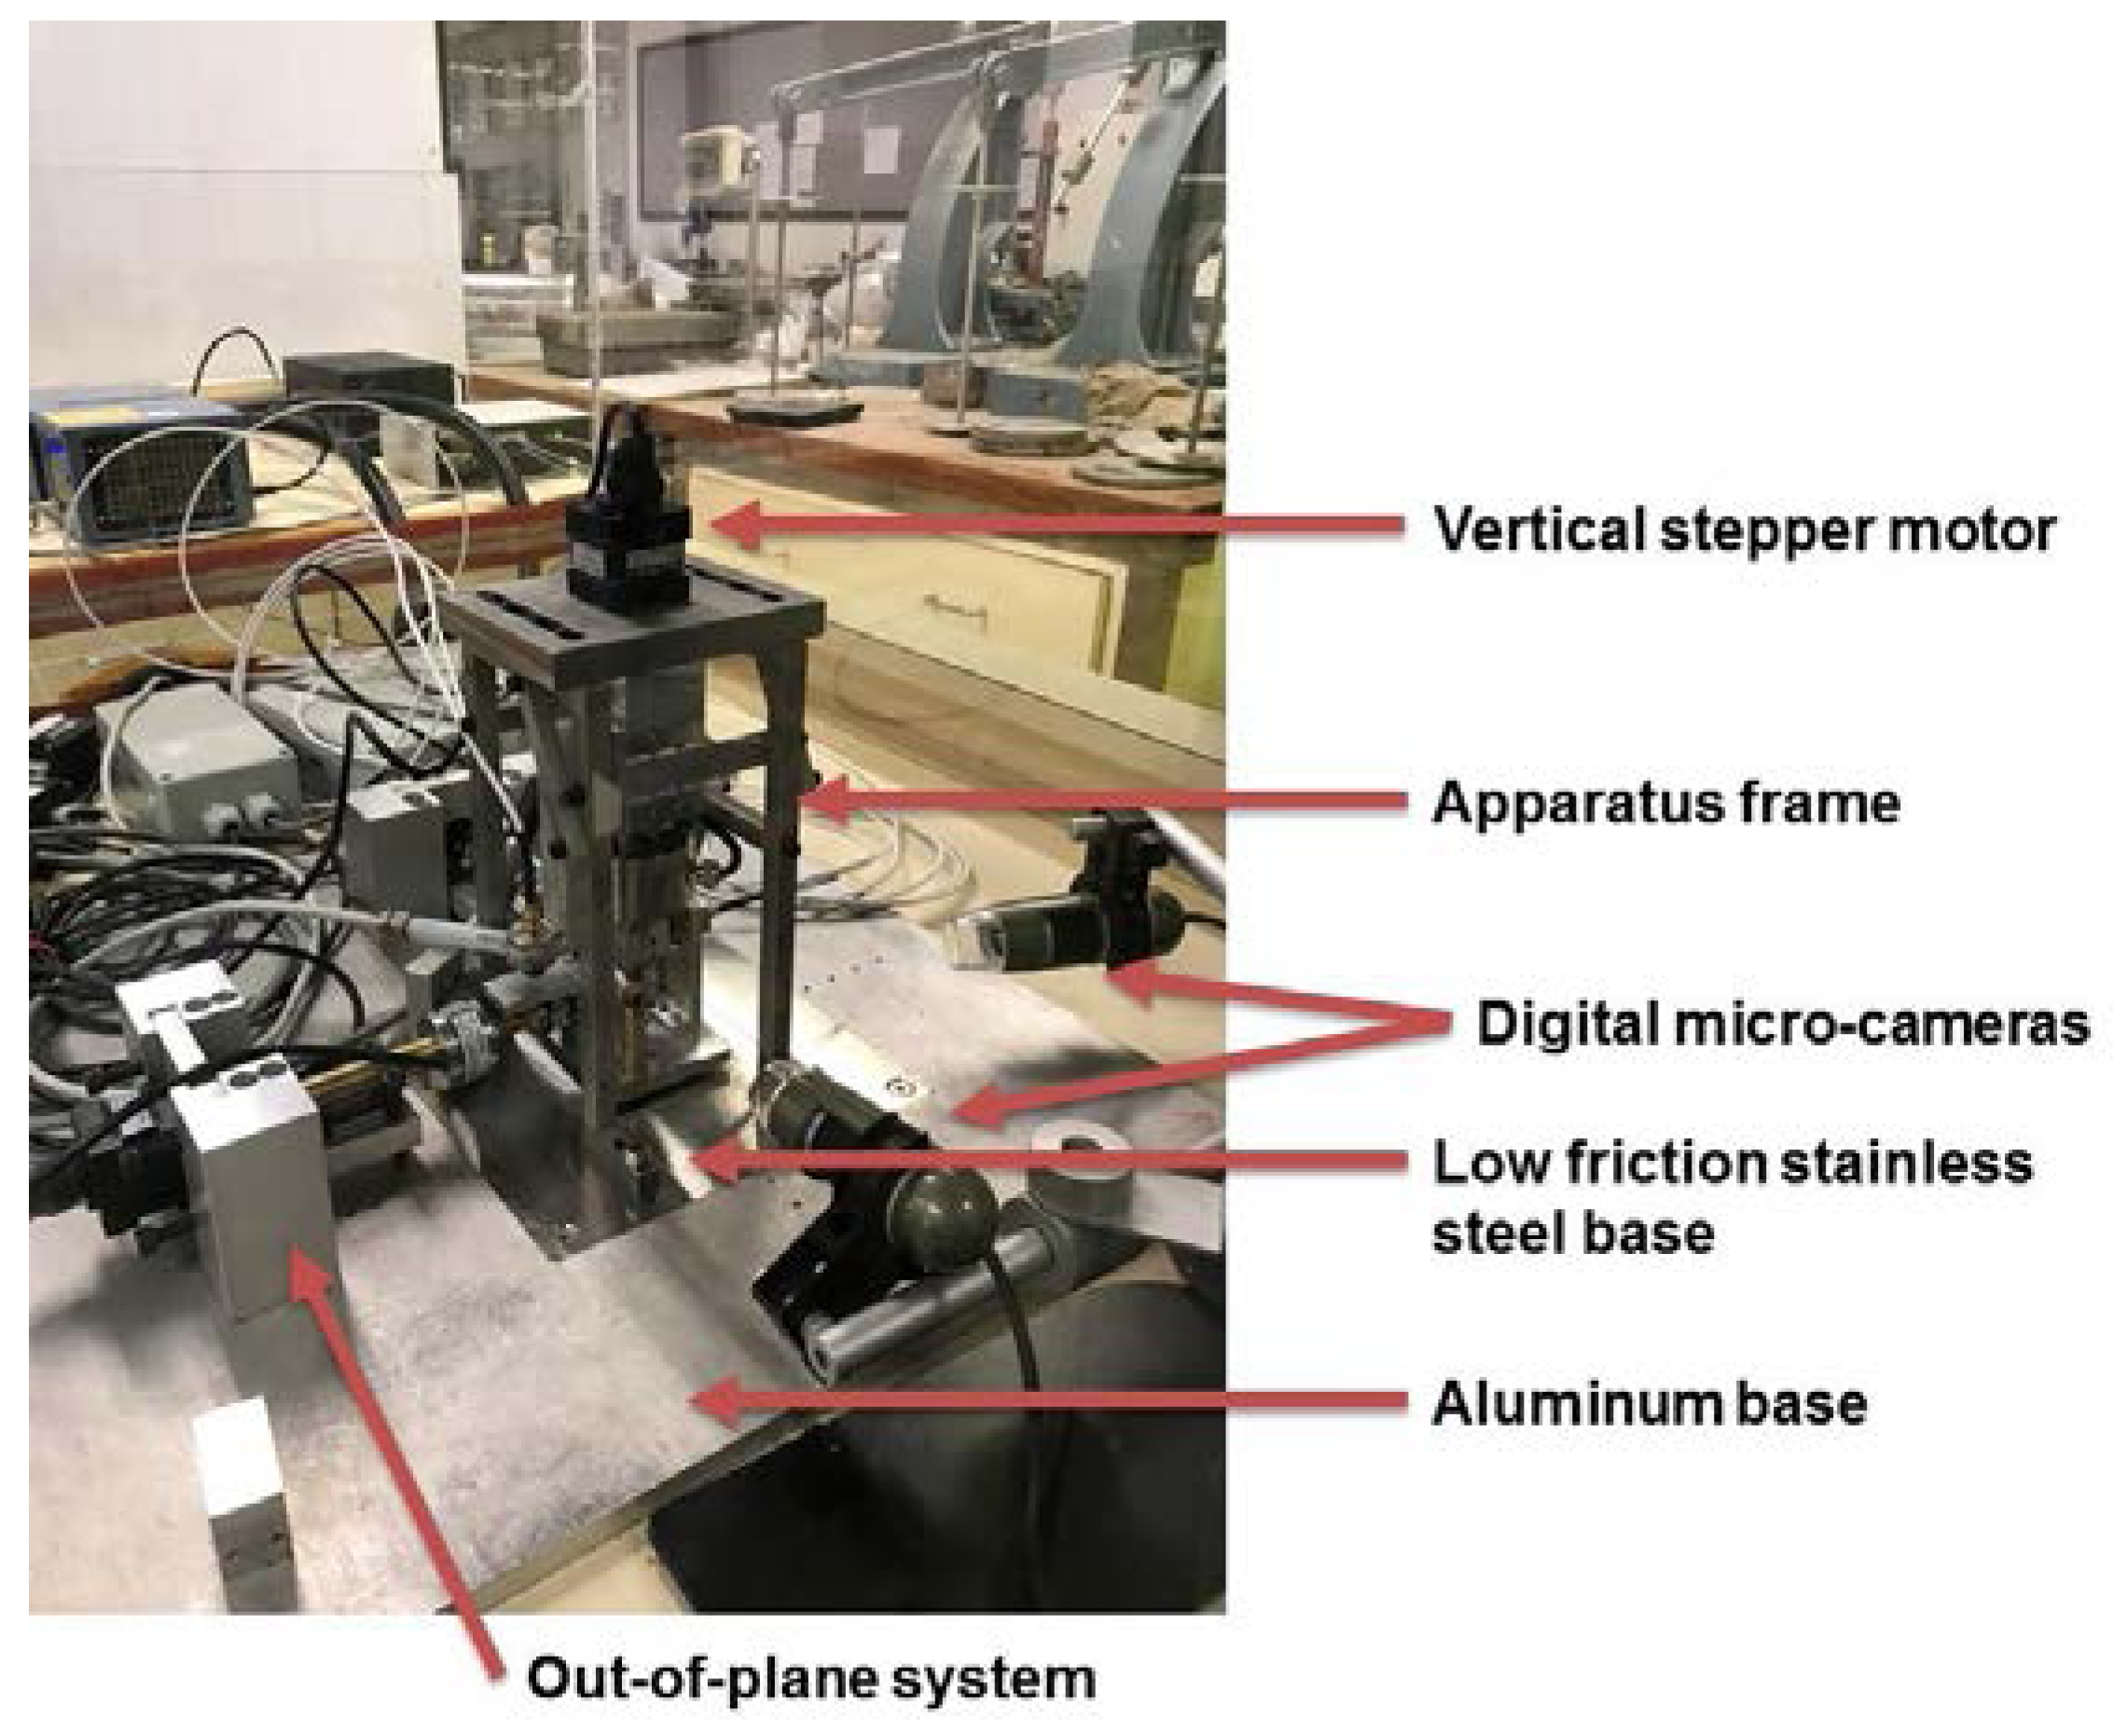
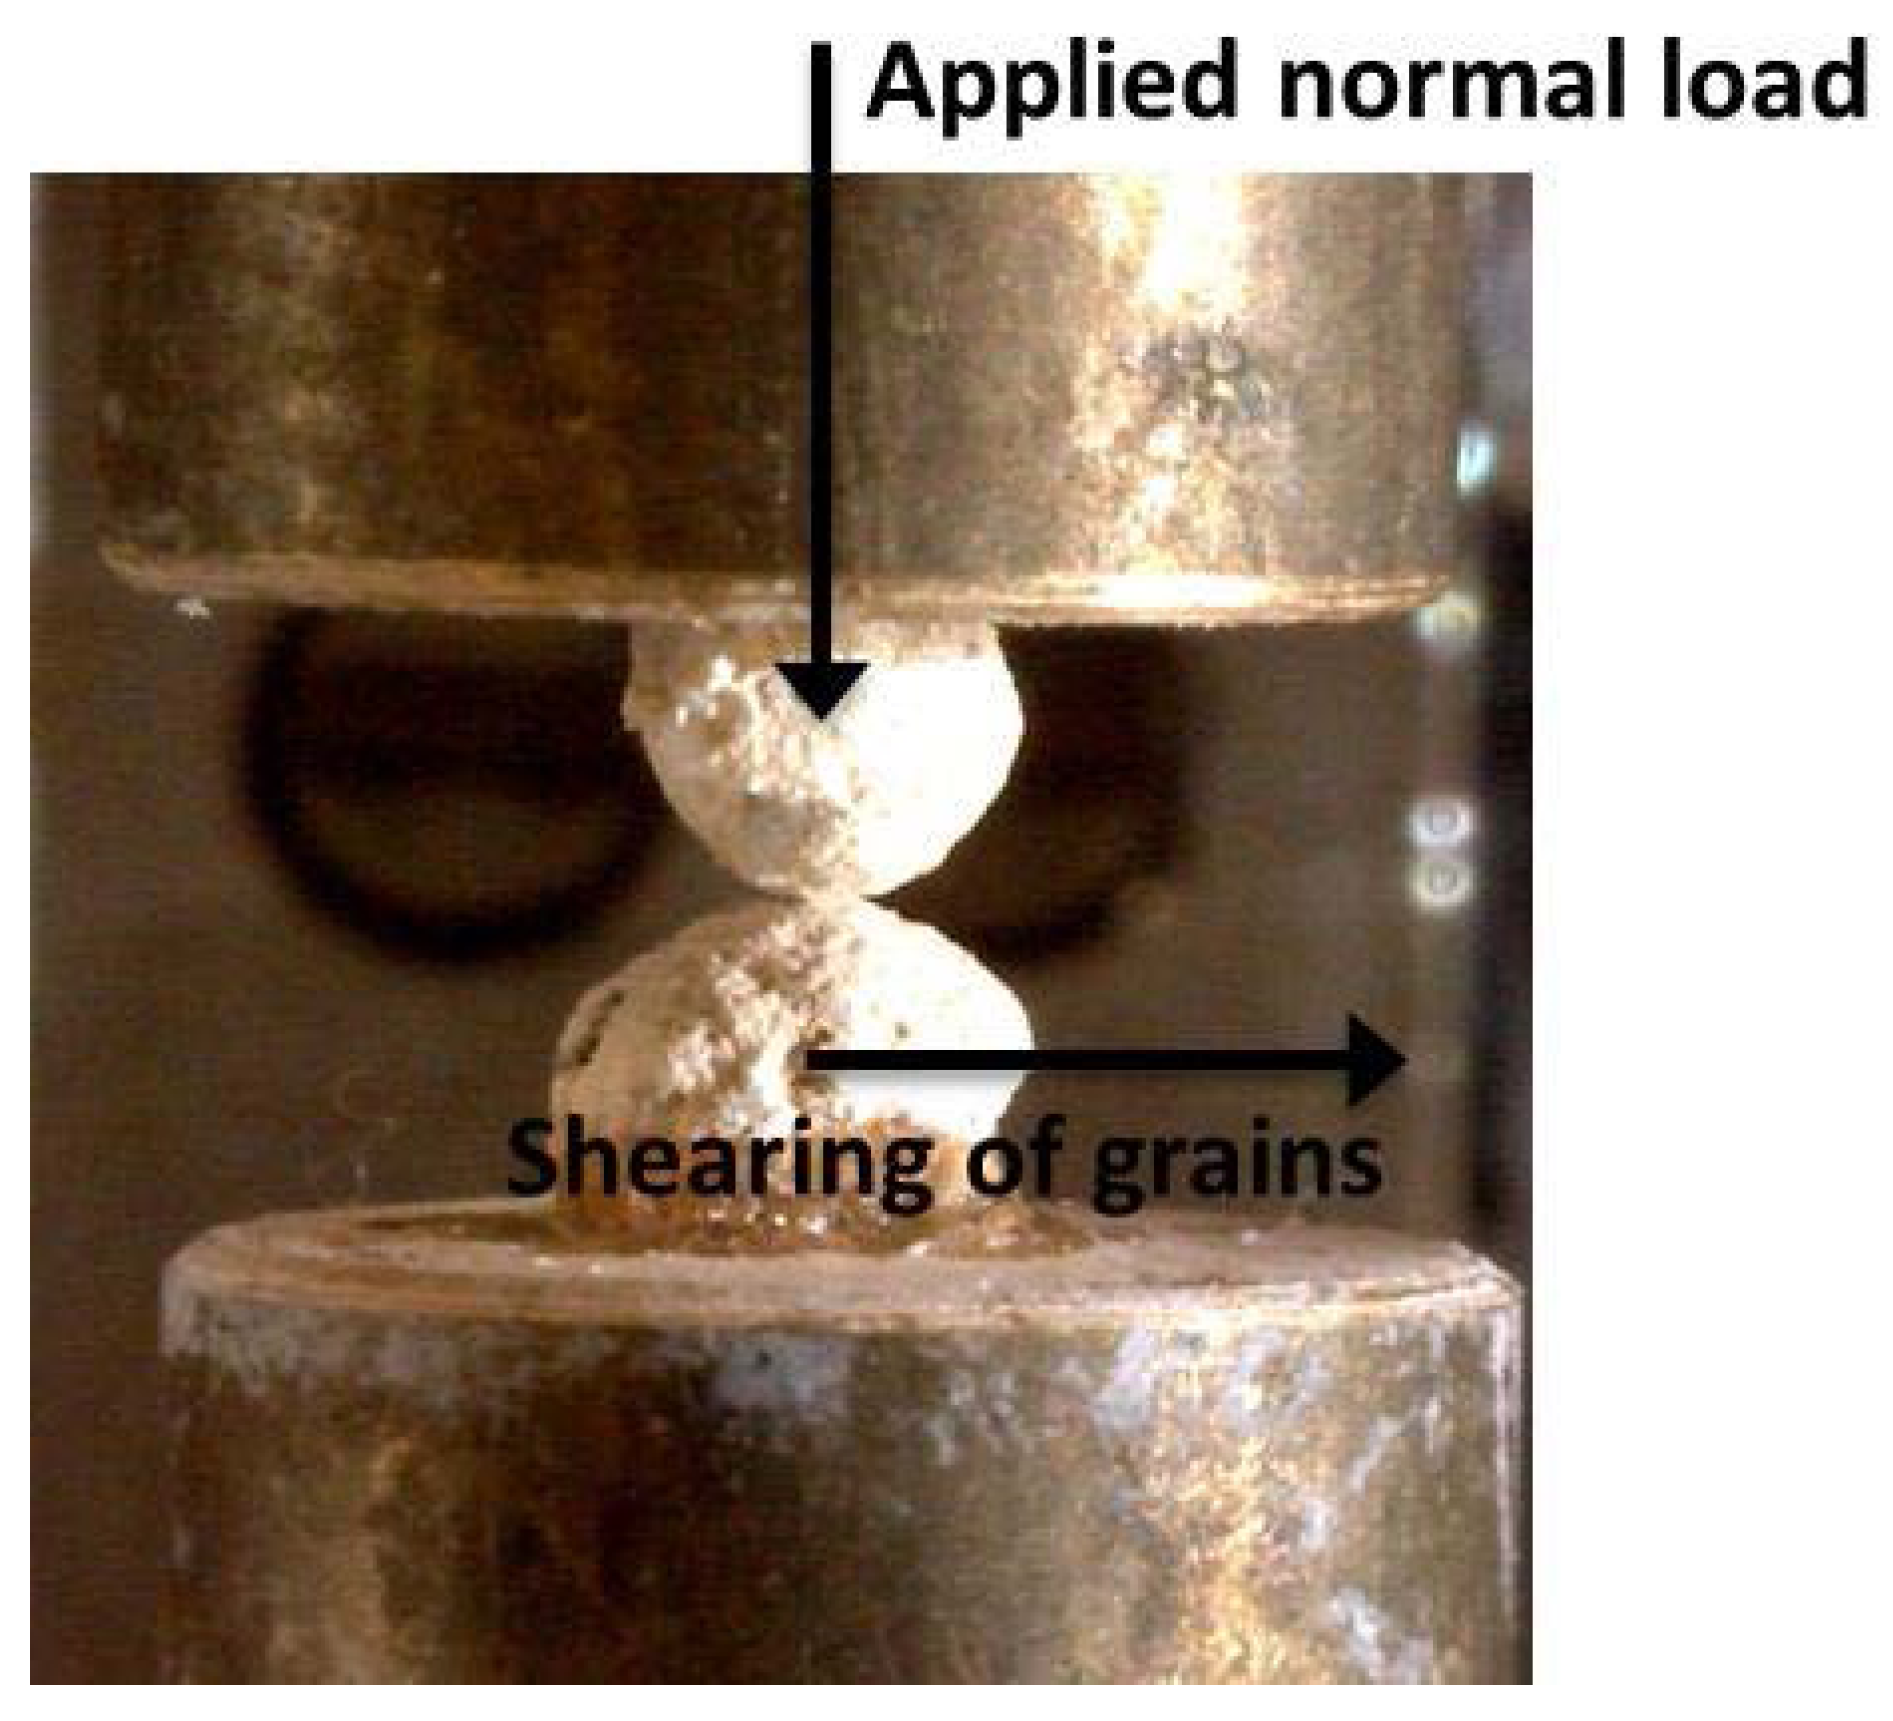
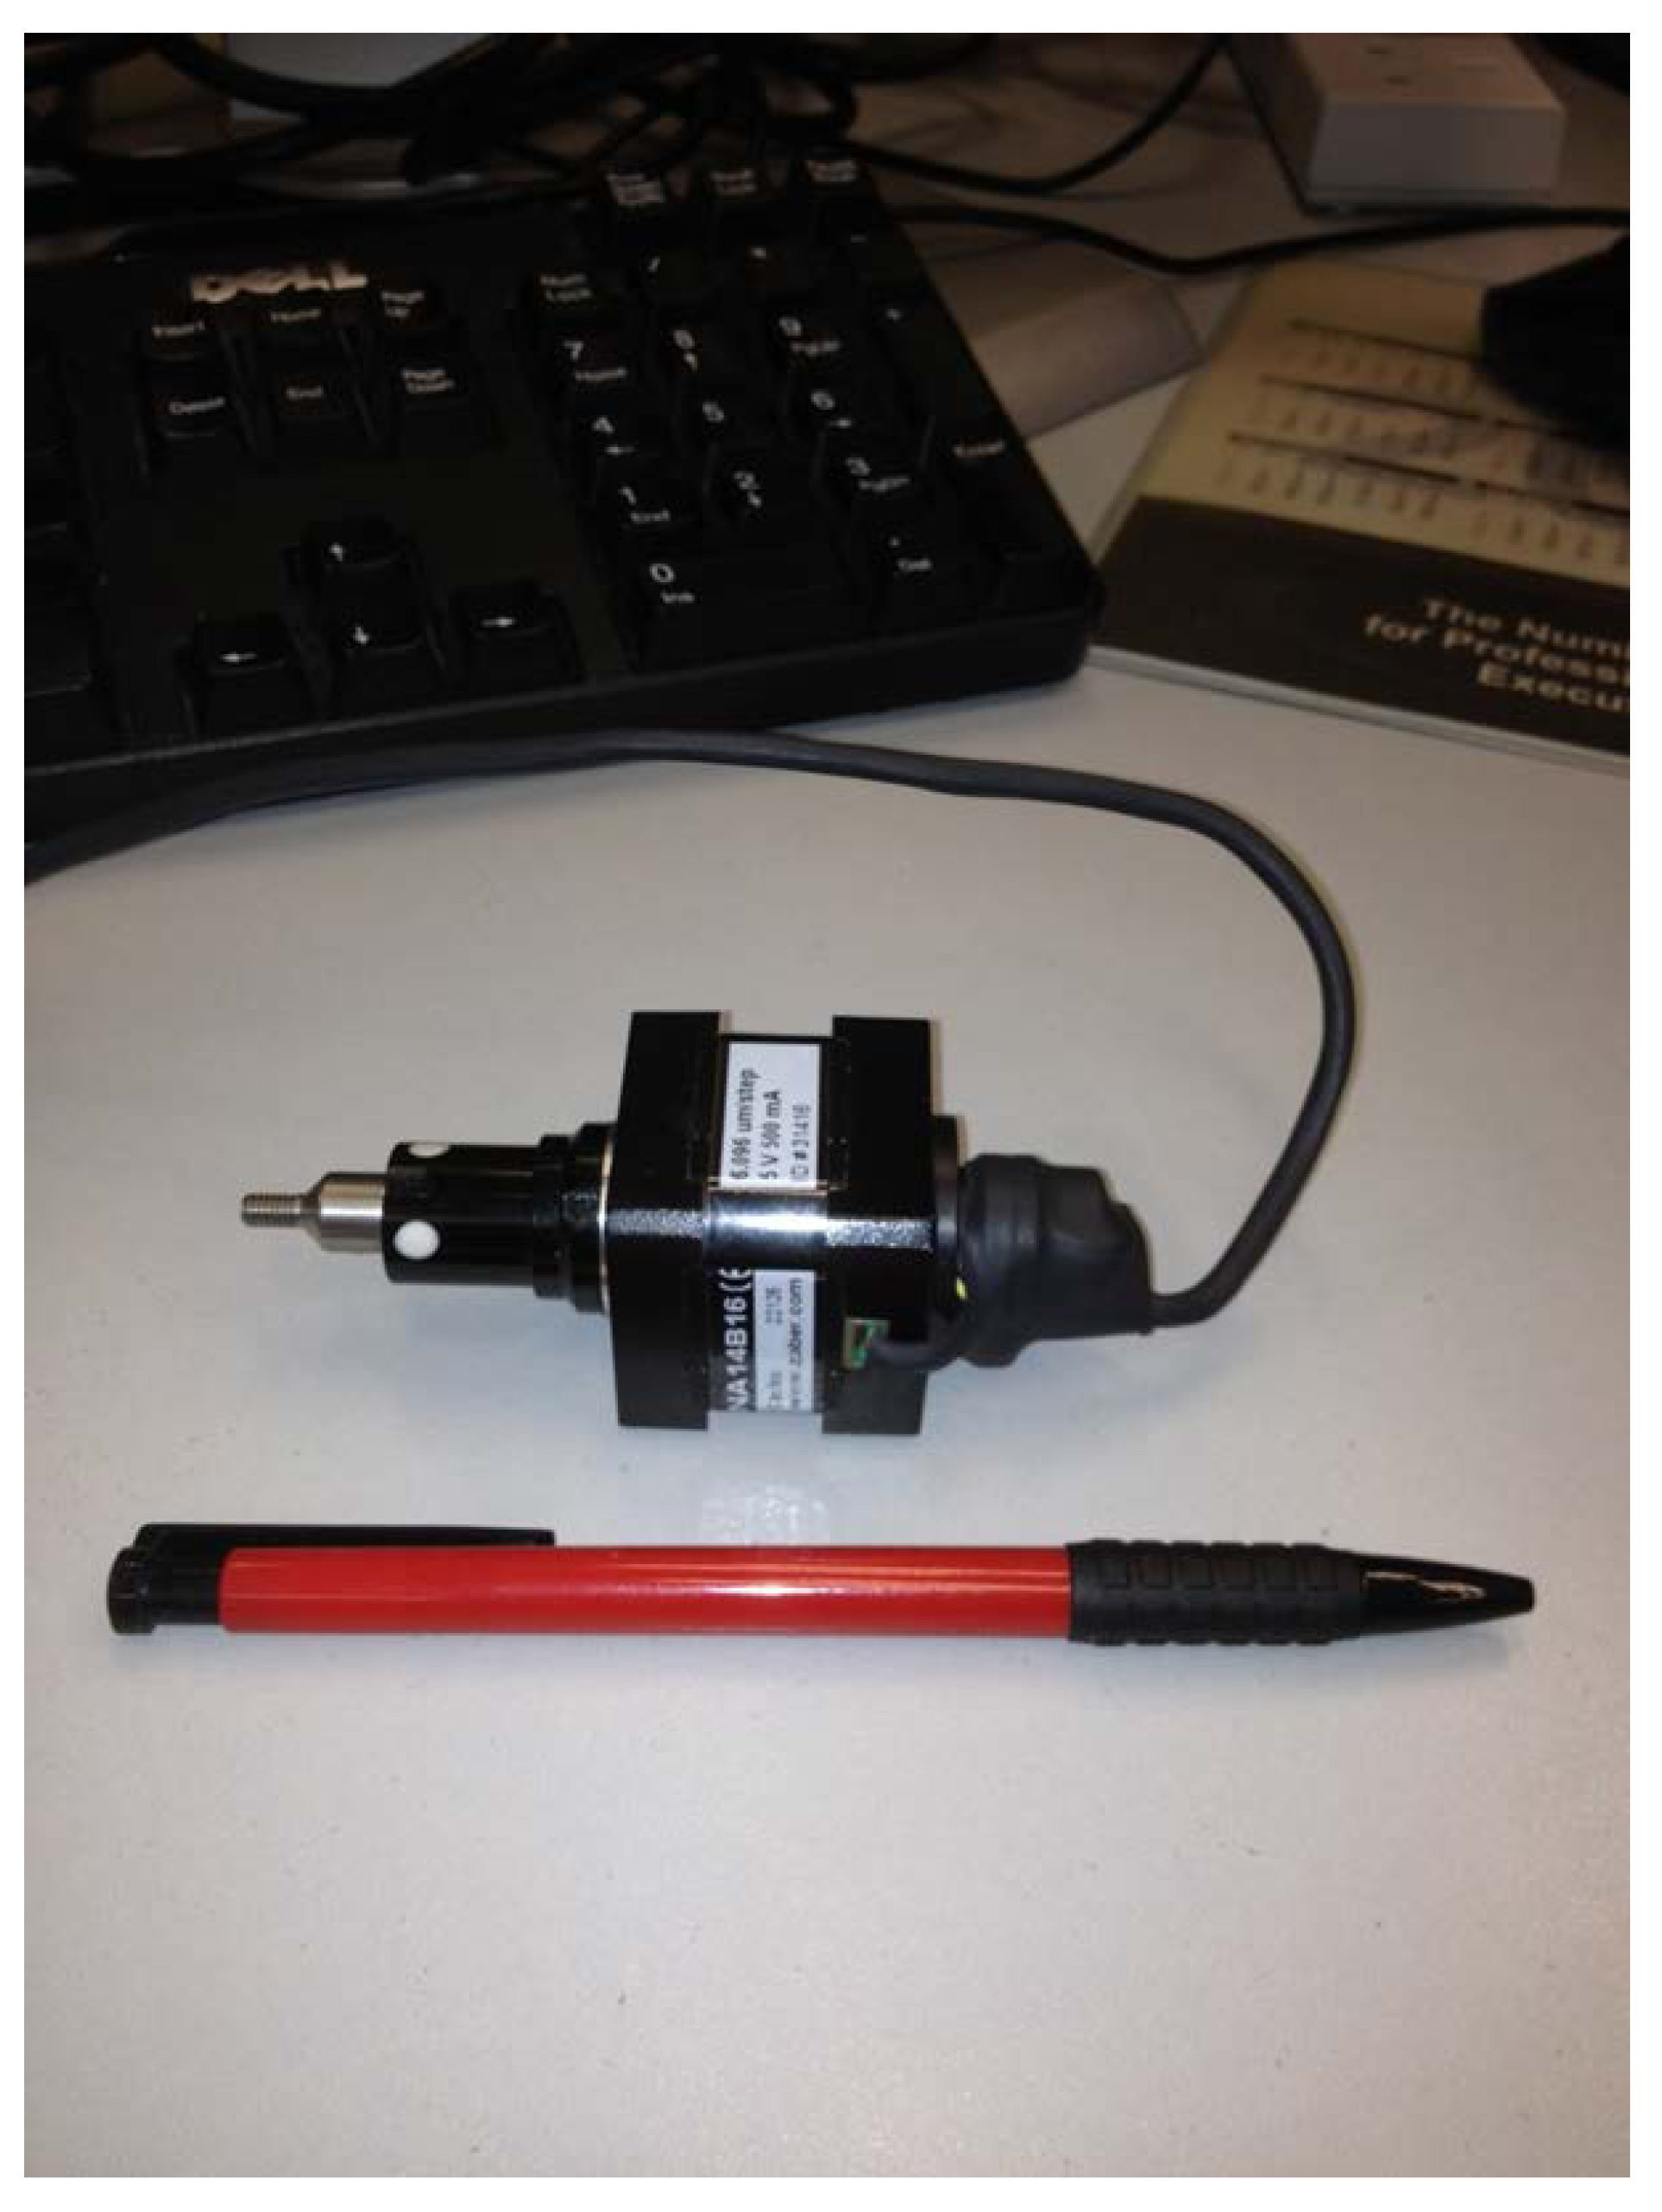
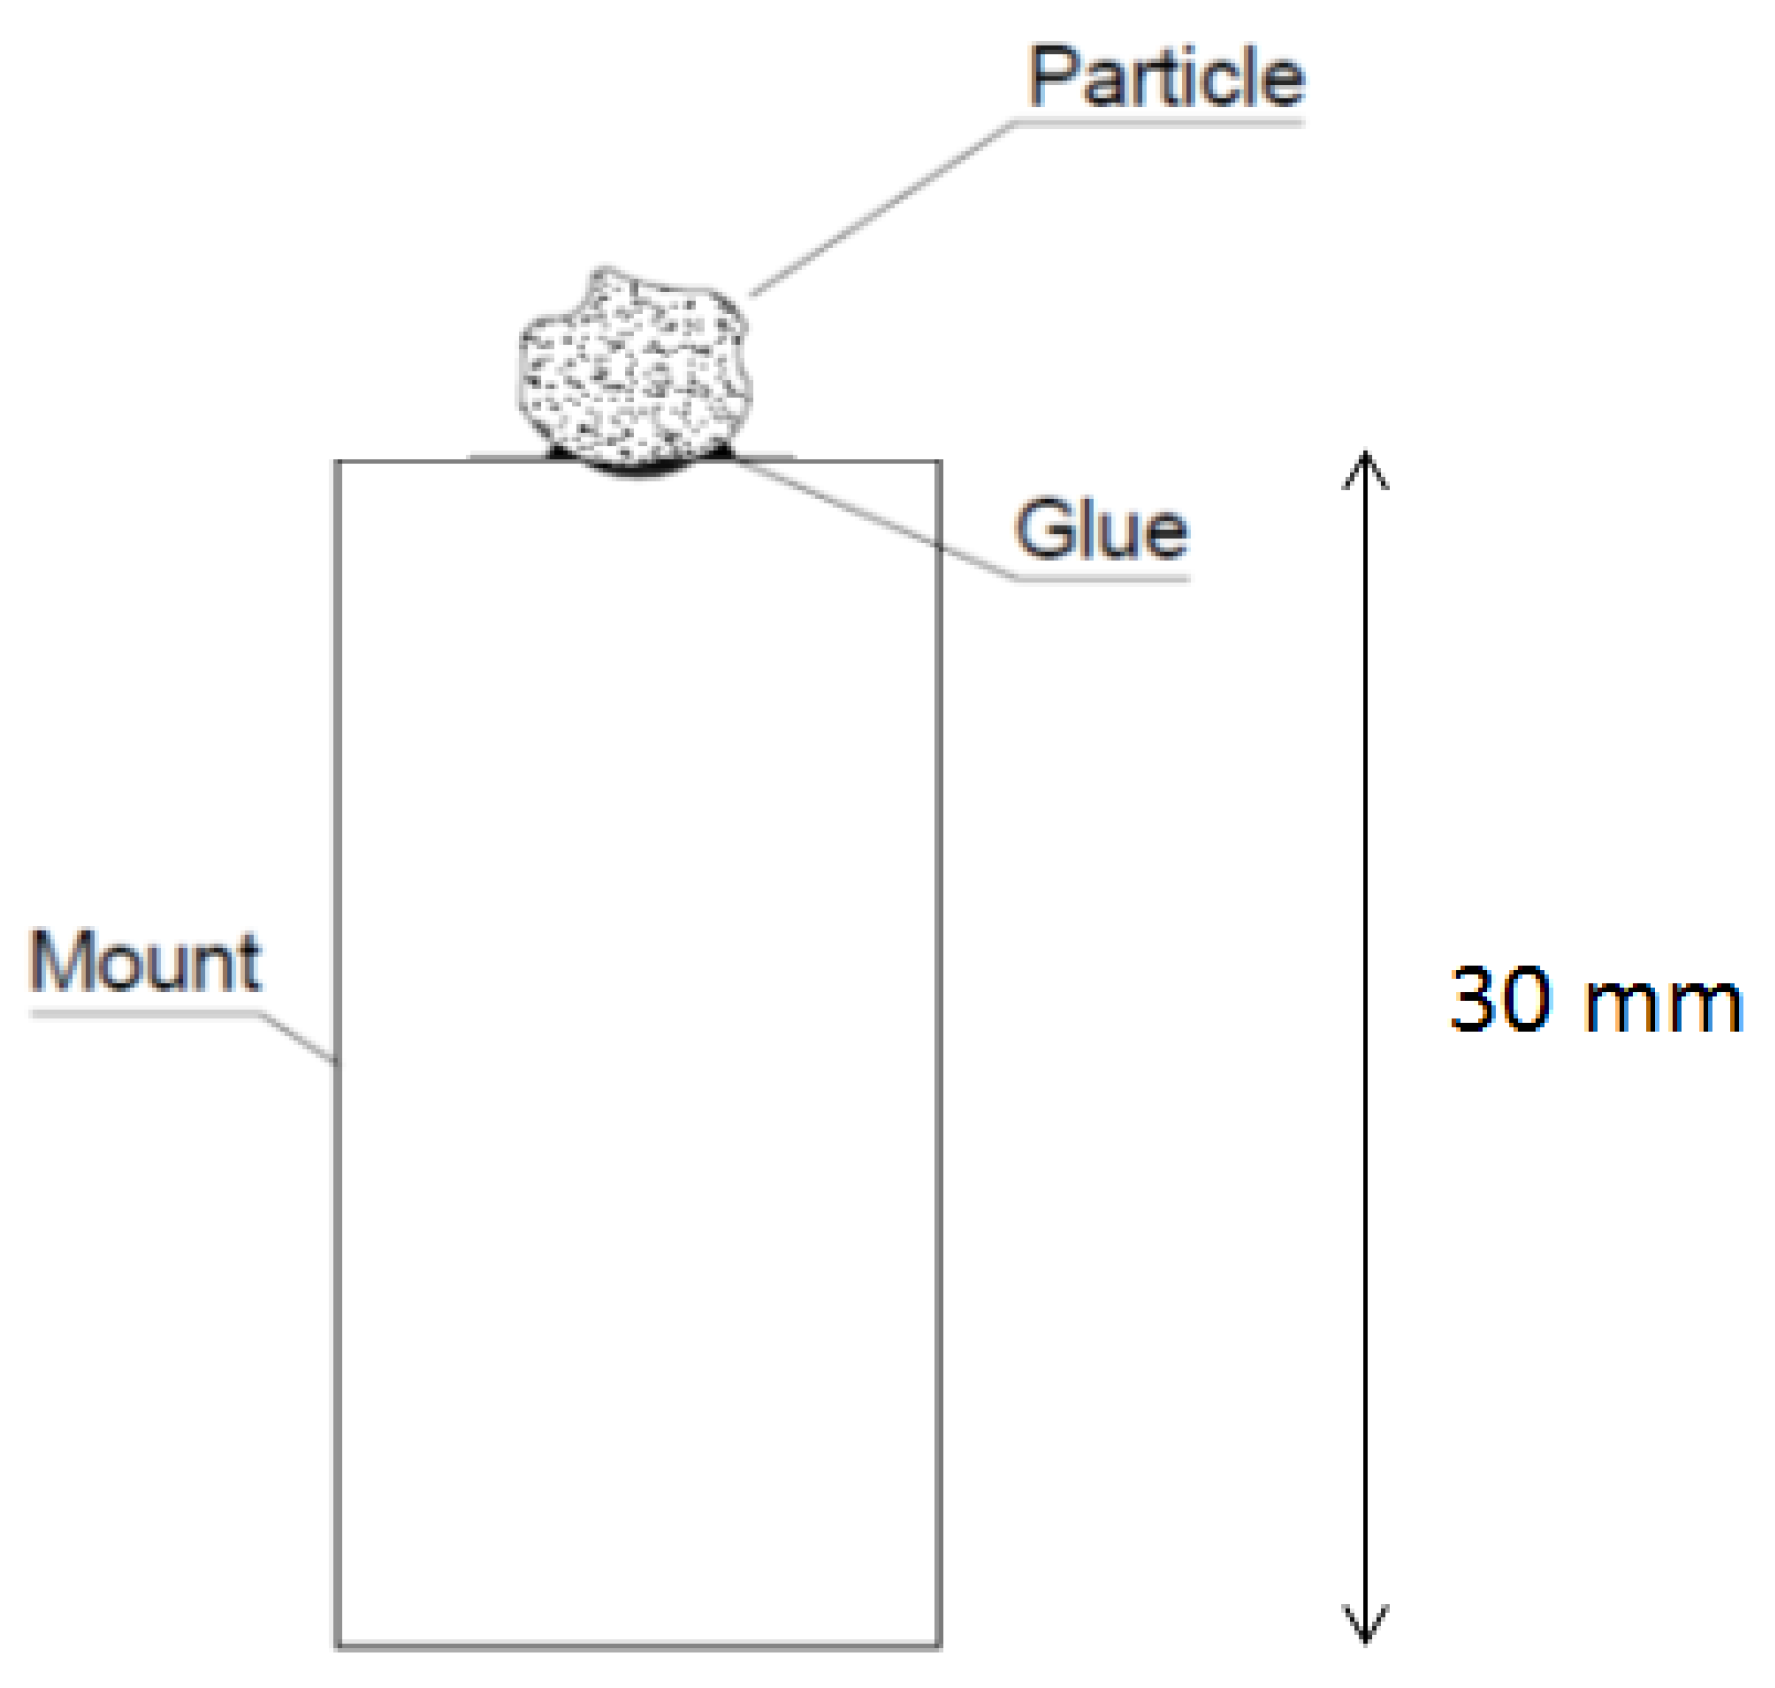
2.2. Apparatus and Experimental Methods for the Micromechanical Tests

The apparatus used in the study for the micromechanical sliding tests was designed and constructed by Senetakis and Coop [10] and later upgraded by Nardelli and Coop [24] and Nardelli et al. [8]. An image of the apparatus is given in Figure 3 indicating some of its major components. This system works in three perpendicular directions, allowing two grains of sand size to be in contact under a controlled normal load and one grain is sheared over the surface of the other grain, following relatively small shearing paths of the order of about 50 to 300 microns. Typically, the normal (vertical) load is applied in a force-controlled manner and the shearing in the tangential to the contact direction is applied through a force- or displacement-controlled type [5,6,7,10,11]. Typical plots of the normal load (FN) against the horizontal (sliding) displacement during micromechanical tests are given in Figure 4. The data demonstrate the excellent performance of the apparatus in maintaining stable magnitude of the normal load while the shearing test is in progress. Note that the particular example data illustrated in Figure 4 were conducted on pairs of LBS grains under a sliding velocity of 0.08 mm/h. It is also noticed, as also mentioned in [10], that the apparatus is designed in a way that it can apply normal forces to the grain contacts of very small magnitude, in general in the range of 0.5 to 10 N, approximately. These forces are much lower in magnitude in comparison to the typical working loads in soil mechanics experimentation. This is because DEM studies have shown that the expected normal loads developed at the contacts of sand grains in typical geotechnical engineering applications and confining pressures between about 100 to 500 kPa, would be relatively small, in general less than 5 N [25].
A close-up view of the apparatus during the setup of experiment on LBS grains is given in Figure 5. Note that the grains are set prior to the shearing test, with an apex-to-apex type of contact. This configuration has allowed the systematic study of grain contact stiffness [5,6,7,10,11]. Stiffness could not be captured, for example, with the previous design by Cavarretta et al. [4]. That previous apparatus could allow the grains to be initially positioned with their centroids forming an angle with respect to the horizontal. The design of this new generation micromechanical apparatus by Senetakis and Coop [10] with a number of upgrades over the recent years by Nardelli et al. [8] and Nardelli and Coop [24], allowed the initial apex-to-apex configuration without major difficulties in capturing good quality tangential force–displacement test data. In addition, stick slip phenomena have been minimized [4,26], because of the high stiffness of the new apparatus in the different directions (i.e. direction of shearing, vertical direction and out-of-plane direction). Typical setup of CDV granules prior to the application of a shearing test is given in Figure 6 indicating the two major steps in conducting this type of experiments; (1) application of the normal (vertical) load and (2) shearing of the grains in contact.
Technical details of the apparatus and the major set of calibrations have been described in [10] with additional modifications of the mechanical and electronic parts described in [24]. An important component of the apparatus is the system of the three identical linear micro-stepper motors which are used to conduct the tests and control the vertical load. An image of one of the stepper motors is given in Figure 7. Note that these motors have a micro-step size equal to 0.095 microns, a travel range of 16 mm and a maximum continuous thrust of 240 N. Further technical details of the micro-stepper motors may be found in Senetakis and Coop [10]. The apparatus is composed of high resolution load cells of a load capacity equal to 100 N [10] and non-contact type displacement sensors [8,24] which allow a resolution of the displacements of the order of 0.01 micron.
The grains are initially glued onto brass mounts of about 10 mm in diameter. These mounts are fixed into brass wells, as described by Senetakis and Coop [10] with a lateral screw used to support the rigidity of the interface mount–well. Typical image of the brass mounts and wells is given in Figure 8. Note that the free surface of the mounts is manufactured with a small groove which allows the grain to be better fixed onto the mount and the glue to cover properly the bottom and a part of the surface of the grain avoiding possible contamination of the top surface of the grain where friction and stiffness are measured. The typical configuration of the system mount–glued grain is schematically illustrated in Figure 9 (after Senetakis et al. [6], modified by the authors).

2.3. Testing Program

In the study, eight experiments were conducted on different pairs of grains, as summarized in Table 1. Seven tests were conducted on LBS pairs of grains and one test was conducted on CDV granules. All the tests were conducted applying a target (nominal) normal load in the range of 1 to 10 N for the LBS grains and at a nominal normal load of 0.5 N for the CDV granules. Note that the CDV granules are very breakable and the applied normal loads can be, in general, in the range of 0.5 to 1.5 N. For relatively high speeds of shearing or in some of the trials by the authors to set CDV granules for the experiments, the grains break during the application of the normal load or during the shearing test. Thus, it is in general difficult to conduct complete tests for this type of material. A typical plot of tangential (horizontal) force–sliding displacement during a test on CDV granules with occurrence of breakage of the grains during the shearing is given in Figure 10. Note the abrupt drop of the horizontal force at a displacement of about 40 microns due to the crack initiation in the upper grain. At a displacement of about 150 microns, due to the progression of increasing width of the crack of the upper grain, there was observed a second drop of the horizontal force. In such cases, the test could not be considered reliable. The testing program summarized in Table 1 included experiments for which the shearing was conducted smoothly without occurrence (particularly for the CDV pair of granules) of any notable damage or crack initiation to the granules.
All the tests were conducted at a shearing velocity of 0.08 mm/hour allowing a steady state sliding to occur prior to the termination of the tests. Details of the data analysis for this type of experiments may be found in [5,10]. It is noticed that during the tests, the horizontal force (Fh) and the vertical force (Fv) are monitored. The mobilized inter-particle coefficient of friction (μmob) is given as the ratio of the tangential force (FT) over the normal force (FN). In this study, because the shearing paths were relatively small and the record of the vertical deflection during the tests did not indicate any significant alteration of the vertical positioning of the grains, it was assumed that FT ≈ Fh and FN ≈ Fv. A particular focus of this study was the examination of the effect of repeating the shearing test to the grain contacts. For this purpose, various tests were conducted with code names LBS-1, LBS-2B, LBS-3, LBS-5, LBS-7 and LBS-10, each of them representing the repeating shearing tests conducted at 1,2,3,5,7 and 10N of normal load, respectively. Similar tests were also conducted on CDV at 0.5N and it is represented as CDV-0.5. A total number of four shearing tests were conducted following the same shearing path for each given pair of grains.

3. Results and Discussion

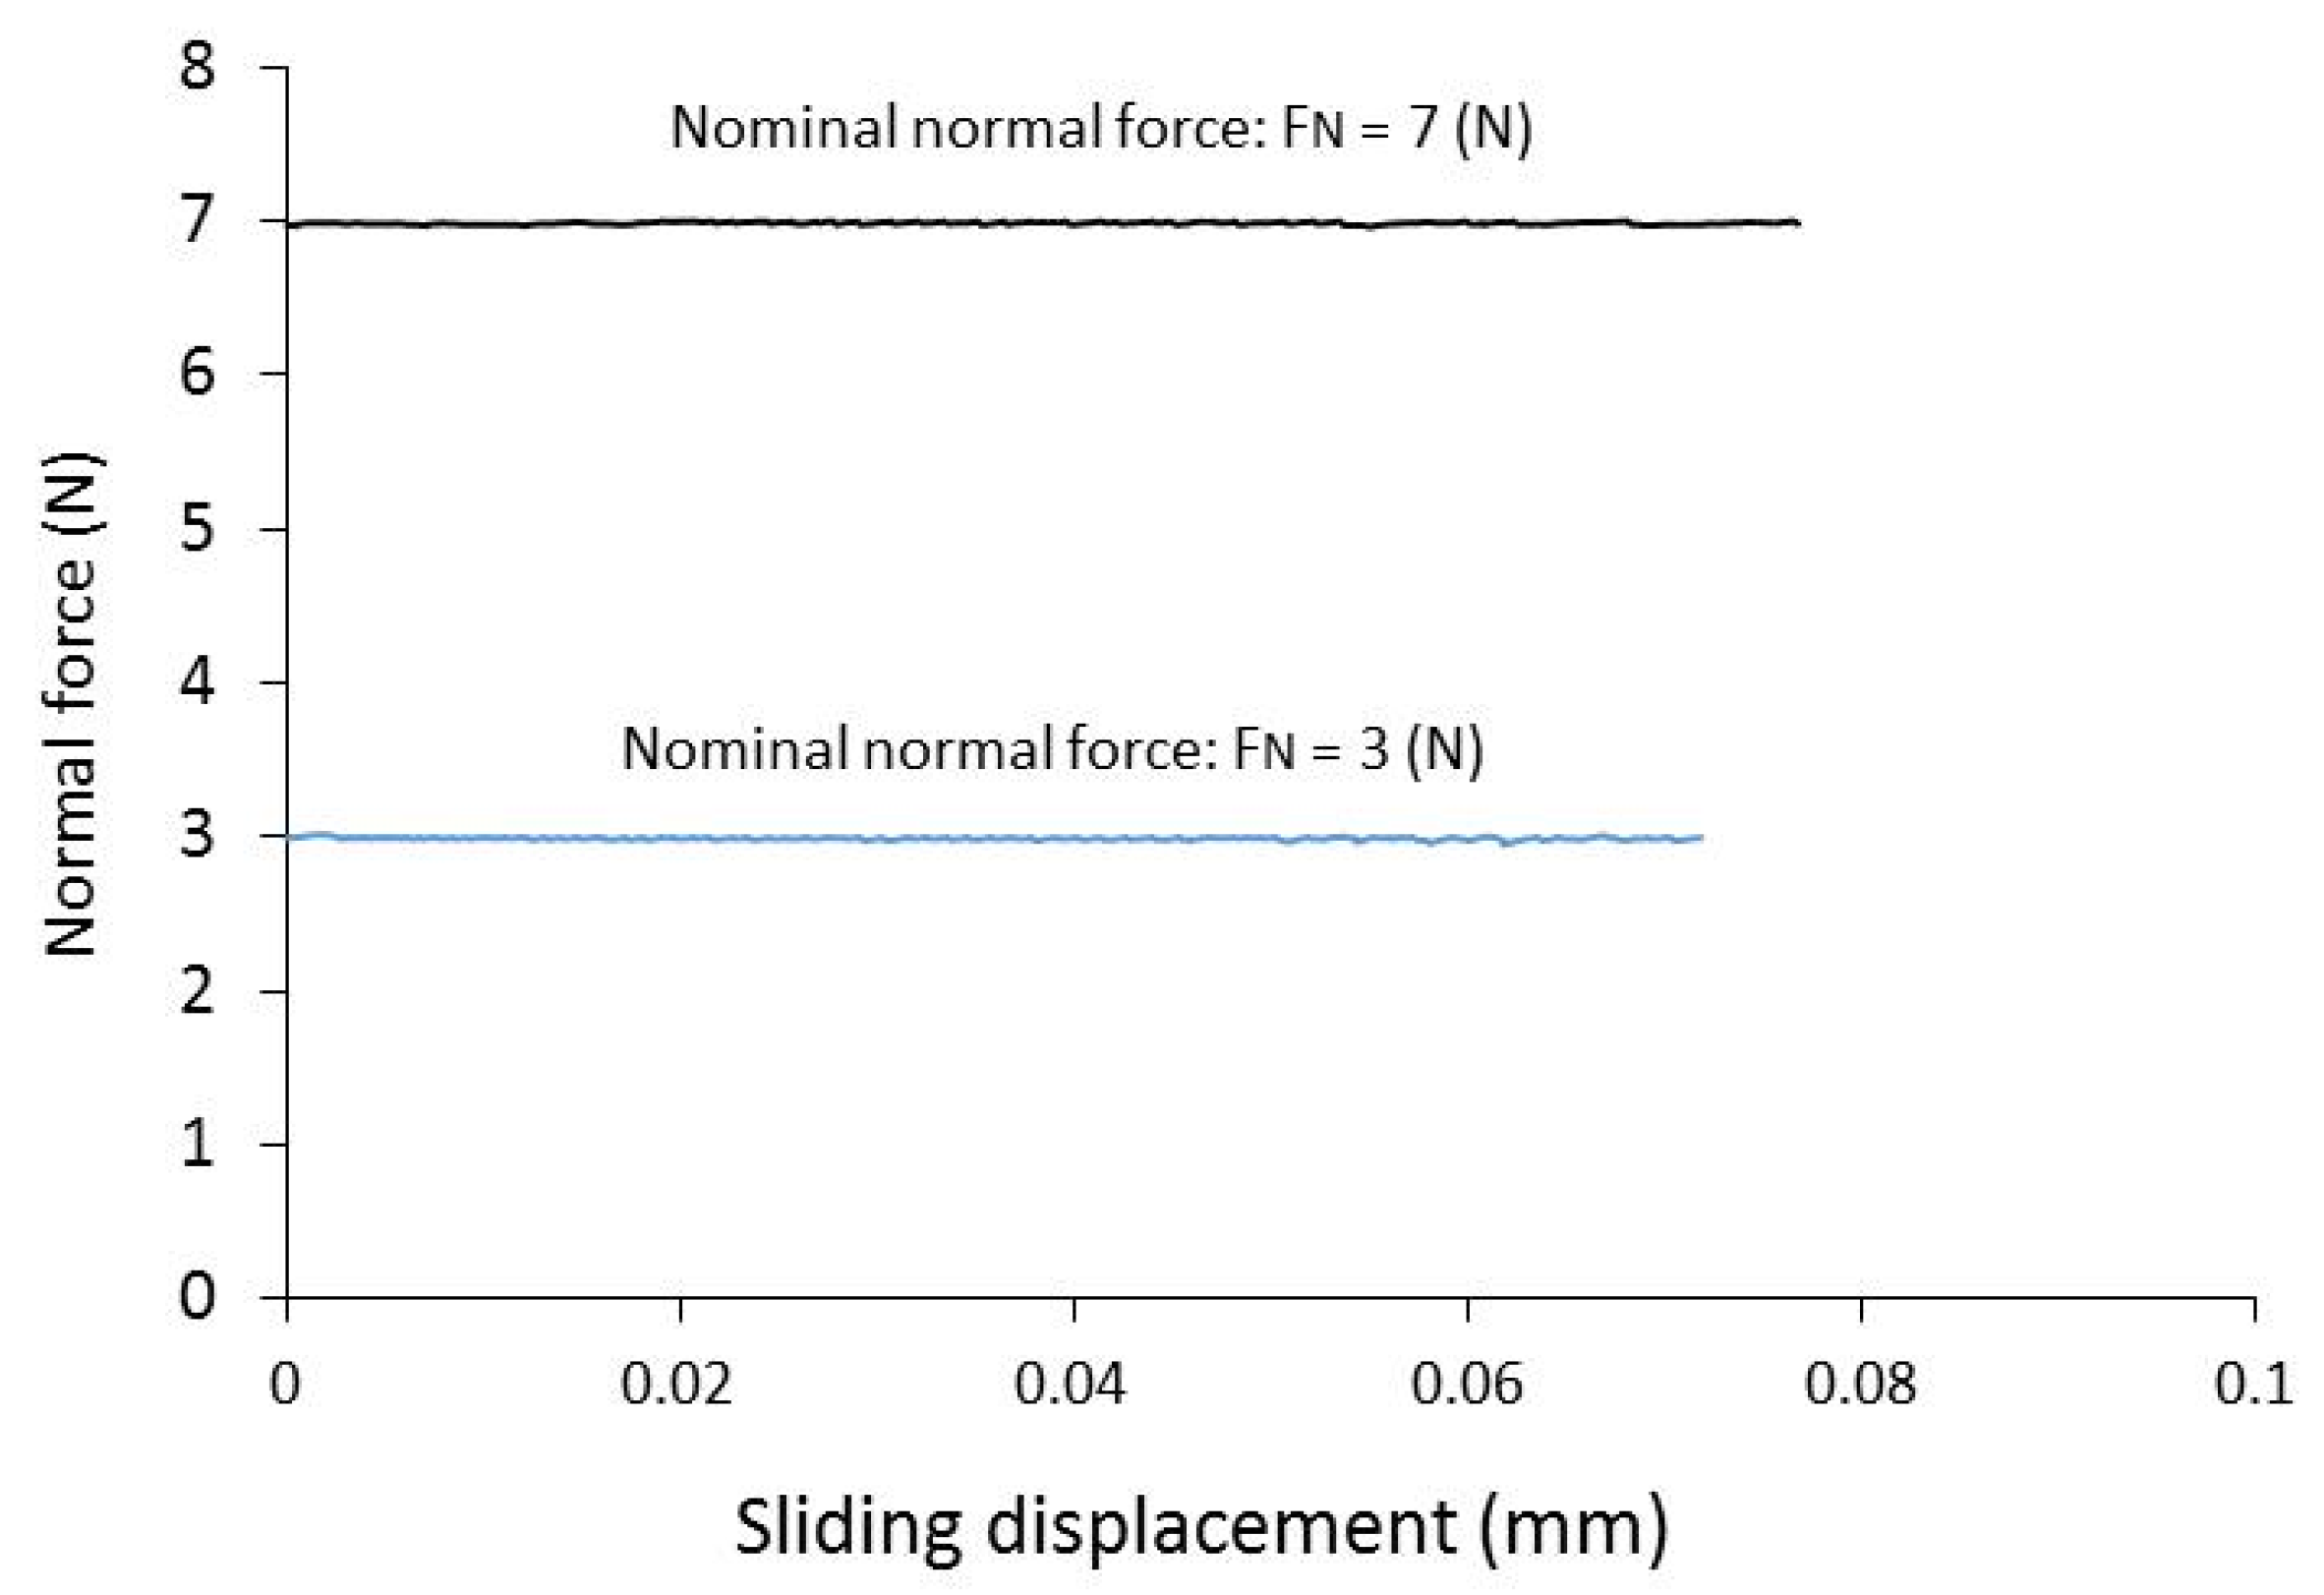
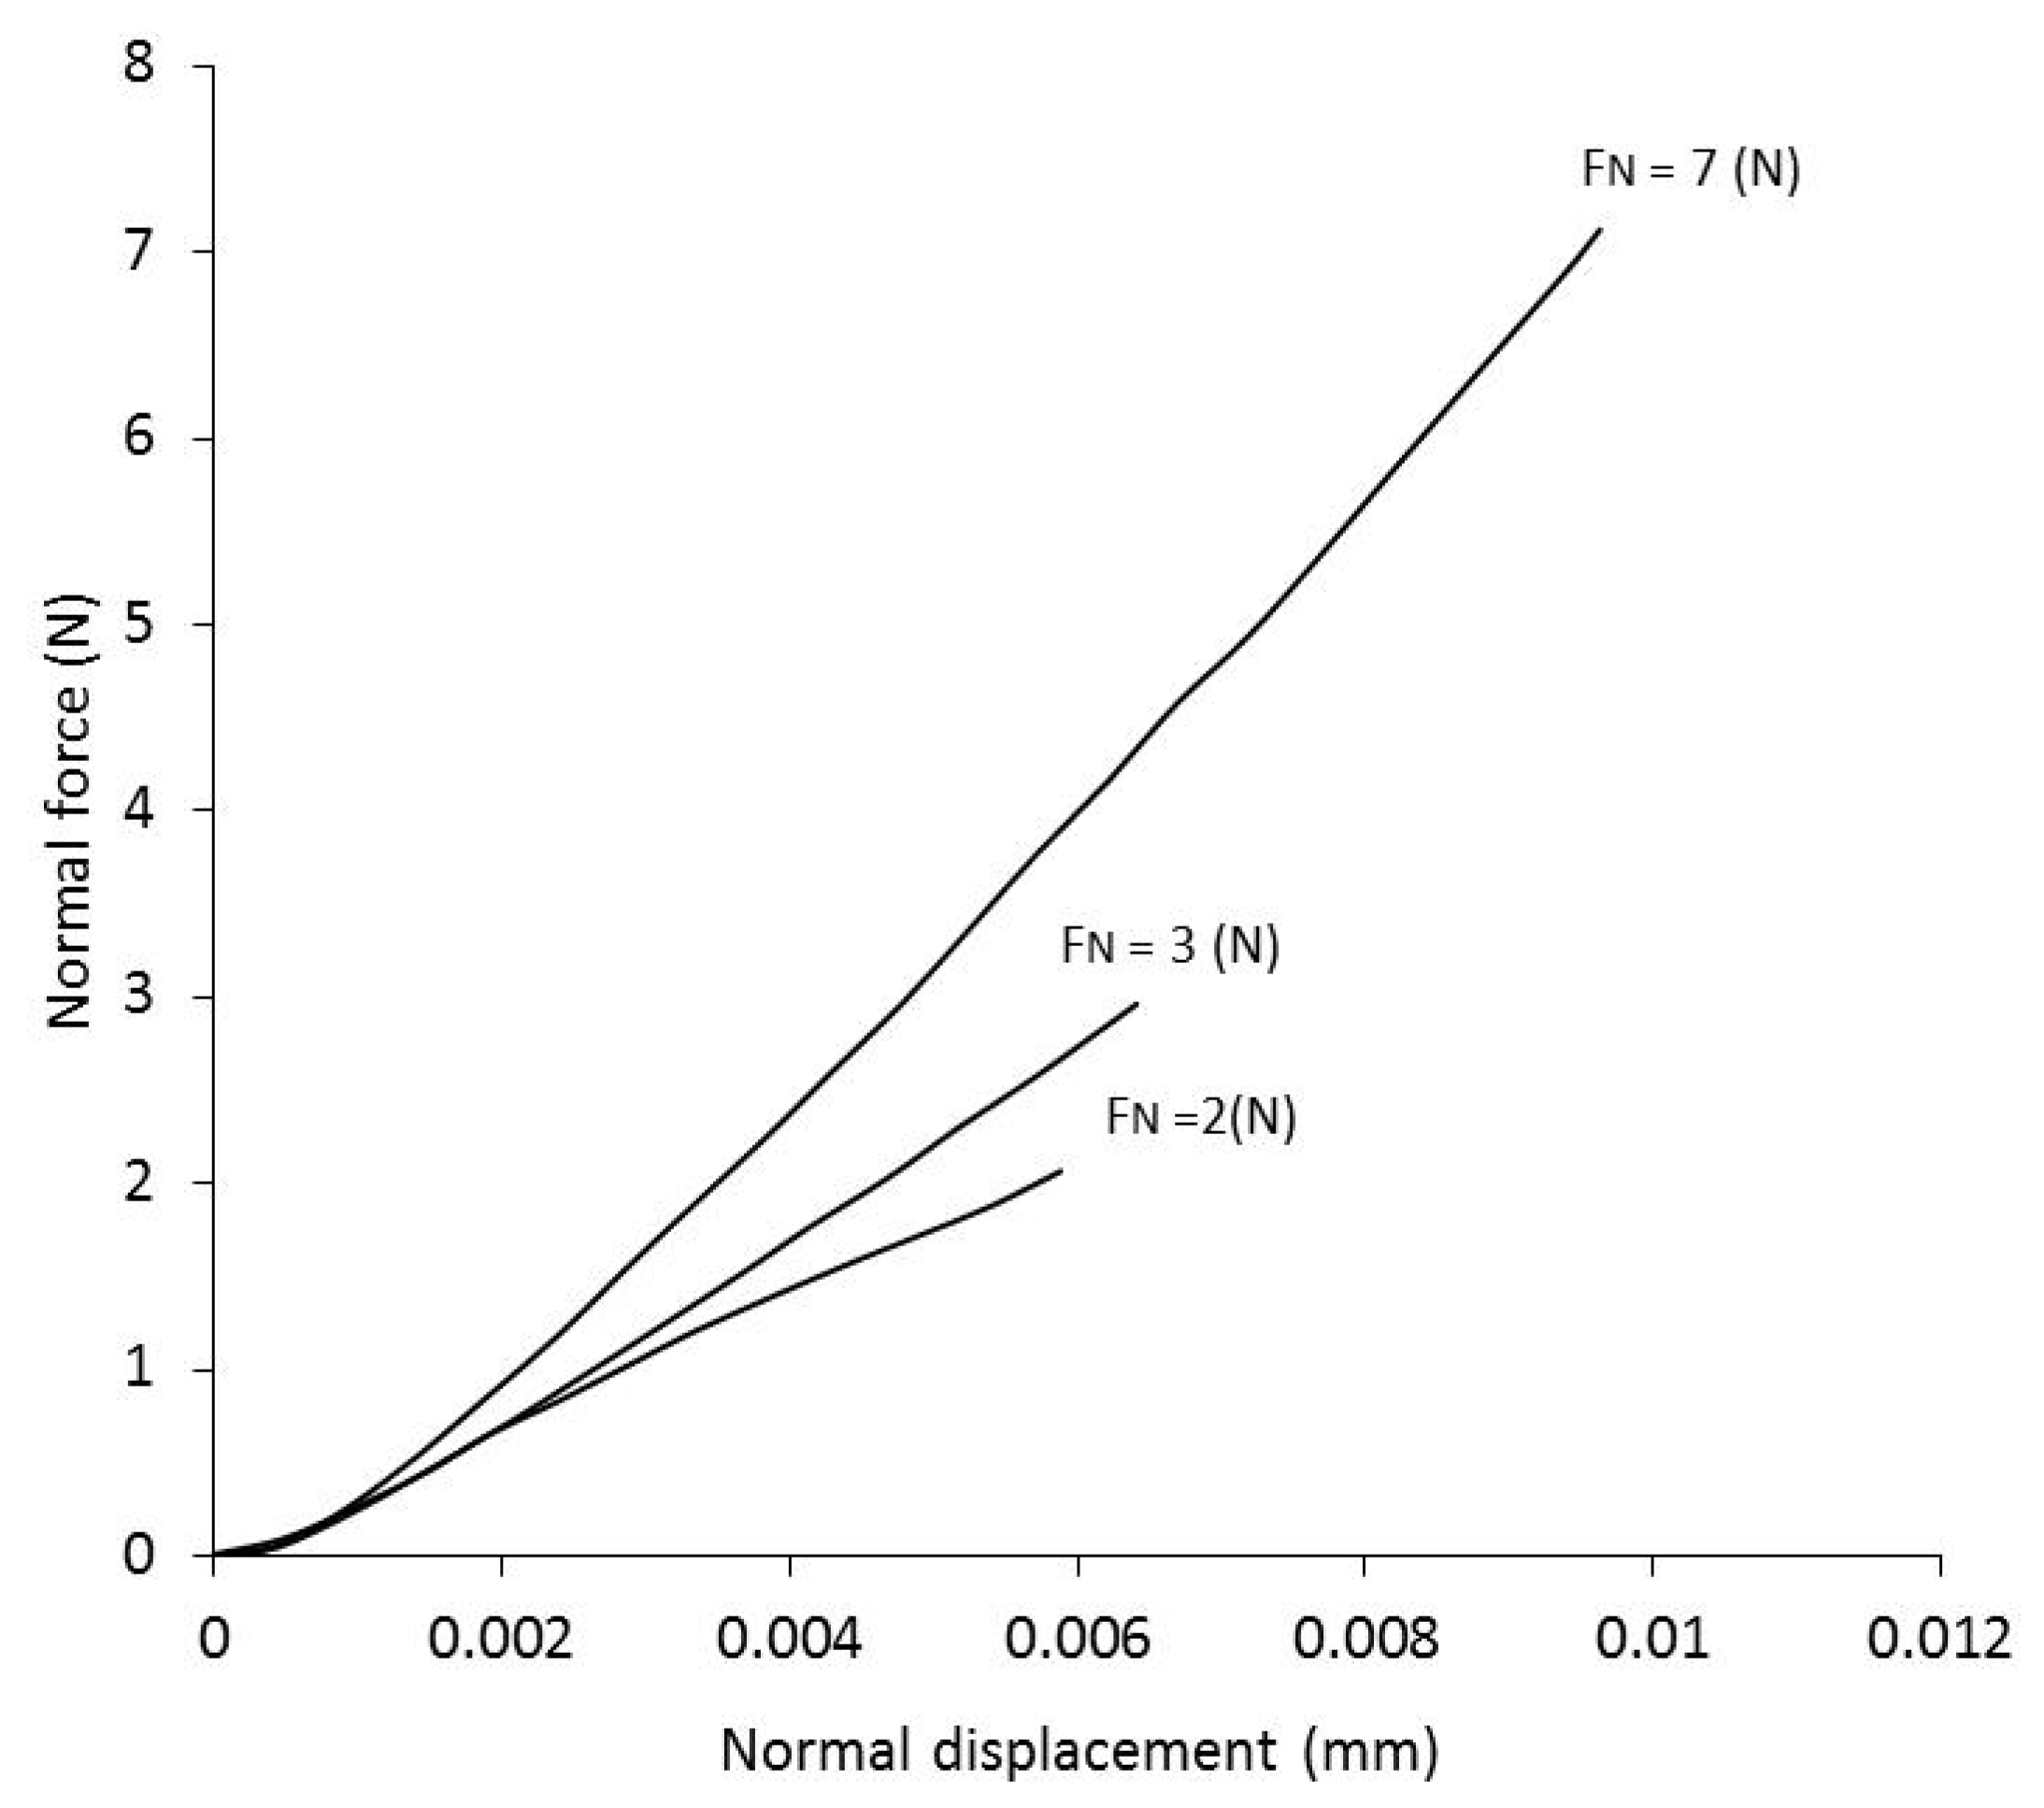
3.1. Typical Plots of Normal Load–Normal Displacement

During the setting of the experiments, a normal load is applied to the grains prior to the shearing procedure. Initially, the grains are set close to their contact and thereafter the upper grain is moving downward with small steps of vertical displacement in order to capture some initial small force with the vertical load cell. Since the vertical load cell indicates a small value, for example 0.1 to 0.2 N, the contact of the grains is established and the target (nominal) load is thereafter applied. This can be implemented in a force-controlled manner (i.e., increasing value of FN with a constant rate to reach the target level) or in a displacement-controlled manner moving the upper grain with small displacement intervals of the order of 1 micron, which results at increasing values of FN up to the target vertical load is reached. Typical plots of normal force–normal displacement during the setup of LBS grains are given in Figure 11. Note that for the pairs of grains for which a normal load of 2 or 3 N was applied, the normal load–displacement relationship appears to be linear with a good approximation. However, at the greater applied normal load of 7 N, the response is clearly Hertzian [26,27]. These results are in qualitative agreement with the data by Cole and Peters [24] who studied the normal load–displacement response of gneiss. If power-law curves were fitted to the experimental data shown in Figure 11, the power that expresses the sensitivity of the normal force to the applied normal displacement would range between about 1.2 and 1.5 for these three tests, which power coincides with the reported trends in [28]. Note that there is a small scatteredness of the normal force–displacement curves in Figure 11, which might be attributed to some variability of grain contact response between the different LBS grains tested.

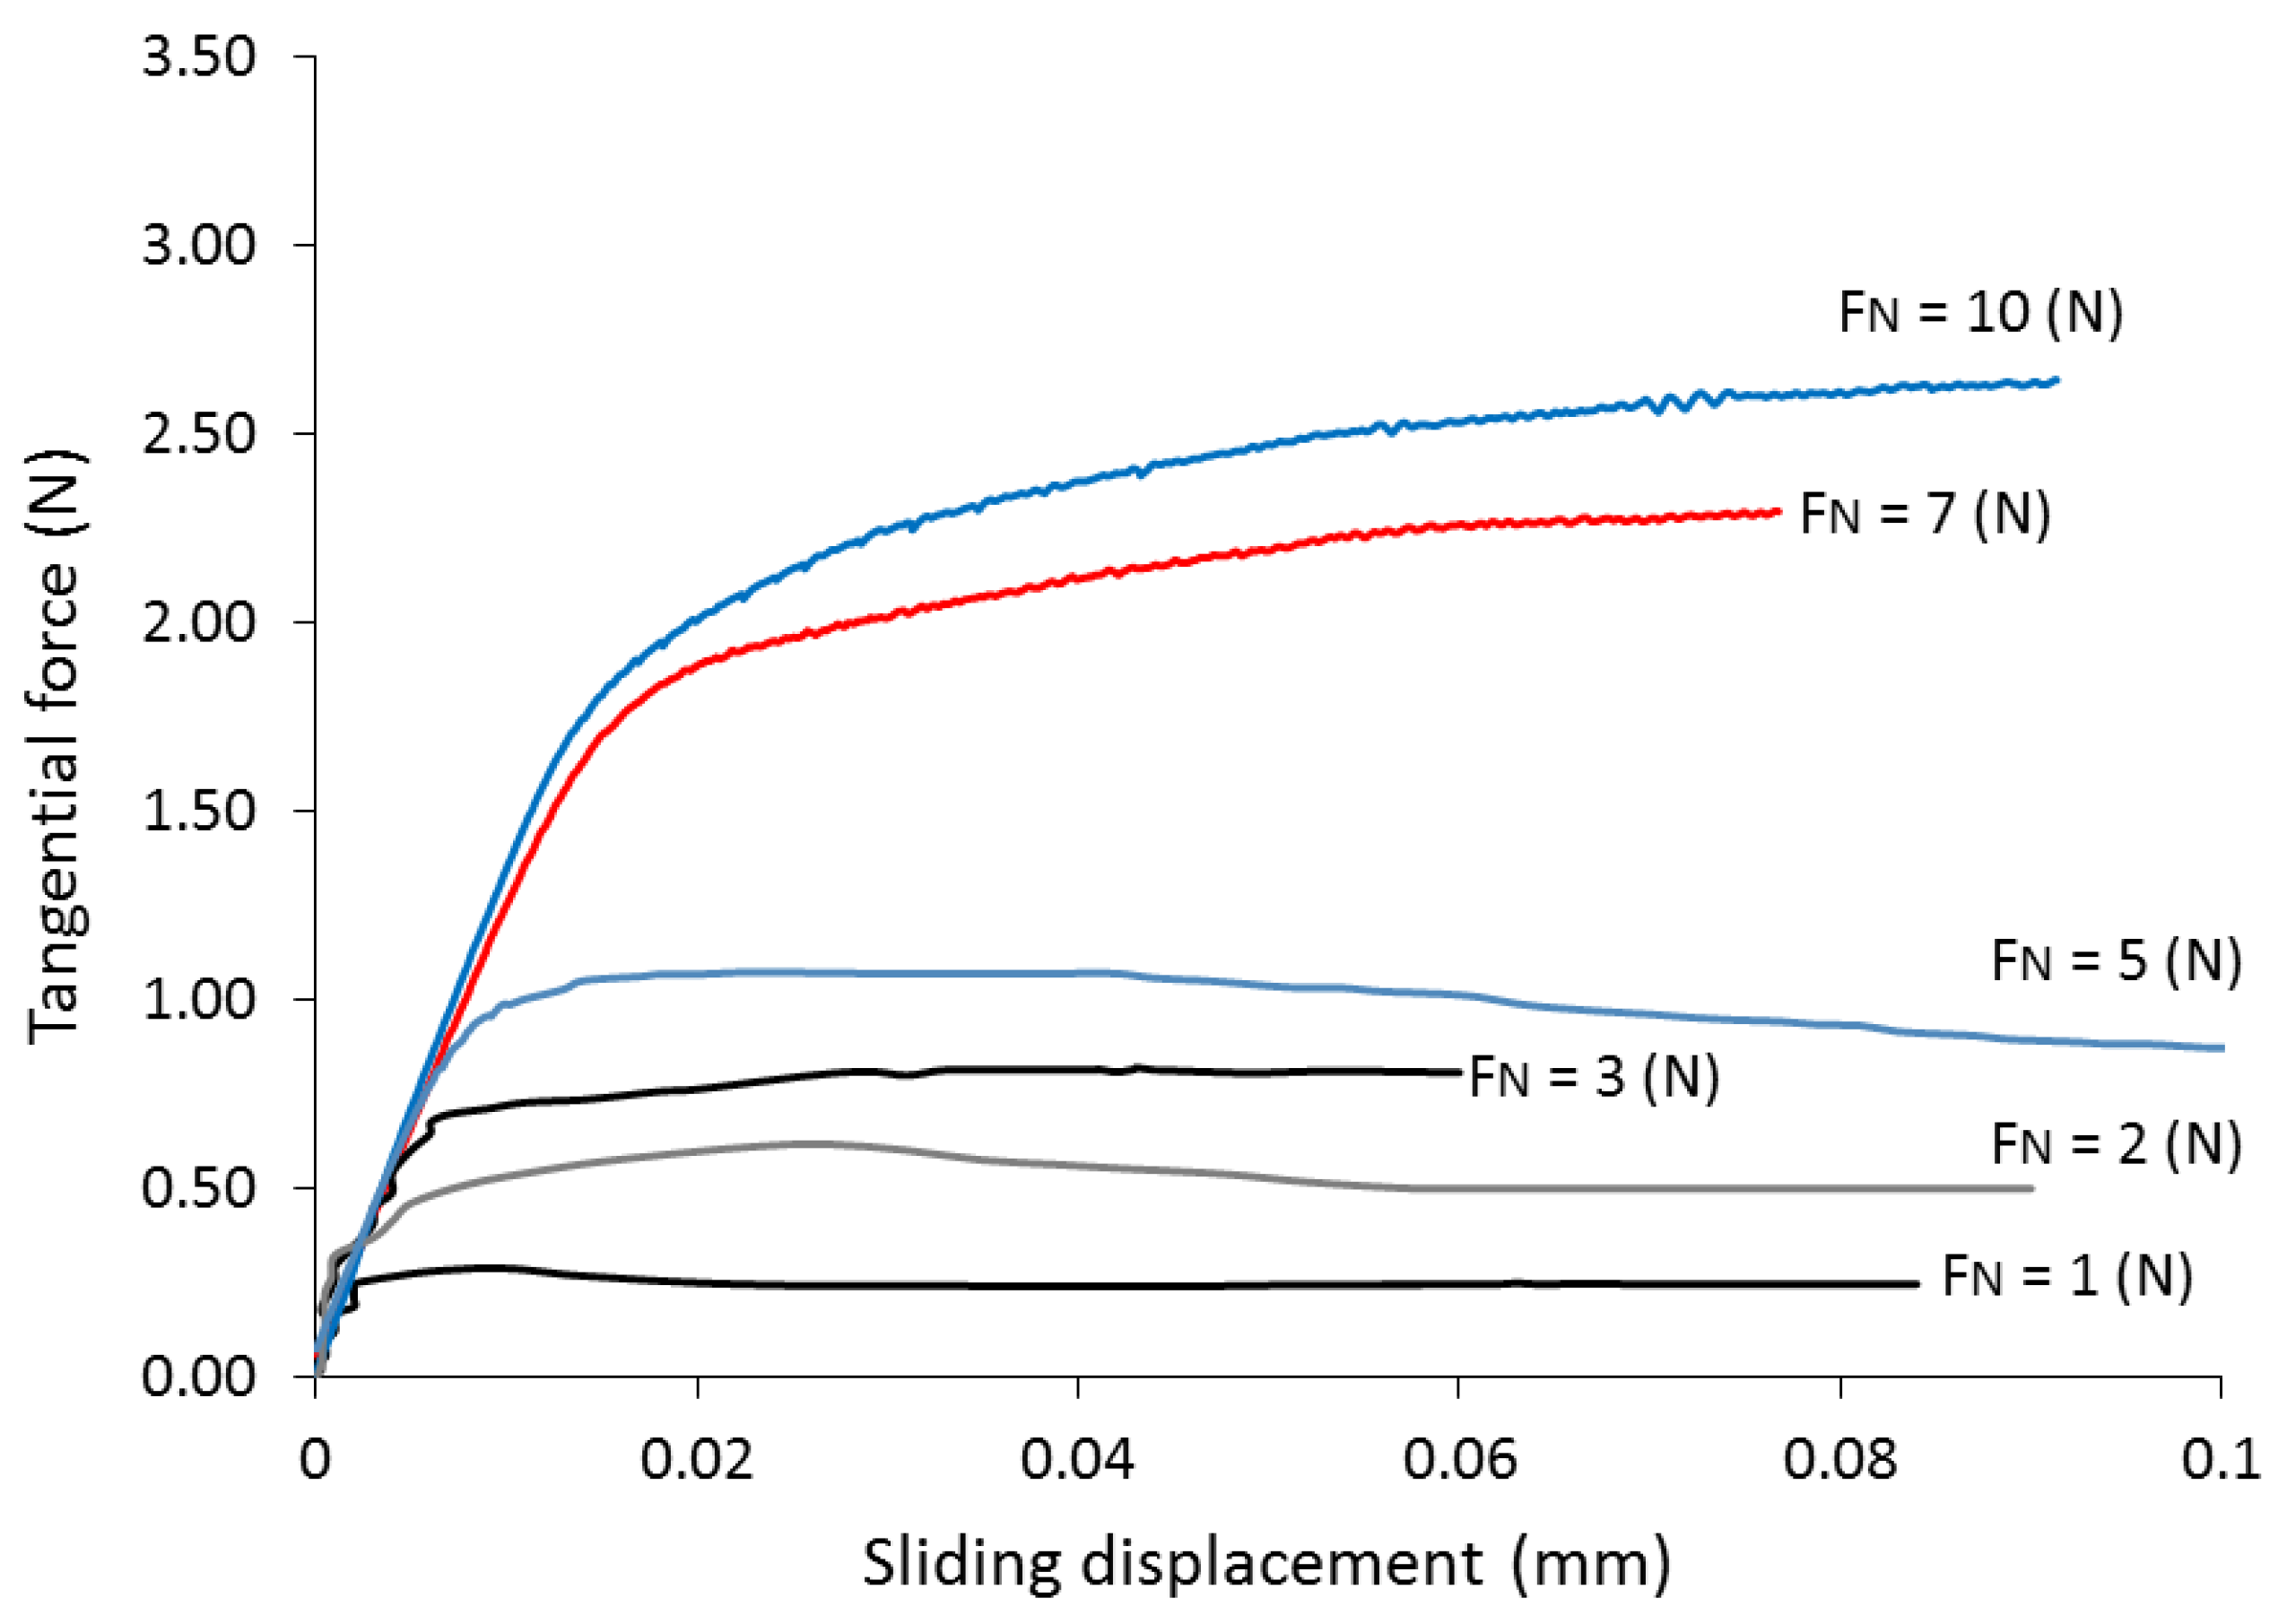
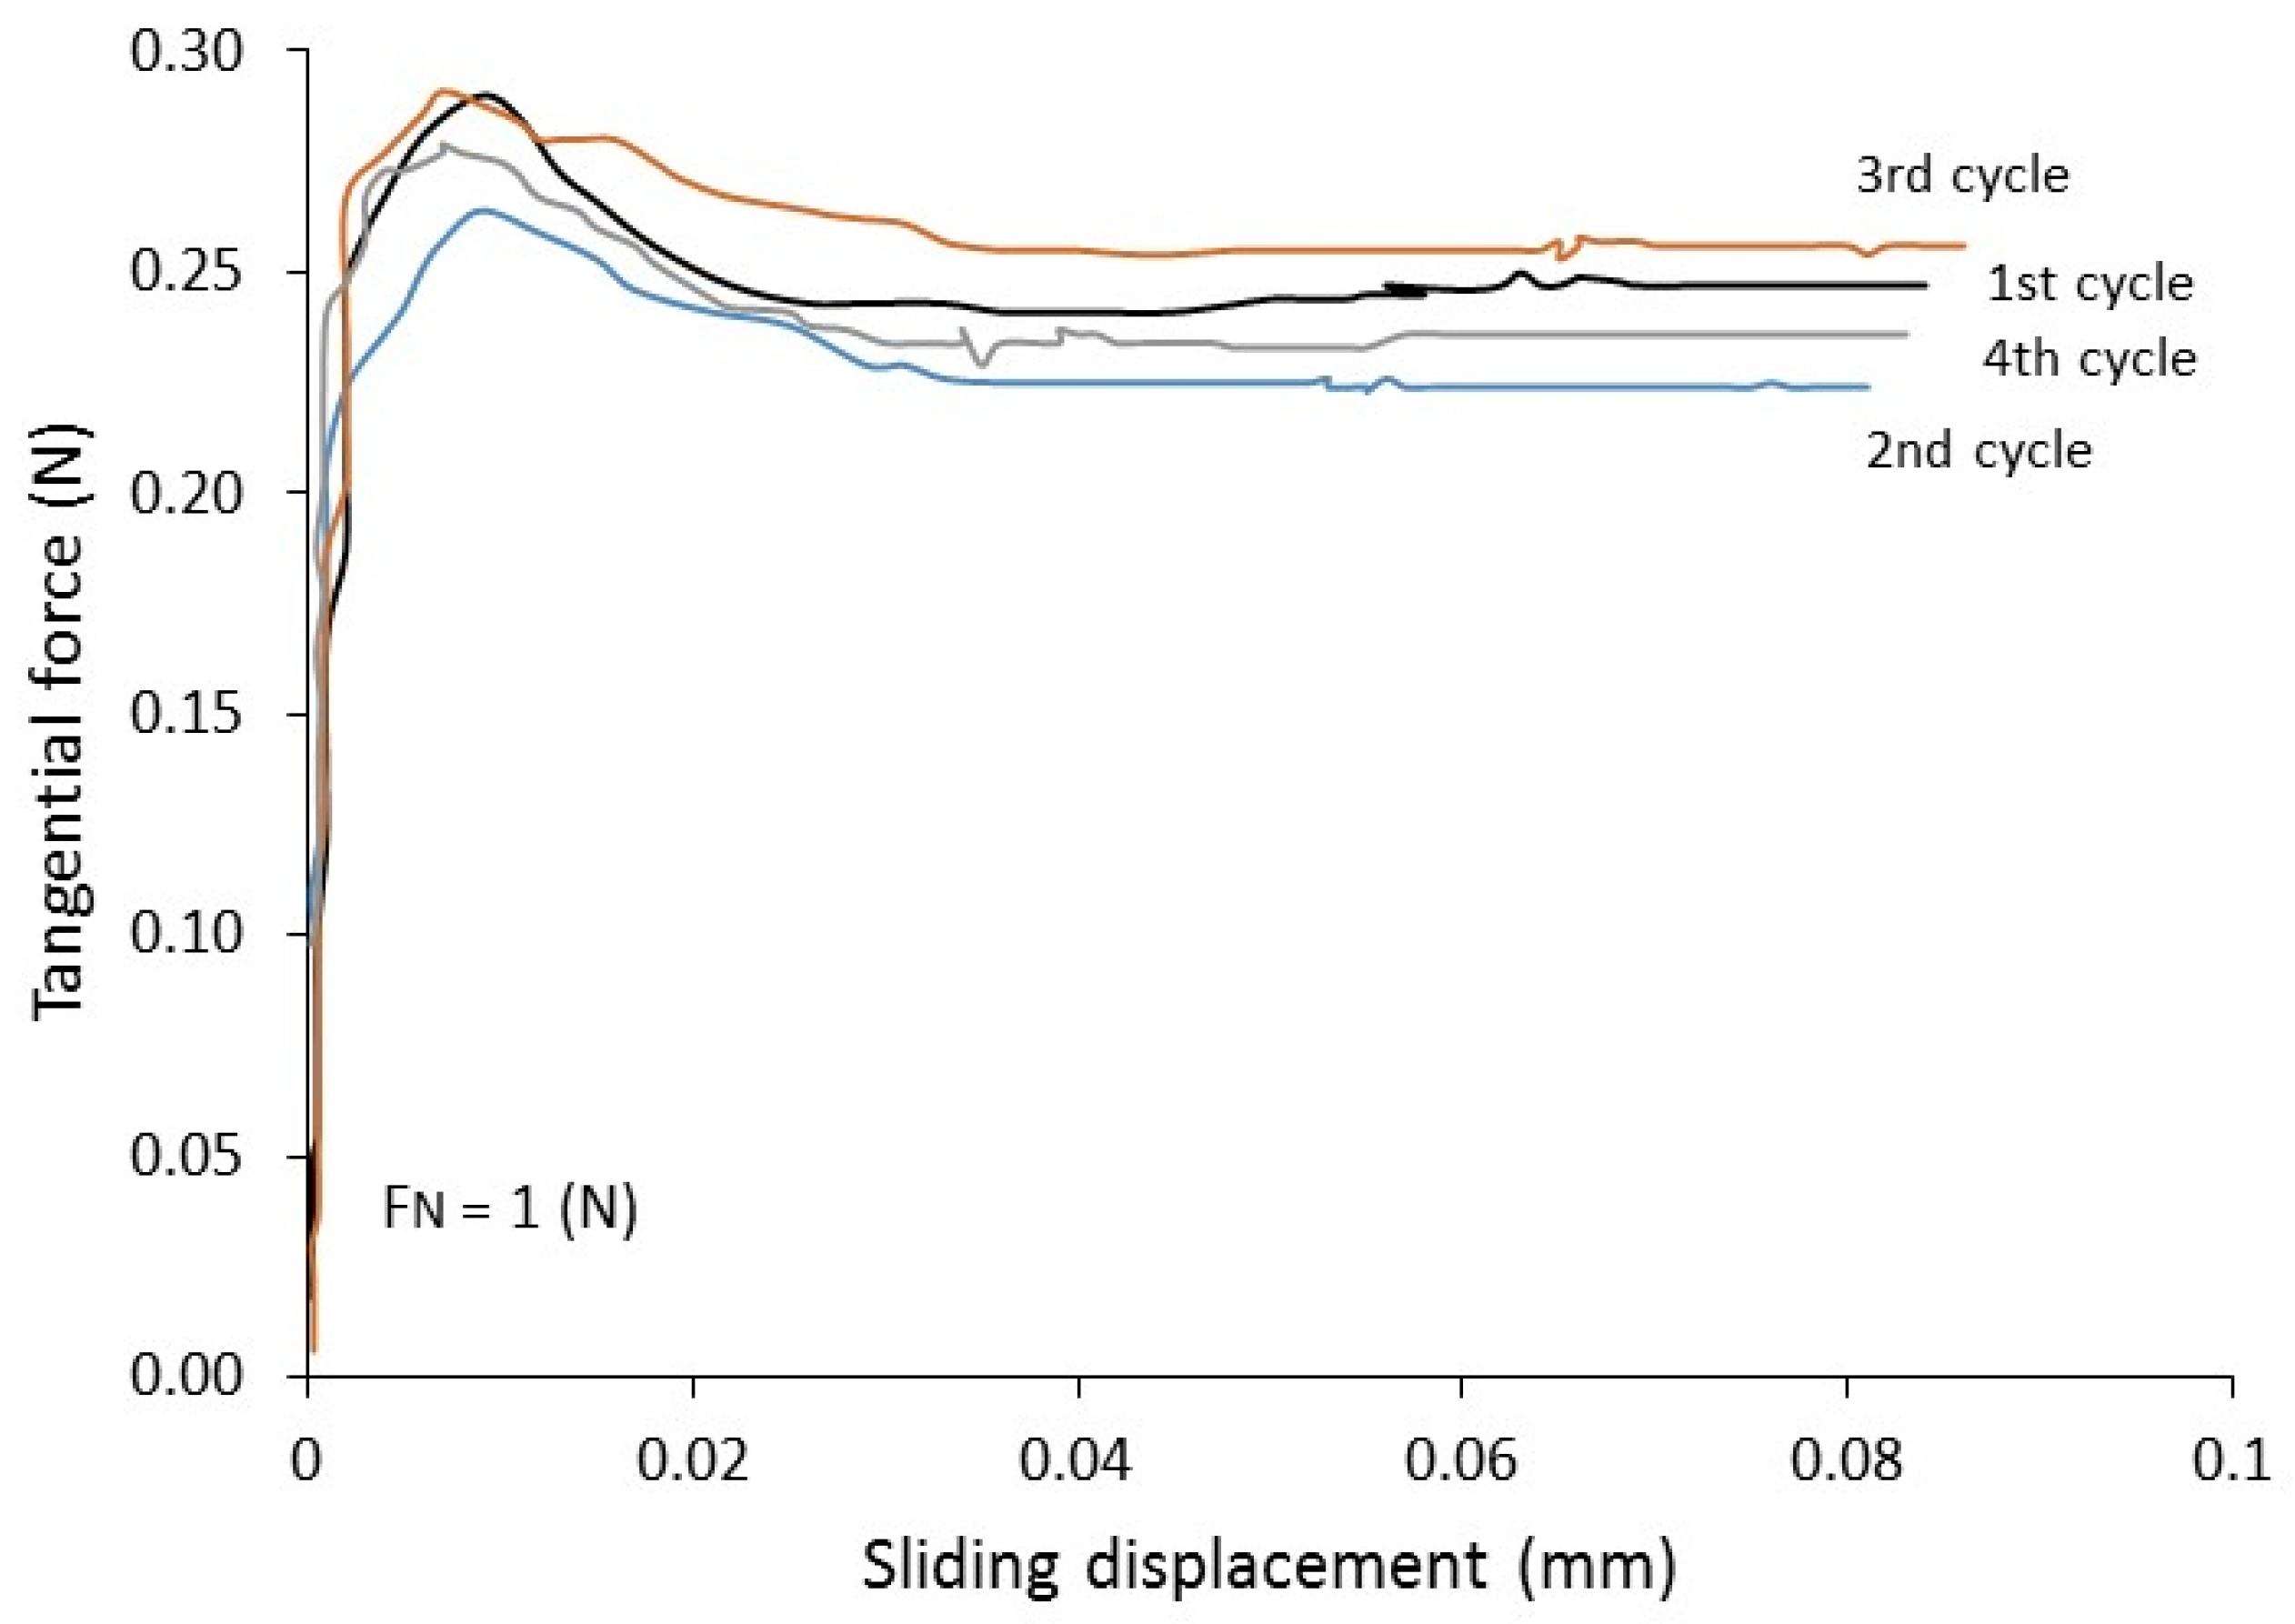
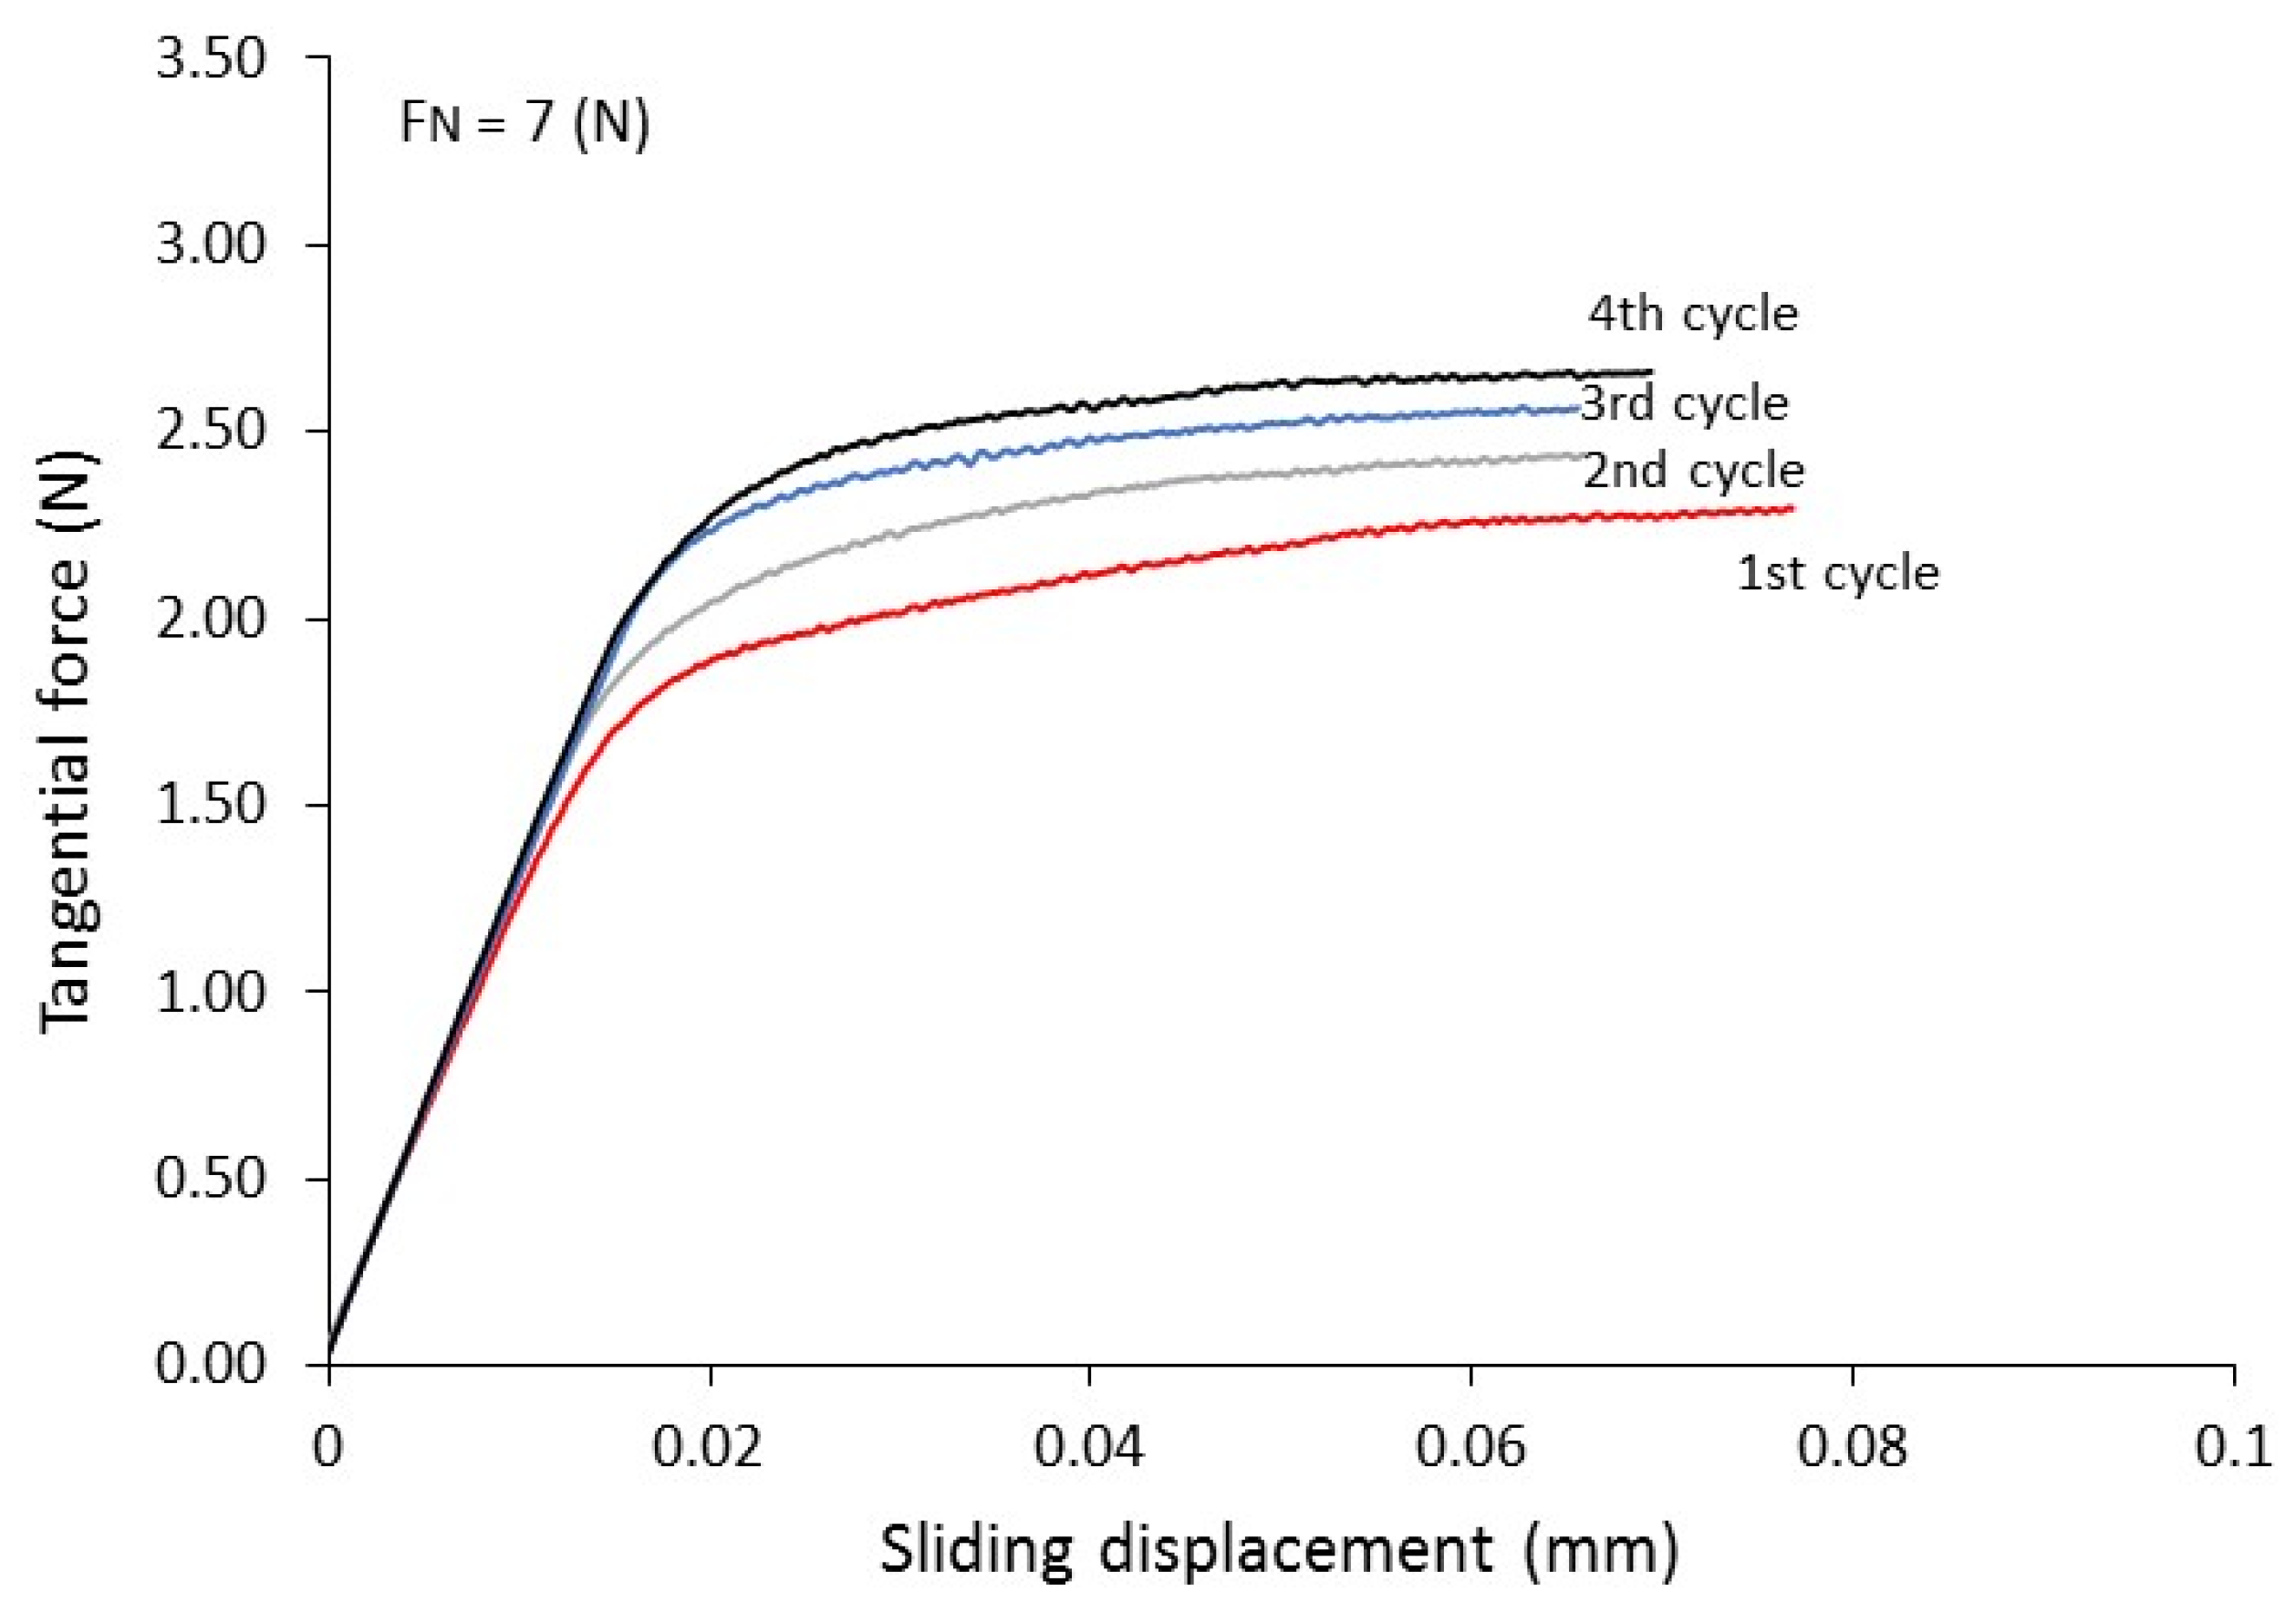
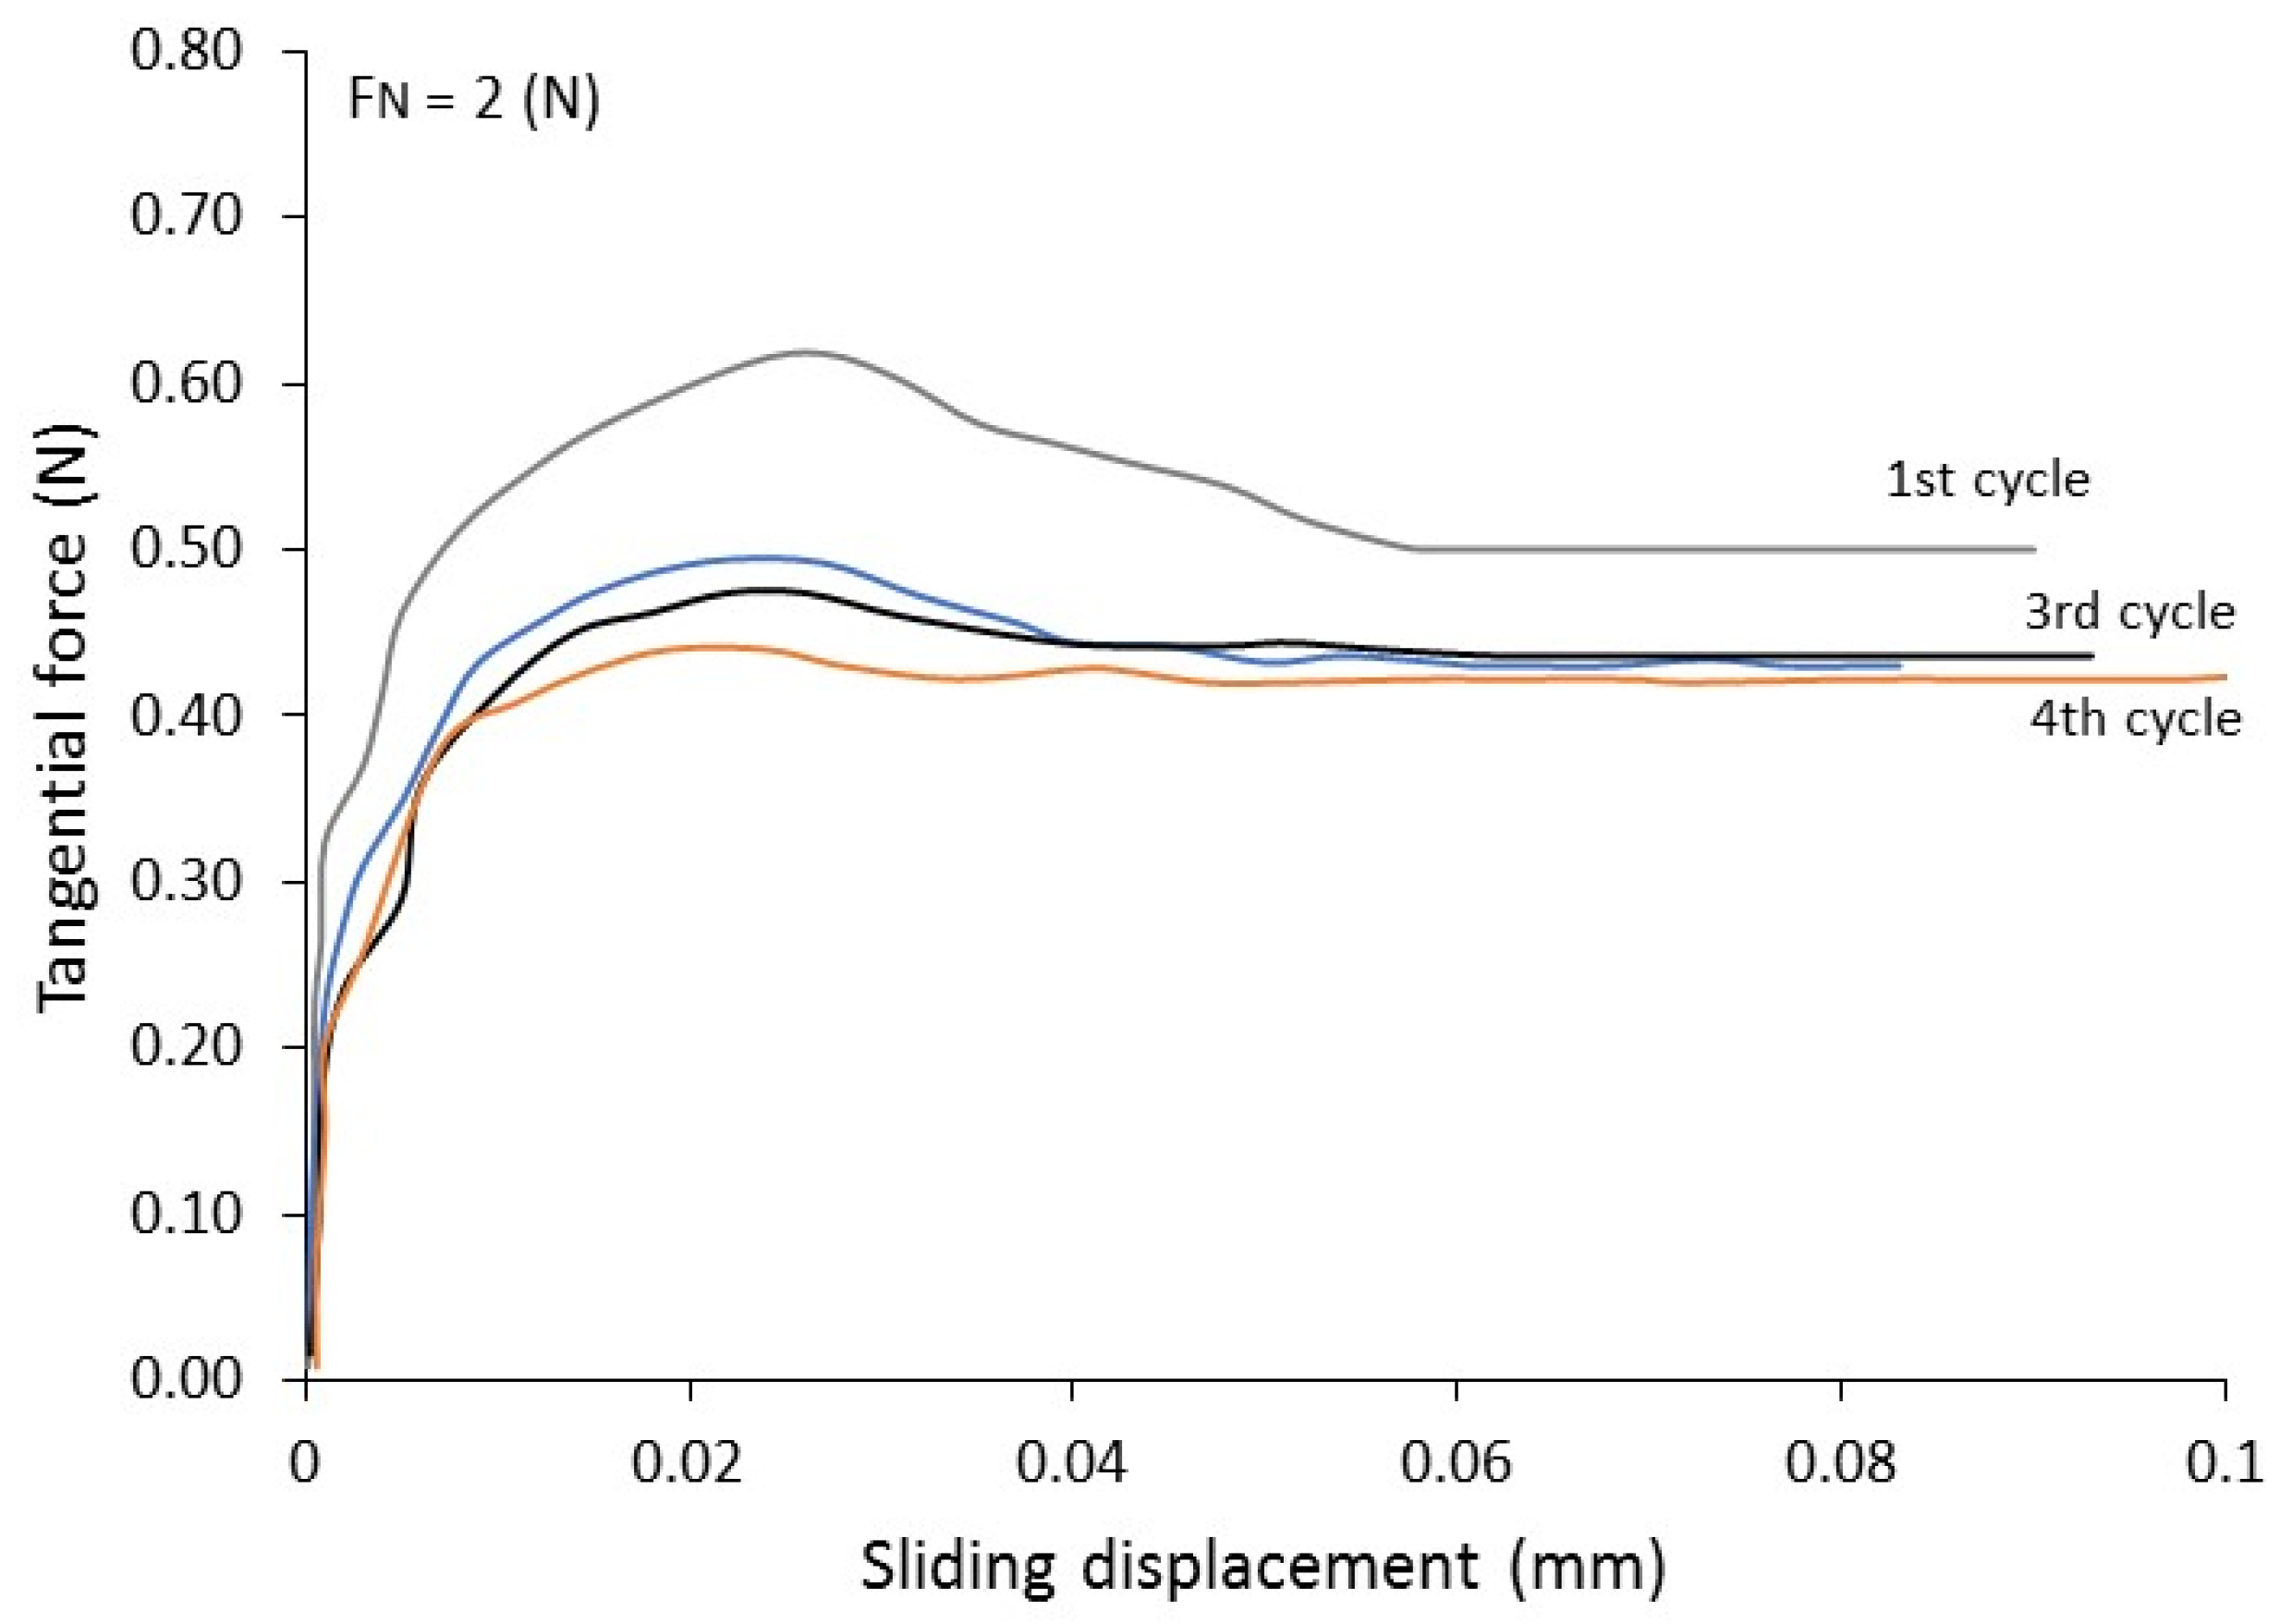
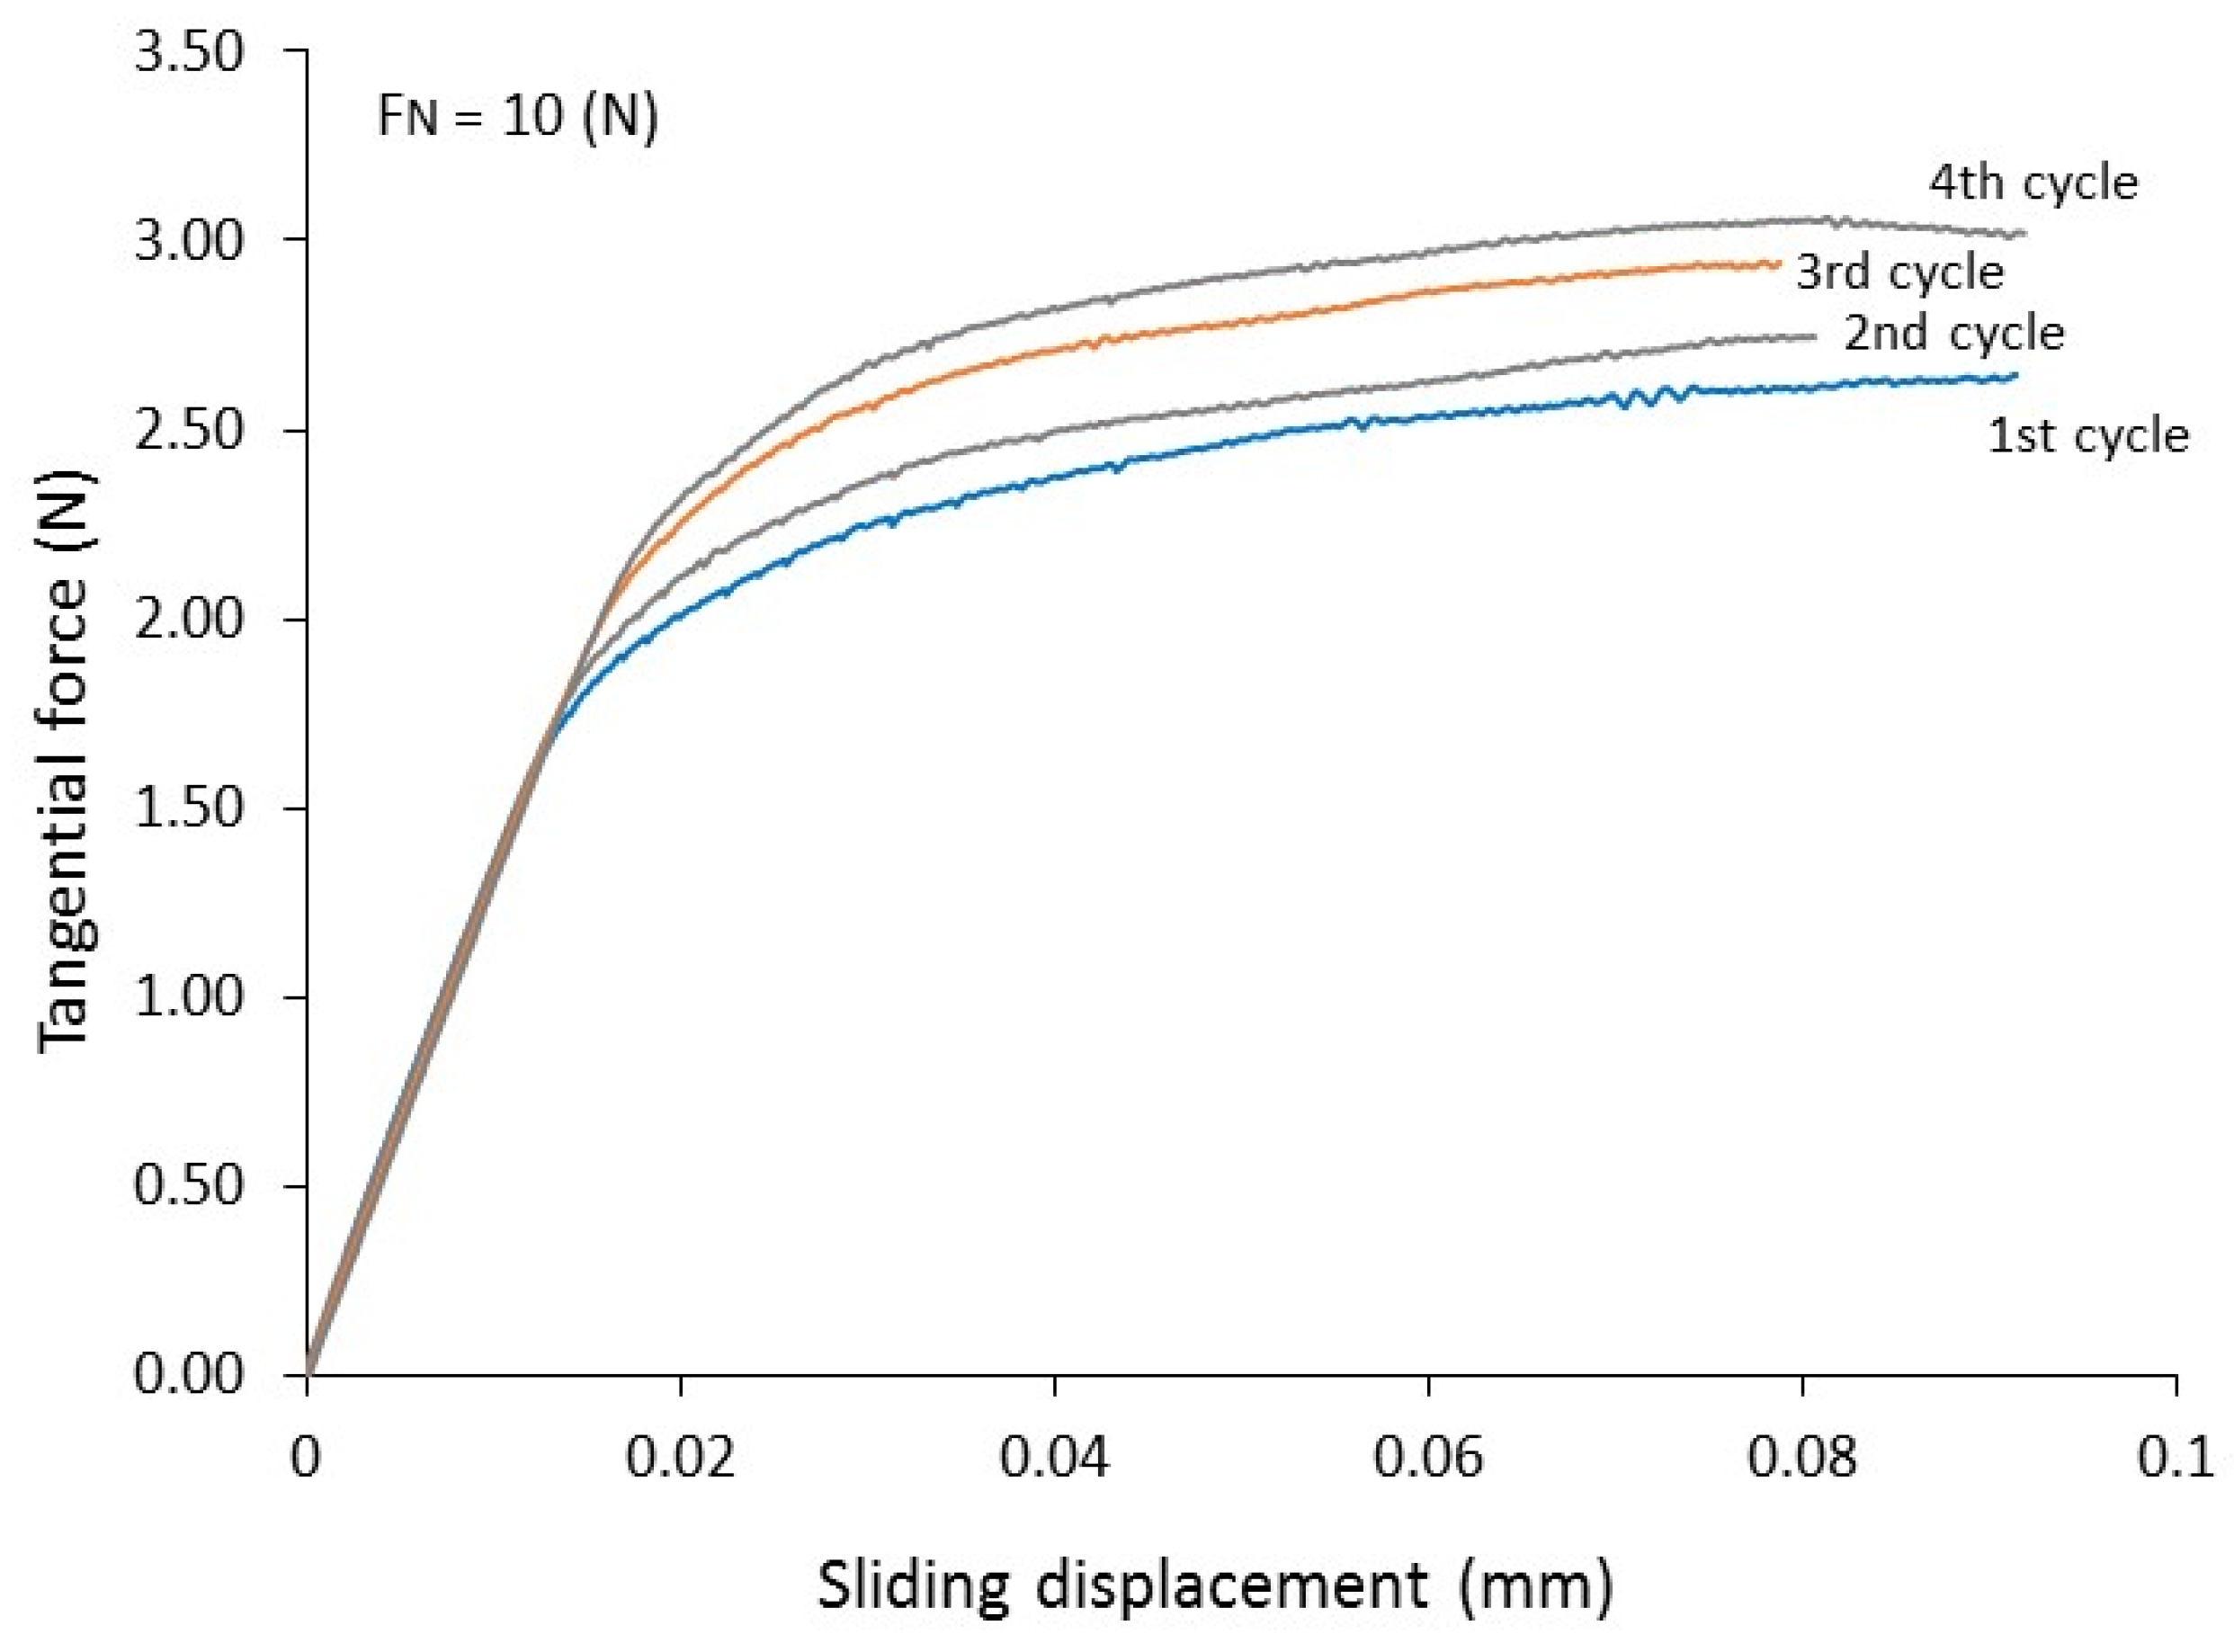
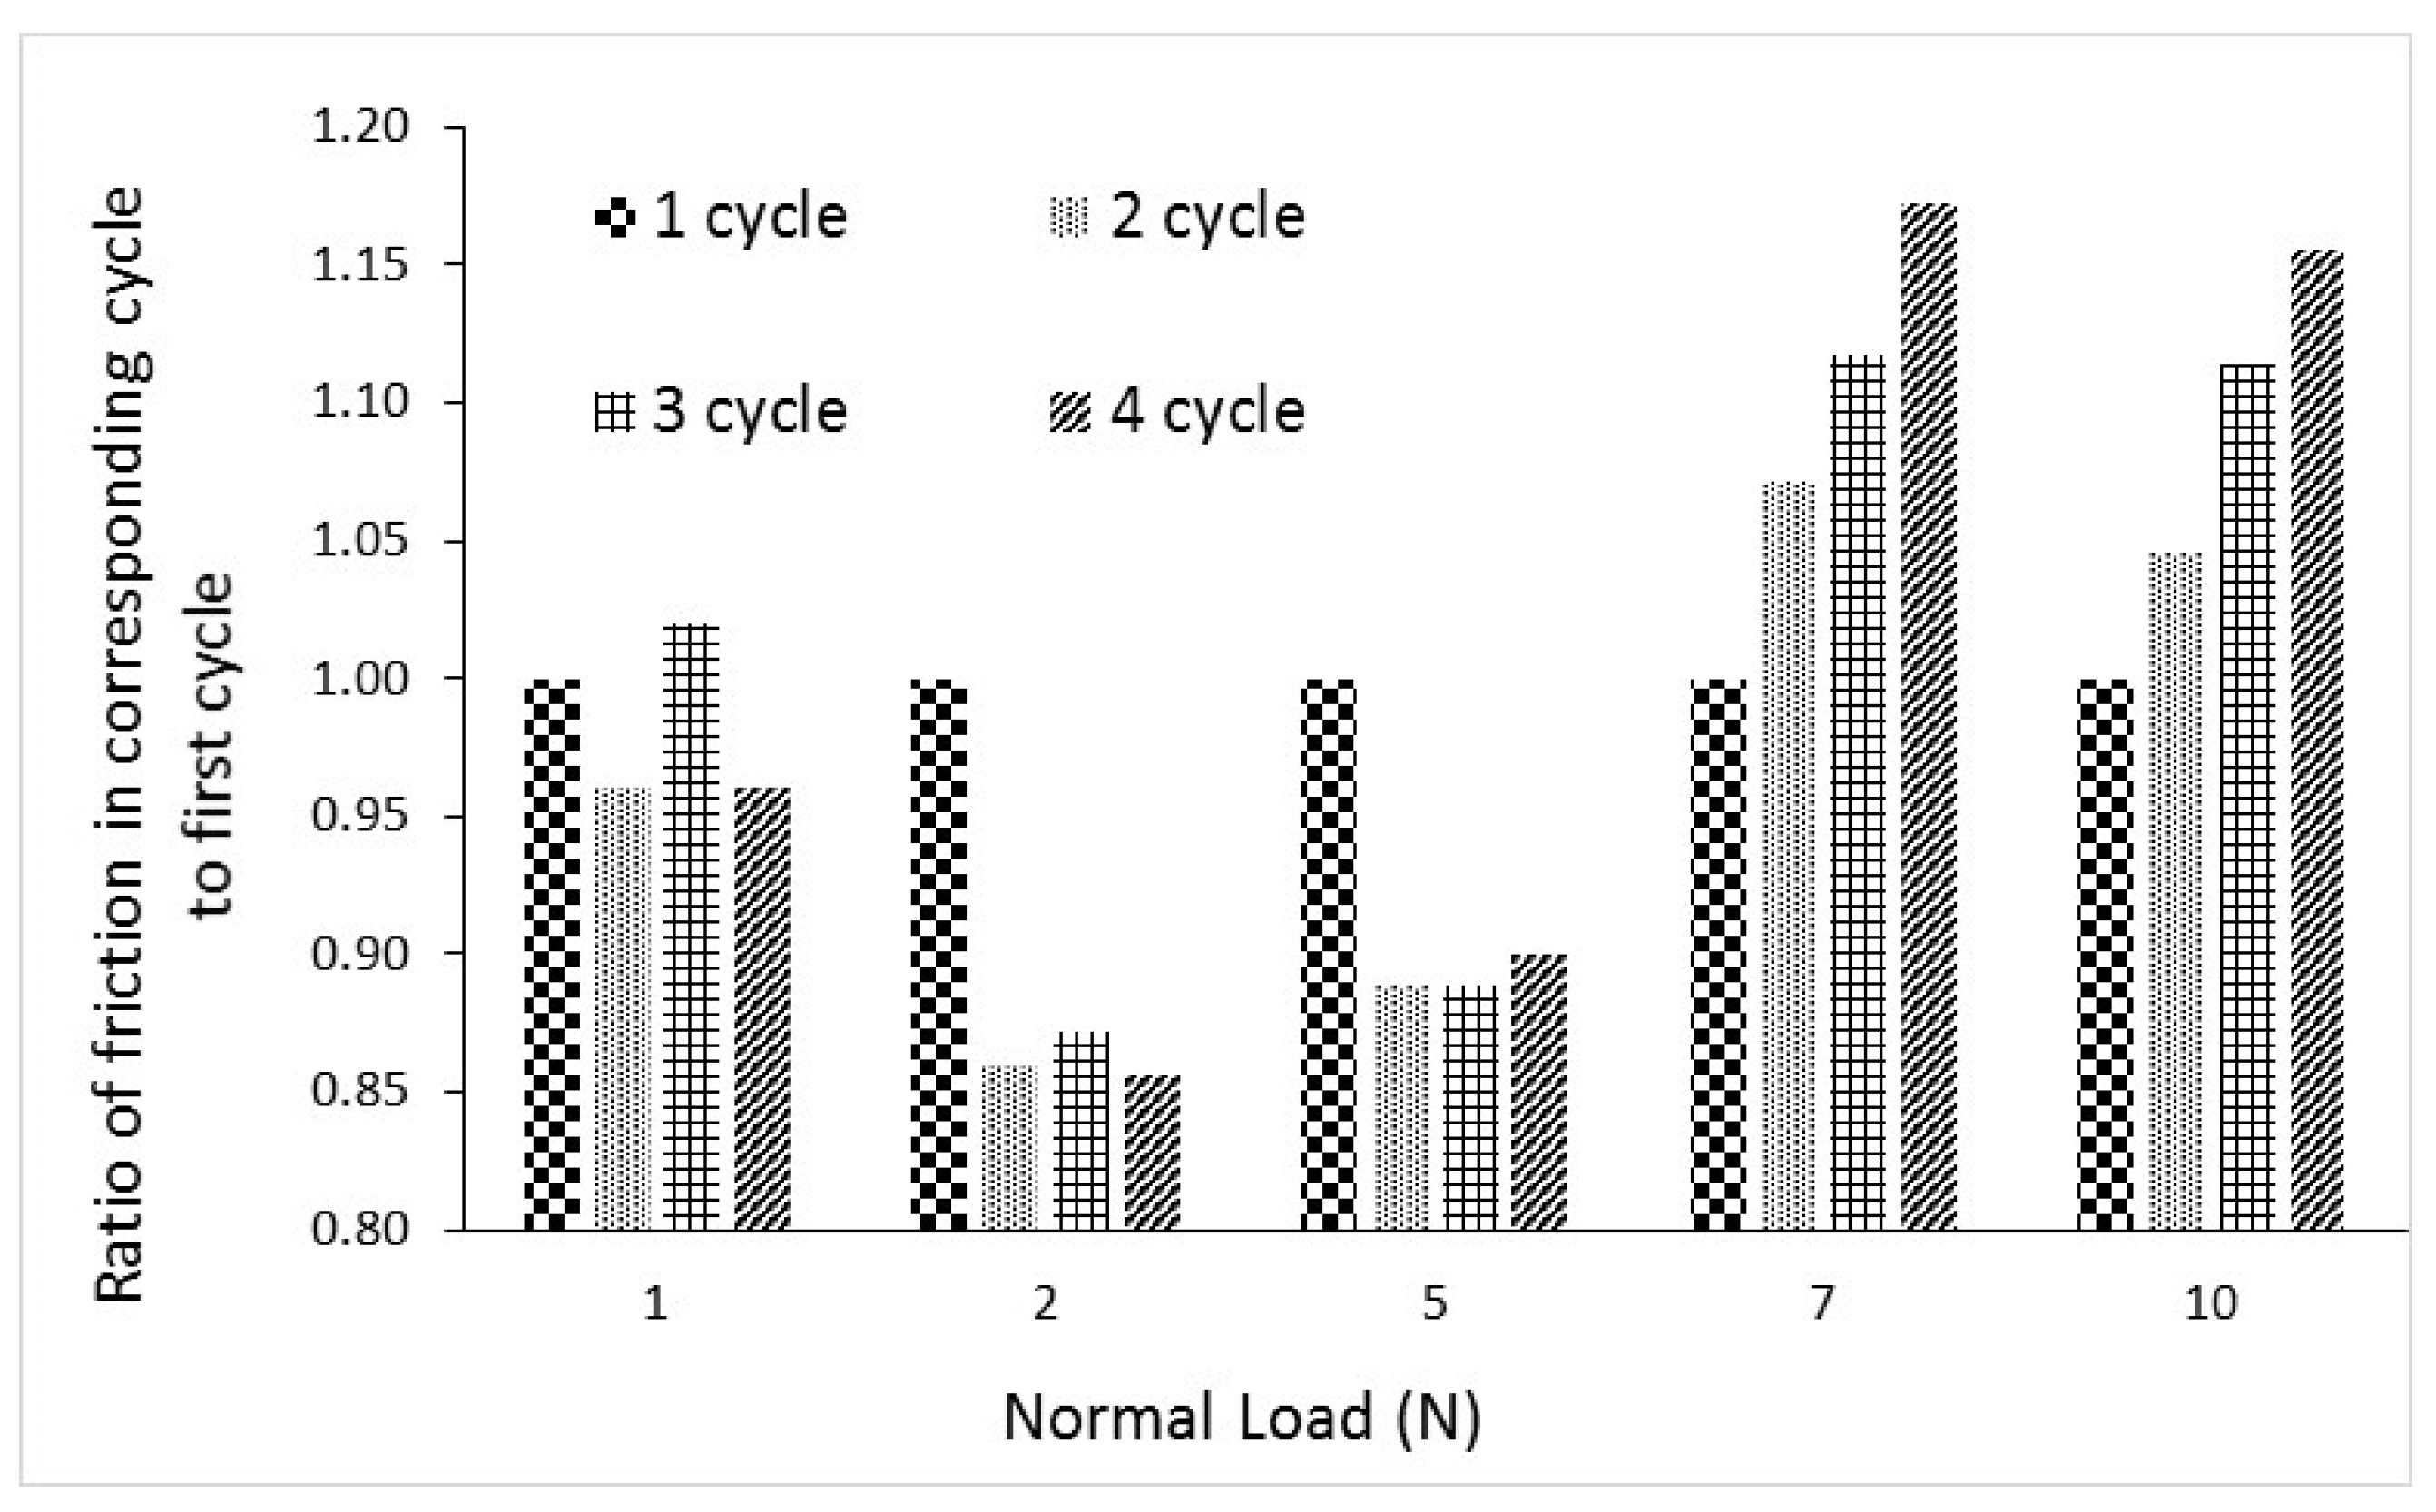
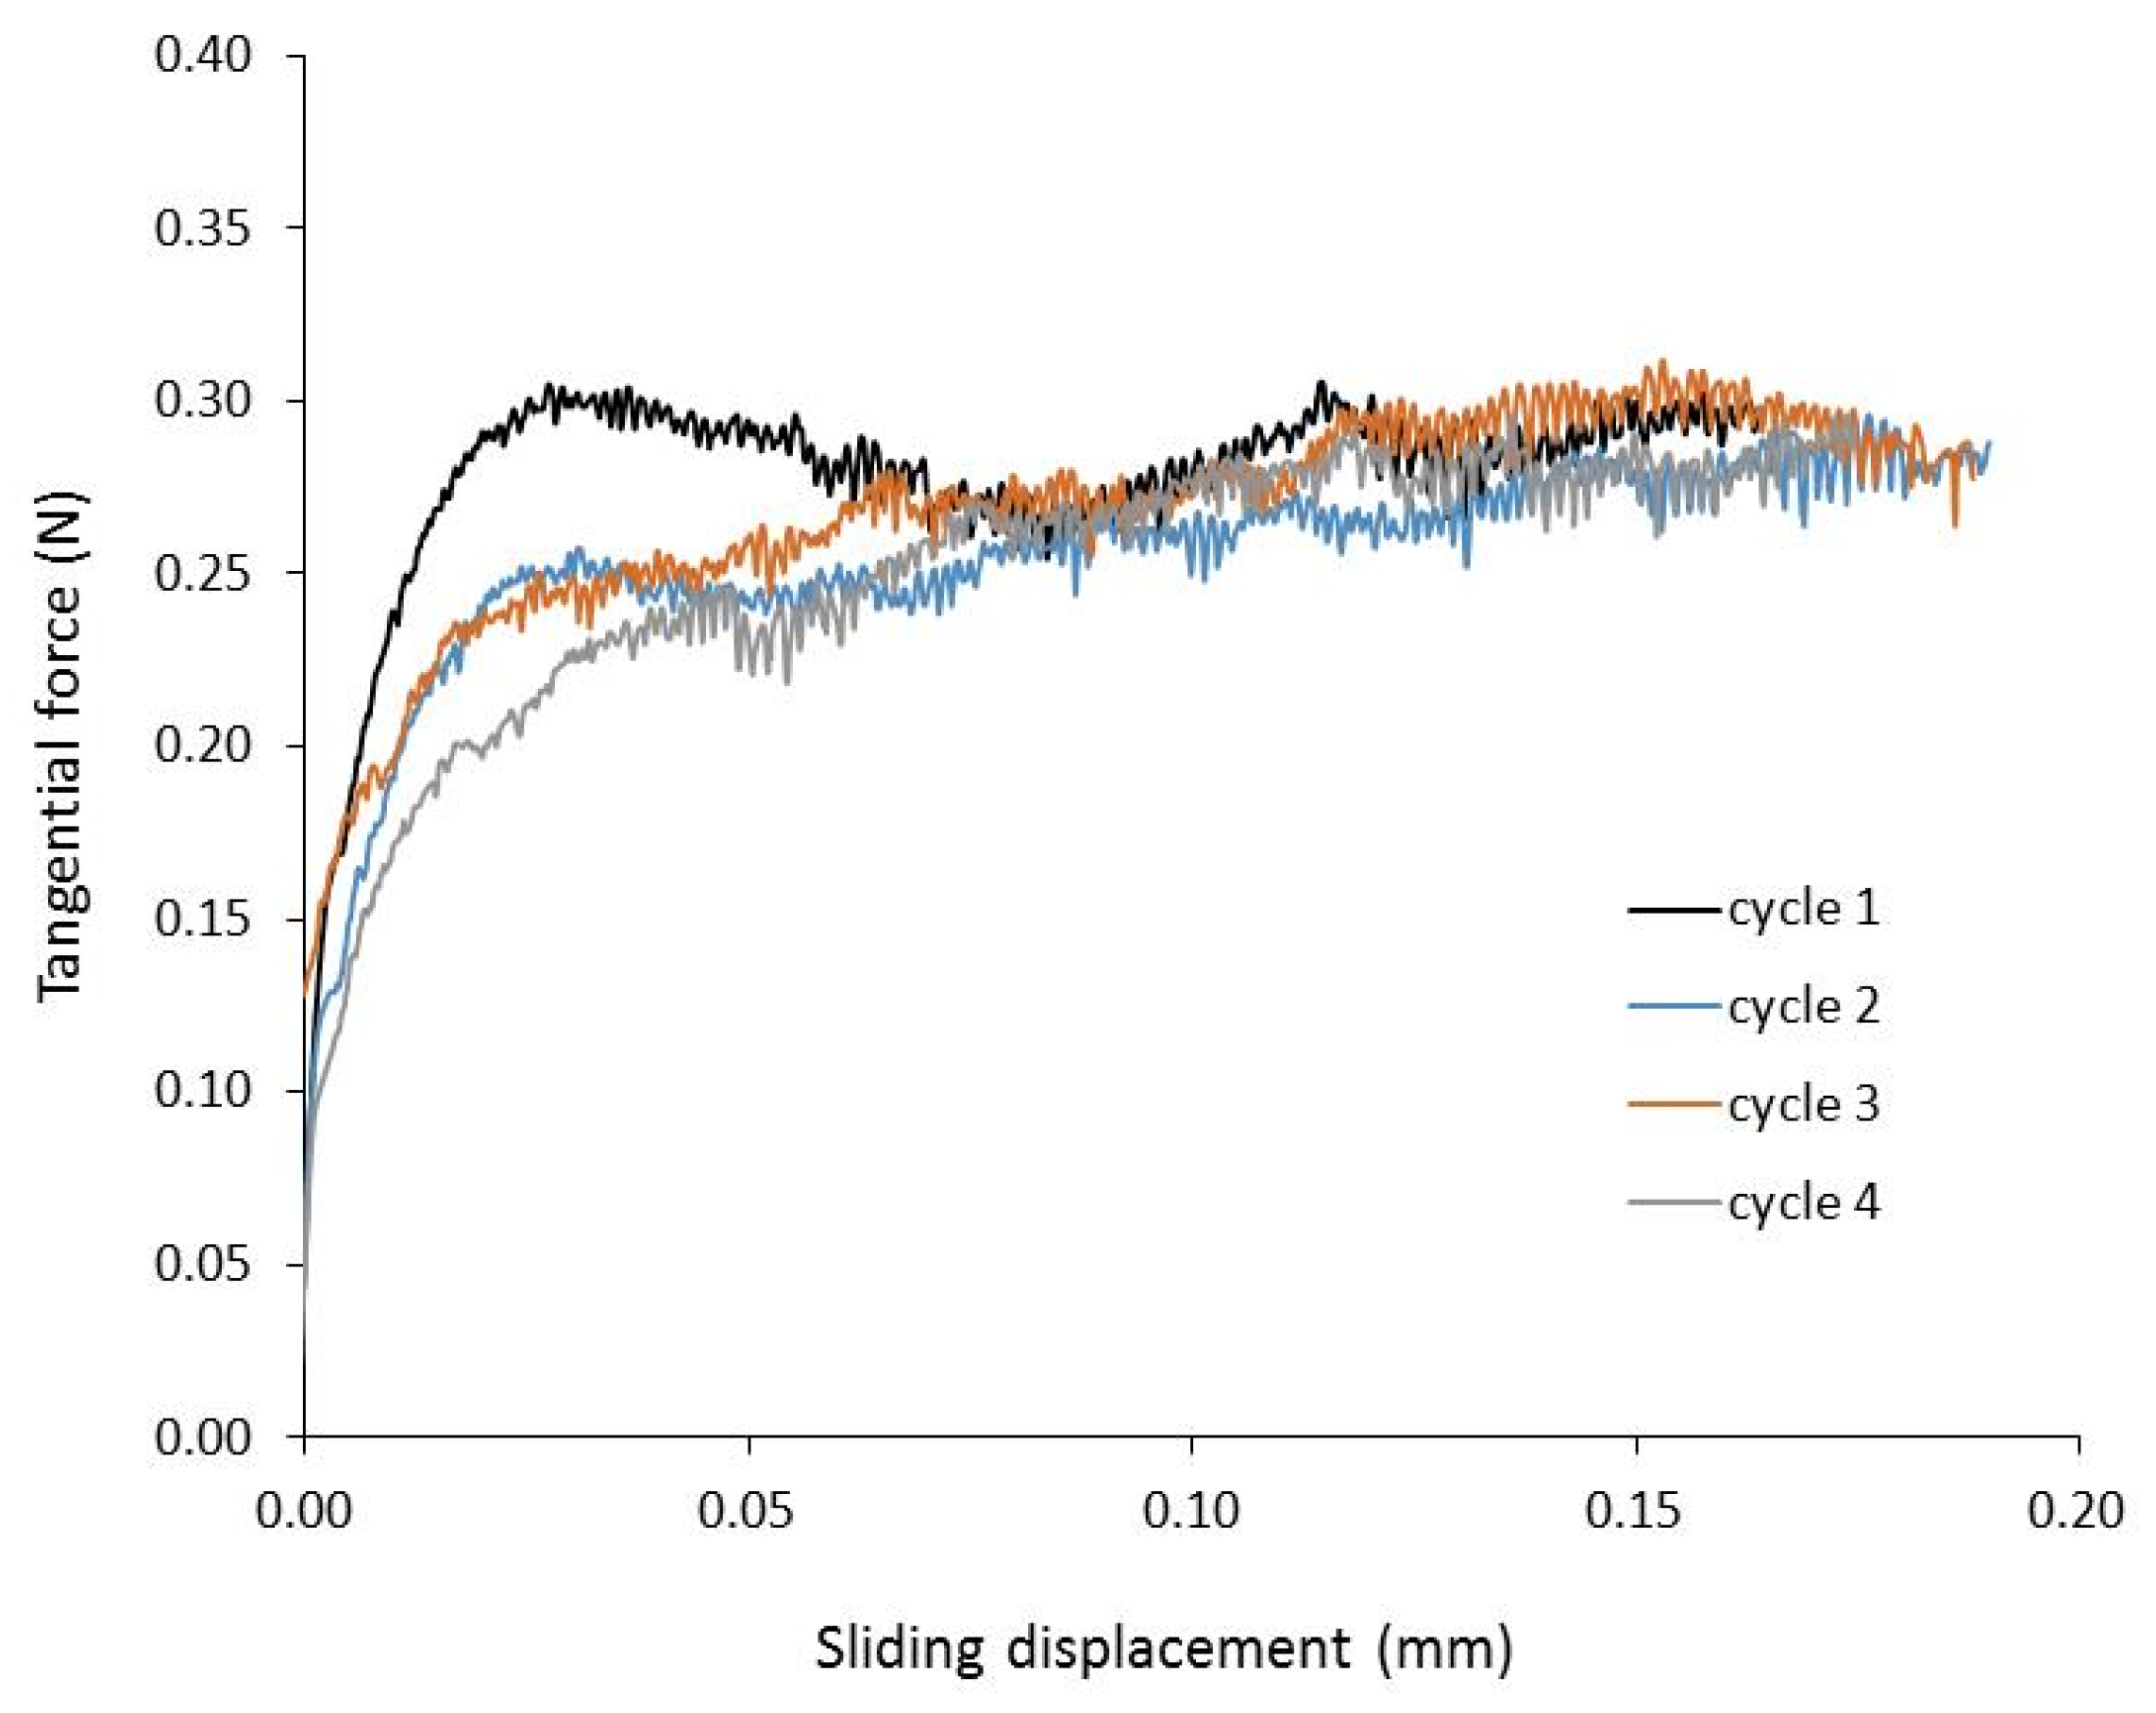
3.2. Tangential Load–Displacement and Friction for the LBS Grains

Figure 12 shows the whole set of experimental results for the LBS pairs of grains in terms of tangential force against the sliding displacement. These plots corresponded to the first shearing path (i.e. first cycle of sliding one grain over the surface of the second-stationary grain). For a given level of sliding displacement, the data indicated an increase of the tangential force for greater applied normal load. For most tests, a fairly steady state sliding was reached after the completion of a shearing path of about 10 to 20 microns.
The dynamic coefficient of inter-particle friction (μdyn) is defined as the ratio FT/FN at the steady state sliding. Based on this, the measured μdyn values for the LBS grains are summarized in Table 1. Inspecting these values that corresponded to the first cycle (i.e., first shearing path) for each pair of grains, it is noticed that there is no clear trend observed with the variation of μdyn with the normal load. Consequently, firm conclusions with respect to the potential effect of the normal load on the mobilized inter-particle friction at the steady state cannot be drawn. Figure 12 shows an increase in the tangential force with increasing normal load. Indeed, Senetakis et al. [5] reported a linear increase of the tangential force with increasing the normal load based on a large database of tests on LBS grains, which implies that μdyn may be independent to the applied normal load.
Note that for each given set of grains, after the completion of the shearing test at a given nominal normal load, the contact was lifted off, the lower grain was placed to its initial position through a backward movement of the horizontal micro-stepper motor, and the same grains were set for a new test moving in a downward manner the upper grain reaching again the contact between the grains. Thereafter, a second shearing test was conducted following the same shearing path. It is assumed, based on this process and that the compliance of the system is maintained in the out-of-plane direction, that the second, or subsequent third and fourth shearing, results in testing the grains with repeating cycles maintaining the same contact area and shearing path for the total set of tests for the given pair of grains [5]. This allows a study into the effect of repeating loading (i.e., repeating shearing) on the frictional response of the LBS and CDV granules.
Figure 13, Figure 14, Figure 15 and Figure 16 show the effect of repeating the shearing test to the same pairs of grains at normal loads of 1, 2, 7 and 10 N, respectively. At a normal load of 1 N, there was not observed any clear effect of the repeating shearing on the tangential force–displacement relationship and thus, the inter-particle coefficient of friction. At a normal load of 2 N and a given sliding displacement, there was observed a slight drop of the tangential force, and thus the mobilized inter-particle friction, when the shearing test was repeated from the first to the forth cycle. However, between the second and forth cycle, the curves converged. Note also that at these small normal loads of 1 and 2 N, a peak state was apparent, which was more pronounced at FN = 1 N. At a normal load of 7 and 10 N (Figure 15 and Figure 16), there was not reached a peak state during the shearing of the grains and the sliding continued with decreasing rate of tangential force increase, reaching a fairly steady state of sliding. Note that for these greater normal loads, the repeating shearing tests led to an increase of the inter-particle coefficient of friction. Figure 17 gives a summary, in terms of histograms, of the effect of the repeating shearing tests on the dynamic inter-particle coefficient of friction. These results illustrated the different responses of the LBS grain contacts at small normal loads (1 to 5 N) and greater normal loads (7 and 10 N).
In their study, Senetakis et al. [6] quantified, for a limited number of tests, the damage to the grain surface due to shearing experiments on LBS grains. In particular, they examined the surface roughness of the grains tracking the shearing path before and after the conduction of micromechanical sliding tests. Senetakis et al. [6] reported a reduction of the surface roughness of the order of 20% to 60%, but this reduction may have been the coupled result of the application of the normal load and the shearing test. Similar observations were reported by Senetakis et al. [7] testing crushed limestone grains in their recent study. It is possible that this reduction of the surface roughness may have resulted in slightly different responses between the first and second cycle of shearing for the test at FN = 2 N. This is because the first shearing showed a peak state which was less apparent during the successive cycles, and that after the first cycle, the inter-particle friction dropped but without further notable reduction for the third and fourth shearing test. At a normal load of 1 N, it is assumed that the damage of the surface roughness might be less pronounced, which would explain the very similar shapes of the tangential force–displacement plots which were independent to the cycle number as well as the less pronounced effect of the number of shearing cycle on the inter-particle coefficient of friction. At a greater normal load of 7 or 10 N, the absence of a peak state might be explained by the possible plowing effects [9], which resulted in an increase of the inter-particle coefficient of friction when the shearing test was repeated. As reported by Yang et al. [9], plowing effects might result because of the shearing process. It is believed that further systematic study is necessary investigating and quantifying the shearing track and the surface roughness of the grains accounting for the role of the magnitude of the applied normal load as well as how the surface damage is affected by the number of shearing cycles.

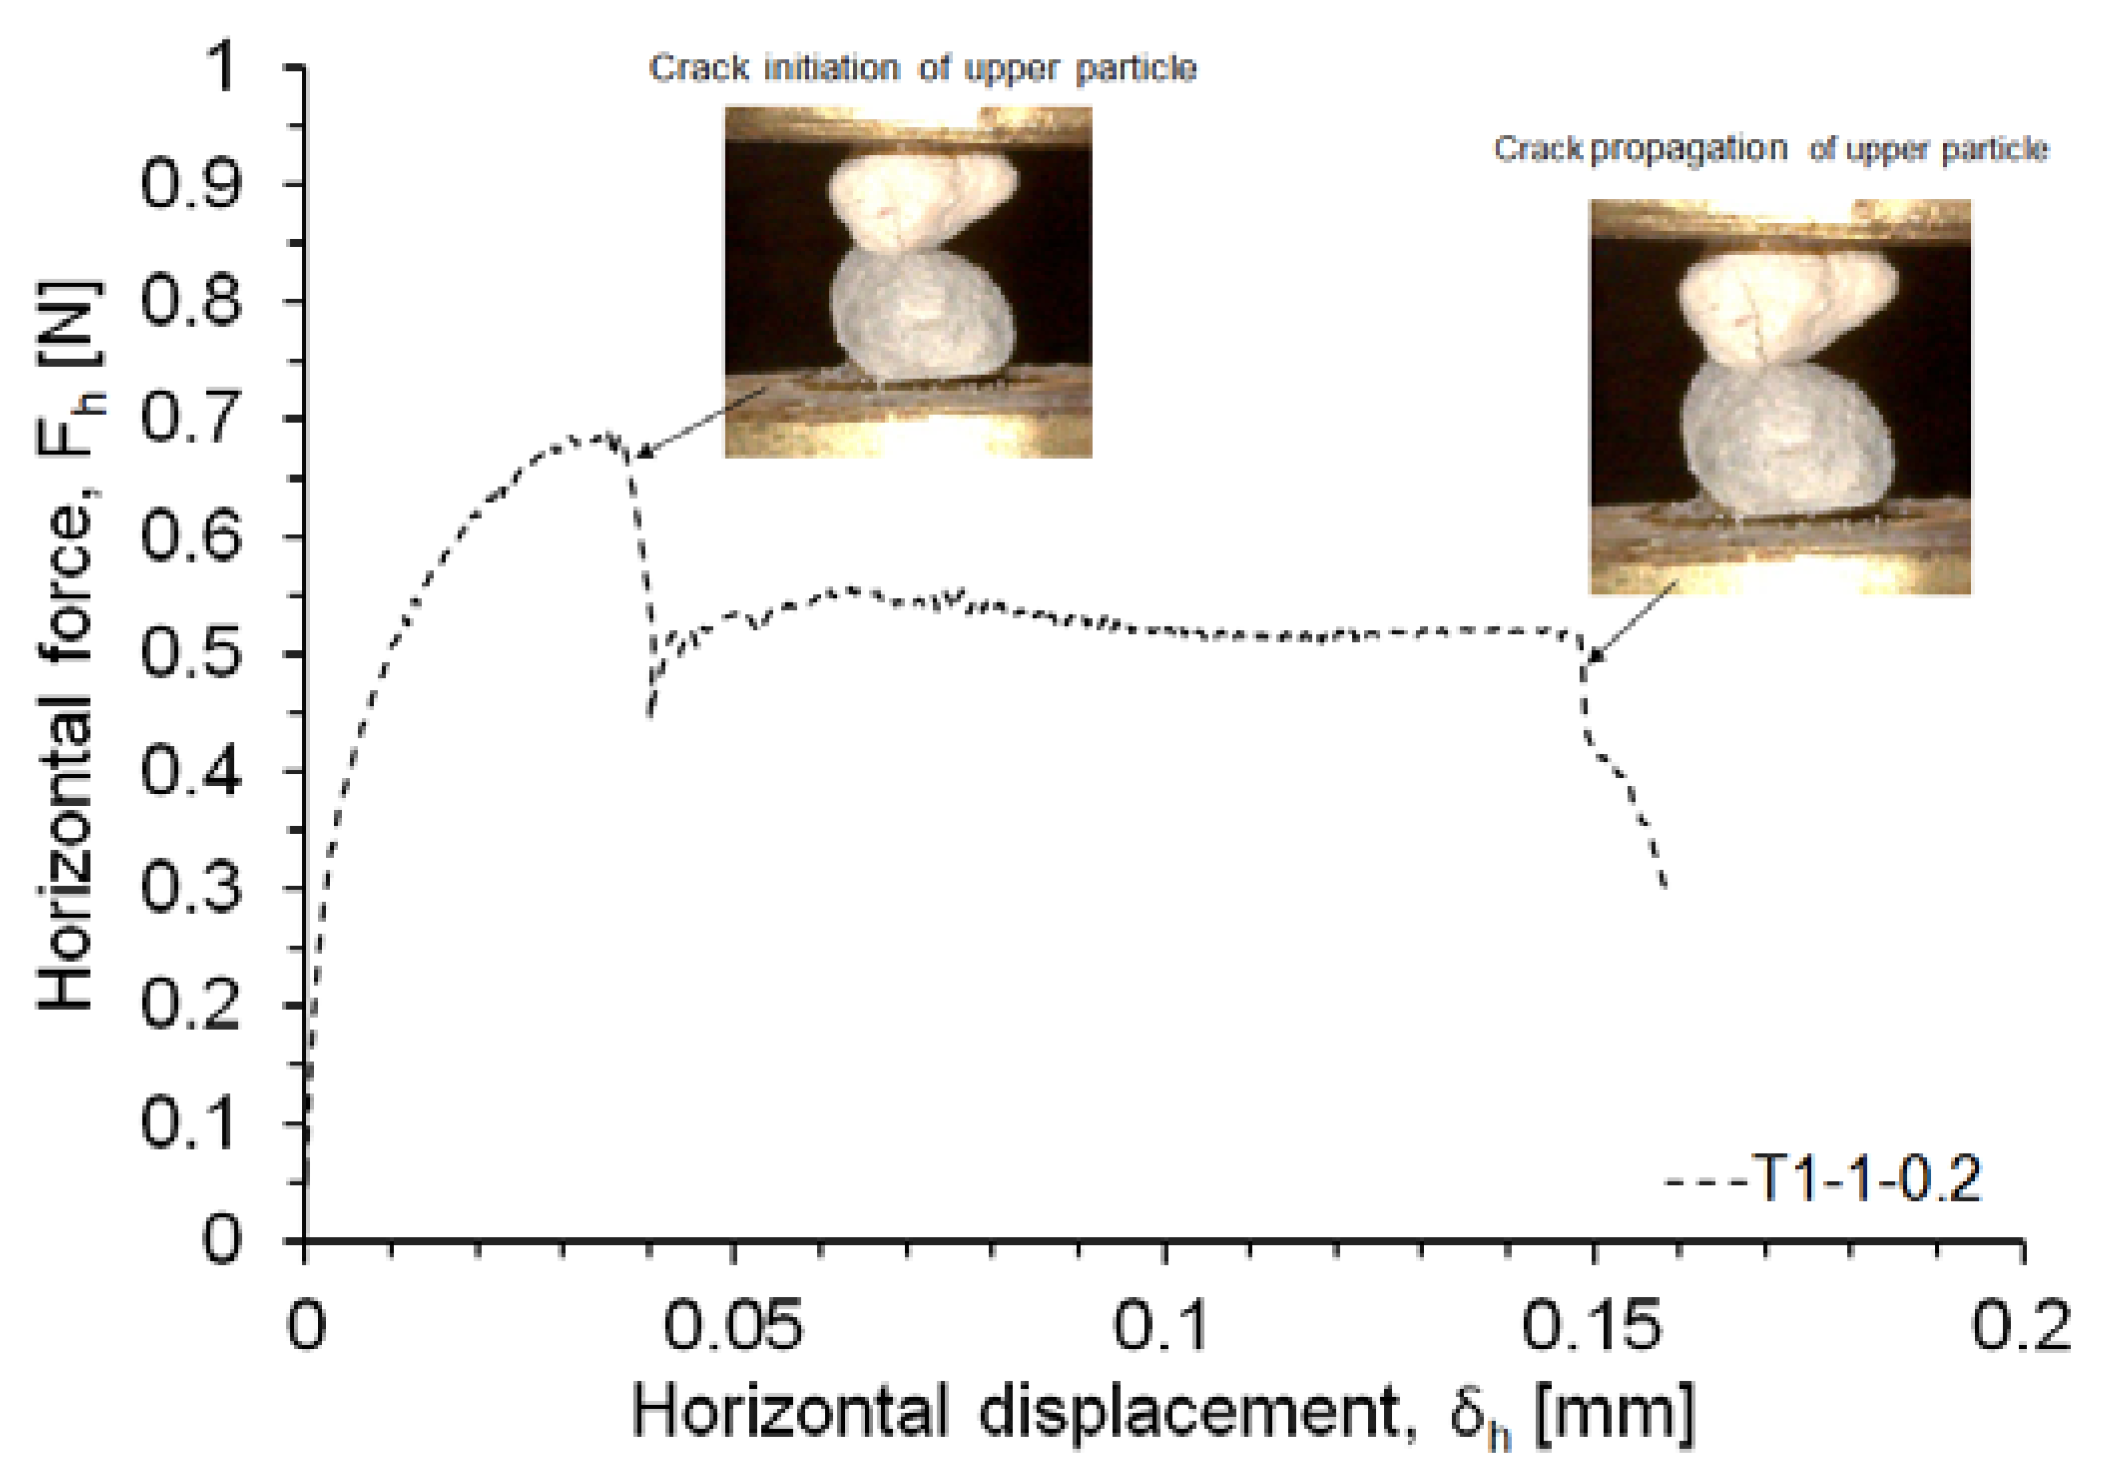
3.3. Tangential Load–Displacement and Friction for the CDV Granules

Figure 18 shows the plots of tangential load–displacement for the four repeating shearing tests on a pair of CDV granules. It is interesting to notice that only the first shearing gave a peak state and the subsequent shearing cycles resulted at increasing force with a hardening regime followed by a steady state response without occurrence of a peak state. Perhaps, due to the softer nature of the CDV granules contacts, more pronounced damage could result after the first shearing test with smoother surfaces giving rise to slightly different shapes of the tangential force–displacement plots for the subsequent shearing tests. The μdyn values from this set of tests are summarized in Table 1. During the repeating shearing tests the LBS grains had a dynamic inter-particle coefficient of friction that ranged between about 0.18 and 0.38, but the CDV granules exhibited much greater friction with μdyn values that ranged between 0.54 and 0.66.
These high friction values for the CDV granules might be, partly, due to their rougher surfaces. Cavarretta et al. [4] reported an increase of the inter-particle coefficient of friction for glass ballotini when the surface roughness was artificially increased, but the reported data were scattered particularly for rougher surfaces. On the other hand, Pohlman et al. [29] reported that for chrome steel balls, the inter-particle coefficient of friction is greater for smoother surfaces due to the increased stiction.
The latter interpretation could perhaps explain the high friction values of the CDV granules considering their soft nature and the possible more pronounced damage to their asperities in comparison to the LBS grains. Thus, the observations of this study clearly indicate that further systematic study is necessary to an important extent as the real mechanisms of friction have not been completely understood and there are inconsistent hypotheses in the literature explaining the mechanisms that take place affecting the friction of geological and other materials. The explanation of these mechanisms could be, partly, related to the behavior at the atomic level and the possible distortion of the surfaces for the CDV granules which are much softer than the LBS grains. For example, Sha et al. [30] reported that the increase of the confining force may lead to surface distortion by means of atom lost.

4. Conclusions

The study reported micromechanical inter-particle sliding tests exploring the frictional response of Leighton Buzzard sand (LBS) quartz grains and completely decomposed volcanic granules (CDV). The experiments were conducted on pairs of grains applying a target normal load that was equal to 1, 2, 3, 5, 7 and 10 N for the LBS and 0.5 N for the CDV. The sliding tests were applied in a displacement-controlled manner with a velocity of 0.08 mm/h. The tangential force–displacement relationship was notably affected by the level of the applied normal load and material type. At lower magnitudes of the normal load, there was observed a decrease of the inter-particle friction when the shearing test was repeated for the LBS grains, but the opposite trend was observed at greater normal loads of 7 and 10 N. It is believed that surface damage of the asperities and plowing effects might have contributed to these observed trends. The CDV granules exhibited much greater inter-particle coefficient of friction in comparison to the LBS grains. Roughness, material properties and the possible role of the distortion of the surfaces at the atomic level might have contributed to the observed trends from the micromechanical experiments.

Acknowledgments

The study was fully supported by a grant from the Research Grants Council of the Hong Kong Special Administrative Region, China (Theme-based research project Scheme “Understanding Debris Flow Mechanisms and Mitigating Risks for a Sustainable Hong Kong”—Project No. CityU 8779012).

Author Contributions

Each author has made contribution to the present paper including the designing, conduction and analysis of the experiments, interpretations and paper writing.

Conflicts of Interest

The authors declare no conflict of interest.

References

  1. Horn, H.M.; Deere, D.U. Frictional characteristics of minerals. Geotechnique 1962, 12, 319–335. [Google Scholar] [CrossRef]
  2. Procter, D.C.; Barton, R.R. Measurements of the angle of interparticle friction. Geotechnique 1974, 24, 581–604. [Google Scholar] [CrossRef]
  3. Cole, D.M.; Mathisen, L.U.; Hopkinks, M.A.; Knapp, B.R. Normal and sliding contact experiments on gneiss. Granul. Matter 2010, 12, 69–86. [Google Scholar] [CrossRef]
  4. Cavarretta, I.; Rocchi, I.; Coop, M.R. A new interparticle friction apparatus for granular materials. Can. Geotech. J. 2011, 48, 1829–1840. [Google Scholar] [CrossRef]
  5. Senetakis, K.; Coop, M.; Todisco, M.C. The inter-particle coefficient of friction at the contacts of Leighton Buzzard sand quartz minerals. Soils Found. 2013, 53, 746–755. [Google Scholar] [CrossRef]
  6. Senetakis, K.; Coop, M.; Todisco, M.C. Tangential load-deflection behaviour at the contacts of soil particles. Geotech. Lett. 2013, 3, 59–66. [Google Scholar] [CrossRef]
  7. Senetakis, K.; Sandeep, C.S.; Todisco, M.C. Dynamic inter-particle friction of crushed limestone surfaces. Tribol. Int. 2017, 111, 1–8. [Google Scholar] [CrossRef]
  8. Nardelli, V.; Coop, M.R.; Andrade, J.A.; Paccagnella, F. An experimental investigation of the micromechanics of Eglin sand. Powder Technol. 2017, 312, 166–174. [Google Scholar] [CrossRef]
  9. Yang, L.; Wang, D.; Guo, Y.; Liu, S. Tribological behaviors of quartz sand particles for hydraulic fracturing. Tribol. Int. 2016, 102, 485–496. [Google Scholar] [CrossRef]
  10. Senetakis, K.; Coop, M.R. The development of a new micro-mechanical inter-particle loading apparatus. Geotech. Test. J. 2014, 37, 1028–1039. [Google Scholar] [CrossRef]
  11. Senetakis, K.; Coop, M.R. Micro-mechanical experimental investigation of grain-t13-grain sliding stiffness of quartz minerals. Exp. Mech. 2015, 55, 1187–1190. [Google Scholar] [CrossRef]
  12. Cundall, P.A.; Strack, O.D.L. A discrete numerical model for granular assemblies. Geotechnique 1979, 29, 49–65. [Google Scholar] [CrossRef]
  13. Vu-Quoc, L.; Zhang, X. An accurate and efficient tangential force–displacement model for elastic-frictional contact in particle-flow simulations. Mech. Mater. 1999, 31, 235–269. [Google Scholar] [CrossRef]
  14. Vu-Quoc, L.; Lesburg, L.; Zhang, X. An accurate tangential force–displacement model for granular-flow simulations: Contacting spheres with plastic deformation, force-driven formulation. J. Comp. Phys. 2004, 196, 298–326. [Google Scholar] [CrossRef]
  15. Kwok, C.Y.; Bolton, M.D. DEM simulations of thermally activated creep in soils. Geotechnique 2010, 60, 425–433. [Google Scholar] [CrossRef] [Green Version]
  16. Kwok, C.Y.; Bolton, M.D. DEM simulations of soil creep due to particle crushing. Geotechnique 2013, 63, 1365–1376. [Google Scholar] [CrossRef] [Green Version]
  17. Ma, T.; Chen, P.; Zhao, J. Overview on vertical and directional drilling technologies for the exploration and exploitation of deep petroleum resources. Geomech. Geophys. Geo-Energy Geo-Resour. 2016, 2, 365. [Google Scholar] [CrossRef]
  18. Fang, Y.; Wang, C.; Elsworth, D.; Ishibashi, T. Seismicity-permeability coupling in the behavior of gas shales, CO2 storage and deep geothermal energy. Geomech. Geophys. Geo-Energy Geo-Resour. 2017. [Google Scholar] [CrossRef]
  19. Sazzad, M.M.; Suzuki, K. Effect of interparticle friction on the cyclic behavior of granular materials using 2D DEM. J. Geotech. Geoenviron. Eng. 2011, 137, 545–549. [Google Scholar] [CrossRef]
  20. Wang, J.; Yan, H.B. DEM analysis of energy dissipation in crushable soils. Soils Found. 2012, 52, 644–657. [Google Scholar] [CrossRef]
  21. Calvetti, F.; Nova, R. Micromechanical approach to slope stability analysis. In Degradation and Instabilities in Geomaterials; Darve, F., Vardoulakis, I., Eds.; CISM Courses and Lectures No. 461; Springer: Wien, Austria, 2004; pp. 235–254. [Google Scholar]
  22. Yin, P.; Zhao, G.F. Numerical simulation of fluid flow through deformable natural fracture network. Geomech. Geophys. Geo-Energy Geo-Resour. 2016, 2, 343. [Google Scholar] [CrossRef]
  23. Ranathunga, A.S.; Perera, M.S.A.; Ranjith, P.G.; De Silva, G.P.D. A macro-scale view of the influence of effective stress on carbon dioxide flow behaviour in coal: an experimental study. Geomech. Geophys. Geo-Energy Geo-Resour. 2017, 3, 13. [Google Scholar] [CrossRef]
  24. Nardelli, V.; Coop, M.R. The micromechanical behaviour of a biogenic carbonate sand. In Proceedings of the VI Italian Conference of Researchers in Geotechnical Engineering CNRIG—Geotechnical Engineering in Multidisciplinary Research: From Microscale to Regional Scale, Bologna, Italy, 22–23 September 2016.
  25. Barreto, D. Numerical and Experimental Investigation into the Behaviour of Granular Materials under Generalised Stress States. Ph.D. Thesis, University of London, London, UK, 2009. [Google Scholar]
  26. Mate, M. Tribology on the Small Scale—A Bottom Up Approach to Friction, Lubrication, and Wear; Oxford University Press: Oxford, UK, 2008. [Google Scholar]
  27. Johnson, K.L. Contact Mechanics; Cambridge University Press: Cambridge, MA, USA, 1985. [Google Scholar]
  28. Cole, D.M.; Peters, J.F. A physically based approach to granular media mechanics: Grain-scale experiments, initial results and implications to numerical modeling. Granul. Matter 2007, 9, 309–321. [Google Scholar] [CrossRef]
  29. Pohlman, N.A.; Severson, B.J.; Ottino, J.M.; Lueptow, R.M. Surface roughness effects in granular matter: Influence on angle of repose and the absence of segregation. Phys. Rev. E 2006, 73, 031304. [Google Scholar] [CrossRef] [PubMed]
  30. Sha, Z.-D.; Sorkin, V.; Branicio, P.S.; Pei, Q.-X.; Zhang, Y.-W.; Srolovitz, D.-J. Large-scale molecular dynamics simulations of wear in diamond-like carbon at the Nanoscale. Appl. Phys. Lett. 2013, 103, 073118. [Google Scholar] [CrossRef]
Figure 1. Scanning electron microscope images of LBS grain (top) and CDV granule (bottom) indicating their outline.
Energies 10 00370 g001
Figure 2. Close image from scanning electron microscope of LBS grain (top) and CDV granule (bottom) indicating their surface characteristics.
Energies 10 00370 g002
Figure 3. Image of the micromechanical sliding apparatus of City University of Hong Kong.
Energies 10 00370 g003
Figure 4. Typical plots of normal force against sliding displacement during inter-particle shearing tests on LBS grains.
Energies 10 00370 g004
Figure 5. Close-up view of the micromechanical sliding apparatus of City University of Hong Kong during the set of a test on LBS grains.
Energies 10 00370 g005
Figure 6. Image of CDV granules in contact during the setup of a micromechanical sliding experiment.
Energies 10 00370 g006
Figure 7. Image of a linear micro-stepper motor which is part of the micromechanical sliding apparatus.
Energies 10 00370 g007
Figure 8. Image of brass mounts and wells used to mount the grains for the micromechanical sliding tests.
Energies 10 00370 g008
Figure 9. Schematic illustration of grain–brass mount system (after Senetakis et al. [6] with modifications by the authors).
Energies 10 00370 g009
Figure 10. Sliding experiment on CDV granules with observation of crack initiation and propagation during shearing.
Energies 10 00370 g010
Figure 11. Typical plots of normal force–displacement at the contacts of LBS grains.
Energies 10 00370 g011
Figure 12. Tangential force–displacement plot at the contacts of LBS grains and the effect of the applied normal load (tests during the first shearing cycle).
Energies 10 00370 g012
Figure 13. Tangential force–displacement plots at the contacts of LBS grains indicating the effect of the shearing cycle at a normal force of 1 N.
Energies 10 00370 g013
Figure 14. Tangential force–displacement plots at the contacts of LBS grains indicating the effect of the shearing cycle at a normal force of 2 N.
Energies 10 00370 g014
Figure 15. Tangential force–displacement plots at the contacts of LBS grains indicating the effect of the shearing cycle at a normal force of 7 N.
Energies 10 00370 g015
Figure 16. Tangential force–displacement plots at the contacts of LBS grains indicating the effect of the shearing cycle at a normal force of 10 N.
Energies 10 00370 g016
Figure 17. The effect of the shearing cycles on the inter-particle friction ratio of LBS grains.
Energies 10 00370 g017
Figure 18. Tangential force–displacement plot at the contacts of CDV granules indicating the effect of the shearing cycle (tests at a normal load of 0.5 N).
Energies 10 00370 g018
Table 1. Micro-mechanical sliding testing program and summary of results.
No.Test CodeMaterial TypeNormal Force (N)Inter-Particle Friction at a Steady State Sliding
1st Cycle2nd Cycle3rd Cycle4th Cycle
1LBS-1Quartz10.2500.2400.2600.240
2LBS-2Quartz20.2600.250--
3LBS-2BQuartz20.2500.2150.2180.214
4LBS-3Quartz30.2700.280--
5LBS-5Quartz50.1800.1600.1600.162
6LBS-7Quartz70.3200.3500.3600.380
7LBS-10Quartz100.2600.2800.2900.300
8CDV-0.5Completely decomposed volcanic0.50.5400.6400.6200.660

