
The Business Model Evaluation Tool for Smart Cities: Application to SmartSantander Use Cases


Abstract
:1. Introduction
2. State of the Art
2.1. Concept of Smart City
2.2. Public Services in Smart Cities
2.3. Evaluation of Public Services
2.4. Business Models Analysis
2.5. Application of Business Models Analysis to Smart Cities
3. Methodology
- Choosing a relevant practical problem with research potential
- Obtaining pre-understanding of the topic
- Constructing a solution idea
- Assessing that the solution works
- Showing theoretical connections and research contribution of the solution
- Evaluating the scope and applicability of the solution
4. Results
4.1. Description of the Evaluation Tool for Business Model Analysis in Smart Cities
- (a)
- Cost Structure: This parameter of the Business Model Canvas refers to the costs involved in operating the product or service, including investment in machinery, labor, raw materials, etc. For this evaluation we have created two variables:(a.i.) “Amount of costs that this product/service will generate for the city and the citizens”, which we consider the most relevant part of the parameter and allows taking into account whether an increase in costs or net savings in the reference period occurs. It is scored as follows:
- (−4): The service provided with smart technologies has 50% higher cost than the service provided by the traditional systems.
- (−3): The service provided with smart technology is more than 20% and up to 50% more expensive than the service provided by traditional systems.
- (−2): The service provided with smart technology is over 5% and up to 20% more expensive than the service provided by the traditional systems.
- (−1): The smart service provided technology costs between 0% and 5% more than the service provided with the traditional systems.
- (0): The service is provided with smart technologies has the same cost than the service provided with the traditional systems.
- (+1): The service provided with smart technologies will cost between 0% and 5% less than the service provided by traditional systems.
- (+2): The service provided with smart technology has a lower cost, ranging from 5% to 20% less than the service provided with traditional systems.
- (+3): The service provided with smart technology has a lower cost, which ranges from 20% to 50% less than the service provided with traditional systems.
- (+4): The service provided with smart technology has lower cost, being 50% cheaper or more than the service provided with traditional systems.
(a.ii.) “Diversification of cost sources”. We believe it is an aspect to take into account because the greater the diversification, the lower the risk for the city, so we assign a numeric value as follows:- (−1): It means that the sources are less diversified than in the service provided with traditional systems.
- (0): It is equivalent to the same diversification in the service provided with traditional systems.
- (+1): There is more diversification than in the service provided with traditional systems.
- (b)
- Revenue Streams: The Business Model Canvas describes this parameter as the revenues generated by the product or service, and in our method we start from the perspective of the evaluation between the business models to be compared. To evaluate this parameter, we have created two variables:(b.i.) “Amount of costs that this product/service will generate for the city and citizens”, which we consider the most relevant parameter and therefore is measured as follows:
- (−4): The service provided with smart technologies generates revenues 50% lower than the service provided with traditional systems.
- (−3): The service provided with smart technologies generates revenues between 20% and 50% lower than the service provided with traditional systems.
- (−2): The service provided with smart technologies has generated revenues between 5% and 20% lower than the service provided with traditional systems.
- (−1): The service provided with smart technologies generated revenues between 0% and 5% lower than the service provided with traditional systems.
- (0): The service provided with smart technologies generates revenues equivalent to the service provided with traditional systems.
- (+1): The service provided with smart technologies generates revenues between 0% and 5% higher than the service provided with traditional systems.
- (+2): The service provided with smart technology generates higher revenues, ranging from 5% to 20% more than the service provided with traditional systems.
- (+3): The service provided with smart technology generates higher revenues, ranging from 20% to 50% more than the service provided with traditional systems.
- (+4): The service provided with smart technology generates revenues over 50% higher than the service provided with traditional systems.
(b.ii.) “Diversification of sources of revenues”. We believe it is an aspect to consider as greater diversification brings less risk to the city. We propose a numeric value like this:- (−1): Applied to sources less diversified than in the traditional system.
- (0): Equivalent to the same diversification in the traditional system.
- (+1): Means that there is more diversification than in the traditional system.
- (c)
- Social and Environmental Costs: This parameter does not exist in the Business Model Canvas but it does in the Non-Profit Business Model Canvas. It refers to non-economic aspects of the business model that are harmful to the intelligent city. In general, these aspects are often the same in every city in the world, but municipalities have different priorities about which of them are more or less important. Therefore, we believe that the appropriate reference to assign values is the strategic plan of the city because the strategic objectives are evident on it. The assessment of social and environmental costs is made taking into account whether the business model analyzed adversely affects the strategic objectives of the city. For example, in the Santander case study we have taken the Santander Strategic Plan 2020 [124] and selected five strategic dimensions of the future vision of the city. Each dimension receives a value depending on how the business model affects that dimension according to the following assessment:
- (−1): It means that the( business model affects each strategic objective very negatively.
- (−0.5): To be assigned if the business model partially affects each strategic objective.
- (0): When it does not affect the strategic objective.
- (d)
- Social and Environmental Benefits: Just like the previous one, this parameter only exists in the Non-Profit Business Model Canvas. It refers to non-financial aspects of the business model that are beneficial for the smart city. The assignment of numerical parameter values is done by assessing how the business model analyzed contributes to the strategic objectives defined in the strategic plan of the city. In the case study we have taken the five strategic dimensions of the Strategic Plan of Santander 2020 and assigned values of 0 if the business model does not contribute to achieving this objective, 0.5 if it contributes a little, and 1 if it helps a lot.
- (e)
- Value Proposition: This parameter makes explicit how Organizations are creating value for customers. In our methodology we have developed five questions that help assess to what extent is the business model analyzed valuable. Each question can be answered with 0 points (negative answer to that question), 0.5 points (partially positive response) or 1 point (fully positive response). These questions have been created by us, but are based on others presented in the book that introduced the Value Proposition Canvas.
- (f)
- Customer Segments: This parameter shows for how many citizens the business model is potentially applicable, beneficial or harmful. There are five positive and five negative values that are adding or subtracting fractions of 1 point until it exceeds 50% of the population, which we consider the top as it is clearly beneficial for whole the population.
4.2. Use Case: The Waste Management System of the City of Santander
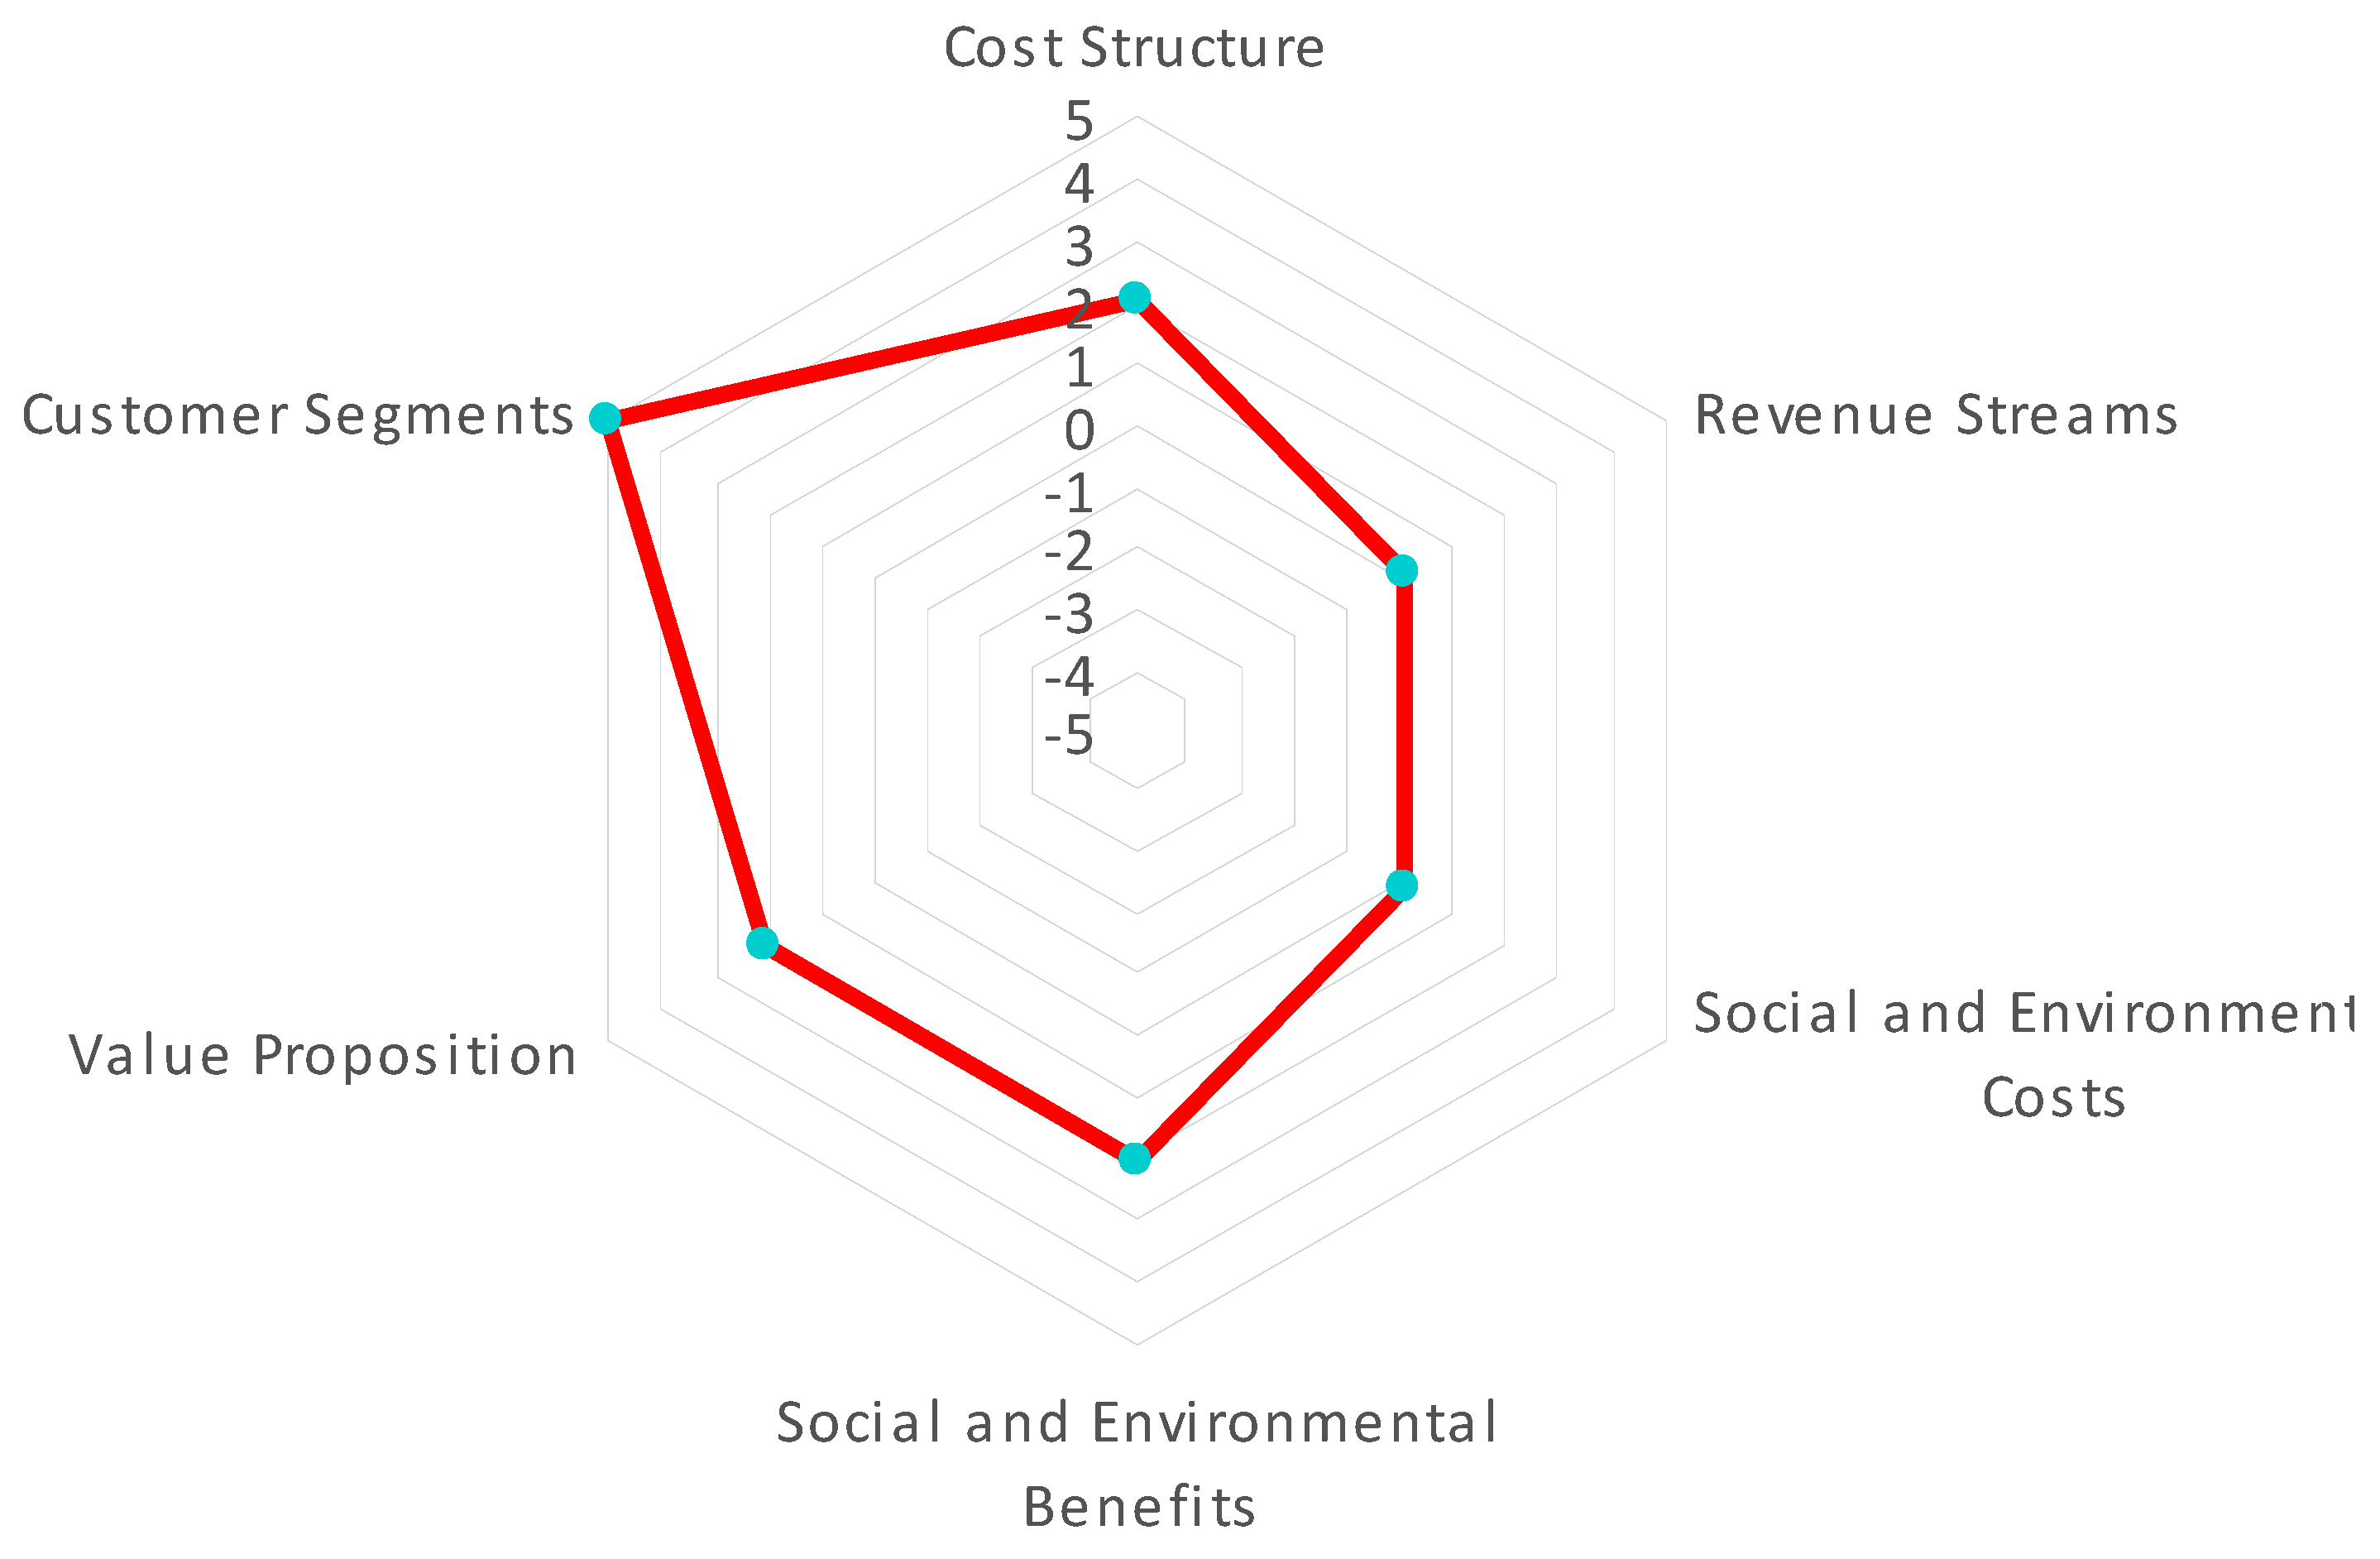
- There is a small increase in financial costs for the service provider as it must invest to cover the costs of technology. However, the Cost Structure is lower because the total management costs are clearly smaller in the long term as the last public tender for this service showed. In other words, as the new technologies allow a more efficient management, the costs of the first public tender of the service that demanded the use of IoT technologies was tendered for a value of less than 20% with respect to the previous one, which was managed conventionally. As we take the point of view of aggregation actors, 2 points are allocated in this sub-parameter. Another 0.5 points are added due to the diversification of sources of costs as the service provider benefits from reduced fuel costs, human resources and other factors.
- The Revenue Streams do not change at all so 2 points are assigned in this parameter.
- We believe that as Social and Environmental Costs, 0.5 points should be considered -due to the potential small reduction of employees in the service can damage social cohesion.
- The Social and Environmental Benefits add 1 point because these innovative technologies put Santander on the map as a city where the knowledge economy and productive innovation predominate; 0.5 points for the generation of talent for hiring highly qualified professionals to manage ICTs; 0.5 points for improving the quality of service for all citizens as it promotes social cohesion; and 1 point for the improvement in environmental sustainability and accessibility as lower consumption of CO2 and less traffic disruption are clear benefits of optimized vehicle routes.
- We give 0.5 points in the Value Proposition parameter because the necessity of improving the waste management service is permanent for city halls and citizens, nevertheless we do not consider it a problematic issue at this time; 0.5 points because people are always interested in improving waste management but do not claim massively for it; another 0.5 points because traffic congestion and environmental improvements are upgrades in the quality of life; 0.5 points because the service quality is slightly better than the former one; 1 point because the 20% reduction of the total cost of the service is an important saving for municipal budgets in such kind of projects.
- We added 5 points in the Customers parameter because the new service constitutes an important upgrade for all citizens.
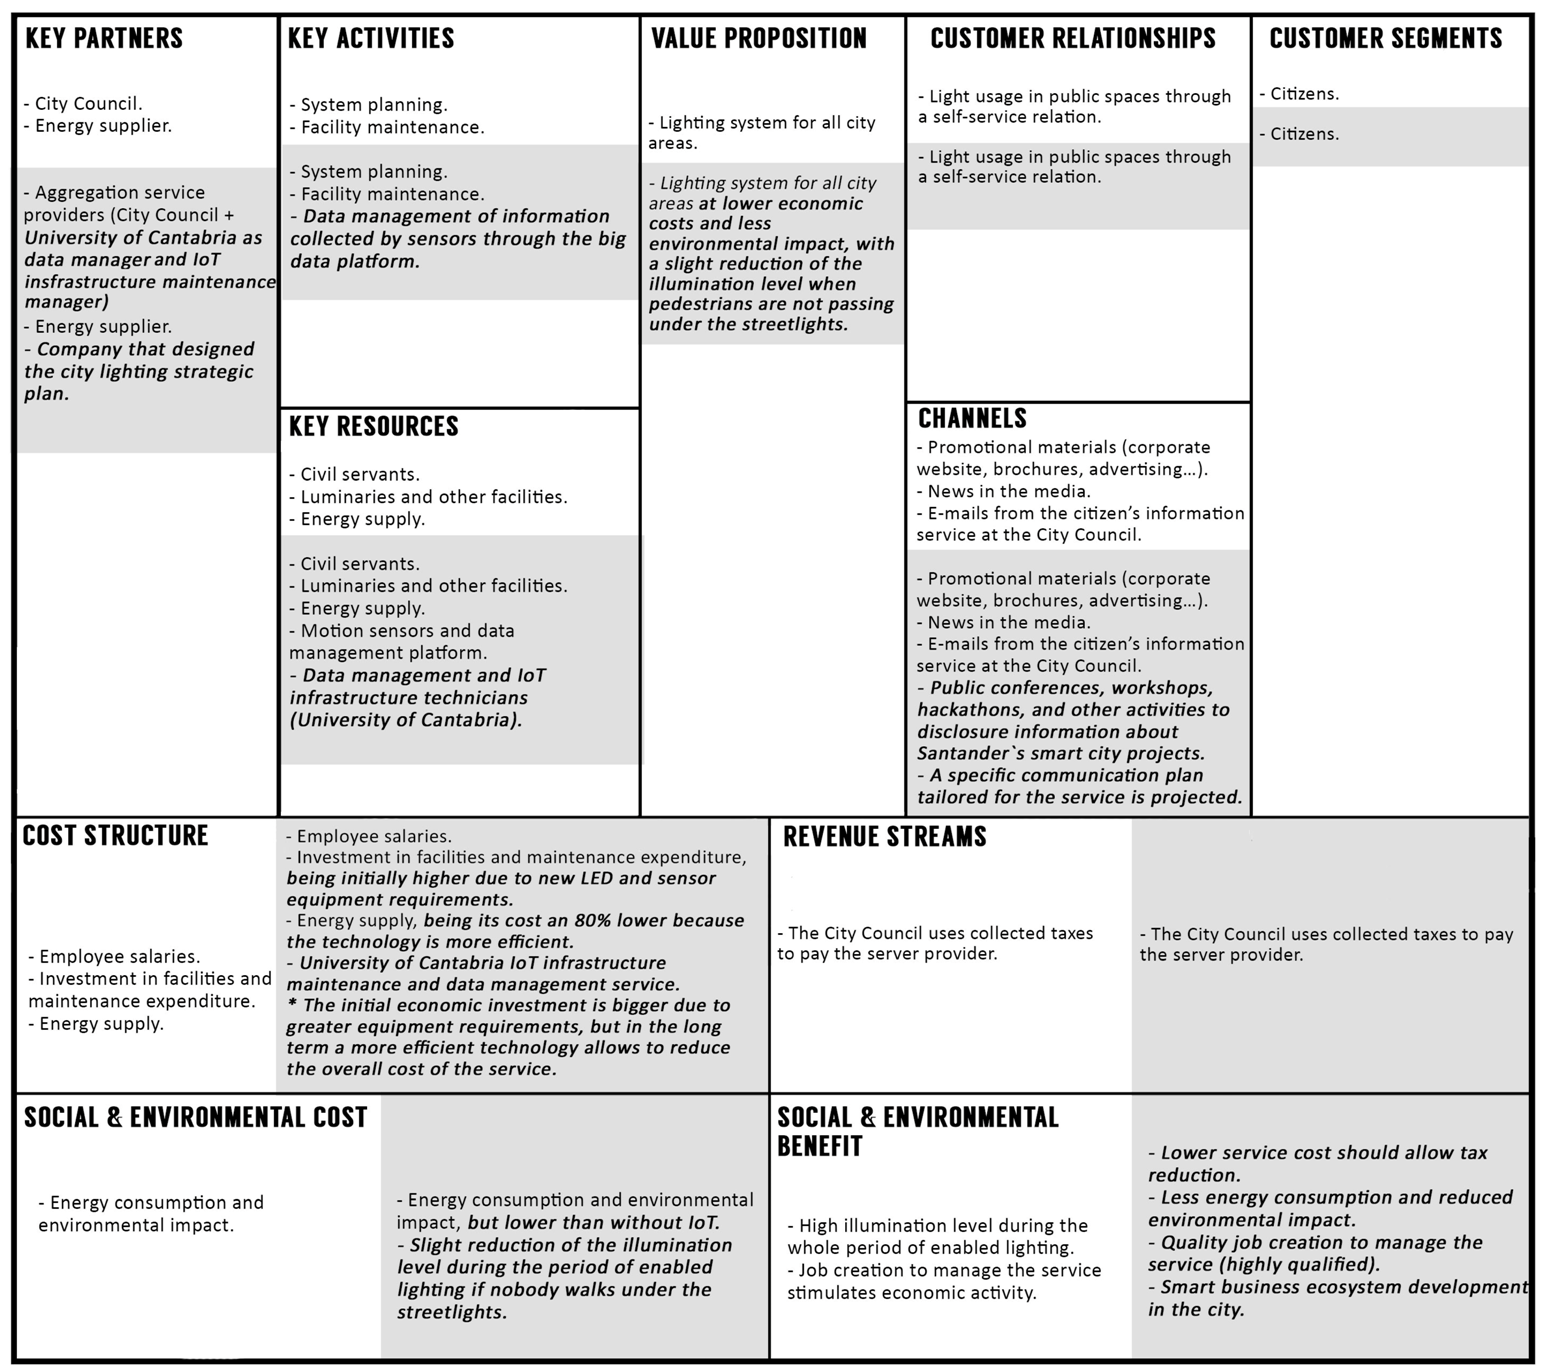
4.3. Use Case: The Street Lighting Service of Santander
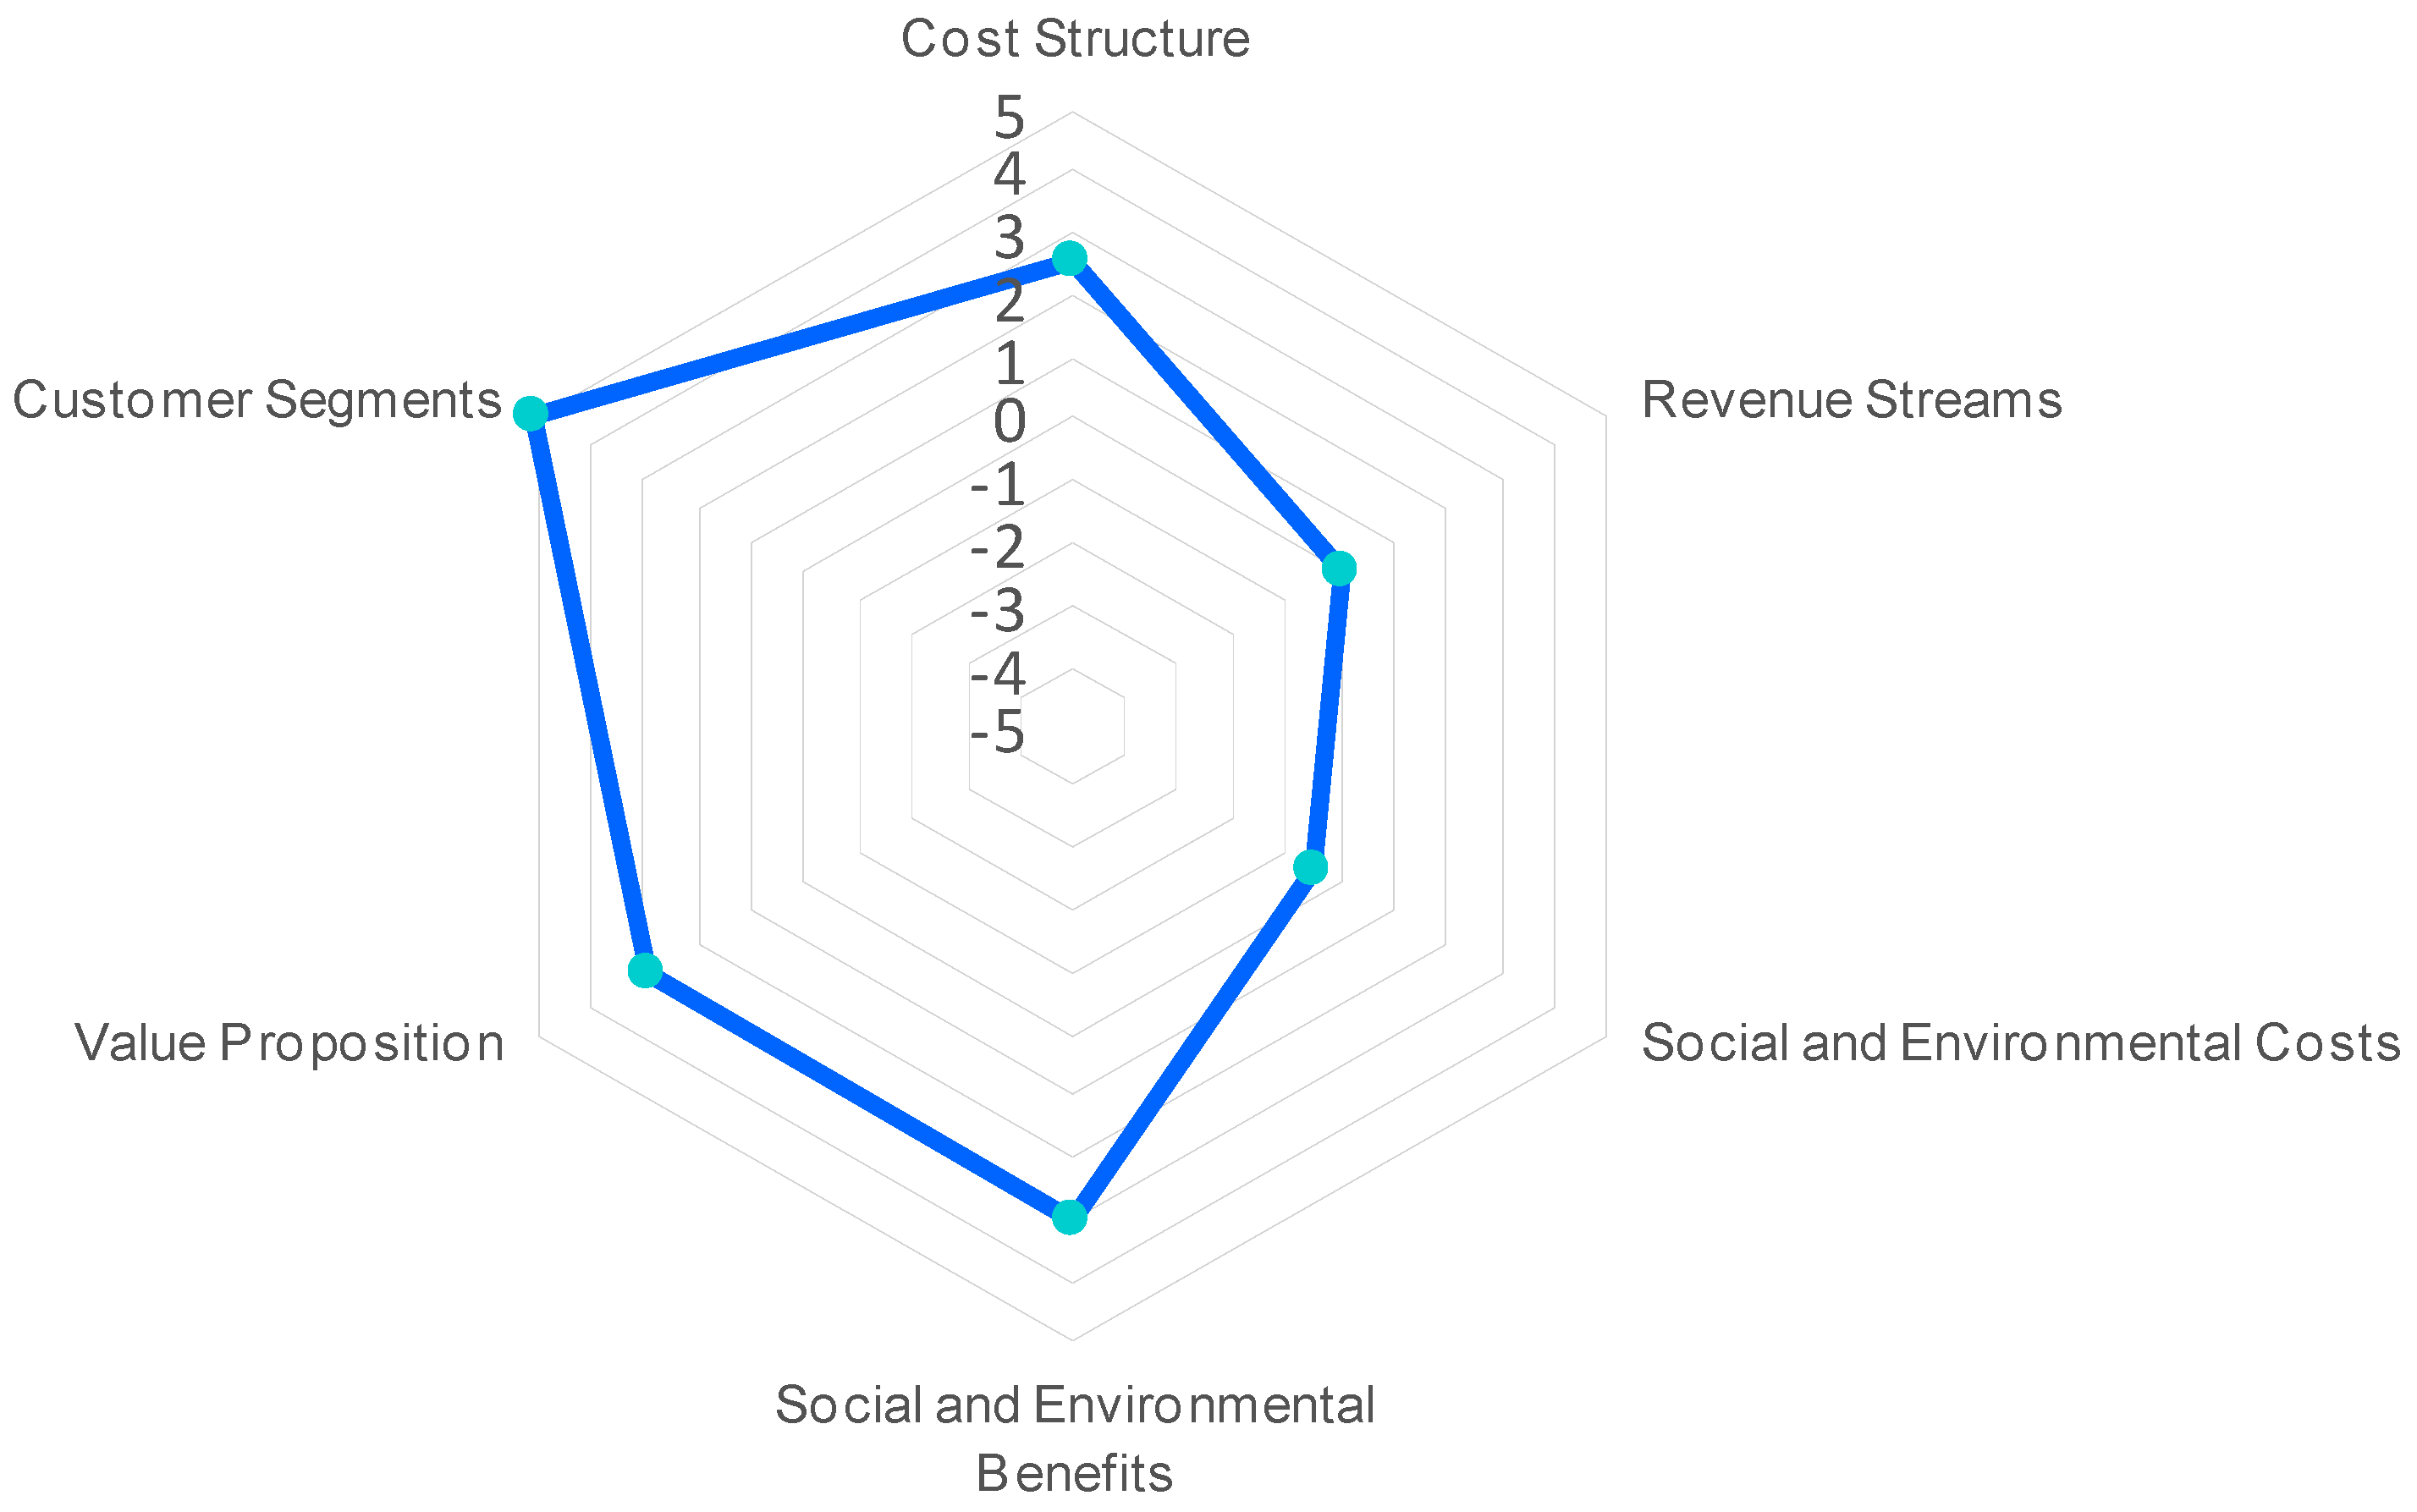
- An important initial investment is required and assumed by the concessionaire. However, the net Cost Structure is lower in the long term as the last public tender for this service showed. In other words, the first public tender of the service that demanded the use of LED and innovative ICT was tendered for a lower value with respect to the previous one, which was managed conventionally. As we take the point of view of aggregation actors, thus we give 2 points in this parameter.
- The Revenue Streams do not change at all so 0 points are assigned in this parameter.
- We believe that no Social and Environmental Costs stand out (0 points).
- A few factors are included between the Social and Environmental Benefits: 0.5 points because these innovative technologies contribute to put Santander on the map as a city where the knowledge economy and productive innovation predominate; 0.5 points for the generation of talent for hiring highly qualified professionals to manage ICTs; and 1 point for the sustainability supported by the reduction of energy consumption.
- In the Value Proposition parameter, it is given: 0.5 points because it is always necessary to improve an important municipal service like this; 0.5 points because citizens are always interested on improving the service, even if they do not claim massively for it; and 1 point because the reduction of the total cost of the service is an important saving for municipal budgets in such kind of projects.
- We added 5 points in the Customers parameter because the new service constitutes an important upgrade for all citizens, at least in terms of public budget.
5. Discussion
6. Conclusions, Limitations and Future Work
Acknowledgments
Author Contributions
Conflicts of Interest
References
- Popescu, R.I. Study regarding the ways of measuring cities competitiveness. Econ. Ser. Manag. 2011, 14, 288–303. [Google Scholar]
- Angel, S.; Parent, J.; Civco, D.L.; Blei, A.M. Making Room for a Planet of Cities; Lincoln Institute of Land Policy: Cambridge, MA, USA, 2011; pp. 1–77. [Google Scholar]
- United Nations. Urban Planning for City Leaders, 2nd ed.; United Nations Human Settlements Programme: Nairobi, Kenya, 2013; p. 187. [Google Scholar]
- Graham, S.; Marvin, S. Planning cyber-cities? Integrating telecommunications into urban planning. Town Plan. Rev. 1999, 70, 89–114. [Google Scholar] [CrossRef]
- ITU-T Focus Group on Smart Sustainable Cities. Master Plan for Smart Sustainable Cities; ITU: Geneva, Switzerland, 2015. [Google Scholar]
- Harrison, C.; Donnelly, I.A. A theory of smart cities. In Proceedings of the 55th Annual Meeting of the ISSS, Hull, UK, 17–21 July 2011; pp. 1–15.
- Walravens, N.; Ballon, P. Platform Business Models for Smart Cities: From Control and Value to Governance and Public Value. IEEE Commun. Mag. 2013, 51, 72–79. [Google Scholar] [CrossRef]
- Gil, O.; Navío, J.; Pérez de Heredia, M. ¿Cómo se Gobiernan las Ciudades? Silva Editorial: Tarragona, Spain, 2015; p. 118. [Google Scholar]
- Komninos, N.; Tsarchopoulos, P.; Kakderi, C. New Services Design for Smart Cities: A Planning Roadmap for User-Driven Innovation. In Proceedings of the 2014 ACM International Workshop on Wireless and Mobile Technologies for Smart Cities, Philadelphia, PA, USA, 11 August 2011; pp. 29–38.
- Lanza, J.; Sánchez, L.; Muñoz, L.; Galache, J.A.; Sotres, P.; Santana, J.R.; Gutiérrez, V. Large-Scale Mobile Sensing Enabled Internet-of-Things Testbed for Smart City Services. Int. J. Distrib. Sens. Netw. 2015, 2015, 785061. [Google Scholar] [CrossRef]
- Lee, J.H.; Hancock, M.G.; Hu, M.-C. Towards an effective framework for building smart cities: Lessons from Seoul and San Francisco. Technol. Forecast. Soc. Chang. 2013, 89, 80–99. [Google Scholar] [CrossRef]
- Achaerandio, R.; Curto, J.; Bigliani, R.; Gallotti, G. Análisis de las Ciudades Inteligentes en España 2012—El Viaje a la Ciudad Inteligente; IDC: Madrid, Spain, 2012. [Google Scholar]
- Krčo, S.; Fernandes, J.; Sanchez, L. SmartSantander—A smart city experimental platform. Electrotech. Rev. 2013, 79, 3–6. [Google Scholar]
- Zygiaris, S. Smart City Reference Model: Assisting Planners to Conceptualize the Building of Smart City Innovation Ecosystems. J. Knowl. Econ. 2013, 4, 217–231. [Google Scholar] [CrossRef]
- Schaffers, H.; Komninos, N.; Pallot, M. Smart cities and the future internet: Towards cooperation frameworks for open innovation. In The Future Internet; Springer: Berlin/Heidelberg, Germany, 2011. [Google Scholar]
- Gutiérrez, V.; Galache, J.A.; Sánchez, L. SmartSantander: Internet of things research and innovation through citizen participation. In The Future Internet; Springer: Berlin/Heidelberg, Germany, 2013; pp. 173–186. [Google Scholar]
- Galache, J.A.; Gutiérrez, V.; Santana, J.R.; Sánchez, L.; Casanueva, J.; Sostres, P. SmartSantander: A joint service provision facility and experimentation-oriented testbed, within a smart city environment. In Proceedings of the Future Network & Mobile Summit 2013, Lisbon, Portugal, 3–5 July 2013.
- Sanchez, L.; Galache, J.A. SmartSantander: IoT experimentation over a smart city testbed. Comput. Netw. 2014, 61, 217–238. [Google Scholar] [CrossRef]
- Díaz-Díaz, R.; Pérez-González, D. Implementation of Social Media Concepts for e-Government: Case Study of a Social Media Tool for Value Co-Creation and Citizen Participation. J. Organ. End User Comput. 2016, 28, 104–121. [Google Scholar] [CrossRef]
- Dameri, R.P.; Ricciardi, F.; D’Auria, B. Knowledge and intellectual capital in smart city. In Proceedings of the 15th European Conference on Knowledge Management ECKM 2014, Santarém, Portugal, 4–5 September 2014; pp. 250–257.
- Cosgrave, E.; Tryfonas, T.; Crick, T. The Smart City from a Public Value Perspective. In Proceedings of the 2014 Conference ICT for Sustainability, Stockholm, Sweden, 24–27 August 2014; p. 9.
- Yamagata, Y.; Seya, H. Simulating a future smart city: An integrated land use-energy model. Appl. Energy 2013, 112, 1466–1474. [Google Scholar] [CrossRef]
- Gall, F.L.; Chevillard, S.V.; Gluhak, A.; Walravens, N.; Xueli, Z.; Hadji, H.B. Benchmarking Internet of Things Deployment: Frameworks, Best Practices and Experiences; Modeling and Processing for Next-Generation Big-Data Technologies; Springer: Cham, Switzerland, 2011; Volume 4, pp. 473–496. [Google Scholar]
- Osterwalder, A. The Business Model Ontology—A Proposition in a Design Science Approach; Université de Lausanne: Lausanne, Switzerland, 2004. [Google Scholar]
- Solaimani, S.; Bouwman, H.; Itälä, T. Networked enterprise business model alignment: A case study on smart living. Inf. Syst. Front. 2015, 17, 871–887. [Google Scholar] [CrossRef]
- Arribas-Bel, D.; Kourtit, K.; Nijkamp, P. Benchmarking of world cities through Self-Organizing Maps. Cities 2013, 31, 248–257. [Google Scholar] [CrossRef]
- Branchi, P.; Fernández-Valdivielso, C.; Matias, I. Analysis Matrix for Smart Cities. Future Internet 2014, 6, 61–75. [Google Scholar] [CrossRef]
- Caragliu, A.; del Bo, C.; Kourtit, K.; Nijkamp, P. Comparative performance assessment of Smart Cities around the North Sea basin. Netw. Ind. Q. 2011, 13, 15–17. [Google Scholar]
- Debnath, A.K.; Chin, H.C.; Haque, M.M.; Yuen, B. A methodological framework for benchmarking smart transport cities. Cities 2014, 37, 47–56. [Google Scholar] [CrossRef]
- Giffinger, R.; Haindlmaier, G.; Kramar, H. The role of rankings in growing city competition. Urban Res. Pract. 2010, 3, 299–312. [Google Scholar] [CrossRef]
- Giffinger, R.; Haindlmaier, G. Smart cities ranking: An effective instrument for the positioning of cities? Archit. City Environ. 2010, 4, 7–26. [Google Scholar]
- Pérez-González, D.; Díaz-Díaz, R. Public Services Provided with ICT in the Smart City Environment: The Case of Spanish Cities. J. Univ. Comput. Sci. 2015, 21, 248–267. [Google Scholar]
- Theng, Y.-L.; Xu, X.; Kanokkorn, W. Towards the Construction of Smart City Index for Analytics (SM-CIA): Pilot-Testing with Major Cities in China Using Publicly Available Data. In Proceedings of the 2016 49th Hawaii International Conference on System Sciences (HICSS), Kauai, HI, USA, 5–8 June 2016; pp. 2964–2973.
- Neirotti, P.; De Marco, A.; Cagliano, A.C.; Mangano, G.; Scorrano, F. Current trends in Smart City initiatives: Some stylised facts. Cities 2014, 38, 25–36. [Google Scholar] [CrossRef]
- Walravens, N. Qualitative indicators for smart city business models: The case of mobile services and applications. Telecommun. Policy 2015, 39, 218–240. [Google Scholar] [CrossRef]
- Walravens, N. Mobile Business and the Smart City: Developing a Business Model Framework to Include Public Design Parameters for Mobile City Services. J. Theor. Appl. Electron. Commer. Res. 2012, 7, 121–135. [Google Scholar] [CrossRef]
- Walravens, N. Case Study Validation of a Business Model Framework for Smart City Services: FixMyStreet and London Bike App. IT Converg. Pract. 2013, 1, 22–38. [Google Scholar]
- Walravens, N. Validating a business model framework for smart city services: The case of fixmystreet. In Proceedings of the 27th International Conference on Advanced Information Networking and Applications Workshops (WAINA 2013), Barcelona, Spain, 23–24 December 2013; pp. 1355–1360.
- Cocchia, A. Smart and digital city: A systematic literature review. In Smart City; Dameri, R.P., Rosenthal-Sabroux, C., Eds.; Springer: Cham, The Newtherlands, 2014; pp. 13–43. [Google Scholar]
- Calzada, I.; Cobo, C. Unplugging: Deconstructing the Smart City. J. Urban Technol. 2015, 22, 23–43. [Google Scholar] [CrossRef]
- Caragliu, A.; Del Bo, C.; Nijkamp, P. Smart Cities in Europe. J. Urban Technol. 2011, 18, 65–82. [Google Scholar] [CrossRef]
- Harrison, C.; Eckman, B.; Hamilton, R.; Hartswick, P.; Kalagnanam, J.; Paraszczak, J.; Williams, P. Foundations for Smarter Cities. IBM J. Res. Dev. 2010, 54, 1–16. [Google Scholar] [CrossRef]
- Albino, V.; Berardi, U.; Dangelico, R.M. Smart Cities: Definitions, Dimensions, Performance, and Initiatives. J. Urban Technol. 2015, 22, 3–21. [Google Scholar] [CrossRef]
- Giffinger, R.; Pichler-Milanović, N. Smart Cities: Ranking of European Medium-Sized Cities; Centre of Regional Science, Vienna University of Technology: Vienna, Austria, 2007. [Google Scholar]
- Abdoullaev, A. A Smart World: A Development Model for Intelligent Cities. In Proceedings of the 11th IEEE International Conference on Computer and Information Technology, Athens, GA, USA, 6–8 July 2011; pp. 1–28.
- Koppenjan, J.; Enserink, B. Public–private partnerships in urban infrastructures: Reconciling private sector participation and sustainability. Public Adm. Rev. 2009, 69, 284–296. [Google Scholar] [CrossRef]
- Bakici, T. State of the Art-Open Innovation in Smart Cities; ESADE: Barcelona, Spain, 2011. [Google Scholar]
- Segelstrom, F. Stakeholder Engagement for Service Design: How Service Designers Identify and Communicate Insights; Linkoping University Electron Press: Linköping, Sweden, 2013; pp. 1–210. [Google Scholar]
- Linders, D. From e-government to we-government: Defining a typology for citizen coproduction in the age of social media. Gov. Inf. Q. 2012, 29, 446–454. [Google Scholar] [CrossRef]
- Strandvik, T.; Holmlund, M.; Edvardsson, B. Customer needing: A challenge for the seller offering. J. Bus. Ind. Mark. 2012, 27, 132–141. [Google Scholar] [CrossRef]
- Neely, A.; Gregory, M.; Platts, K. Performance measurement system design: A literature review and reseach agenda. Int. J. Oper. Prod. Manag. 1995, 15, 80–116. [Google Scholar] [CrossRef]
- Wouters, M. A developmental approach to performance measures-Results from a longitudinal case study. Eur. Manag. J. 2009, 27, 64–78. [Google Scholar] [CrossRef]
- Lohman, C.; Fortuin, L.; Wouters, M. Designing a performance measurement system: A case study. Eur. J. Oper. Res. 2004, 156, 267–286. [Google Scholar] [CrossRef]
- Bremser, W.G.; Chung, Q.B. A framework for performance measurement in the e-business environment. Electron. Commer. Res. Appl. 2005, 4, 395–412. [Google Scholar] [CrossRef]
- Kaplan, R.S.; Norton, D.P. Putting the Balanced Scorecard To Work. Harv. Bus. Rev. 1993, 71, 134–142. [Google Scholar]
- Lawrie, G.; Kalff, D.; Andersen, H. Balanced Scorecard and Results-Based Management Convergent performance management systems. In Proceedings of the 3rd Annual Conference on Performance Measurement and Management Control, The European Institute for Advanced Studies in Management, Nice, France, 22–23 September 2005.
- Asian Development Bank (ADB). An Introduction to Results Management; Asian Development Bank: Metro Manila, Philippines, 2006. [Google Scholar]
- Hood, C. The “New Public Management” in the 1980s: Variations on a theme. Account. Organ. Soc. 1995, 20, 93–109. [Google Scholar] [CrossRef]
- Pattaro, A.F.; Tripi, S. (Re) building a Smart City. The role of local ICT-based services in emergency response and recovery. The case of earthquakes in Emilia-Romagna region. In Proceedings of the PSG I on Information And Communications Technologies in Public Administration, Edinburgh, UK, 11–13 September 2013; pp. 1–17.
- Hefetz, A.; Warner, M. Privatization and its reverse: Explaining the dynamics of the government contracting process. J. Public Adm. Res. Theory 2004, 14, 171–190. [Google Scholar] [CrossRef]
- Sanderson, I. Evaluation, learning and the effectiveness of public services: Towards a quality of public service model. Int. J. Public Sect. Manag. 1996, 9, 90–108. [Google Scholar] [CrossRef]
- Andrews, R.; van de Walle, S. New Public Management and Citizens’ Perceptions of Local Service Efficiency, Responsiveness, Equity and Effectiveness. Public Manag. Rev. 2013, 15, 762–783. [Google Scholar] [CrossRef]
- Clarke, J. Performing for the Public: Doubt, Desire, and the Evaluation of Public Services. In The Values of Bureaucracy; OUP: Oxford, UK, 2005; pp. 211–232. [Google Scholar]
- Ruíz López, J.; Cuellar Martín, E.; del Pino Matute, E. Guía Para la Evaluación de la Calidad de Los Servicios Públicos; FUCOVASA: Madrid, Spain, 2008. [Google Scholar]
- Mackay, K.; Picciotto, R.; Bairs, M.; Shand, D.; Divorski, S.; Rist, R.C.; Leeuw, F.; Marcel, M.; Barbarie, A.; Brushett, S.; et al. Public Sector Performance: The Critical Role of Evaluation. In Public Sector Performance: The Critical Role of Evaluation; Mackay, K., Ed.; The World Bank: Washington, DC, USA, 1998; pp. 1–113. [Google Scholar]
- Weiss, C.H. Evaluation: Methods for Studying Programs and Policies; Prentice Hall: Englewood Cliffs, NJ, USA, 1998; p. 372. [Google Scholar]
- Torres Fragoso, J. Posibilidades, logros y desafíos en la implementación de modelos de calidad en los gobiernos latinoamericanos. Estud. Gerenc. 2011, 27, 33–57. [Google Scholar] [CrossRef]
- Dyllick, T.; Hockerts, K. Beyond the Business Case for Corporate Sustainability. Bus. Strategy Environ. Bus. Strat. Environ. 2002, 11, 130–141. [Google Scholar] [CrossRef]
- Benington, J.; Moore, M.H. Public Value: Theory and Practice; Palgrave Macmillan: Basingstoke, UK, 2011; p. 314. [Google Scholar]
- Veenhoven, R. Why social policy needs subjective indicators. Soc. Indic. Res. 2002, 58, 33–45. [Google Scholar] [CrossRef]
- Jerman, D.; Bruno, Z. Model of marketing communications effectiveness in the Business-To-Business markets. Econ. Res. 2012, 25, 364–388. [Google Scholar] [CrossRef]
- Zhang, S.; Yang, H.; Singh, L. Measuring quality of life: Economic, social, and subjective indicators. Soc. Indic. Res. 1997, 40, 189–216. [Google Scholar]
- Zuiker, V.S.; Lee, Y.G.; Olson, P.D.; Danes, S.M.; Van Guilder Dik, A.N.; Jo Katras, M. Business, family, and resource intermingling characteristics as predictors of cash flow problems in family-owned businesses. J. Financ. Couns. Plan. 2002, 13, 65–83. [Google Scholar]
- Olson, P.D.; Zuiker, V.S.; Danes, S.M.; Stafford, K.; Heck, R.K.Z.; Duncan, K.A. The impact of the family and the business on family business sustainability. J. Bus. Venture 2003, 18, 639–666. [Google Scholar] [CrossRef]
- Torrubiano Galante, J.; Fernández Velasco, D.; González Miguel, D. Guía de Modelos de Evaluación Para la Administración Local; Agencia Estatal para la Evaluación de las Políticas Públicas y la Calidad de los Servicios, Ministerio de Política Territorial y Administración Pública: Madrid, Spain, 2011. [Google Scholar]
- Coats, D.; Passmore, E. Public Value: The Next Steps in Public Service Reform; The Work Foundation: London, UK, 2008. [Google Scholar]
- Kourtit, K.; Nijkamp, P.; Suzuki, S. The rat race between world cities: In search of Exceptional Places by means of super-efficient data development analysis. Comput. Environ. Urban Syst. 2013, 38, 67–77. [Google Scholar] [CrossRef]
- Okulicz-Kozaryn, A. City Life: Rankings (Livability) Versus Perceptions (Satisfaction). Soc. Indic. Res. 2011, 110, 433–451. [Google Scholar] [CrossRef]
- Schwarz, N. Urban form revisited—Selecting indicators for characterising European cities. Landsc. Urban Plan. 2010, 96, 29–47. [Google Scholar] [CrossRef]
- Shen, L.-Y.; Jorge Ochoa, J.; Shah, M.N.; Zhang, X. The application of urban sustainability indicators—A comparison between various practices. Habitat Int. 2011, 35, 17–29. [Google Scholar] [CrossRef]
- Giffinger, R.; Gudrun, H. Smart cities ranking: An effective instrument for the positioning of the cities? In Proceedings of the 5th International Conference Virtual City and Territory, Barcelona, Spain, 2–4 June 2009; pp. 703–714.
- Paroutis, S.; Bennett, M.; Heracleous, L. A strategic view on smart city technology: The case of IBM Smarter Cities during a recession. Technol. Forecast. Soc. Chang. 2013, 89, 262–272. [Google Scholar] [CrossRef]
- Mulligan, C.E.A.; Olsson, M. Architectural implications of smart city business models: An evolutionary perspective. IEEE Commun. Mag. 2013, 51, 80–85. [Google Scholar] [CrossRef]
- Marolt, M.; Maletič, D.; Borštnar, M.K.; Lenart, G.; Pucihar, A. Comparative analysis of business model ontologies. In Proceedings of the 35th International Conference on Organizational Science Development, Portorož, Slovenia, 16–18 March 2016; p. 15.
- Pateli, A.G.; Giaglis, G.M. A framework for understanding and analysing e-business models. In Proceedings of the 16th Bled Electronic Commerce Conference eTransformation Bled, Bled, Slovenia, 9–11 June 2003.
- McGrath, R.G. Business models: A discovery driven approach. Long Range Plan. 2010, 43, 247–261. [Google Scholar] [CrossRef]
- Aljēna, A. Business model designing tool—Filling the gap between philosophy and reality. In Innovative Approaches to Business Education Selected Issues; Zięba, M., Zięba, K., Eds.; Via University College: Aarhus, Denmark, 2014; pp. 7–19. [Google Scholar]
- Osterwalder, A.; Pigneur, Y. Business Model Generation: A Handbook for Visionaries, Game Changers, and Challengers; Self Published: Amsterdam, The Netherlands, 2010. [Google Scholar]
- Birchall, D.; Chanaron, J.-J.; Tovstiga, G.; Hillenbrand, C. Innovation performance measurement: Current practices, issues and management challenges. Int. J. Technol. Manag. 2011, 56, 1–20. [Google Scholar] [CrossRef]
- Wirtz, B.W.; Göttel, V.; Daiser, P. Business Model Innovation: Development, Concept and Future Research Directions. J. Bus. Model. 2016, 4, 1–28. [Google Scholar]
- Osterwalder, A.; Pigneur, Y.; Tucci, C.L. Clarifying business models: Origins, present, and future of the concept. Commun. Assoc. Inf. Syst. 2005, 16, 1–25. [Google Scholar]
- Ojasalo, K.; Ojasalo, J. Adapting business model thinking to service logic: An empirical study on developing a service design tool. In The Nordic School, Alternative Perspectives on Marketing and Service Management; Gummerus, J., Von Koskull, C., Eds.; Hanken School of Economics: Helsinki, Finland, 2015; pp. 309–333. [Google Scholar]
- Weiller, C.; Neely, A. Business Model Design in an Ecosystem Context; University of Cambridge: Cambridge, UK, 2013. [Google Scholar]
- Osterwalder, A.; Pigneur, Y.; Bernarda, G.; Smith, A. Value Proposition Design: How to Create Products and Services Customers Want; Wiley: New York, NY, USA, 2014; p. 320. [Google Scholar]
- Ver Loren van Themaat, T.; Schutte, C.S.; Lutters, D.; Kennon, D. Designing a framework to design a business model for the bottom of the pyramid population. S. Afr. J. Ind. Eng. 2013, 24, 190–204. [Google Scholar] [CrossRef]
- Heikkilä, M.; Solaimani, S.; Soudunsaari, A.; Hakanen, M.; Kuivaniemi, L.; Suoranta, M. Performance Estimation of Networked Business Models: Case Study on a Finnish eHealth Service Project. J. Bus. Model. 2014, 2, 71–88. [Google Scholar]
- Busi, M.; Bititci, U.S. Collaborative performance management: Present gaps and future research. Int. J. Product. Perform. Manag. 2006, 55, 7–25. [Google Scholar] [CrossRef]
- Voelpel, S.C.; Leibold, M.; Eckhoff, R.A. The tyranny of the Balanced Scorecard in the innovation economy. J. Intellect. Cap. 2006, 7, 43–60. [Google Scholar] [CrossRef]
- Faber, E.; Ballon, P.; Bouwman, H.; Haaker, T. Designing business models for mobile ICT services. In Proceedings of the 16th Bled Electronic Commerce Conference eTransformation, Bled, Slovenia, 9–11 June 2003; pp. 1–14.
- Sun, Y.; Yan, H.; Lu, C.; Bie, R.; Thomas, P. A holistic approach to visualizing business models for the internet of things. Commun. Mob. Comput. 2012, 1, 4. [Google Scholar] [CrossRef]
- Westerlund, M.; Leminen, S.; Rajahonka, M. Designing Business Models for the Internet of Things. Technol. Innov. Manag. Rev. 2014, 4, 5–14. [Google Scholar]
- Fugl, K.L. Business Model Framework Proposal for Internet of Things; Copenhaguen Business School: Frederiksberg, Denmark, 2015. [Google Scholar]
- Turber, S.; Brocke, J.; Gassmann, O.; Fleisch, E. Designing Business Models in the Era of Internet of Things. In Advancing the Impact of Design Science: Moving from Theory to Practice; Chiarini Tremblay, M., VanderMeer, D., Rothenberger, M., Gupta, A., Yoon, V., Eds.; Springer: Miami, FL, USA, 2014; pp. 17–31. [Google Scholar]
- Bélissent, J.; Mines, C.; Radcliffe, E.; Darashkevich, Y. Getting Clever About Smart Cities: New Opportunities Require New Business Models; Forrester: Cambridge, MA, USA, 2010. [Google Scholar]
- Kuk, G.; Janssen, M. The Business Models and Information Architectures of Smart Cities. J. Urban Technol. 2011, 18, 39–52. [Google Scholar] [CrossRef]
- Molinari, F. Innovative business models for smart cities: Overview of recent trends. In Proceedings of the European Conference on e-Government (ECEG), 12th European Conference on e-Government, ECEG 2012, Barcelona, Spain, 14–15 June 2012; pp. 483–492.
- Silva, E.M.; Maló, P. IoT Testbed Business Model. Adv. Internet Things 2014, 4, 37–45. [Google Scholar] [CrossRef]
- Deandres, N. Leveraging Applicable Business Models for IoT Enabled Service Solutions in the Downstream Automotive Supply Chain; Royal Institute of Technology (KHT): Stockholm, Sweden, 2014. [Google Scholar]
- Walravens, N. The city as a platform: A Case-based Exploration of Mobile Service Platform Types in the Context of the City. In Proceedings of the BMMP 2011 Third International Workshop on Business Models for Mobile Platforms—Access and Competitiveness in Multi-Sided Markets, Berlin, Germany, 7 October 2011; IEEE: Berlin, Germany, 2011; pp. 283–288. [Google Scholar]
- Malmström, A.; Johansson, J.; Chronér, D.; Bouckaert, S.; Martinez Garcia, S.; Potts, M.; Quetin, G.; Riepula, M.; Grace, P.; Nilsson, M.; et al. FIRE Collaboration Models; European Commission: Brussels, Belgium, 2015. [Google Scholar]
- Ballon, P. Business modelling revisited: The configuration of control and value. Info 2007, 9, 6–19. [Google Scholar] [CrossRef]
- Mora Penagos, W.M.; Parga Lozano, D.L. Tramas Histórico-Epistemológicas en la Evolución de la Teoría Estructural en Química Orgánica. TED Tecné Episteme y Didaxis 2007, 21, 100–118. [Google Scholar]
- Kasanen, E.; Lukka, K.; Siitonen, A. The Constructive Approach in Management Accounting Research. J. Manag. Account. Res. 1993, 5, 243–264. [Google Scholar]
- Lehtiranta, L.; Junnonen, J.-M.; Kärnä, S.; Pekuri, L. The Constructive Research Approach: Problem Solving for Complex Projects. In Designs, Methods and Practices for Research of Project Management; Routledge: London, UK, 2015; p. 520. [Google Scholar]
- Berelson, B. Content Analysis in Communication Research; The Free Press: Glencoe, IL, USA, 1952; p. 220. [Google Scholar]
- Hernández, R.; Fernández, C.; Baptista, P.; Hernandez Sampieri, R.; Fernandez Collado, C.; del Baptista Lucio M, P. Metodología de la Investigación; McGraw Hill: Mexico City, Mexico, 1991; p. 518. [Google Scholar]
- Lombardi, P.; Giordano, S.; Caragliu, A.; del Bo, C.; Deakin, M.; Nijkamp, P.; Kourtit, K.; Farouh, H. An Advanced Triple-Helix Network Model for Smart Cities Performance. In Green and Ecological Technolongies Urban Planning; Vrije Universiteit Amsterdam: Amsterdam, The Netherlands, 2011. [Google Scholar]
- Profile of the Interviewees. Available online: http://personales.unican.es/perezd/EnergiesSupplementary Materials.htm (accessed on 31 January 2017).
- Bogner, A.; Littig, B.; Menz, W. Interviewing Experts; Palgrave Macmillan: New York, NY, USA, 2009; p. 30. [Google Scholar]
- Rathbun, B.C. Interviewing and Qualitative Field Methods: Pragmatism and Practicalities. In The Oxford Handbook of Political Methodology; Box-Steffensmeier, J.M., Brady, H.E., Collier, D., Eds.; Oxford University Press: New York, NY, USA, 2008. [Google Scholar]
- Eisenhardt, K.M.; Graebner, M.E. Theory building from cases: Opportunities and challenges. Acad. Manag. J. 2007, 50, 25–32. [Google Scholar] [CrossRef]
- Baby, M.J.; Londoño, J.J.G. Las P’s de Mercadeo Algunas Precisiones; AD-Minister, Universidad EAFIT: Medellín, Colombia, 2008; pp. 149–161. [Google Scholar]
- Yin, R.K. Case Study Research: Design And Methods; Sage Publications: Thousand Oaks, CA, USA, 1994; p. 171. [Google Scholar]
- Ayuntamiento de Santander. Plan Estratégico Santander 2020; Ayuntamiento de Santander: Cantabria, Spain, 2011. [Google Scholar]


| Phase of Our Research Work | 1 | 2 | 3 | 4 | 5 |
|---|---|---|---|---|---|
| Action | Planning | Literature Review | Interviews to Experts | Case Study | Writing of Research Paper |
| Descripction of the activity | Meeting and discussion among the authors | Review of all the frameworks for business model analysis published in order to apply previous knowledge to our method | 11 experts were asked for recommendations regarding the draft of the BMCETSC | Application of the BMCETSC to 2 cases studies in order to prove applicability and validity | The research work carried out is described in detail and put on paper |
| Outcome | Definition of the problem and determination of the research process | Selection of the Non-Profit Business Model Canvas as the basis for our work, and development of the first draft of the Business Model Canvas Evaluation Tool for Smart Cities (BMETSC) | Development of the final version of the BMCETSC | The BMCETSC is validated | Final paper with the description of the research work |
| Step of the constructive method | Step 1 of the constructive method | Step 2 of the constructive method | Steps 3, 4 and 6 of the constructive method | Steps 4 and 6 of the constructive method | Steps 3, 5 and 6 of the constructive method |
| Parameters | Potential Qualifications | |
|---|---|---|
| Cost Structure | ||
| Related to the service provided with the traditional system, the cost offered with smart technologies is higher or lower? | −4/−3/−2/−1/0/+1/+2/+3/+4 | (−4 For cost over 50% higher; −3 For cost between 20% and 49% higher; −2 For cost between 5% and 19% higher; −1 For cost between 0% and 4% higher; 0 For the same cost; +1 For cost between 0% and 4% lower; +2 For cost between 5% and 19% lower; +3 For cost between 20% and 49% lower; +4 For over 50% lower cost) |
| Related to the service provided with the traditional system, the sources of costs are less, equal or more diversified? | −1/0/+1 | (−1 For less diversified; 0 For equal; and +1 For more diversified) |
| Revenue Streams | ||
| Related to the service provided with the traditional system, the amount of revenue that this product/service will generate more or less revenues for City Council and citizens? | −4/−3/−2/−1/0/+1/+2/+3/+4 | (−4 For revenues below 50%; −3 For revenues between 20% and 49% lower; −2 For revenues between 5% and 19% lower; −1 For revenues between 0% and 4% lower; 0 for the same revenues; +1 For revenues between 0% and 4% greater; +2 For revenues between 5% and 19% greater; +3 For revenues between 20% and 49% greater; +4 For revenues over 50% greater) |
| Related to the service provided with the traditional system, the sources of revenues are less, equal or more diversified? | −1/0/+1 | (−1 For less diversified; 0 For equal; and +1 For more diversified) |
| Social and Environmental Costs | ||
| To what extent it is negative to achieve the goal of being an intermediate city that provides the backbone of the system of the cities of the Cantabrian Sean and the European Atlantic framework? | −1/−0.5/0 | (−1 If the business model negatively affects this strategic objective; −0.5 If it affects slightly to achieve that goal; and 0 if it does not affect) |
| To what extent it is negative to achieve the goal of being a city which knowledge economy and productive innovation prevail? | ||
| To what extent it is negative to achieve the goal of being a creative city and productive of talent? | ||
| To what extent it is negative to achieve the goal of being a City of commitment with citizenship and socially cohesive? | ||
| To what extent it is negative to achieve the goal of being a sustainable, open and accessible city? | ||
| Social and Environmental Benefits | ||
| To what extent it contributes to achieve the goal of being an intermediate city that provides the backbone of the system of the cities of the Cantabrian Sean and the European Atlantic framework? | 0/+0.5/+1 | (0 if the business model does not contribute to achieving this objective; +0.5 If it contributes slightly to achieve that goal; and +1 if it contributes a lot) |
| To what extent it contributes to achieve the goal of being a city which knowledge economy and productive innovation prevail? | ||
| To what extent it contributes to achieve the goal of being a creative city and productive of talent? | ||
| To what extent it contributes to achieve the goal of being a City of commitment with citizenship and socially cohesive? | ||
| To what extent it contributes to achieve the goal of being a sustainable, open and accessible city? | ||
| Value Proposition | ||
| The product/service meets a need of City Council and citizens? | 0/+0.5/+1 | (0 if the answer is No; +0.5 If the answer is eminently positive; and +1 if the answer is clearly positive) |
| Are the citizens interested in adopting this product / service? | ||
| Is this product/service a plausible improvement in the quality of life of citizens? | ||
| Is the product/service of better quality than current alternatives? | ||
| Is the product/service’s price better price than current alternatives? | ||
| Customer Segment | ||
| Is the product/service potentially beneficial to at least 1% of citizens? | 0/+1 | (0 if the answer is negative; and +1 if the answer is positive) |
| Is the product/service potentially beneficial to between 1% and 9% of citizens? | ||
| Is the product/service potentially beneficial to between 10% and 24% of citizens? | ||
| Is the product/service potentially beneficial to between 25% and 49% of citizens? | ||
| Is the product/service potentially beneficial for more than 50% of citizens? | ||
| Is the product/service potentially detrimental to at least 1% of citizens? | −1/0 | (0 if the answer is negative; and −1 if the answer is positive) |
| Is the product/service potentially detrimental to between 1% and 9% of citizens? | ||
| Is the product/service potentially detrimental to between 10% and 24% of citizens? | ||
| Is the product/service potentially detrimental to between 25% and 49% of citizens? | ||
| Is the product/service potentially detrimental for more than 50% of citizens? | ||

| Parameters | Potential Qualifications | Qualifications | |
|---|---|---|---|
| Cost Structure | |||
| Related to the service provided with the traditional system, the cost offered with smart technologies is higher or lower? | −4/−3/−2/−1/0/+1/+2/+3/+4 | (−4 For cost over 50% higher; −3 For cost between 20% and 49% higher; −2 For cost between 5% and 19% higher; −1 For cost between 0% and 4% higher; 0 For the same cost; +1 For cost between 0% and 4% lower; +2 For cost between 5% and 19% lower; +3 For cost between 20% and 49% lower; +4 For over 50% lower cost) | 2.0 |
| Related to the service provided with the traditional system, the sources of costs are less, equal or more diversified? | −1/0/1 | (−1 For less diversified; 0 For equal; and +1 For more diversified) | 0.5 |
| 2.5 | |||
| Revenue Streams | |||
| Related to the service provided with the traditional system, the amount of revenue that this product/service will generate more or less revenues for City Council and citizens? | −4/−3/−2/−1/0/+1/+2/+3/+4 | (−4 For revenues below 50%; −3 For revenues between 20% and 49% lower; −2 For revenues between 5% and 19% lower; −1 For revenues between 0% and 4% lower; 0 for the same revenues; +1 For revenues between 0% and 4% greater; +2 For revenues between 5% and 19% greater; +3 For revenues between 20% and 49% greater; +4 For revenues over 50% greater) | 0.0 |
| Related to the service provided with the traditional system, the sources of revenues are less, equal or more diversified? | −1/0/+1 | (−1 For less diversified; 0 For equal; and +1 For more diversified) | 0.0 |
| 0.0 | |||
| Social and Environmental Costs | |||
| To what extent it is negative to achieve the goal of being an intermediate city that provides the backbone of the system of the cities of the Cantabrian Sean and the European Atlantic framework? | −1/−0.5/0 | (−1 If the business model negatively affects this strategic objective; −0.5 If it affects slightly to achieve that goal; and 0 if it does not affect) | 0.0 |
| To what extent it is negative to achieve the goal of being a city which knowledge economy and productive innovation prevail? | 0.0 | ||
| To what extent it is negative to achieve the goal of being a creative city and productive of talent? | 0.0 | ||
| To what extent it is negative to achieve the goal of being a City of commitment with citizenship and socially cohesive? | −0.5 | ||
| To what extent it is negative to achieve the goal of being a sustainable, open and accessible city? | 0.0 | ||
| −0.5 | |||
| Social and Environmental Benefits | |||
| To what extent it contributes to achieve the goal of being an intermediate city that provides the backbone of the system of the cities of the Cantabrian Sean and the European Atlantic framework? | 0/+0.5/+1 | (0 if the business model does not contribute to achieving this objective; +0.5 If it contributes slightly to achieve that goal; and +1 if it contributes a lot) | 0.0 |
| To what extent it contributes to achieve the goal of being a city which knowledge economy and productive innovation prevail? | 1.0 | ||
| To what extent it contributes to achieve the goal of being a creative city and productive of talent? | 0.5 | ||
| To what extent it contributes to achieve the goal of being a City of commitment with citizenship and socially cohesive? | 0.5 | ||
| To what extent it contributes to achieve the goal of being a sustainable, open and accessible city? | 1.0 | ||
| 3.0 | |||
| Value Proposition | |||
| The product/service meets a need of City Council and citizens? | 0/+0.5/+1 | (0 if the answer is No; +0.5 If the answer is eminently positive; and +1 if the answer is clearly positive) | 0.5 |
| Are the citizens interested in adopting this product/service? | 0.5 | ||
| Is this product/service a plausible improvement in the quality of life of citizens? | 0.5 | ||
| Is the product/service of better quality than current alternatives? | 0.5 | ||
| Is the product/service’s price better price than current alternatives? | 1.0 | ||
| 3.0 | |||
| Customer Segment | |||
| Is the product/service potentially beneficial to at least 1% of citizens? | 0/+1 | (0 if the answer is negative; and +1 if the answer is positive) | 1.0 |
| Is the product/service potentially beneficial to between 1% and 9% of citizens? | 1.0 | ||
| Is the product/service potentially beneficial to between 10% and 24% of citizens? | 1.0 | ||
| Is the product/service potentially beneficial to between 25% and 49% of citizens? | 1.0 | ||
| Is the product/service potentially beneficial for more than 50% of citizens? | 1.0 | ||
| Is the product/service potentially detrimental to at least 1% of citizens? | −1/0 | (0 if the answer is negative; and −1 if the answer is positive) | 0.0 |
| Is the product/service potentially detrimental to between 1% and 9% of citizens? | 0.0 | ||
| Is the product/service potentially detrimental to between 10% and 24% of citizens? | 0.0 | ||
| Is the product/service potentially detrimental to between 25% and 49% of citizens? | 0.0 | ||
| Is the product/service potentially detrimental for more than 50% of citizens? | 0.0 | ||
| 5.0 | |||
| Parameters | Potential Qualifications | Qualifications | |
|---|---|---|---|
| Cost Structure | |||
| Related to the service provided with the traditional system, the cost offered with smart technologies is higher or lower? | −4/−3/−2/−1/0/+1/+2/+3/+4 | ((−4) For cost over 50% higher; (−3) For cost between 20% and 49% higher; (−2) For cost between 5% and 19% higher; (−1) For cost between 0% and 4% higher; 0 For the same cost; +1 For cost between 0% and 4% lower; +2 For cost between 5% and 19% lower; +3 F) | 2.0 |
| Related to the service provided with the traditional system, the sources of costs are less, equal or more diversified? | −1/0/+1 | ((−1) For less diversified; 0 For equal; and +1 For more diversified) | 0.0 |
| 2.0 | |||
| Revenue Streams | |||
| Related to the service provided with the traditional system, the amount of revenue that this product/service will generate more or less revenues for City Council and citizens? | −4/−3/−2/−1/0/+1/+2/+3/+4 | ((−4) For revenues below 50%; (−3) For revenues between 20% and 49% lower; (−2) For revenues between 5% and 19% lower; (−1) For revenues between 0% and 4% lower; 0 for the same revenues; +1 For revenues between 0% and 4% greater; +2 For revenues between 5) | 0.0 |
| Related to the service provided with the traditional system, the sources of revenues are less, equal or more diversified? | −1/0/1 | ((−1) For less diversified; 0 For equal; and +1 For more diversified) | 0.0 |
| 0.0 | |||
| Social and Environmental Costs | |||
| To what extent it is negative to achieve the goal of being an intermediate city that provides the backbone of the system of the cities of the Cantabrian Sean and the European Atlantic framework? | −1/−0.5/0 | ((−1) If the business model negatively affects this strategic objective; (−0.5) If it affects slightly to achieve that goal; and 0 if it does not affect) | 0.0 |
| To what extent it is negative to achieve the goal of being a city which knowledge economy and productive innovation prevail? | 0.0 | ||
| To what extent it is negative to achieve the goal of being a creative city and productive of talent? | 0.0 | ||
| To what extent it is negative to achieve the goal of being a City of commitment with citizenship and socially cohesive? | 0.0 | ||
| To what extent it is negative to achieve the goal of being a sustainable, open and accessible city? | 0.0 | ||
| 0.0 | |||
| Social and Environmental Benefits | |||
| To what extent it contributes to achieve the goal of being an intermediate city that provides the backbone of the system of the cities of the Cantabrian Sean and the European Atlantic framework? | 0/+0.5/+1 | (0 if the business model does not contribute to achieving this objective; +0.5 If it contributes slightly to achieve that goal; and +1 if it contributes a lot) | 0.0 |
| To what extent it contributes to achieve the goal of being a city which knowledge economy and productive innovation prevail? | 0.5 | ||
| To what extent it contributes to achieve the goal of being a creative city and productive of talent? | 0.5 | ||
| To what extent it contributes to achieve the goal of being a City of commitment with citizenship and socially cohesive? | 0.0 | ||
| To what extent it contributes to achieve the goal of being a sustainable, open and accessible city? | 1.0 | ||
| 2.0 | |||
| Value Proposition | |||
| The product/service meets a need of City Council and citizens? | 0/+0.5/+1 | (0 if the answer is No; +0.5 If the answer is eminently positive; and +1 if the answer is clearly positive) | 0.5 |
| Are the citizens interested in adopting this product/service? | 0.5 | ||
| Is this product/service a plausible improvement in the quality of life of citizens? | 0.0 | ||
| Is the product/service of better quality than current alternatives? | 0.0 | ||
| Is the product/service’s price better price than current alternatives? | 1.0 | ||
| 2.0 | |||
| Customer Segment | |||
| Is the product/service potentially beneficial to at least 1% of citizens? | 0/+1 | (0 if the answer is negative; and +1 if the answer is positive) | 1.0 |
| Is the product/service potentially beneficial to between 1% and 9% of citizens? | 1.0 | ||
| Is the product/service potentially beneficial to between 10% and 24% of citizens? | 1.0 | ||
| Is the product/service potentially beneficial to between 25% and 49% of citizens? | 1.0 | ||
| Is the product/service potentially beneficial for more than 50% of citizens? | 1.0 | ||
| Is the product/service potentially detrimental to at least 1% of citizens? | −1/0 | (0 if the answer is negative; and (−1) if the answer is positive) | 0.0 |
| Is the product/service potentially detrimental to between 1% and 9% of citizens? | 0.0 | ||
| Is the product/service potentially detrimental to between 10% and 24% of citizens? | 0.0 | ||
| Is the product/service potentially detrimental to between 25% and 49% of citizens? | 0.0 | ||
| Is the product/service potentially detrimental for more than 50% of citizens? | 0.0 | ||
| 5.0 | |||
© 2017 by the authors. Licensee MDPI, Basel, Switzerland. This article is an open access article distributed under the terms and conditions of the Creative Commons Attribution (CC BY) license ( http://creativecommons.org/licenses/by/4.0/).
Share and Cite
Díaz-Díaz, R.; Muñoz, L.; Pérez-González, D. The Business Model Evaluation Tool for Smart Cities: Application to SmartSantander Use Cases. Energies 2017, 10, 262. https://doi.org/10.3390/en10030262
Díaz-Díaz R, Muñoz L, Pérez-González D. The Business Model Evaluation Tool for Smart Cities: Application to SmartSantander Use Cases. Energies. 2017; 10(3):262. https://doi.org/10.3390/en10030262
Chicago/Turabian StyleDíaz-Díaz, Raimundo, Luis Muñoz, and Daniel Pérez-González. 2017. "The Business Model Evaluation Tool for Smart Cities: Application to SmartSantander Use Cases" Energies 10, no. 3: 262. https://doi.org/10.3390/en10030262
APA StyleDíaz-Díaz, R., Muñoz, L., & Pérez-González, D. (2017). The Business Model Evaluation Tool for Smart Cities: Application to SmartSantander Use Cases. Energies, 10(3), 262. https://doi.org/10.3390/en10030262