1. Introduction
The demand of world primary energy is expected to grow by 1.6% per annum during the period 2010–2030. In order to meet this requirement, energy production will need to be increased by 39% [
1]. Natural gas (NG) is a natural resource that in recent years has seen a large increase in demand globally. While the share of oil in energy is forecast to dramatically decrease by 2030, NG is predicted to reach 25.9% of the world’s energy usage. LNG demand may reach up to 500 Mtpa by 2030 [
1].
The major use for LNG today is power generation resulting from the growing power demand in the Southeast Asian region. Given the large scale of LNG projects, it is tempting for governments to adopt regulations from other countries. LNG is regasified using a vaporization system where transformation of LNG from liquid to the gaseous state requires substantial heat input. This step is very important in the overall energy conversion efficiency, and it is greatly affected by geography and meteorology, which in turn affects technology choices.
Heat exchange technologies in use include open rack vaporizers (ORVs), submerged combustion vaporizers (SCVs), shell and tube vaporizers (STVs), intermediate fluid vaporizers (IFVs) and ambient or forced air vaporizers (AAVs or FAVs). The current technologies have numerous constraints and impact on the environment. Frequently, the expensive “cold” energy at −161 °C of the LNG is wasted when the LNG is vaporized using any of the former technologies. The cold energy is retained in LNG during the liquefaction and is a part of the total energy consumed during the LNG liquefaction process. This cold energy can be recovered during the regasification process by various means, but most terminals still use these relatively simple direct vaporization techniques, such as ORV and SCV or IFV/AAV/FAV. The supply and demand of gas are dependent on the final delivery price. Therefore, technology innovations are required to optimize the gas value chain. The optimization and/or improvements in the vaporization element of the gas value chain are expected to result in enhanced capital and operational productivity and may have a direct impact on the consumption patterns of gas and therefore help to minimize the carbon footprint. This is particularly important during the transitional phase while the world moves from fossil fuels to renewables
There is a lack of published data on geographical and meteorological factors in LNG regasification. Therefore, the aim of this study is to collate data from a diverse range of sources, some of which is not readily available, and present this information in a form that will provide a foundation for quantitative design modelling for chosen location(s) into the future. While there is a reasonable amount of literature from industry and conference sources on LNG regasification terminals globally, its quality is variable and must be interpreted with skill and care. The literature review consisted of only eight key peer-reviewed papers; 3 papers are on LNG cold energy utilization [
2,
3,
4], 1 paper on thermal design of IFV [
5], 1 paper on Super ORV heat transfer simulation [
6], 1 paper on AAV practical application [
7], 1 paper on fog clouds due to ambient air vaporizer [
8] and 1 paper on materials and corrosion aspects in LNG regasification terminals [
9].
The paper will initially explain a global LNG trade and technology position, followed by a description of LNG regasification technologies, an analysis of key location factors by region, a brief on the potential impact of climate change and some suggestions on future research opportunities.
2. LNG Regasification: Global Trade and Technology Position
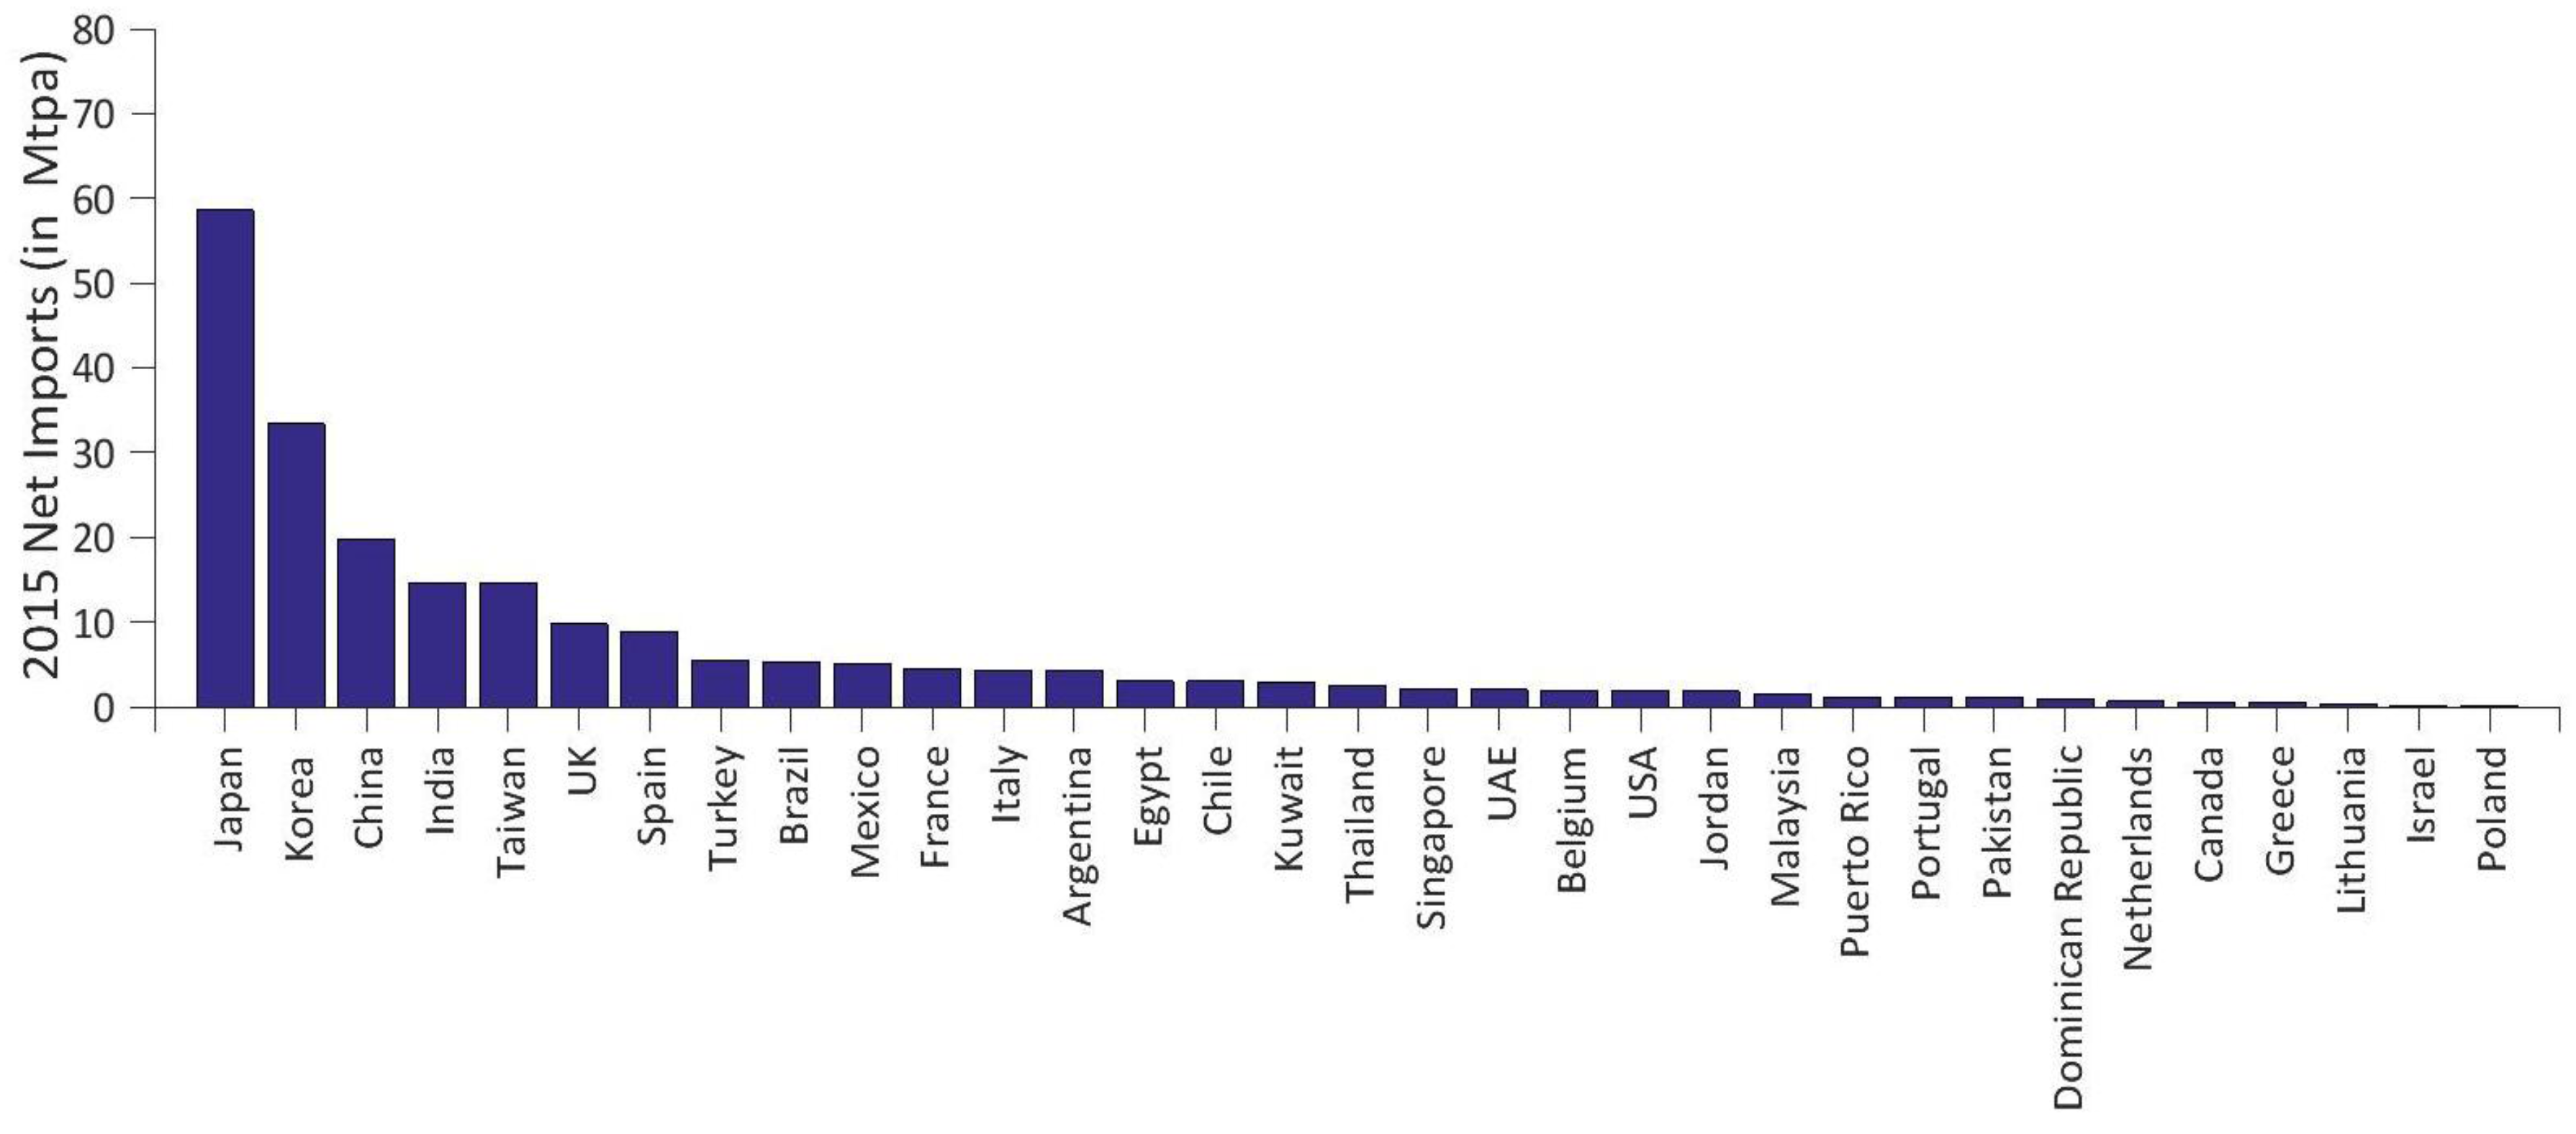
An LNG demand outlook is shown in
Figure 1 for each country [
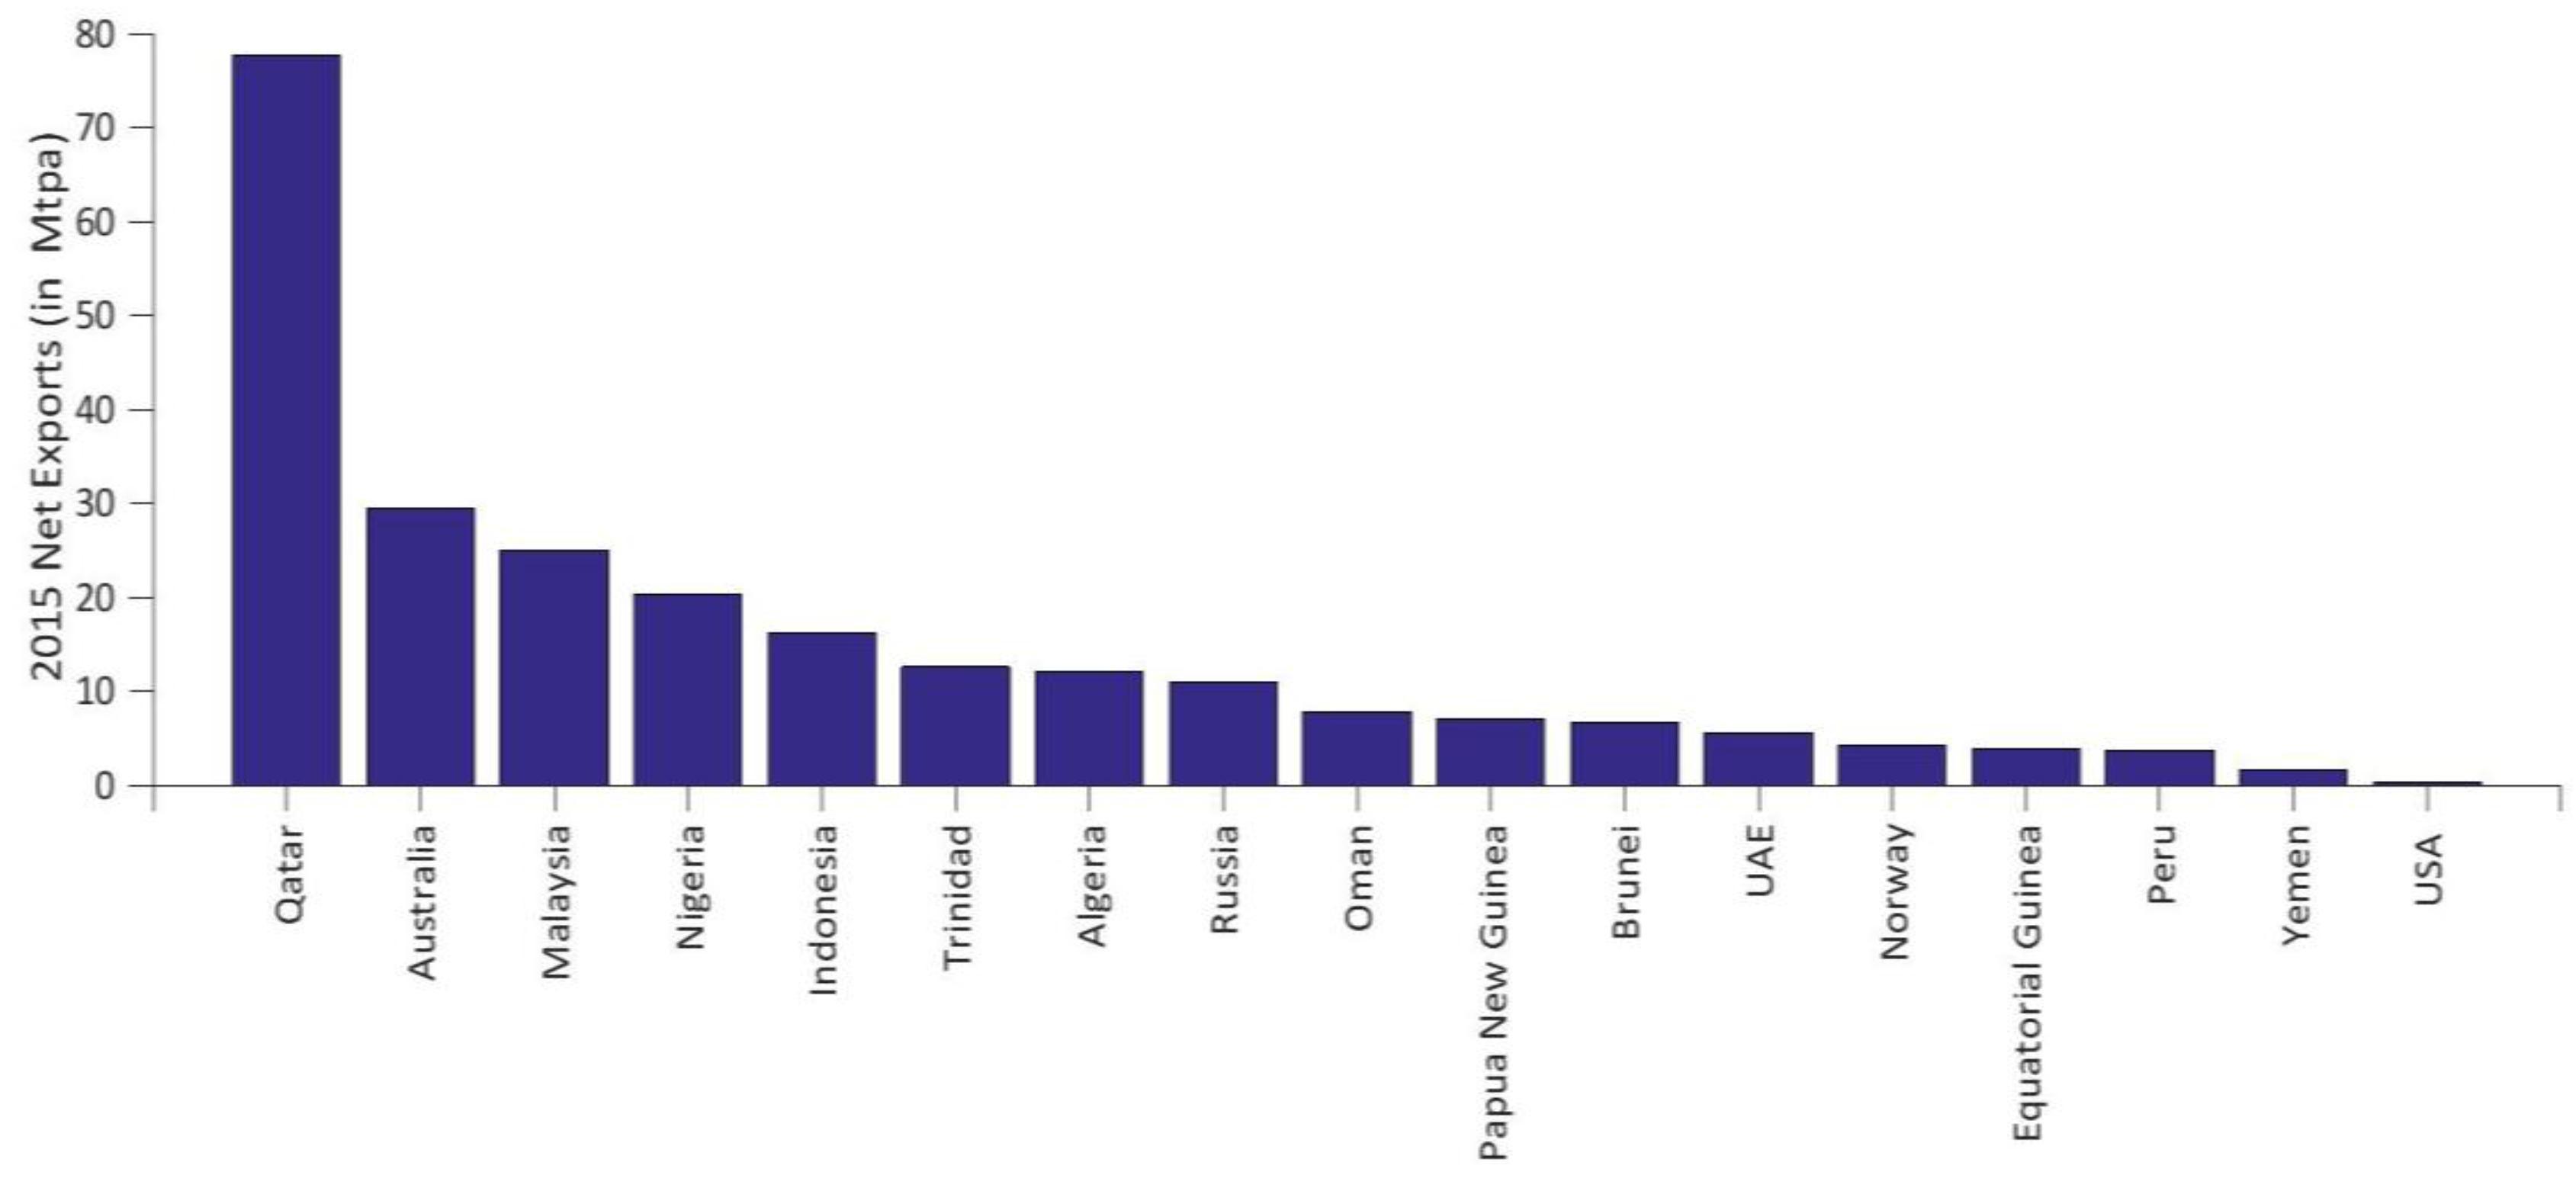
10]. Currently, a few countries (e.g., Japan, Korea) dominate this list, but many new LNG receiving terminals are under construction or in planning stages, worldwide. Therefore, the demand prospects for countries other than the largest consumers, such as Japan, are increasing. The recent reduction in demand in Japan is most likely due to the re-start of nuclear power generation during 2015 and beyond. A summary of LNG exporting countries is shown in
Figure 2 [
10].
The LNG value chain can be divided into three main parts; (i) production/liquefaction, (ii) LNG transportation and (iii) regasification and distribution. During the liquefaction phase, NG is chilled to a liquid state where its volume is reduced to 1/600th of its original volume. The LNG is transported to its destination by means of insulated cryogenic ships. During the consumption phase, LNG is changed into its gaseous form (“regasified”) and delivered through gas pipelines to customers.
Approximately 500 kWh/t LNG during LNG production is needed for compression and refrigeration, and a considerable portion of this energy is preserved in the LNG as cold energy, which has a final temperature of approximately −161 °C at atmospheric pressure. Therefore, a considerable potential for energy recovery exists during the regasification process [
4].
From
Figure 1 and
Figure 2, it has been observed that some LNG exporting countries also import LNG i.e., UAE, Malaysia and USA. This phenomenon can possibly be attributed to accelerated growth in local gas demand, local gas production and/or pipeline gas availability or simply the economics of LNG versus pipeline gas.
A summary of the global technology position and cold energy utilization for key regions is provided below (adapted from [
10,
11,
12]). Japan and Korea combined import approximately 50% of the world’s current LNG production (
Table 1).
Japan is the biggest LNG importer in the world. Korea is the second biggest LNG importer and imported ~33 Mt during 2015. China is the third biggest LNG importer. Total LNG imports were ~20 Mt during 2015. India is the fourth biggest LNG importer. India imported ~15 Mt during 2015. Europe (defined in this study as Belgium, France, Italy, The Netherlands, Portugal, Spain, Sweden, Turkey and the United Kingdom) is a significant LNG importer. Total LNG imports were ~37.5 Mt during 2015. South America (Argentina, Brazil, Chile, Dominican Republic and Puerto Rico) is also a significant LNG importer. Total LNG imports were ~14.6 Mt during 2015. Other Asian countries (Thailand, Taiwan and Singapore) are emerging LNG importers. The total LNG imports equalled ~17 Mt during 2015.
3. A Description of LNG Regasification Technologies
3.1. Ambient Air Vaporizers
The heat energy source to regasify LNG in ambient air vaporization (AAV) technology comes from the ambient air. LNG is distributed through a series of surface heat exchangers. The air cools as it travels down and exits the bottom of the vaporizer. The air flow is controlled on the outside of the exchanger either through natural buoyancy (convection) of the cooled, dense air or by the installation of forced-draft ambient air fans (See
Figure 3).
AAV technology is most suitable for areas with warmer ambient temperatures. Where cooler climates occur, a supplemental heat system would be needed during colder weather conditions to maintain effective use. Water vapour in the air condenses and freezes, forming frost relatively easily in these systems because the LNG is vaporized directly with air (direct heat system). The frost is a poor conductor, and its build-up reduces performance and the heat transfer coefficient. A significant amount of space is required for the ambient air vaporization system to prevent ambient air recirculation, as well as to maintain vaporization capacity.
Fog can be generated under certain geographical location factors including areas with high dew points. Cooling the ambient air can then generate a large fog bank. Though a fog bank is essentially benign, the siting issues need to be taken into consideration [
13].
An AAV operates by extracting the heat directly from the surrounding air to heat the LNG by natural convection. This type of technology is cost competitive as it operates on a standalone basis without the need for seawater, burning of fuels or intermediate fluids. However, as the heat capacity of air is significantly less than seawater and no additional heat is added, the number of vaporizer units required to heat LNG is larger when compared to ORVs and SCVs requiring a much larger plot space [
14].
3.2. Seawater Vaporizers
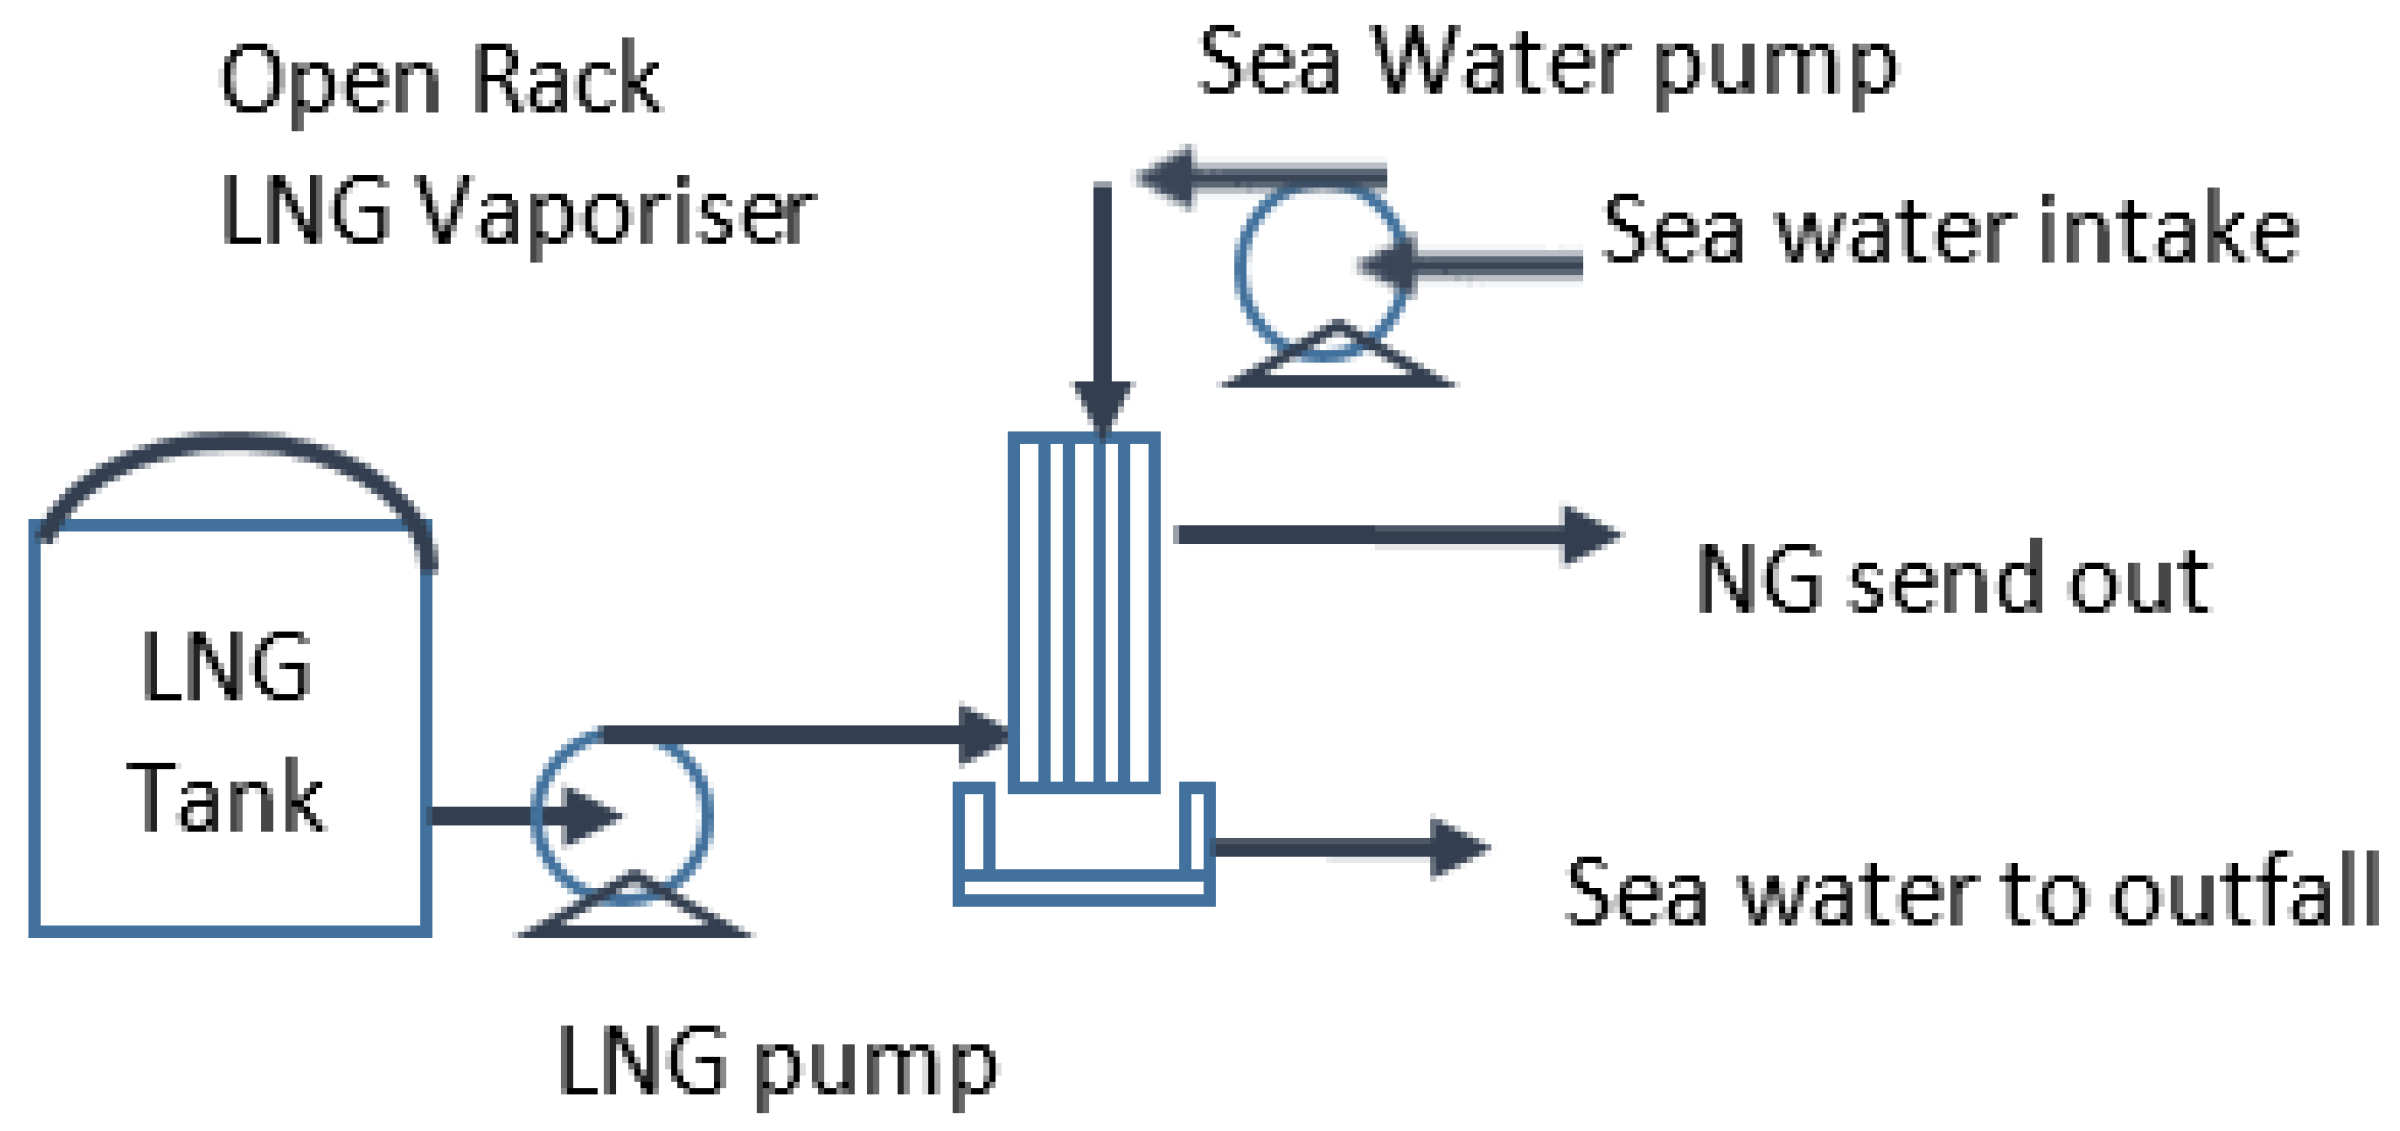
Seawater is used by open rack vaporizers (ORV) as the heat energy source in a direct heat system to vaporize the LNG (
Figure 4). Sodium hypochlorite is injected on the intake side of the system to control algae growth. The treated seawater is pumped to the top of the water header box. From there, it travels down the outer surface of the tube heat exchanger panels; simultaneously, LNG flows upward through these tubes, and heat exchange occurs. The colder water discharges through the water outfall, and the vaporized natural gas exits at the top header. This technology relies on seawater as the primary heat source; therefore, it is effective only if seawater temperatures are above 5 °C.
Most vaporizers provide a unique engineering challenge because across them will be a temperature differential of −161 °C–5 °C; therefore, the material used must endure the high-temperature change. Added to this, in the case of ORV, it must also deal with the corrosive nature of seawater [
6]. The racks are constructed of finned aluminium tubing providing strength against the cold operating temperatures and are coated with corrosion protection where they are in contact with salt water [
14]. The seawater may also have other impurities such as suspended solids and fouling agents, which may be important criteria in the technology selection for a given location.
Corrosion protection of the outer tubes relies on a film of aluminium oxide (Al
2O
3), which is created when the dissolved oxygen in the seawater reacts with the aluminium. The tubes are also covered with a layer of iron and manganese compounds, with deposits of calcium, magnesium and sodium from the seawater [
9]. There could be various options for corrosion protection. For example, a zinc alloy coating can be sprayed onto the finned tubes as a sacrificial protection.
The heat energy source for shell and tube vaporizers (STV) is also seawater. An open-loop STV system is mounted vertically to optimize vaporization efficiency. LNG enters the bottom of the STV and passes through multiple tubes while seawater enters a shell surrounding the tubes. Due to the usage of seawater, there are similar environmental issues to the ORV system [
13].
ORV systems use seawater as the heating source for the LNG and can potentially harm marine life by trapping them in the water inlets. There are several environmental issues associated with colder seawater outfall. The ORV technology requires large volumes of seawater, which could adversely affect marine life [
15]. However, the consequence assessment of colder seawater may be very location specific and may depend on the marine life in each location and the hydrological simulation modelling to assess the minimum allowable seawater temperatures.
3.3. Combustion Heat Vaporizer
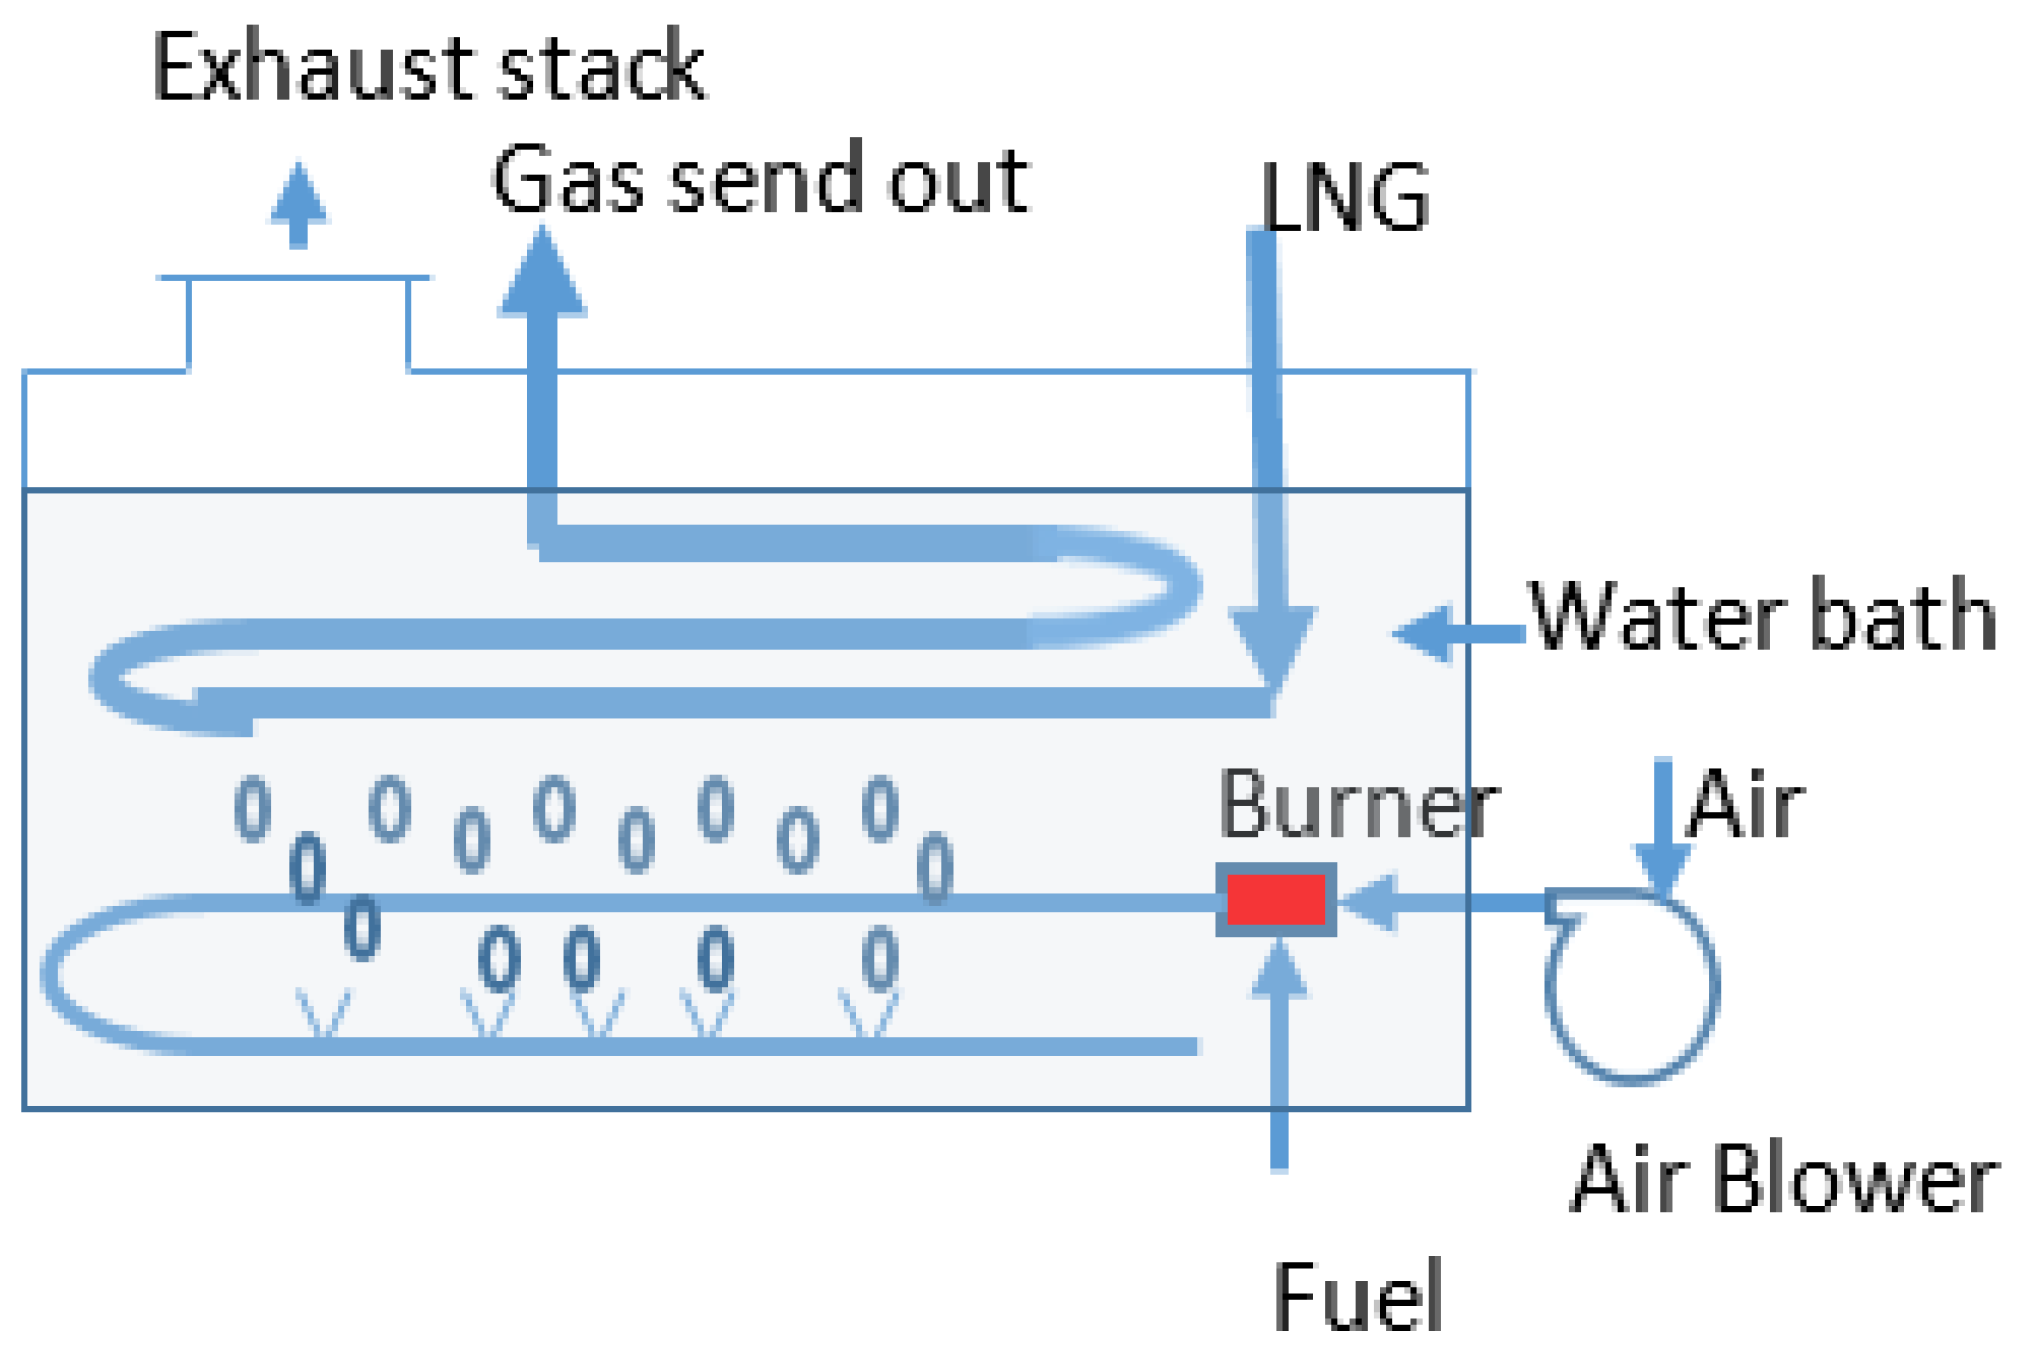
Seawater is not used in submerged combustion vaporizers (SCV) for LNG vaporization. Rather, heating of the LNG occurs by it flowing through tube bundles that are submerged in a water bath and heated by natural gas combustion. The hot exhaust gases emitted by the submerged combustion burner bubble through the water to directly heat the water bath then pass to an exhaust stack (
Figure 5).
Due to the high heat capacity of the water, it is possible to manage rapid load fluctuations and sudden start-ups and shutdowns to maintain a stable operation. Therefore, the SCVs can provide great flexibility and a quick response to varying demand requirements. The huge reserve heat bank of SCVs ensures that surges can be mitigated with heat from the water bath alone even if the combustion processes should suffer a temporary failure. SCVs under normal operation represent a significant operating cost in fuel by consuming from 1.5–2.0 percent of the ship’s LNG cargo to supply the burner. In addition, the bathwater becomes acidic due to the acidic combustion products, which are absorbed during the heating process. It is therefore necessary to provide chemical water treatment to the water bath. The associated excess combustion water must be neutralized prior to discharge. Finally, the submerged combustion vaporizer produces a large quantity of emissions to the atmosphere in the form of flue gas. This may be reduced using emission treatment systems, but will add significantly to the operating costs of SCVs [
13].
3.4. Intermediate Fluid Vaporizers
An intermediate heat transfer fluid is used in intermediate fluid vaporizers (IFV) to revaporise LNG. This technology can be configured to operate in either closed-loop, open-loop or in combination systems. The most common intermediate fluid vaporizers use propane, refrigerant or a water/glycol mixture. Propane and other refrigerants are costly and have high operational handing risks, but have low flash points that are ideal for heat transfer. The water/glycol mixtures are cost-effective, and the associated operational risks are relatively low. They have a high flash point, but require a larger heat transfer area, which results in a larger system than the propane or refrigerant systems [
13].
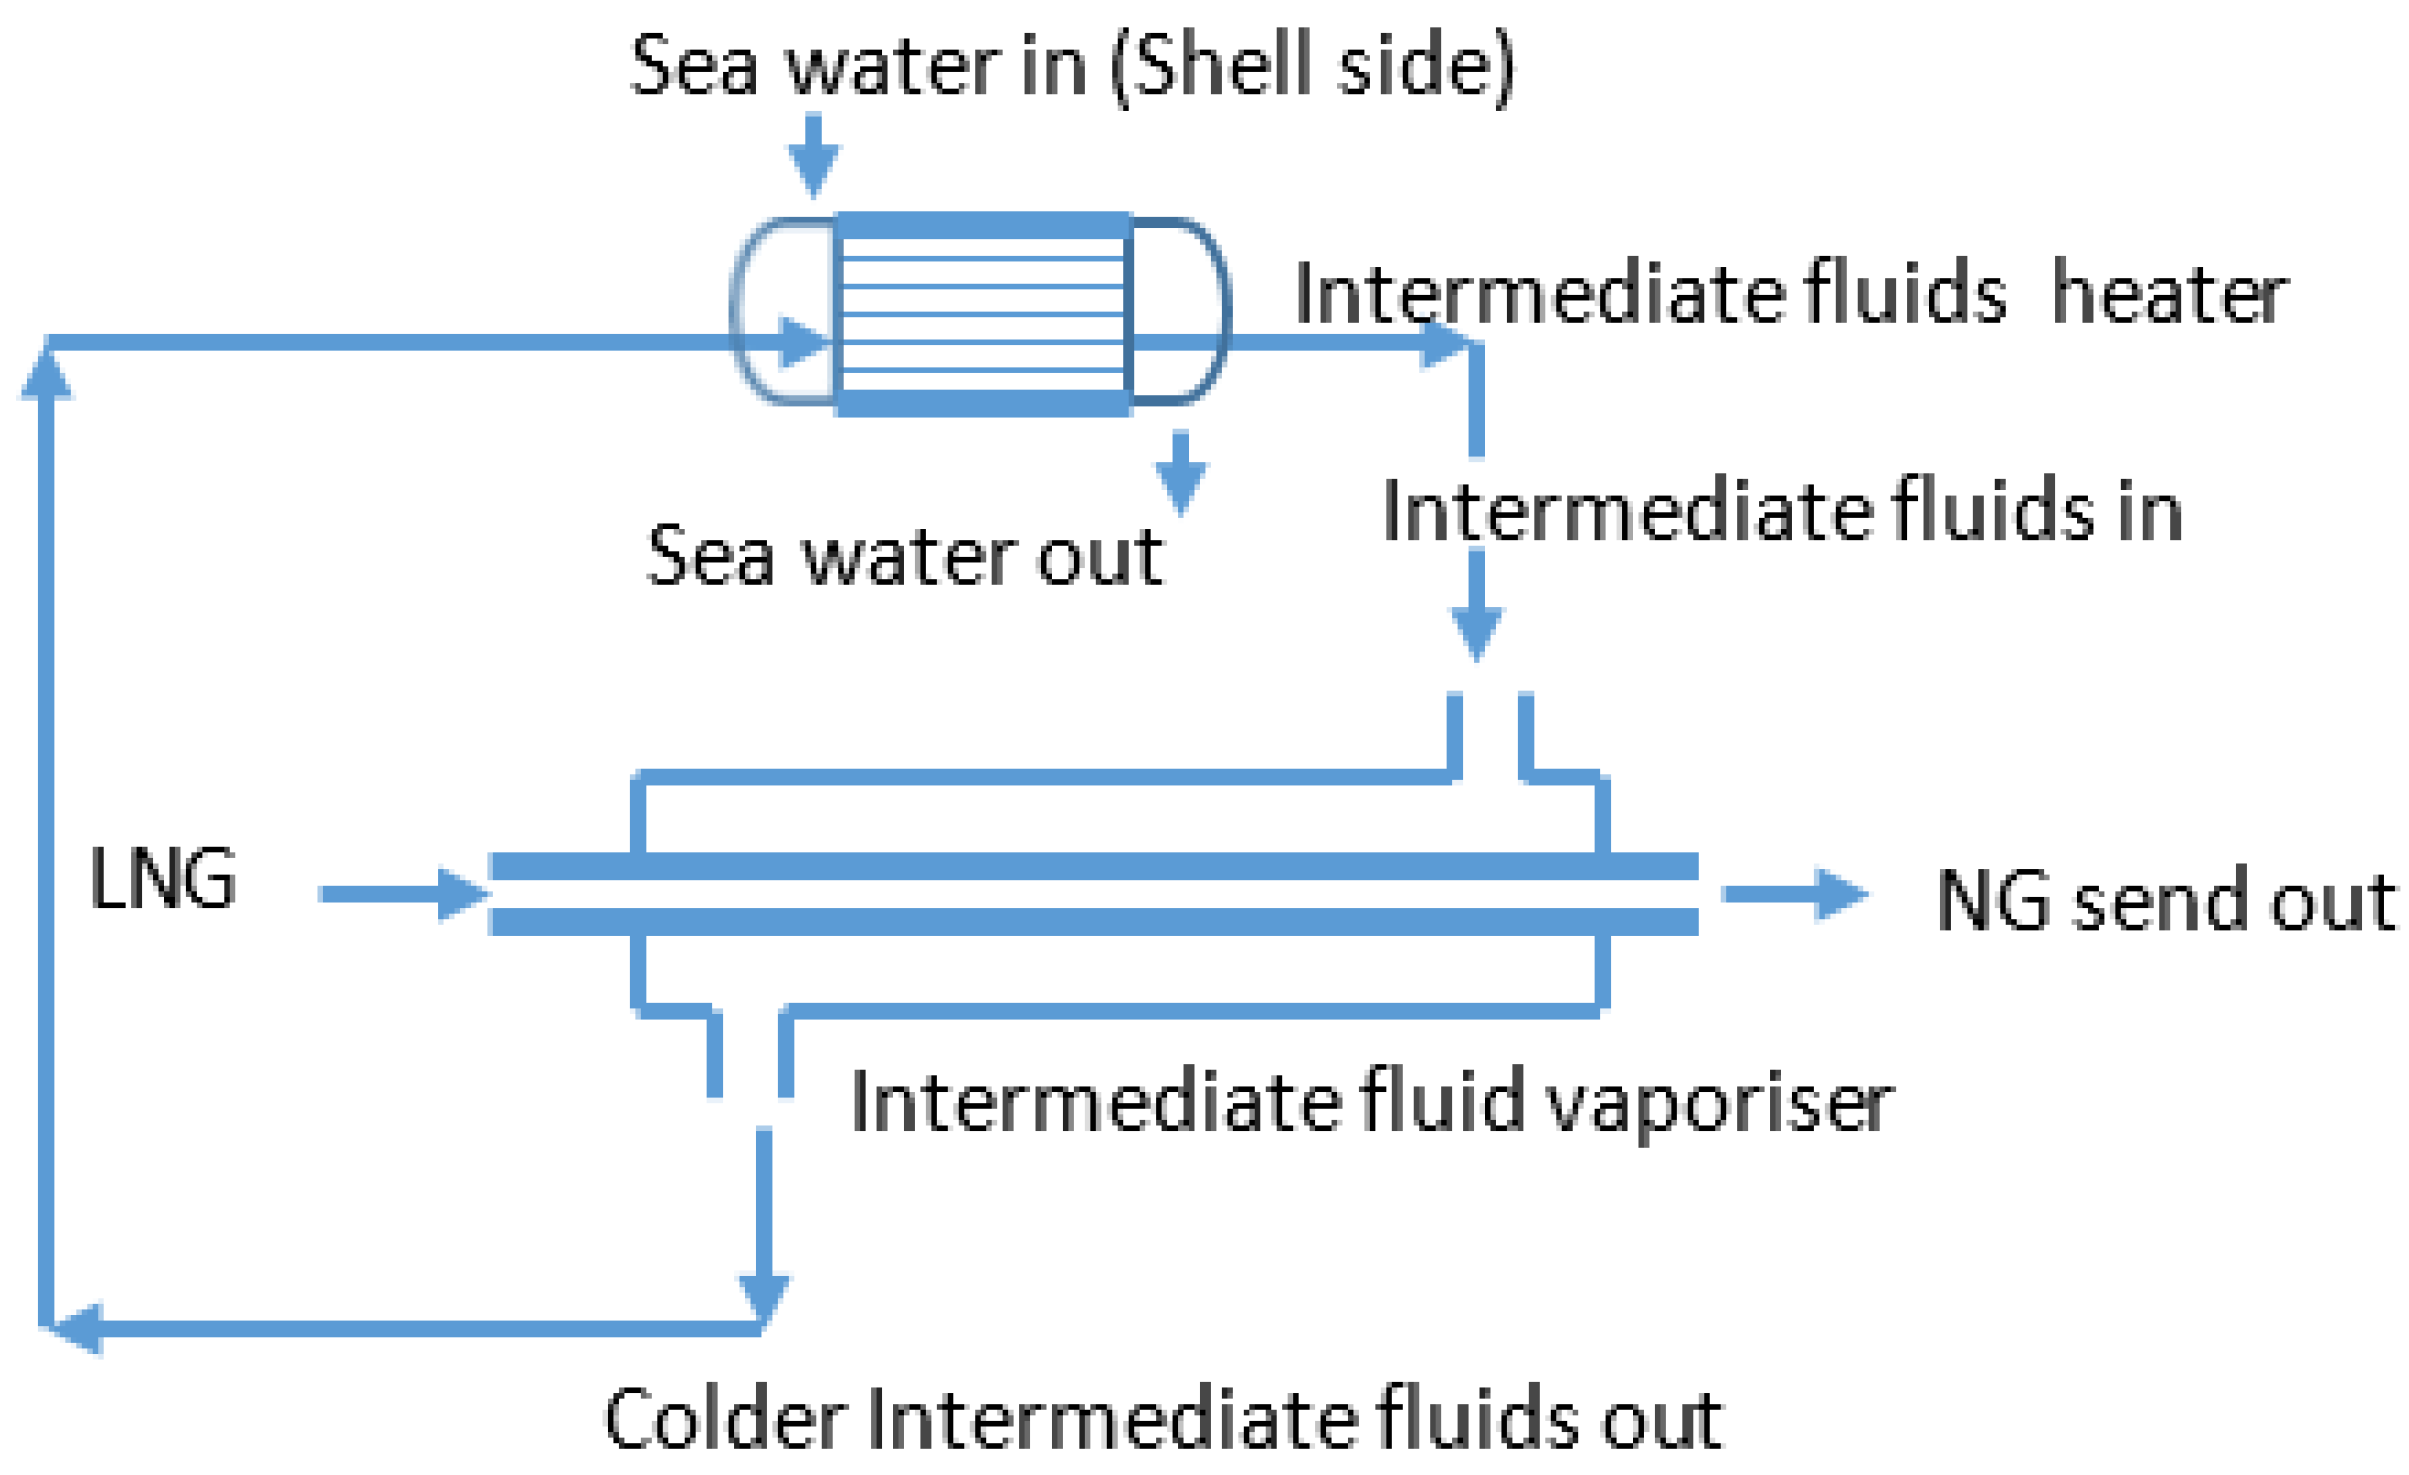
The open-loop IFV technology requires seawater intake (
Figure 6). Environmental issues therefore arise and include entrainment of marine in the intake resulting in injury or mortality, as well as low temperature discharge of seawater into the surrounding seawater. Intermediate fluid vaporizers that use propane or refrigerant as the intermediate fluid add a potentially hazardous material to the facility operations. An IFV system that makes use of water/glycol mixtures is a safer way to operate. The intermediate air is heated by a combustion system and associated combustion emissions, and the carbon footprint can be reduced by the use of waste heat recovery [
13].
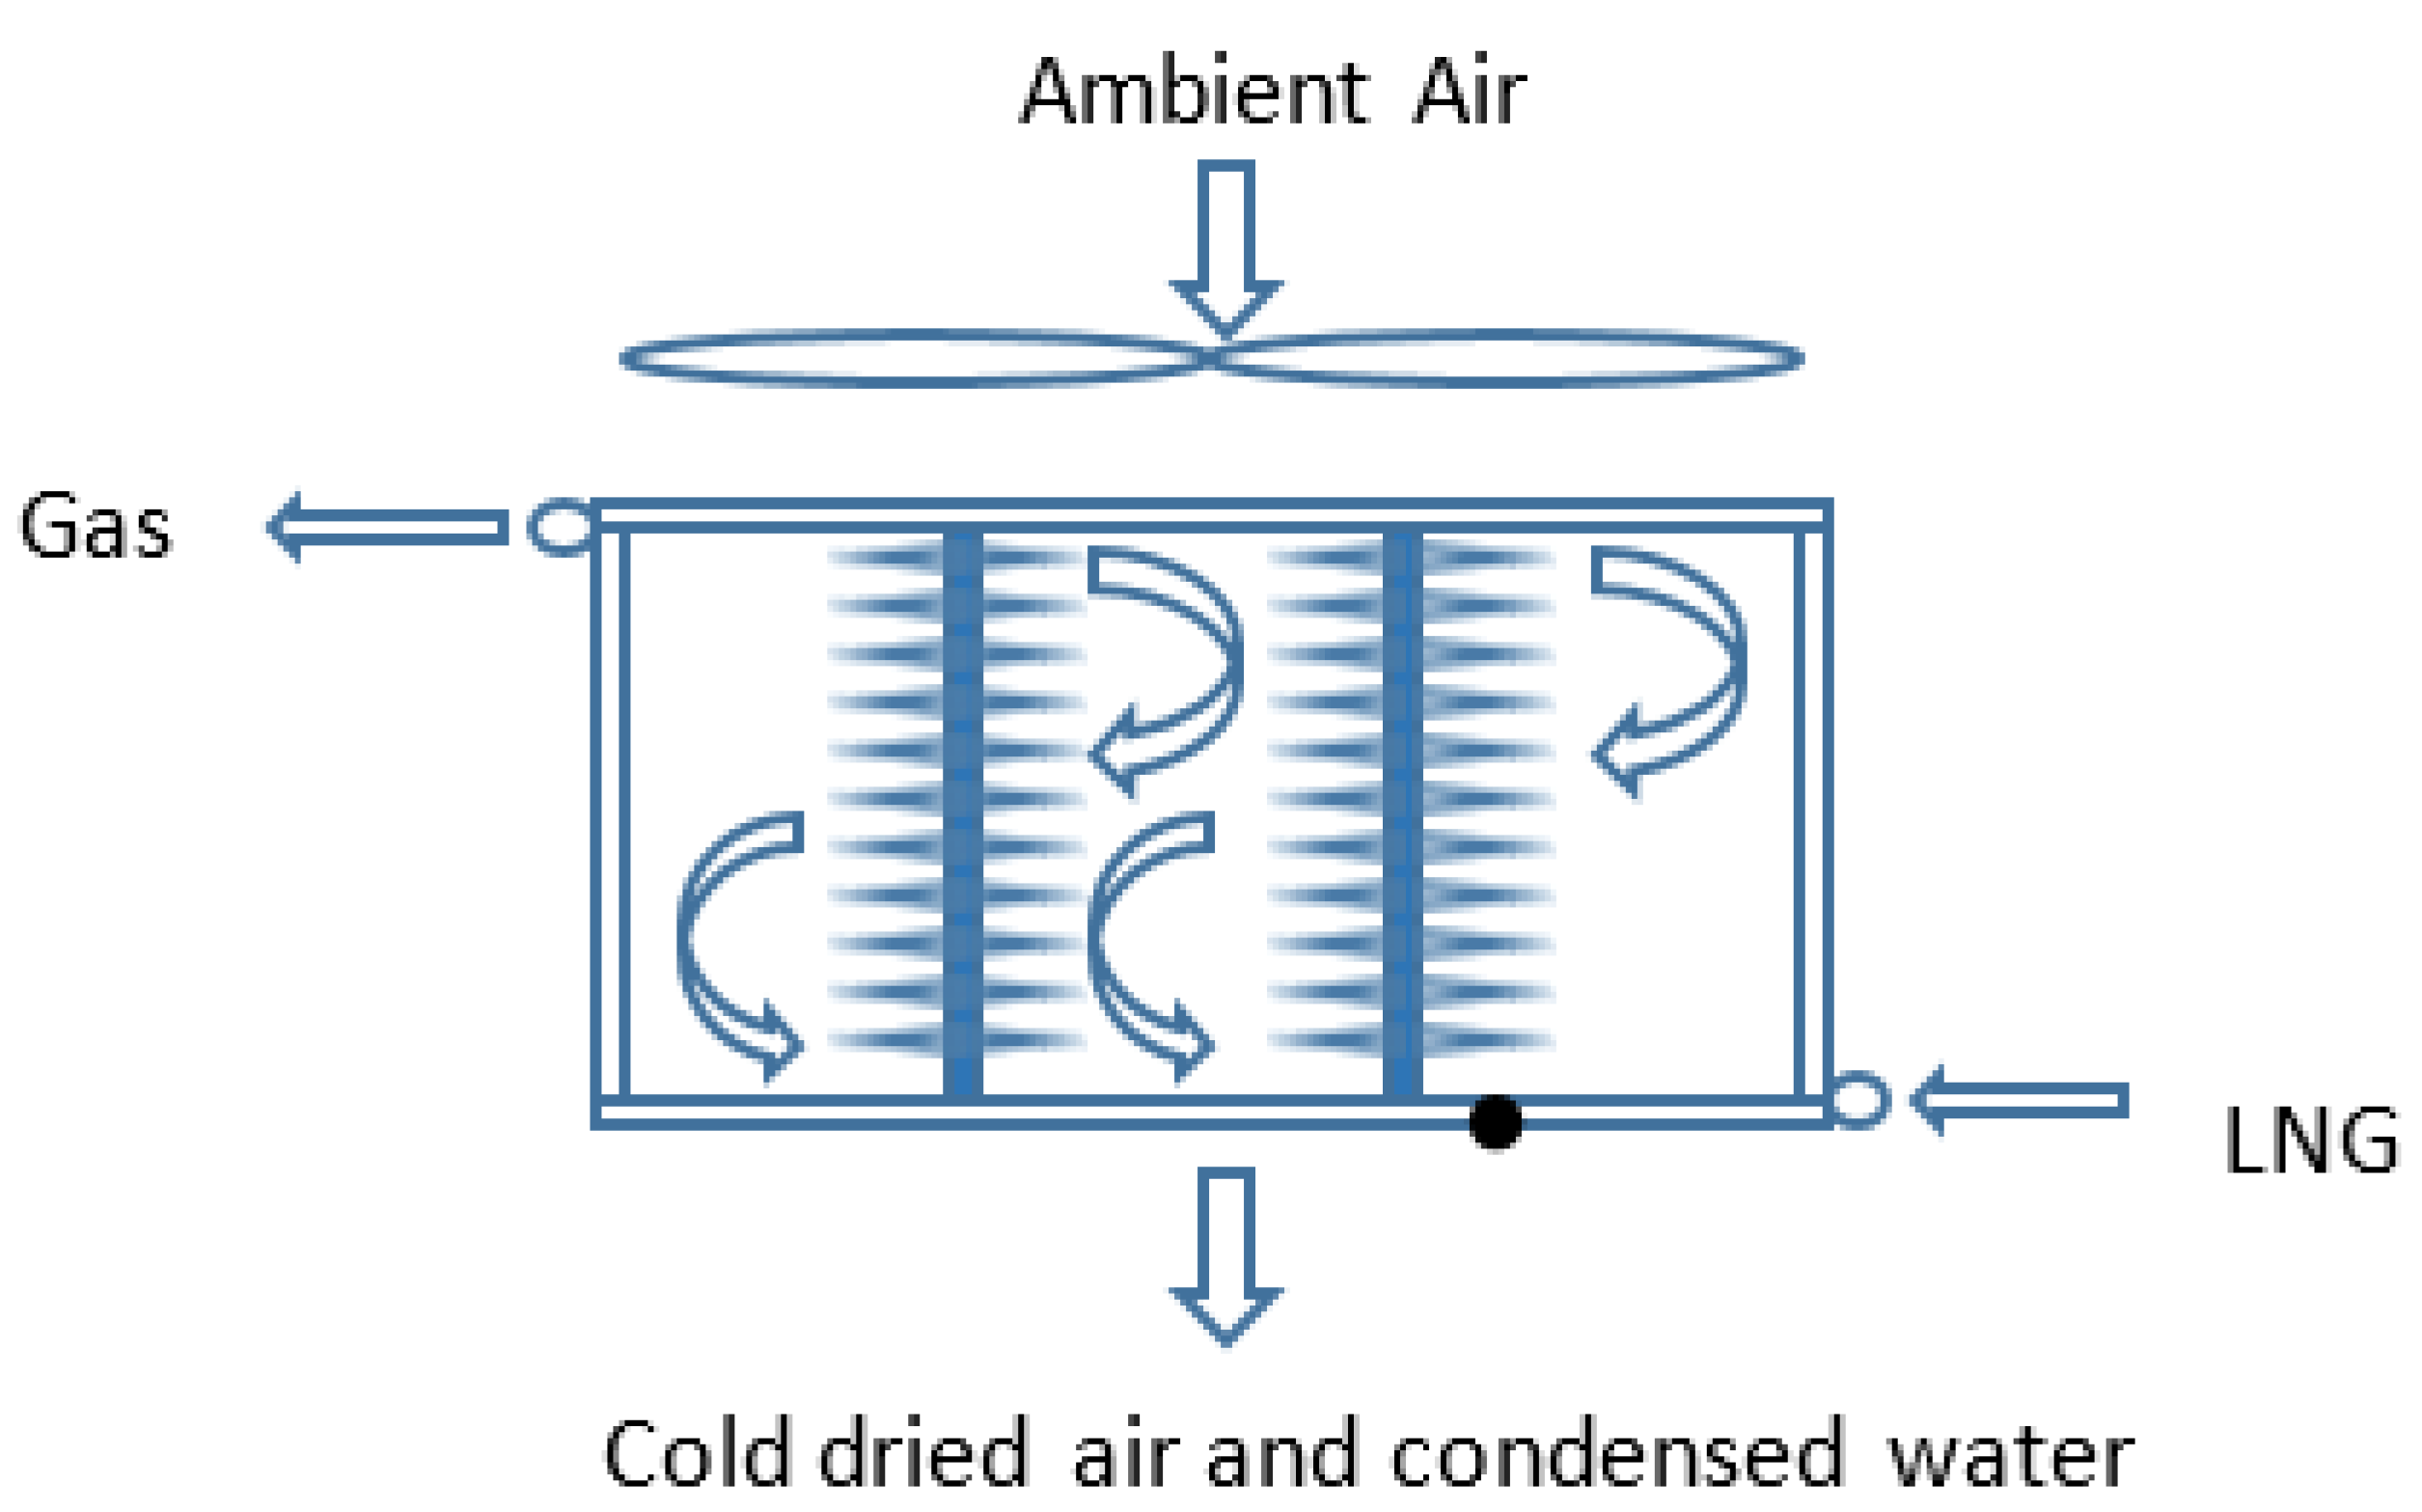
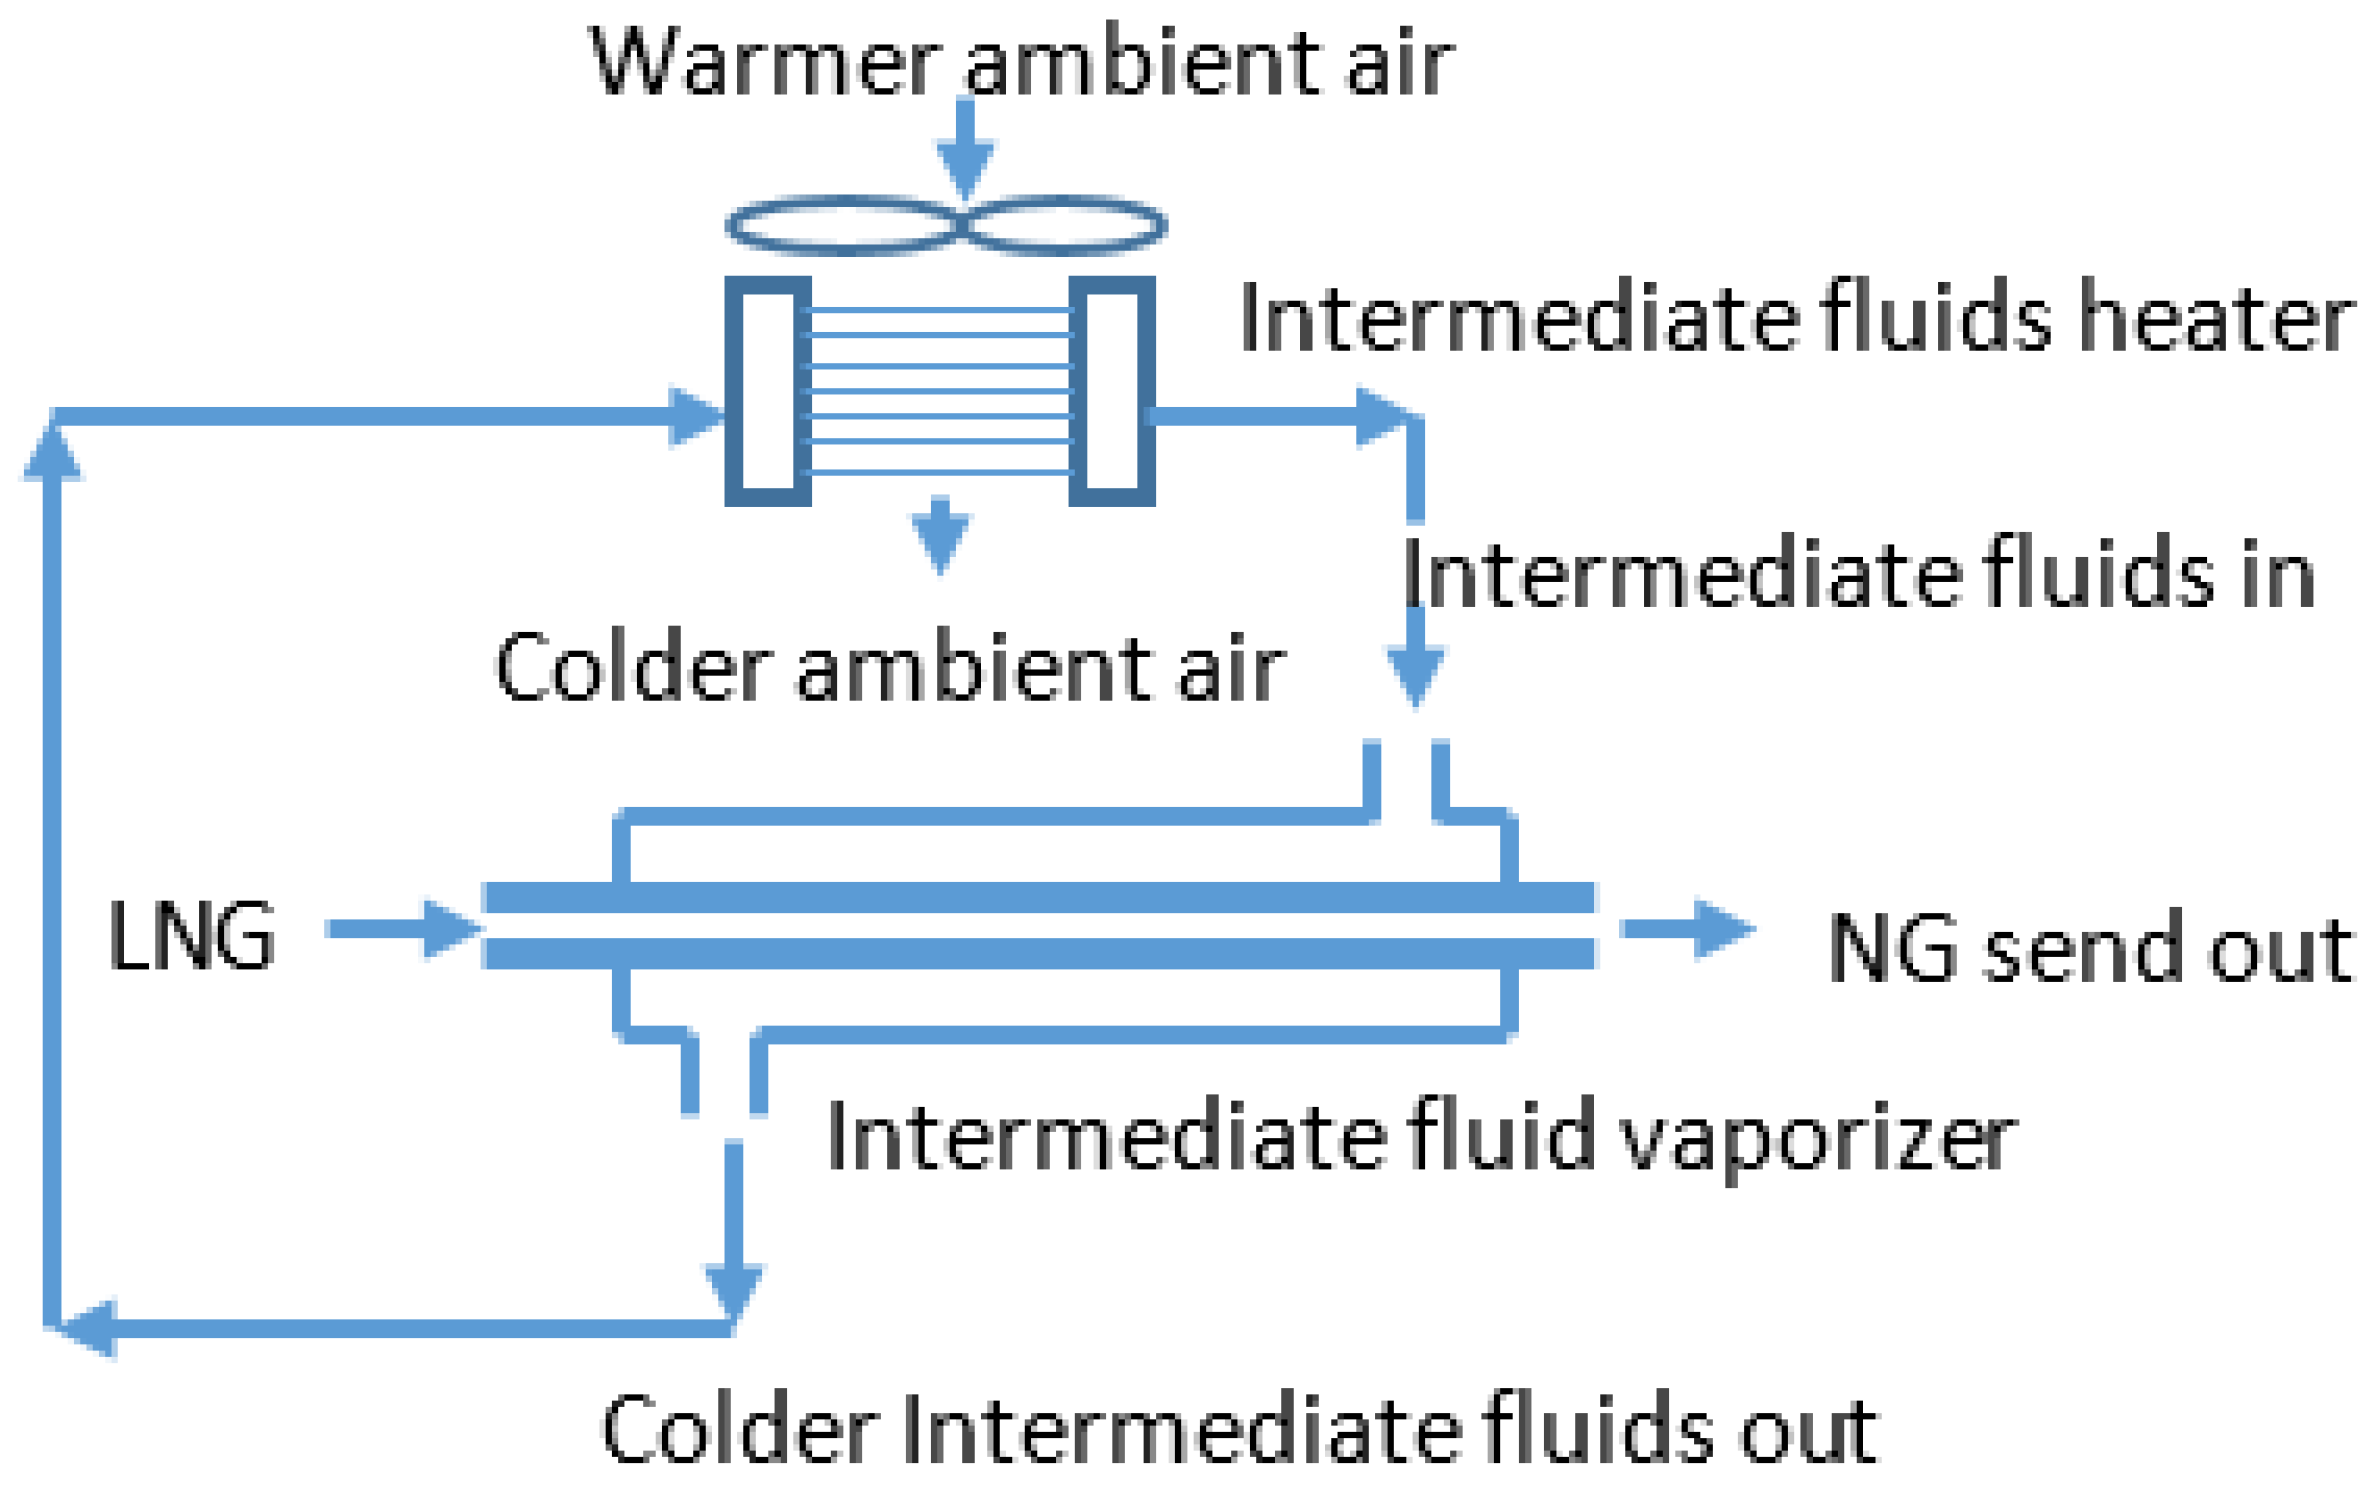
The primary receiving terminal at Dahej in India uses an IFV. The heat source for the vaporizer uses air instead of seawater. This system makes use of aqueous glycol solution, which is once cooled by heat exchange with LNG. The aqueous glycol solution is heated up by air blown by fans which is in turn reused for the exchange of heat with LNG (see
Figure 7).
For safety considerations, the use of non-combustible and non-toxic water/glycol mixtures in IFV systems are preferable. The use of combustion systems to heat the intermediate fluid can result in environmental impacts through associated exhaust emissions and carbon footprint; this can, however, be overcome by implementation of waste heat recovery [
13].
3.5. Floating Storage and Regasification Units
In recent times, a new technology option known as a floating storage and regasification unit (FSRU) has come into being. FSRUs emerged as an attractive option because the project execution time is substantially reduced due to the conversion of ships as floating storage units and consequently the capital costs are usually lower. The floating solution in many cases offers greater flexibility when there are space constraints onshore. However, there also limitations in terms of both storage capacity and send-out rates. Typically, a land-based terminal requires up to five years from concept to commission stage, while FSRUs can be conceptualized and commissioned within a period of ~12–24 months. The FSRUs are mostly based on seawater options, i.e., ORVs or shell and tube vaporization; therefore, from the LNG regasification perspective, the technology is not different; the only difference being land-based or an offshore-based vaporizer.
3.6. LNG Cold Energy Recovery during Regasification
Part of the energy consumed during the LNG liquefaction process can be recovered during the LNG regasification process. Around ~830 kJ/kg is stored in LNG, which is known as cold energy. This is in addition to the chemical energy of the natural gas and stored as the physical energy [
3].
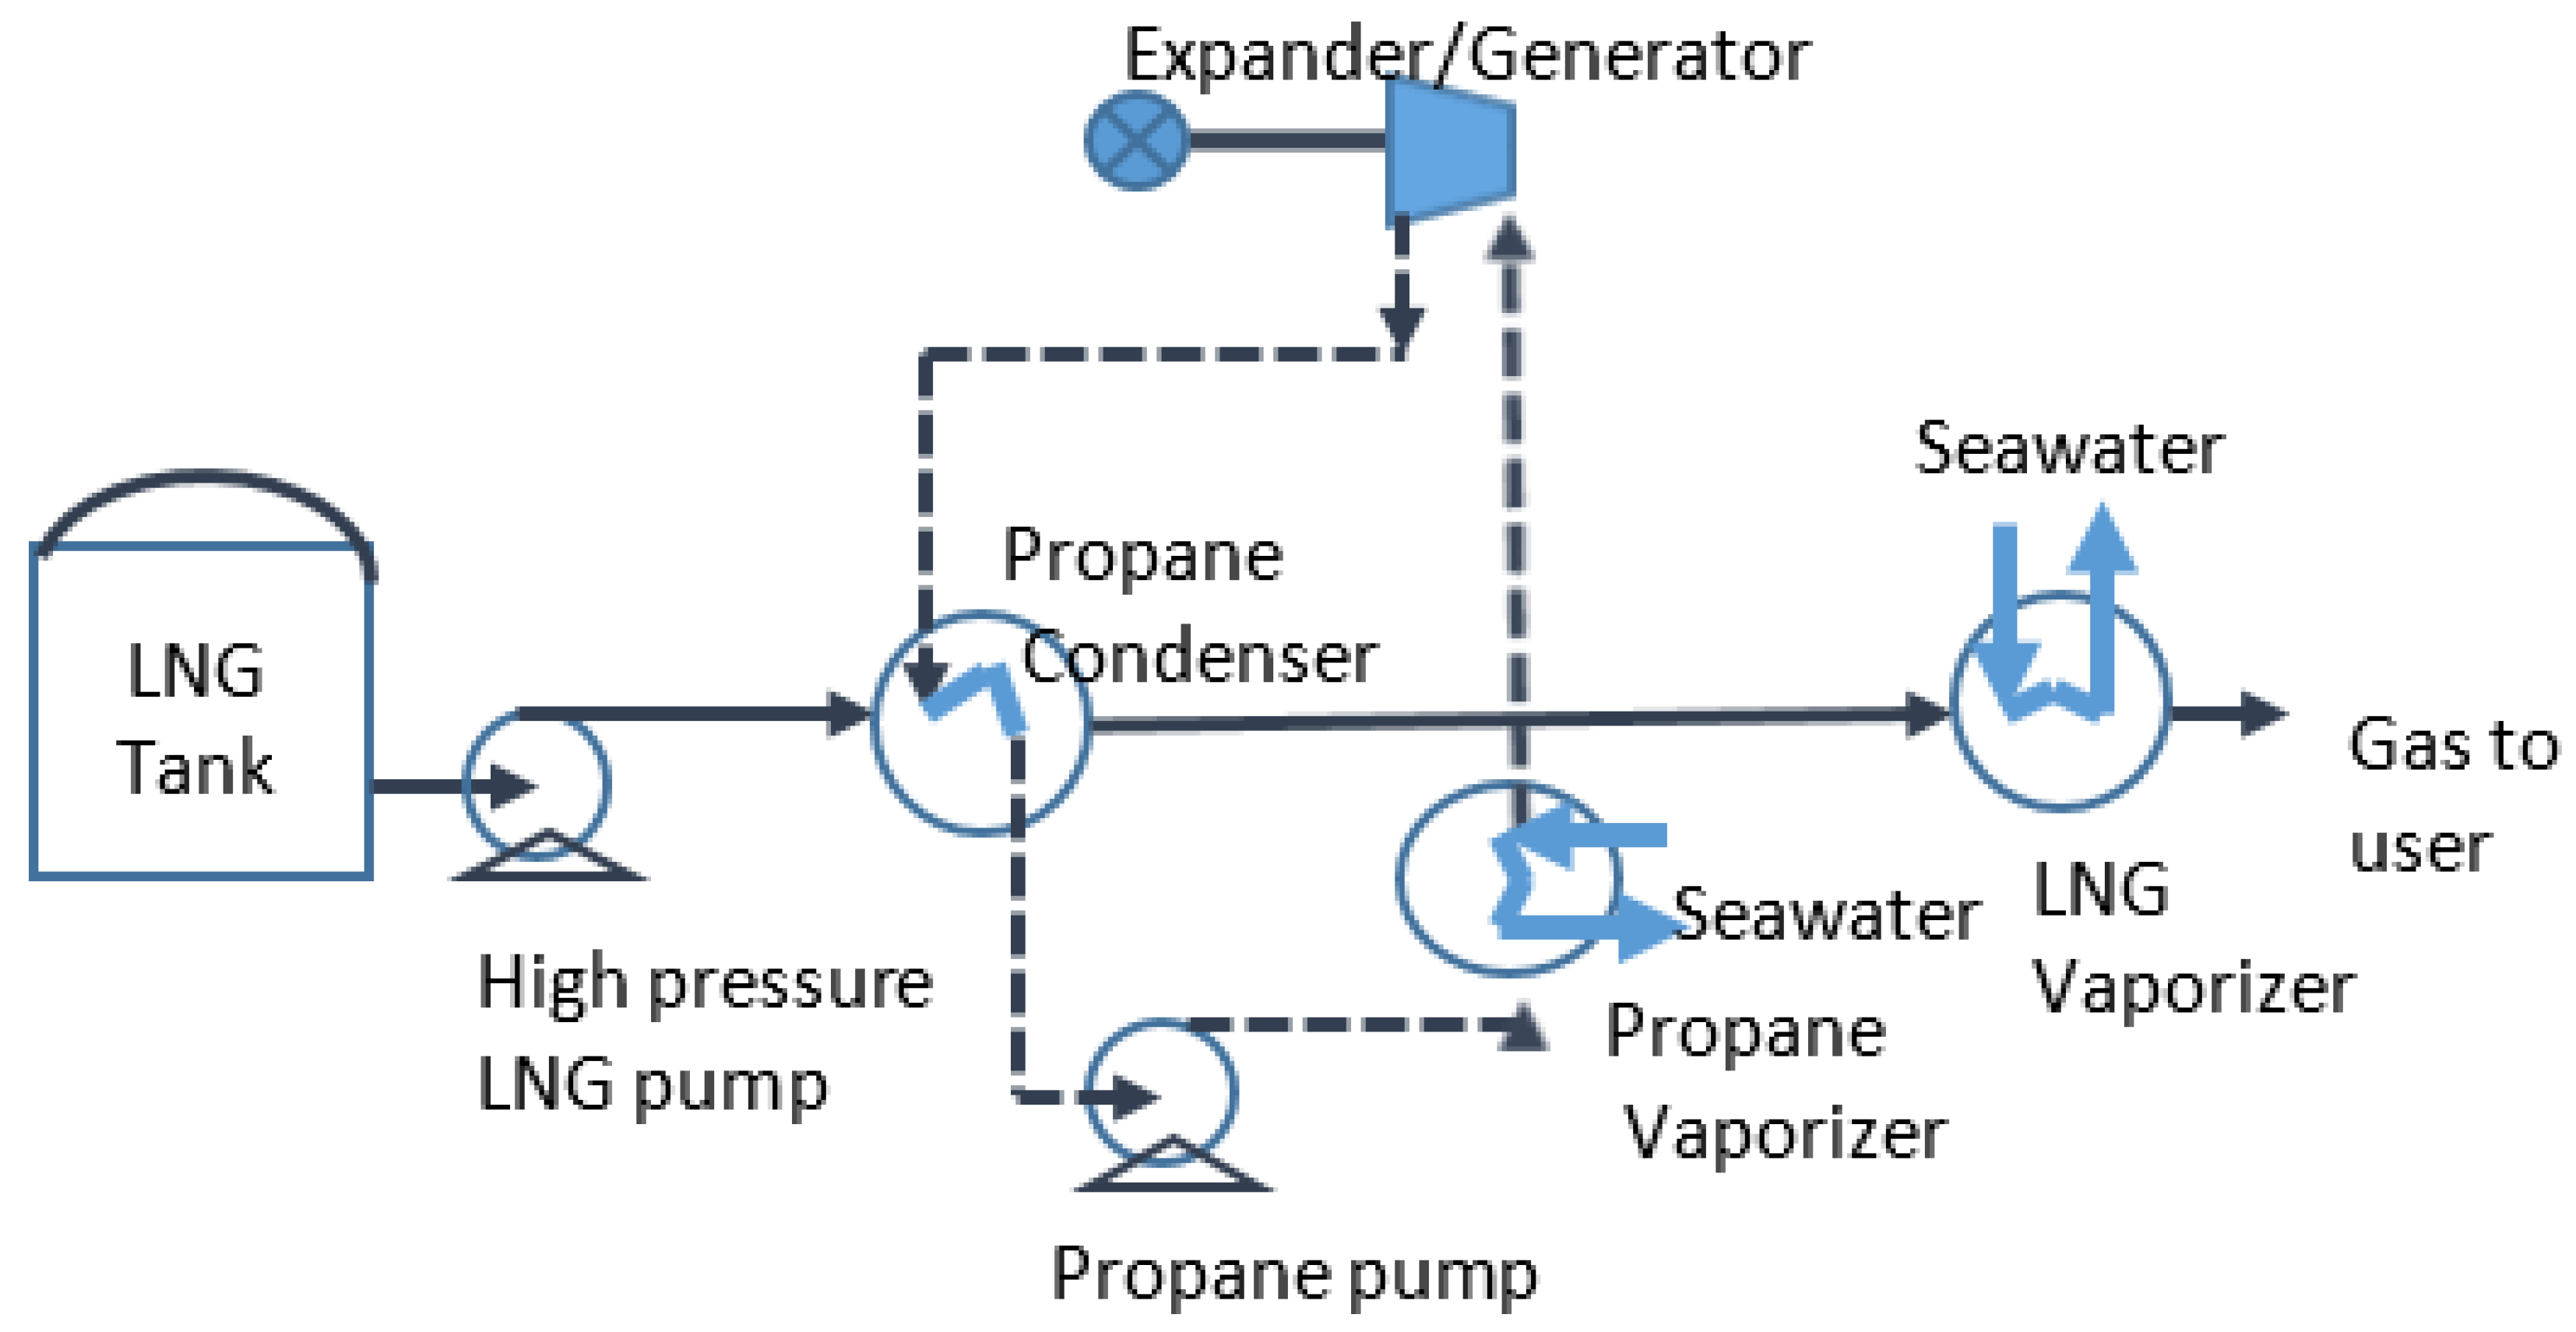
For a typical 5 Mtpa LNG terminal, ~120 MW “cold energy” could be available at maximum rates. However, the terminal data suggest that only a few locations employ cold energy recovery technologies. The primary reason is that the current technologies enable only low recovery efficiencies for cold energy. The cold energy technologies currently in use are Rankine cycle cold power generation, inlet air chilling for gas turbines, air separation or other low-temperature fractionation (liquid nitrogen, liquid air and so on), cold storage, cryogenic crushing and seawater desalination (
Figure 8-LNG cold power generation).
It was also observed that siting an LNG terminal next to an existing refinery/petrochemical complex could provide an option to regasify LNG efficiently and effectively. The refinery/petrochemical complex can utilize the cold energy and, in the process, vaporize LNG. However, this potential is location dependent.
3.7. Hybrid Options
In recent times, some hybrid options are being developed and tested/experimented. The Korea gas corporation (KOGAS) has been undergoing difficulties in the construction of ORVs due to environmental issues such as cold seawater effluent and residual chemical contents. Therefore, KOGAS is currently testing eco-friendly vaporizers that are innovative, i.e., that do not use seawater. The AAV is a strong candidate for a clean environment. Thus, this work was to investigate its possibility in temperate regions for LNG import terminals in Korea [
7].
The KOGAS installation can be considered as a “hybrid” option where the seawater is being used as the base load technology while secondary regasification is achieved using ambient air heat.
3.8. Observations on Technology Options
The conventional technology options primarily use ambient air, seawater or the combustion heat for LNG regasification processes. It is evident that some installations use/intend to use intermediate fluids such as glycol and/or propane for the heat exchange process in conjunction with ambient air or the seawater.
It is observed that more than 95% of the LNG regasification terminals employ ORVs/sea water as the primary vaporization technology irrespective of the climatic differences around the globe. Submerged combustion vaporization is used as a secondary means during the colder weather periods in most of the sites, globally.
However, that effort has been made at developing hybrid models in recent times (e.g., seawater and ambient air). The hybrid design efforts appear to be driven by environmental considerations, i.e., impact on marine life due to cold seawater and so on.
From the preceding discussion, it can also be observed that location factors such as the ambient air and the seawater temperatures, humidity, and so on, may have a significant impact on the regasification efficiency and life-cycle performance. However, this can only be validated by analysing the location factors and corresponding technology choices using thermodynamic modelling. The purpose of this paper is to discuss the location factors data and their potential impact on technology choices.
So far, it is evident that the majority of LNG regasification terminals employ seawater vaporization supplemented with submerged combustion vaporizers for peak shaving. It is also observed that LNG cold energy utilization, in most cases, is by way of producing liquid nitrogen or liquid air. Using the LNG cold energy to produce liquid nitrogen or air results in ~50% savings in electricity [
2].
4. Location Factors by Different Regions
Based on the current LNG import quantities (
Figure 1), the countries and regions selected are Japan, China, Korea, India, Europe, South America and other Asian countries. The following data were collected and plotted as scatter charts [
16,
17] and presented in
Table 2. A total of 82 locations were selected to represent the key regions, worldwide.
Maximum and minimum seawater temperatures
Maximum and minimum ambient air temperatures
Maximum and minimum relative humidity
Maximum and minimum wind speeds
Climate change impact
The median, mode, mean and the standard deviation for these parameters were calculated using the data from 82 locations around the world; see
Table 2. A brief on climate change impact is added in
Section 4.5; however, a detailed study on this topic is outside the scope of this paper.
4.1. Maximum and Minimum Seawater Temperatures
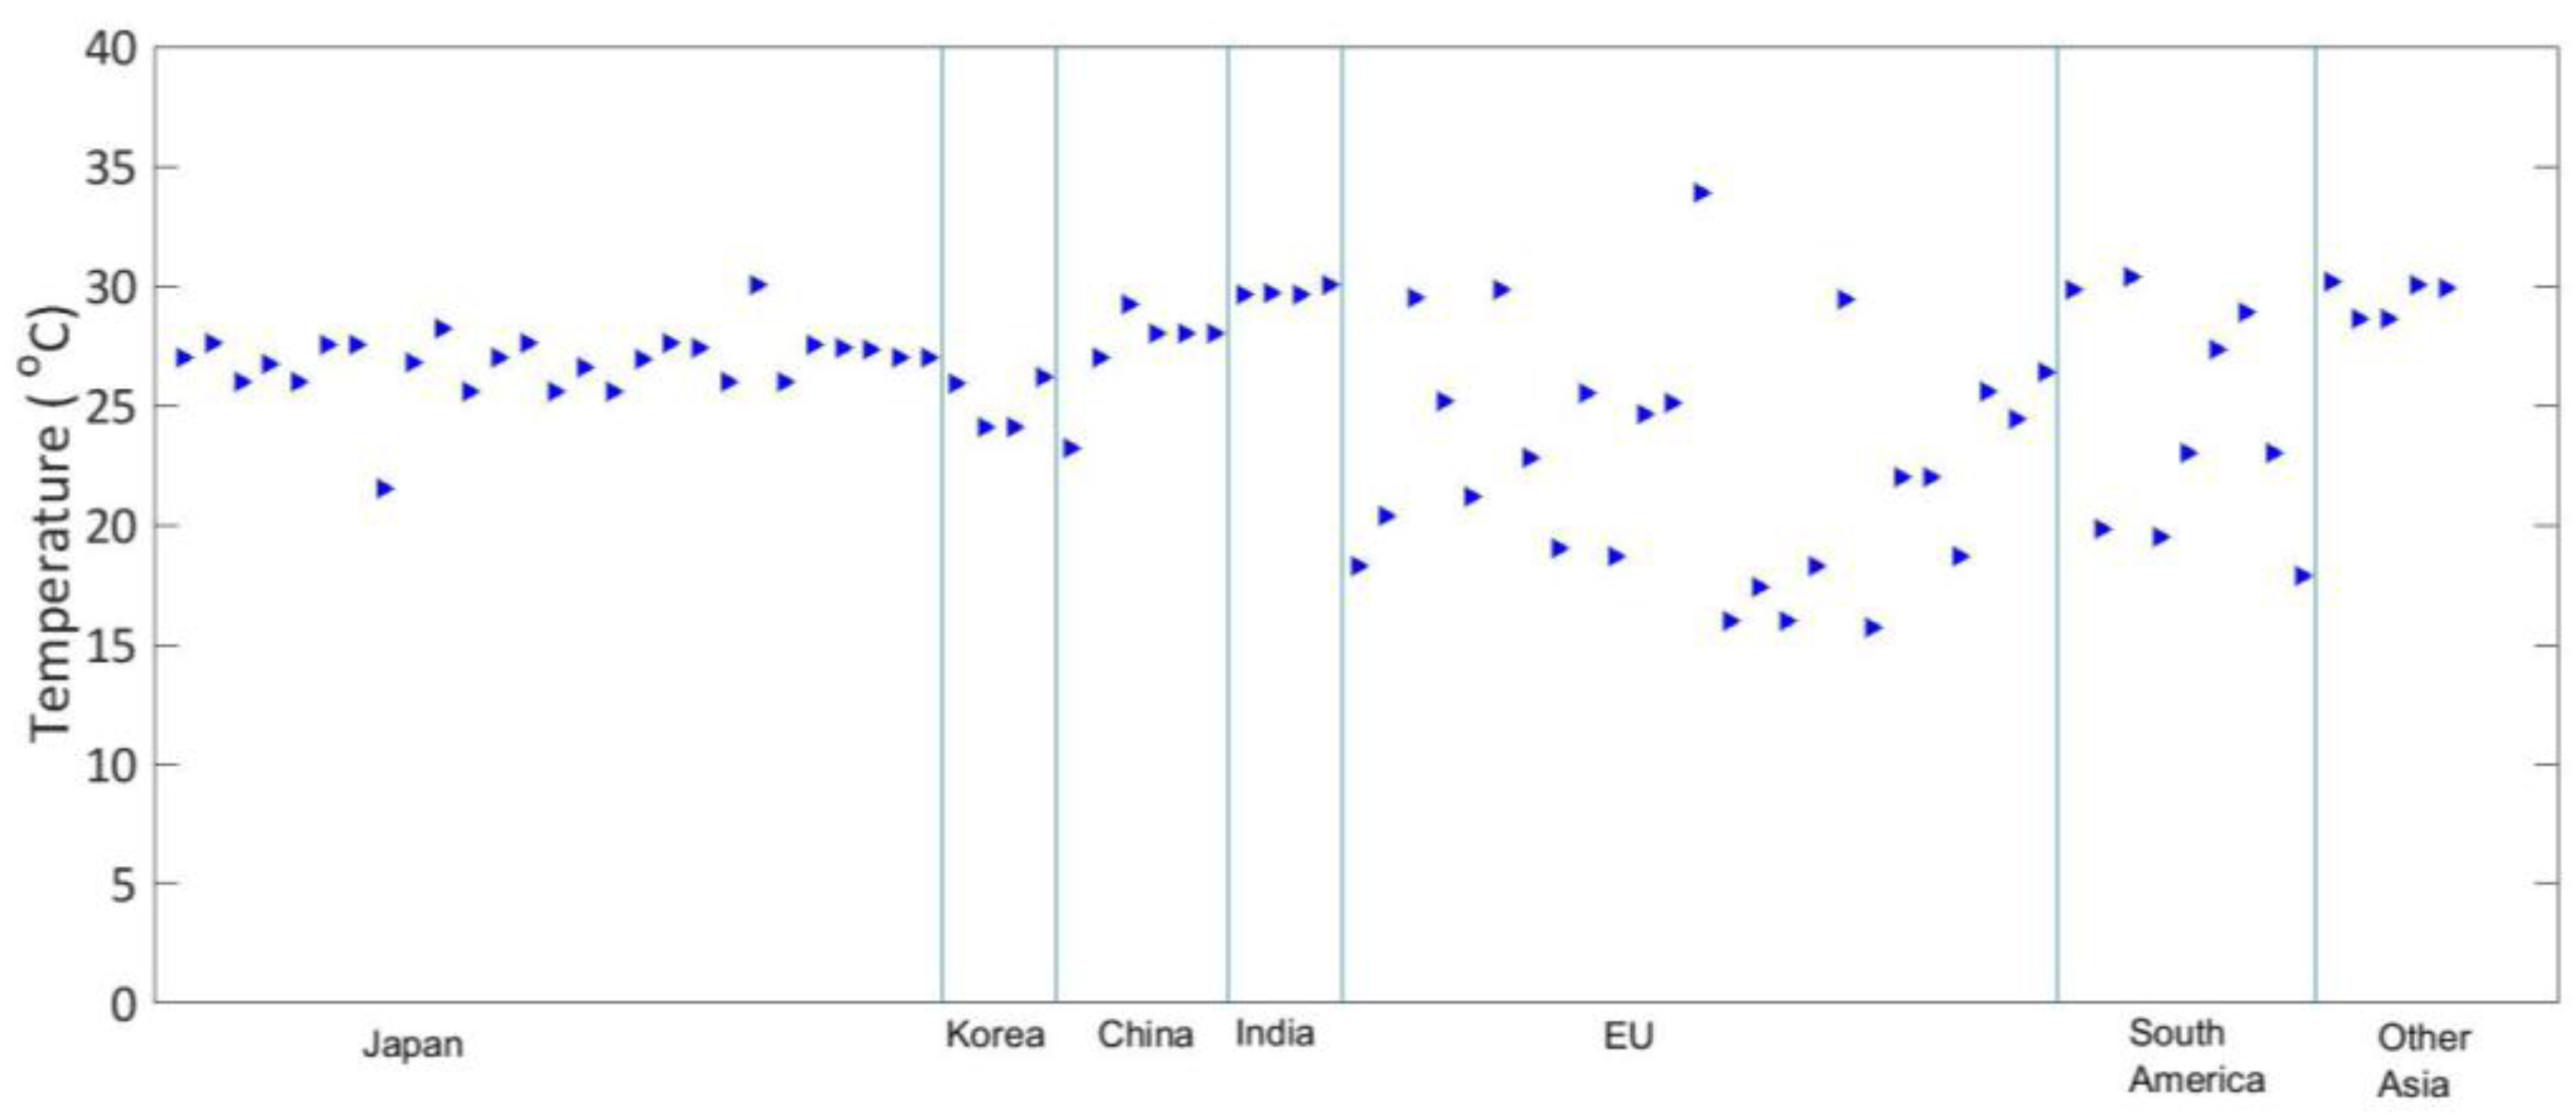
The maximum seawater temperatures are between 21.5 °C and 29.1 °C. It is evident that European and the South American regions have a relatively higher standard deviation (SD) compared to the rest of the world (
Table 1). The difference is usually attributed to the longitude and latitude.
The maximum seawater temperatures are consistent across the globe with some exceptions in the EU and South America (see
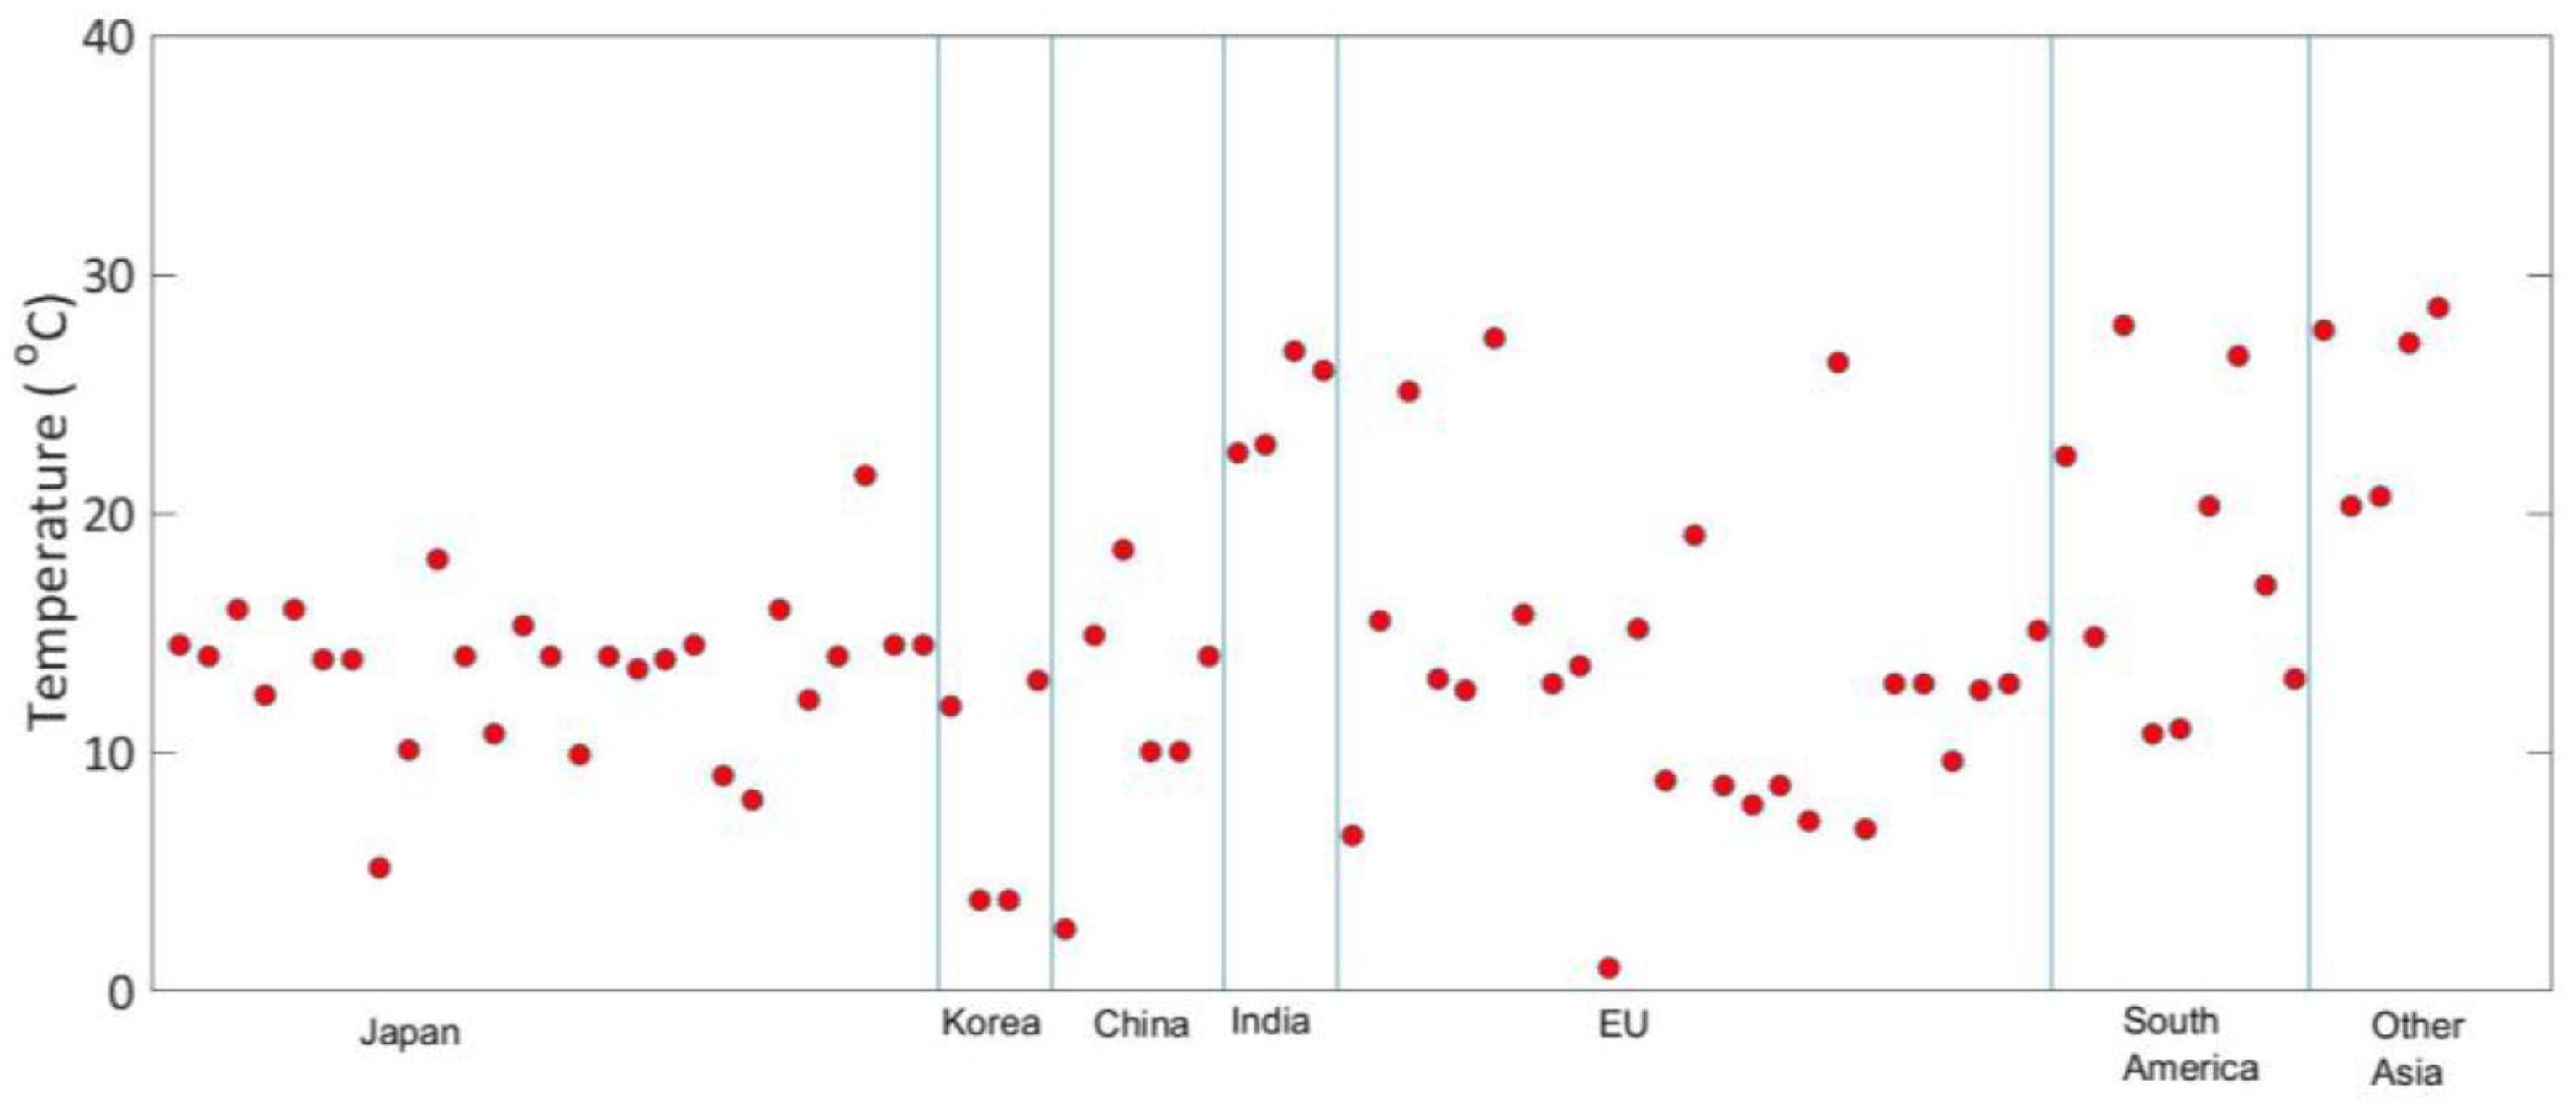
Figure 9). The minimum sea water temperatures do vary significantly, but only a couple of locations experiences lower than 5 °C, i.e., Japan, Korea and the EU (see
Figure 10).
The minimum seawater temperatures are between 8.1 °C and 24.1 °C, and the standard deviation is relatively high in South America, China and the EU (
Table 1). It is also evident that only four locations experience temperatures less than 5 °C during the year; two in Korea, one in China and one in the EU (see
Figure 10). The lower temperatures (less than 5 °C) in these four locations are experienced for less than a duration of 10% of a year [
17]. A typical design criterion for ORVs is a minimum seawater temperature of 5 °C; therefore, the majority of locations are suited to ORVs as a feasible technology option.
It is observed that the seawater temperature ranges, across the globe, are adequate for LNG regasification subject to other constraints like seawater quality, and so on.
It is expected that lower seawater temperatures (less than 10 °C) may affect LNG regasification rates for a fraction of the year, particularly during extended winter periods. The data indicate that some of the affected locations are in Japan, Korea, China and Europe (except some warmer regions in Southern Europe;
Figure 10). For this reason, the terminal operators opt for an alternative regasification process such as combustion vaporization to cover the extended winter periods. The technology option for peak shaving is SCVs for the majority of locations. It is worth noting that only a few locations (two locations in Korea, one in Sweden and one in China) experience lower than 5 °C seawater temperatures for a part of the year, i.e., ~20% of the time annually.
It has been observed that numerous design innovations in ORVs over the last three decades have resulted in higher heat transfer and a significant reduction in ice formation on tube external surfaces. These are generally known as super ORVs or high-performance ORV; also known as Hi Per V [
6].
The Super ORV was developed as an advanced design ORV to achieve higher thermal efficiency by way of application of advanced materials and achieving higher heat transfer area through design.
The seawater temperature may affect the fouling factor; therefore, the sea water quality and the temperature can impact ORV performance.
4.2. Maximum and Minimum Ambient Air Temperatures
(a) Direct Air Heating
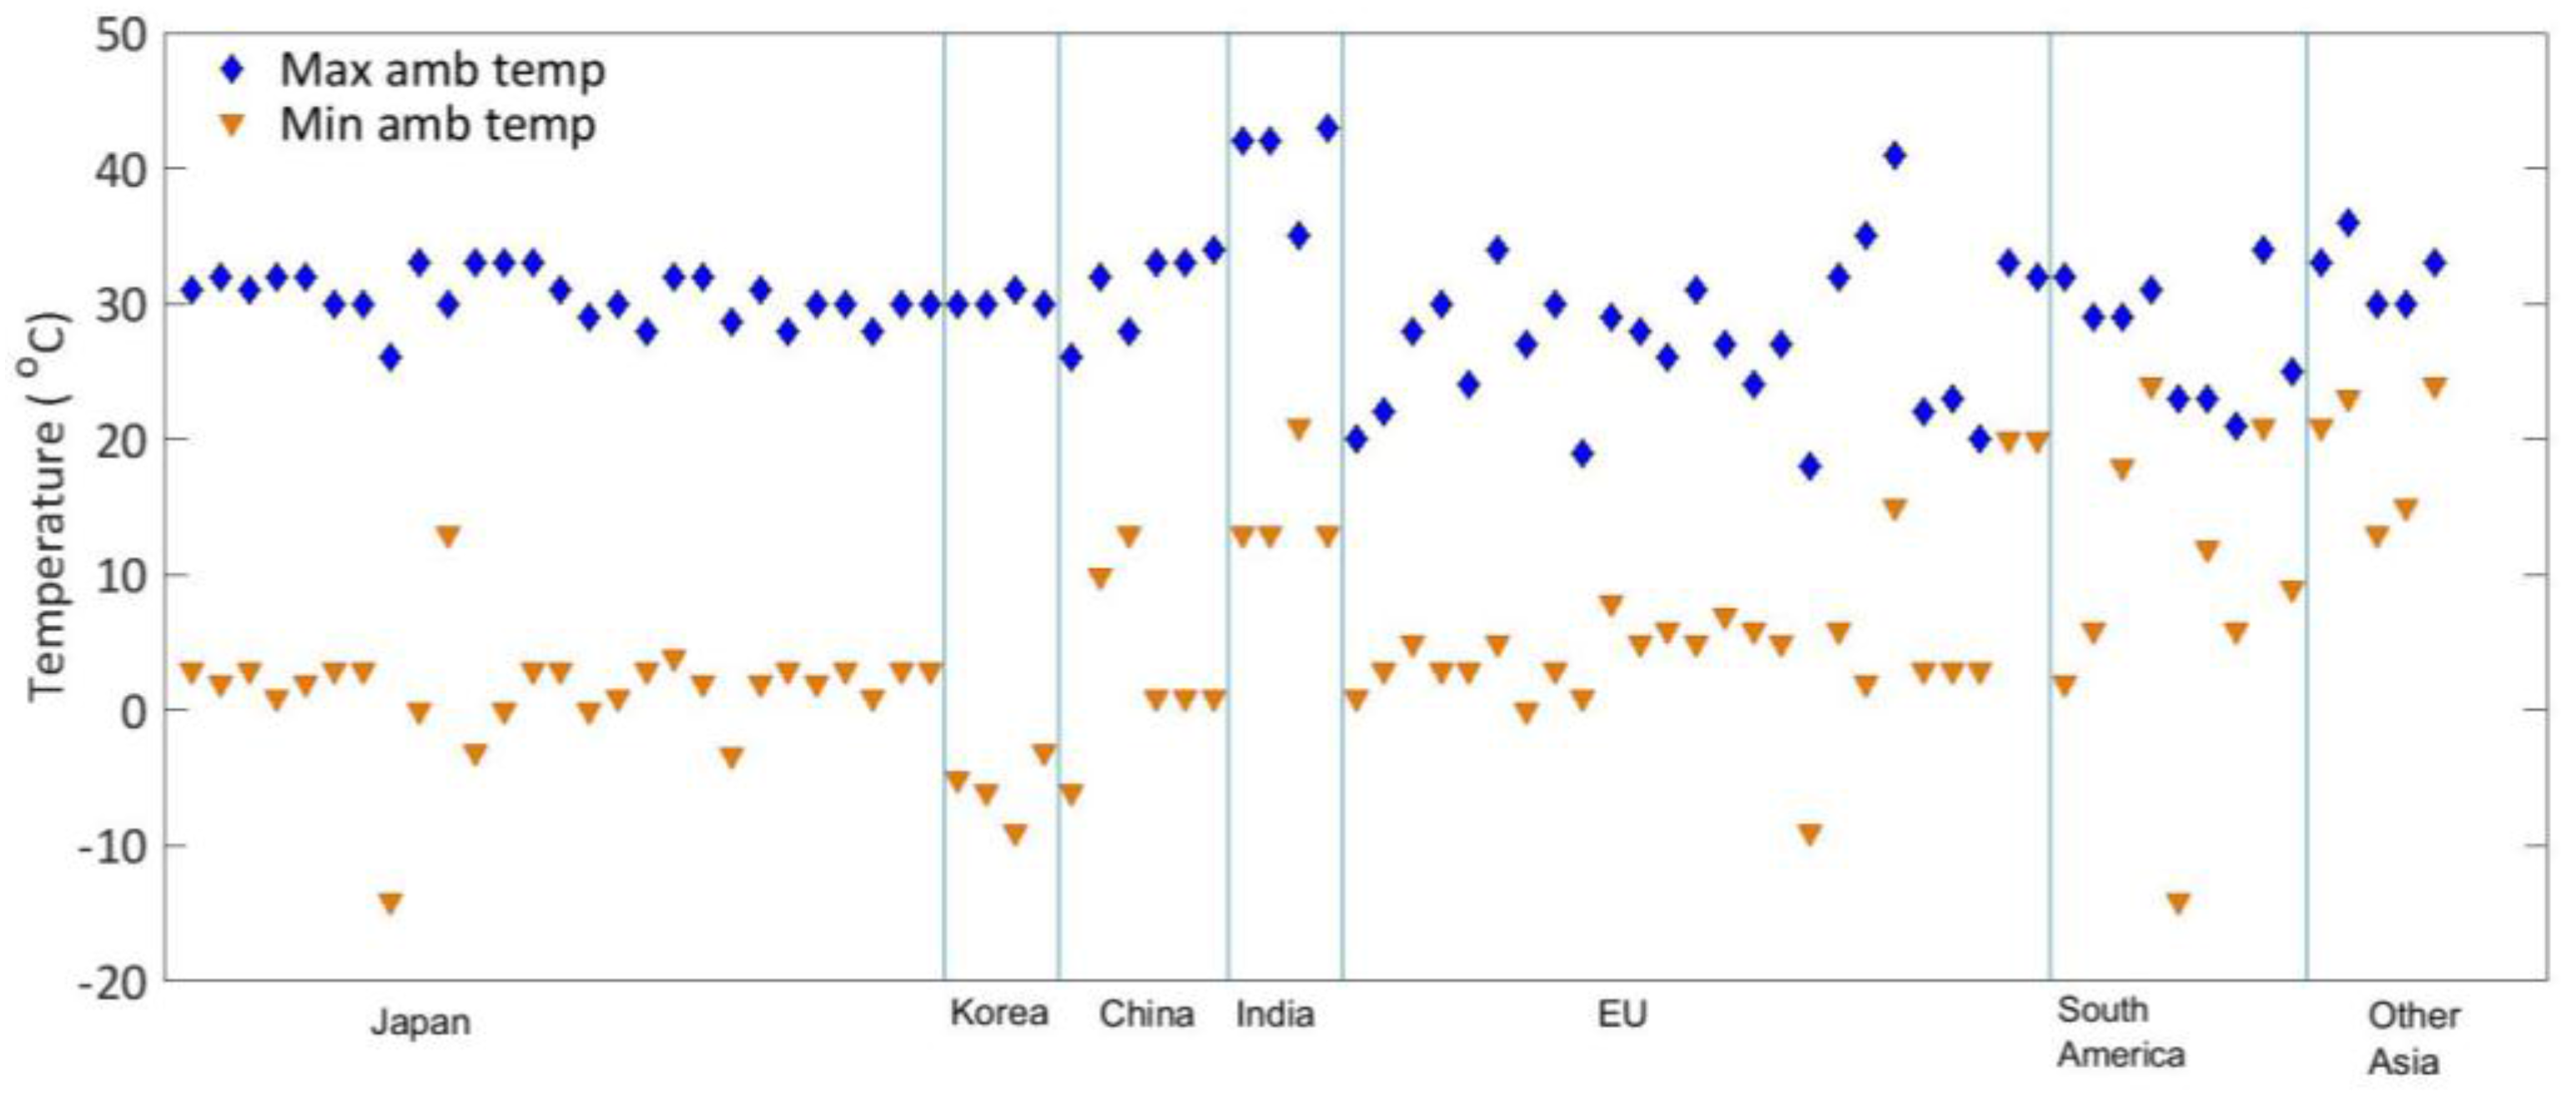
The ambient air temperatures indicate that air heating could be a viable technology option (see
Figure 11). However, the formation of frost on the vaporizer is a significant issue because it reduces the overall heat transfer coefficient. The LNG is vaporized directly against the air (direct heat system), and the water vapour in the air condenses and freezes. From the temperature data, it can be observed that there is a large and consistent gap between the minimum and the maximum ambient air temperatures; therefore, the regasification rates are expected to vary significantly during the year and on a daily basis during the night and day conditions. The maximum ambient air temperatures range between 25 and 42 °C, which has a positive impact on the LNG regasification rates, but at the same time, higher humidity causes frost build up and reduced heat transfer. Therefore, the AAV technology evaluation must address a relationship between the percentages of the relative humidity, LNG flow rates and the frost build up.
However, the maximum ambient air data (see
Figure 11) do indicate that an appreciable amount of heat is available across the globe. Only five locations show ambient air temperatures falling below −5 °C; one in Sweden, one in Japan, one in China and two in Korea. The low ambient air temperatures of up to −10 °C could still be used to regasify LNG (−161 °C), but the LNG flowrates may need to be reduced. Furthermore, the duration of the low temperatures will impact the total cost and climate impact of regasification, i.e., the low temperature durations in Sweden (one location) and Japan (one location) are relatively high. In the cooler and drier winter months, the efficiency of this technology can be reduced, affecting the rate of regasification. More vaporizers units are required for operation in cooler months to compensate for the lack of efficiency.
The use of ambient air heat will eliminate and/or minimize the natural gas consumption being used in the submerged combustion vaporizers and eliminate and/or minimize the flue gases and environmental emissions.
The locations with consistently high ambient temperatures are South America, India, Spain and other Asian countries. However, the lower ambient air temperatures combined with lower relative humidity will impact the regasification rates. The highest ambient air temperatures are in India (see
Figure 11).
(b) Intermediate Fluid Vaporizers (air as the heat source)
As discussed earlier, intermediate fluid vaporizers (IFV) revaporise LNG by the use of intermediate heat transfer fluid. IFV technology configurations normally operate in a closed-loop, open-loop or a combination system. The most common intermediate fluids are propane, refrigerant or water/glycol mixtures, based on existing IFV technology, which employs air instead of seawater for its heat source and an intermediate fluid to exchange heat with LNG.
The air-IFV technology evaluation needs to focus on utilization of “free” ambient air heat for different intermediate fluids; the most commonly used being the glycol/water mixture. Any fluid with an acceptable heat capacity, freezing and boiling point is a candidate intermediate fluid; however, it is desirable to use more environmentally-acceptable material. Tempered water or fresh water are available, but suitable intermediate fluids are more often selected from the glycol group used individually or as mixtures (such as ethylene glycol, diethylene glycol, triethylene glycol), methanol, propane, butane, ammonia or formate.
However, some of the other fluids under consideration are propylene, propane, isobutane, butane and dimethyl ether [
5].
In the cooler and drier winter months, the efficiency of this technology can be reduced, affecting the rate of regasification. More vaporizer units are required for operation in cooler months to compensate for the lack of efficiency.
4.3. Maximum and Minimum Relative Humidity
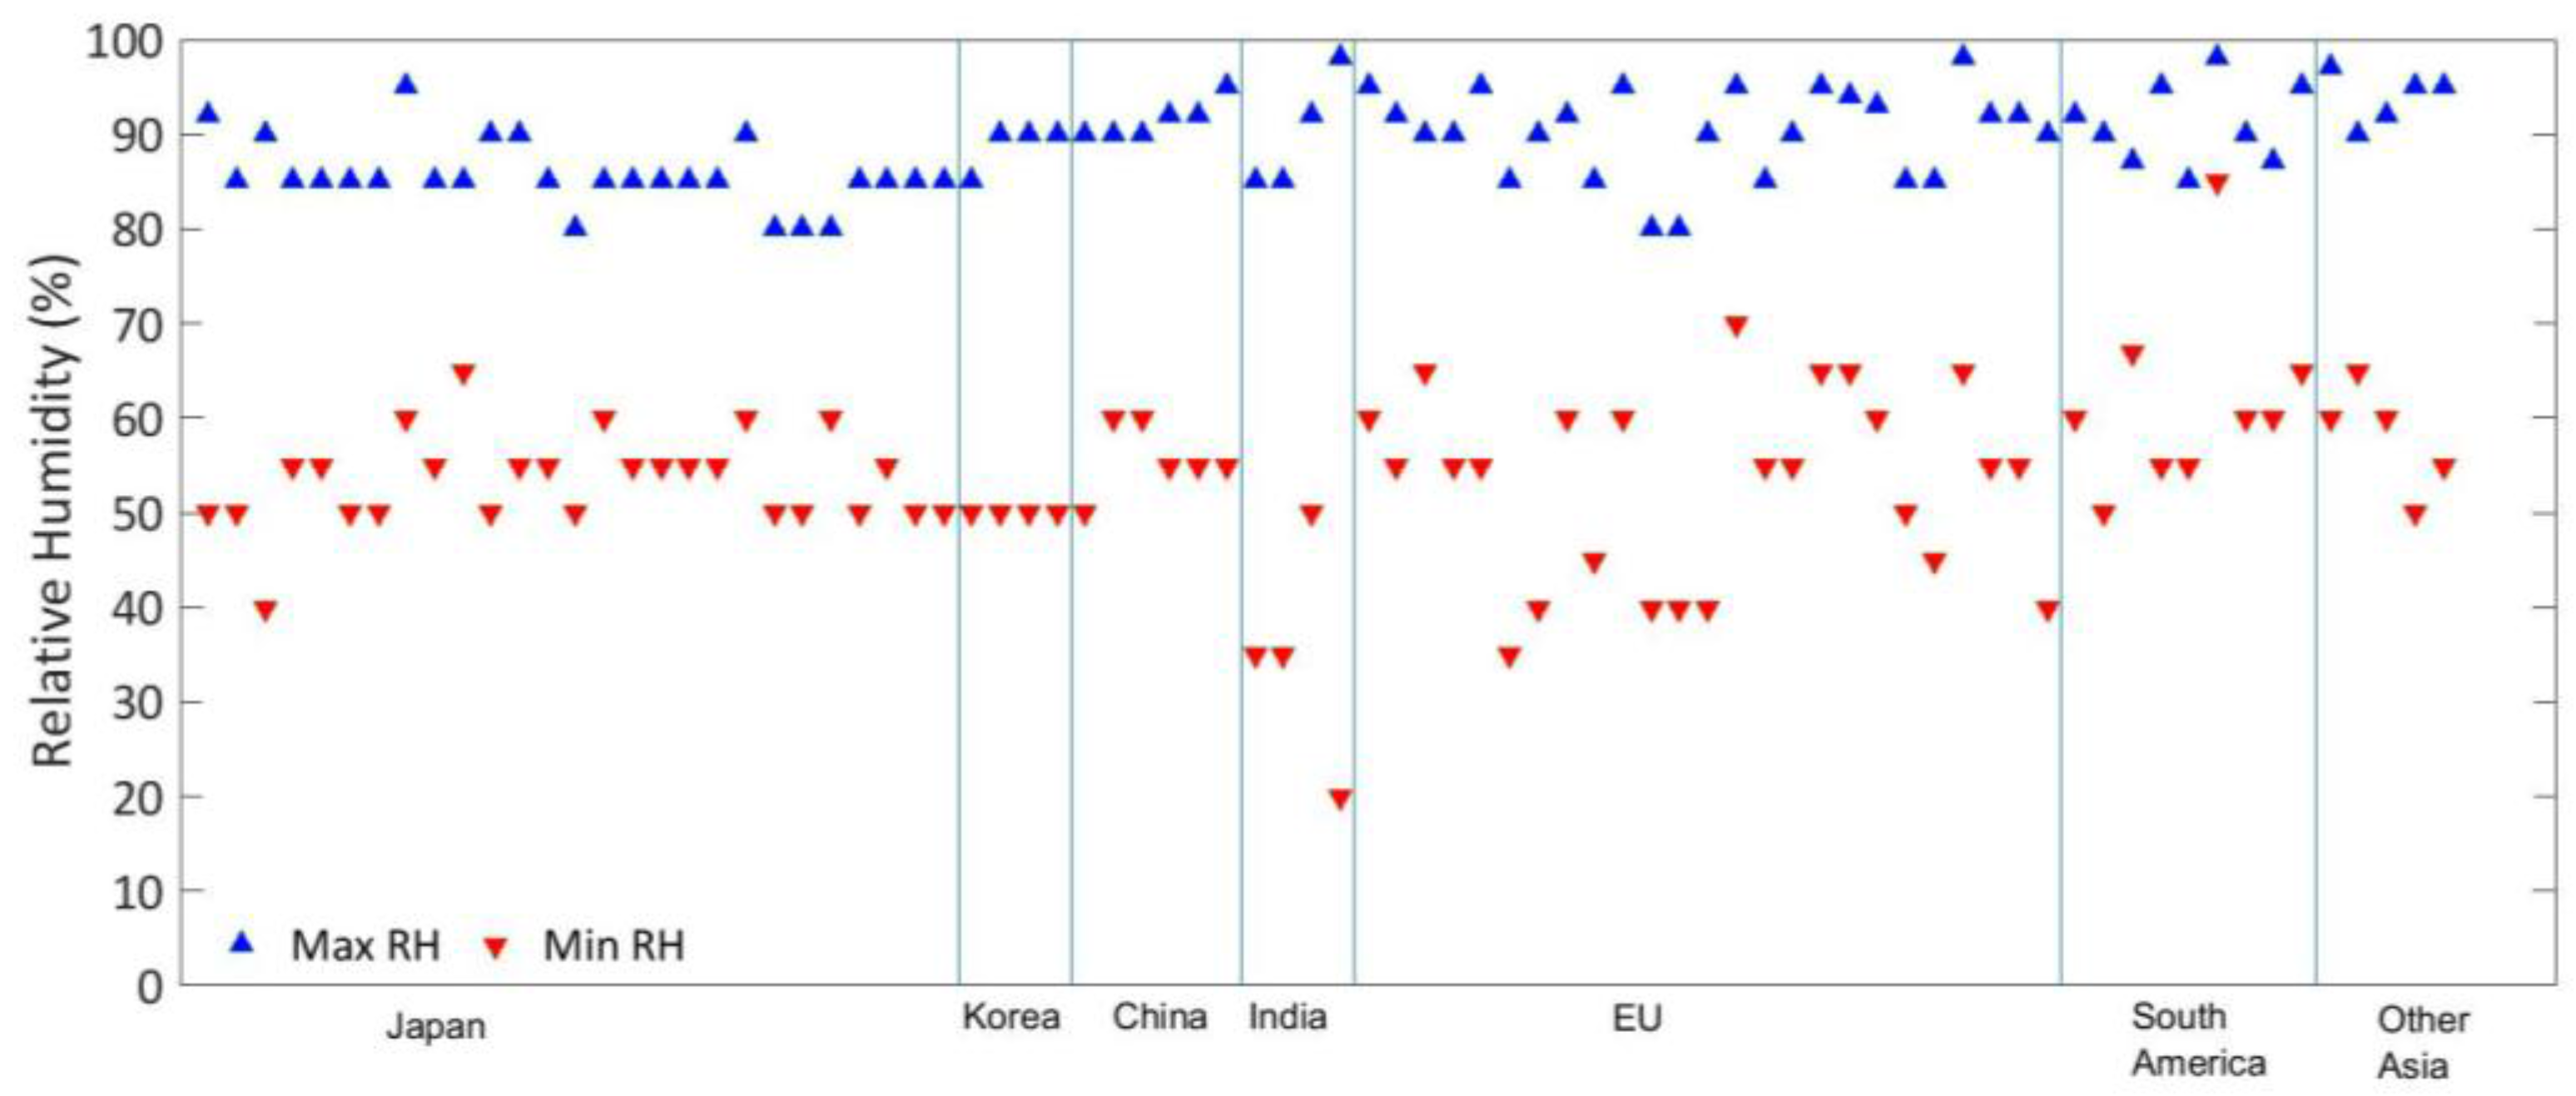
The data suggest that the average maximum and average minimum relative humidity are quite consistent and high. It is observed that average minimum relative humidity is higher in Japan when compared to Europe and China (
Figure 12). It was also observed that the maximum relative humidity, on average, is higher in South America and Europe as compared with China, Japan and India.
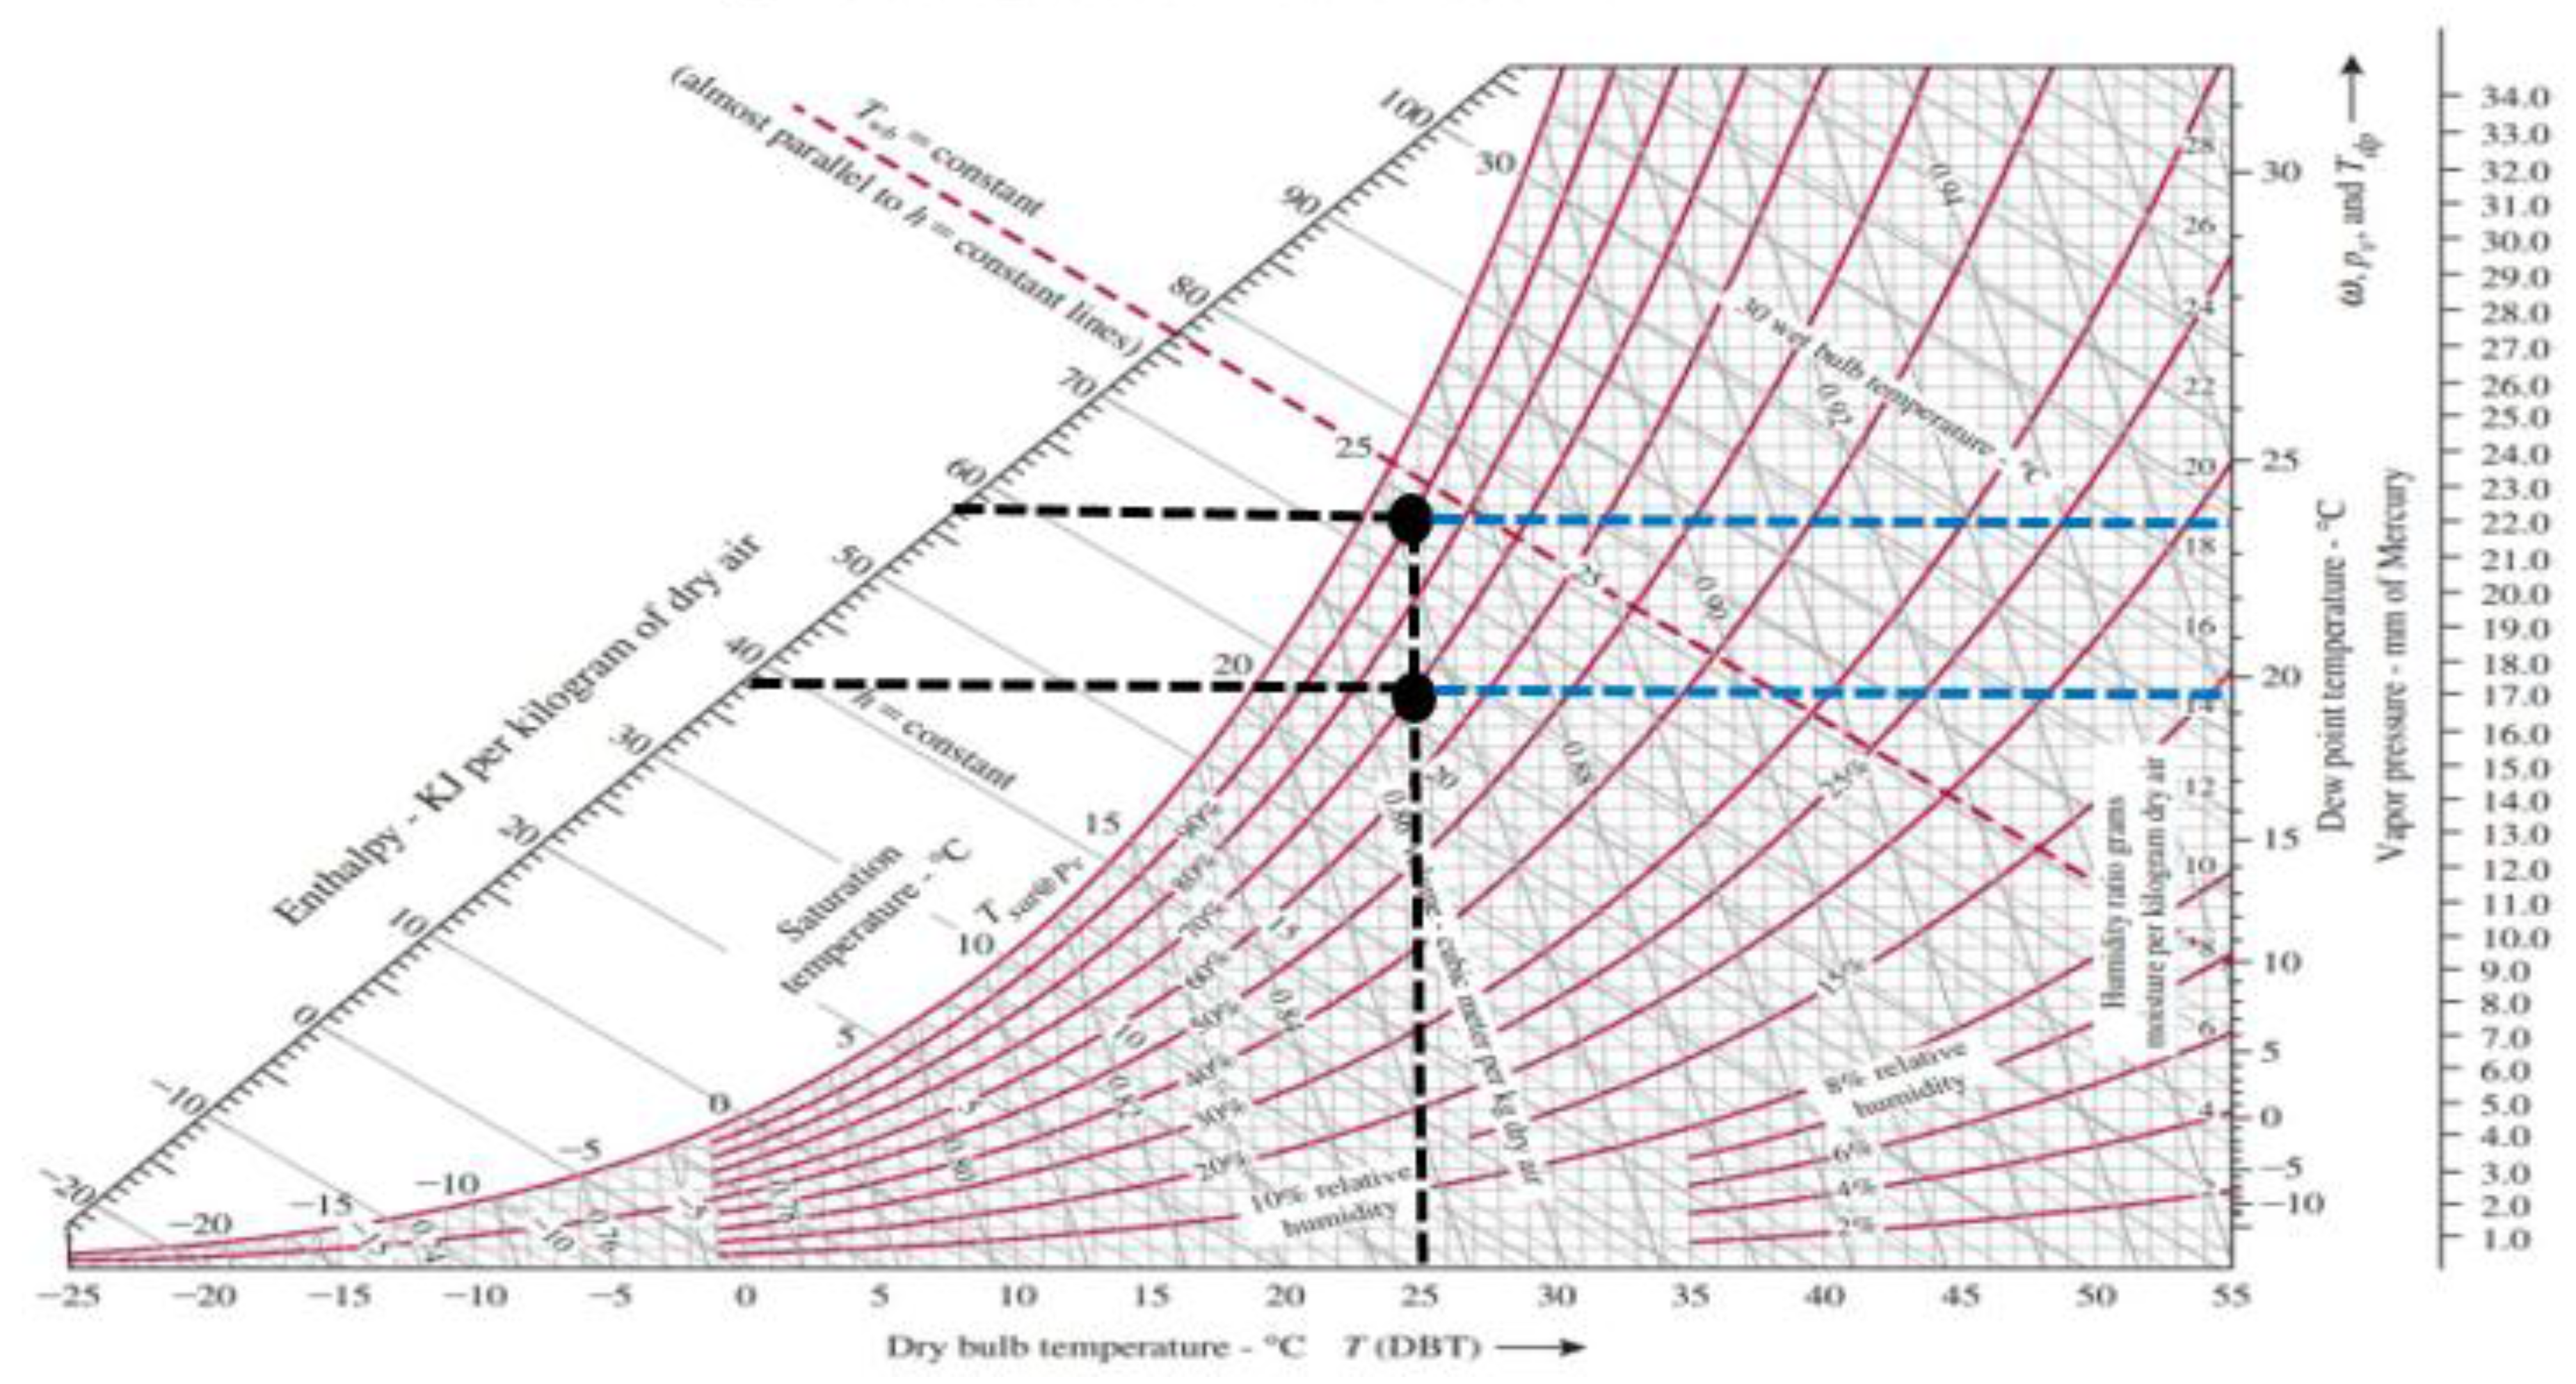
From the psychometric chart (
Figure 13), it can be seen that an increase in relative humidity results in an increase in enthalpy; however, if the temperature is too low or the convection of the air is too slow, then significant condensation can form on the tubes. As the condensation freezes, the effectiveness of the tubes will decrease and the production rate will also subsequently decrease.
Figure 13 shows the effects of increased humidity at 25 °C. The humidity increases from 70–90% results in a significant increase in the ambient air enthalpy i.e., from 38 to 58 kJ/kg. However, an increase in the dew point also increases the probability of condensation.
The maximum relative humidity is consistent across with some locations experiencing near 100%, which exist in India, the EU and South America. The minimum relative humidity varies significantly; some locations in India and the EU experiencing the lowest (see
Figure 12). In those locations, the regasification rates and/or the efficiency may be lower/suboptimal, during a significant duration of the year, if ambient air-based technologies are selected.
The ambient air temperature, humidity and ice formation are the factors that have the greatest effect on AAV performance. There are other factors that also affect the performance of these vaporizers including the wind and solar radiation [
19].
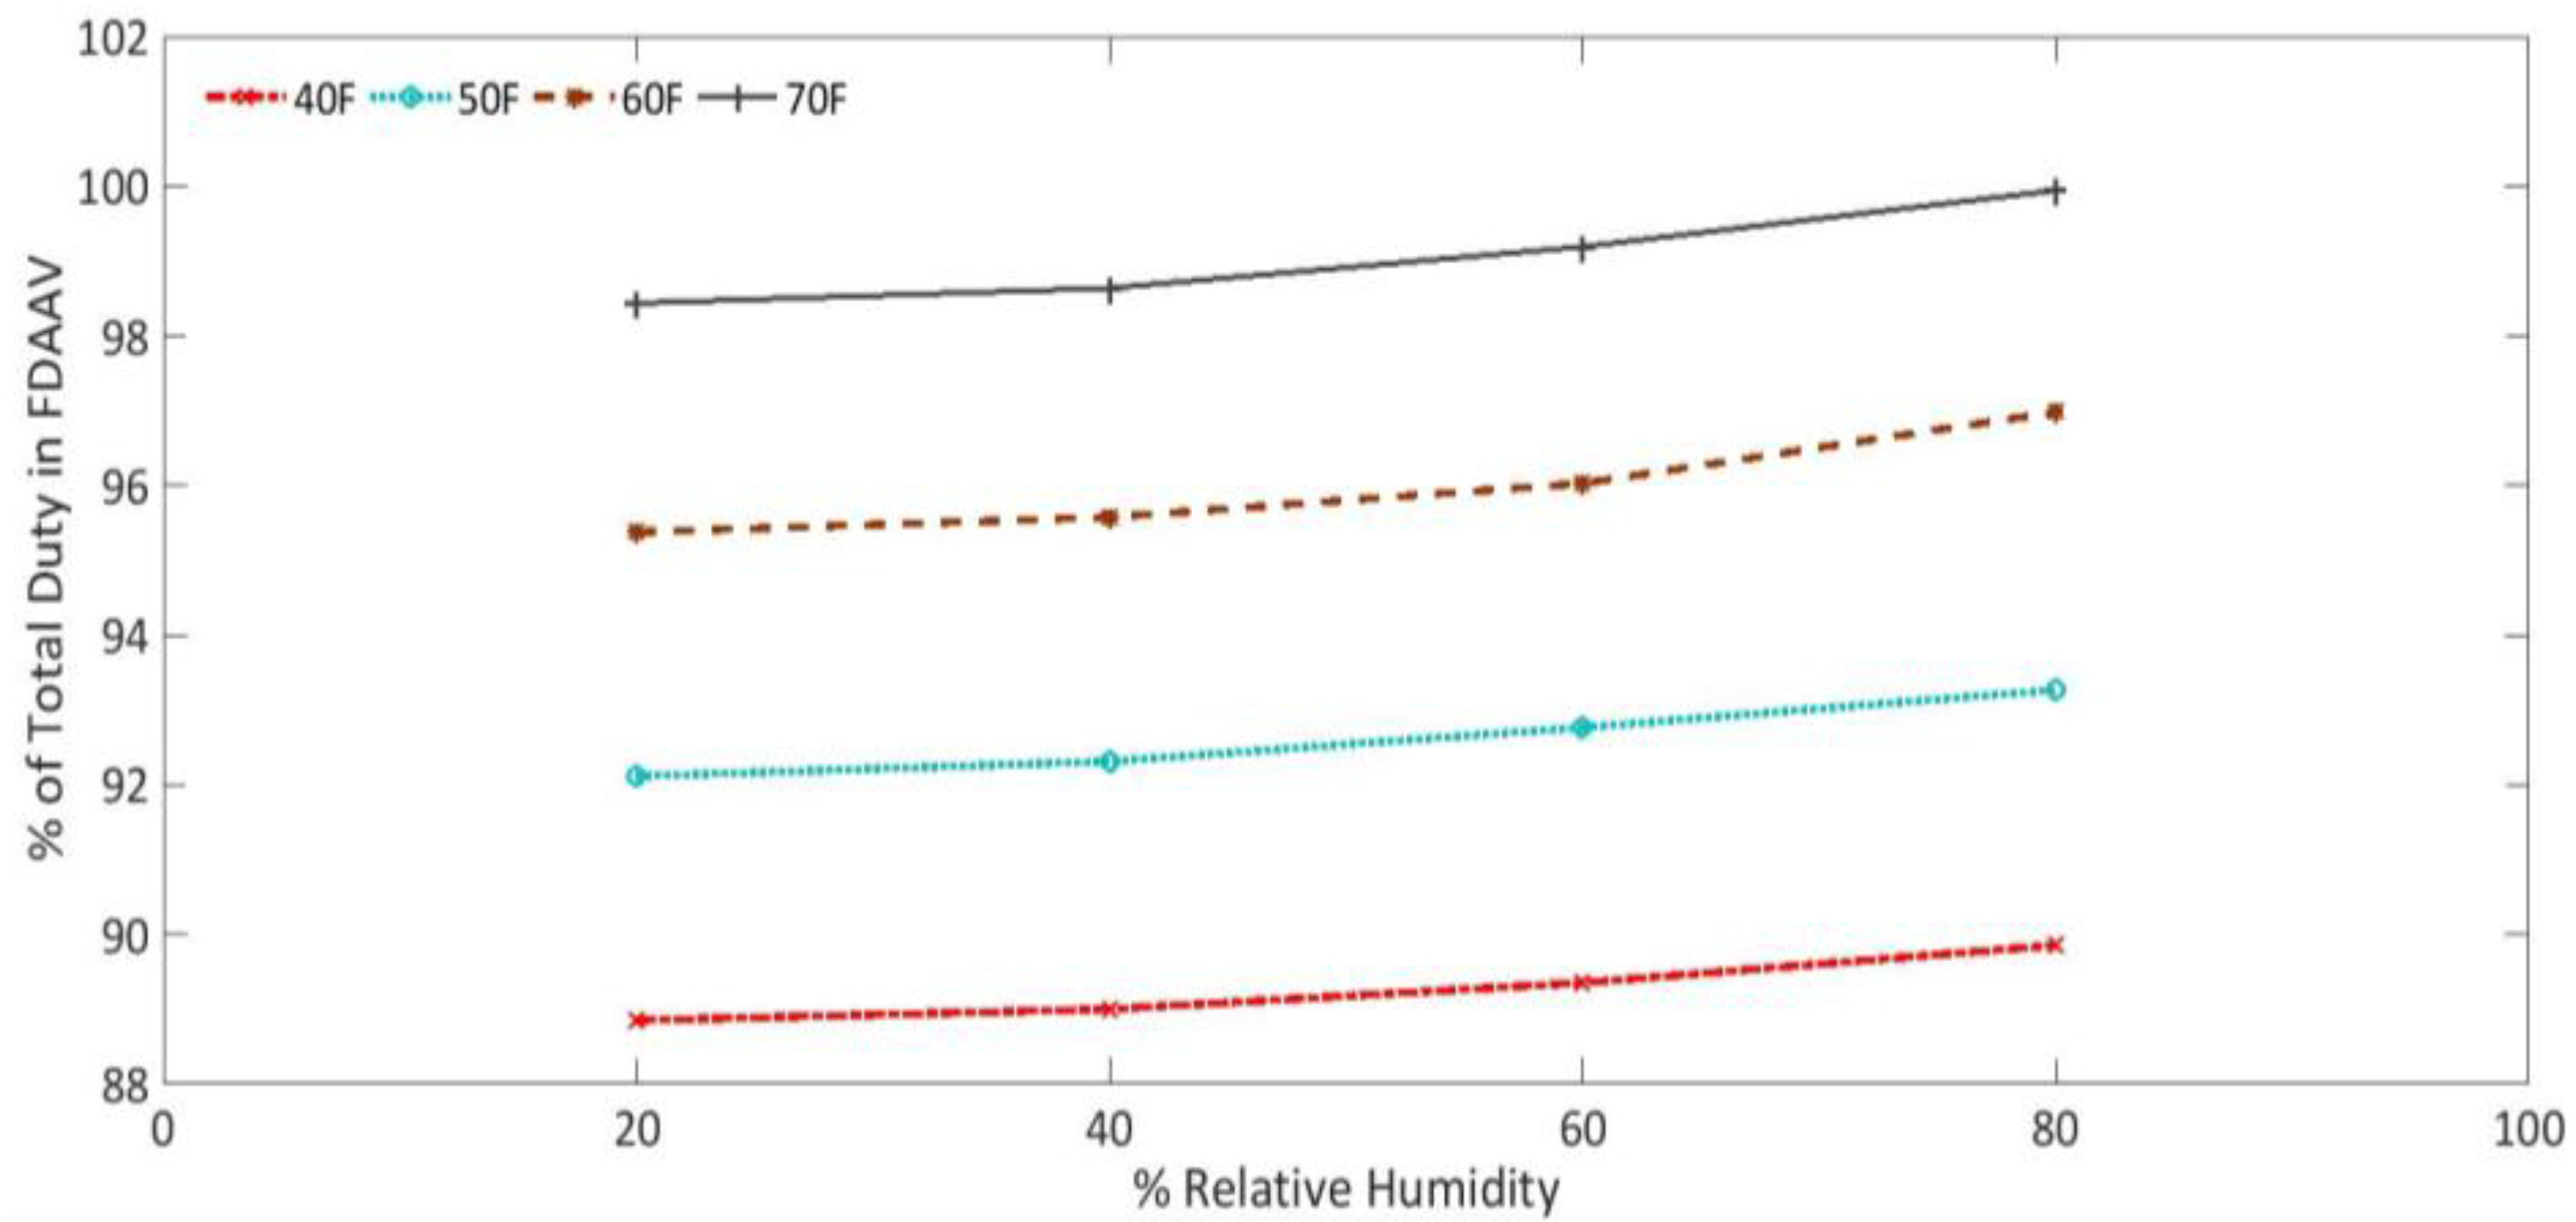
Shah, Wong and Minton (2008) determined the effects of temperature and humidity on the performance of forced air vaporizers [
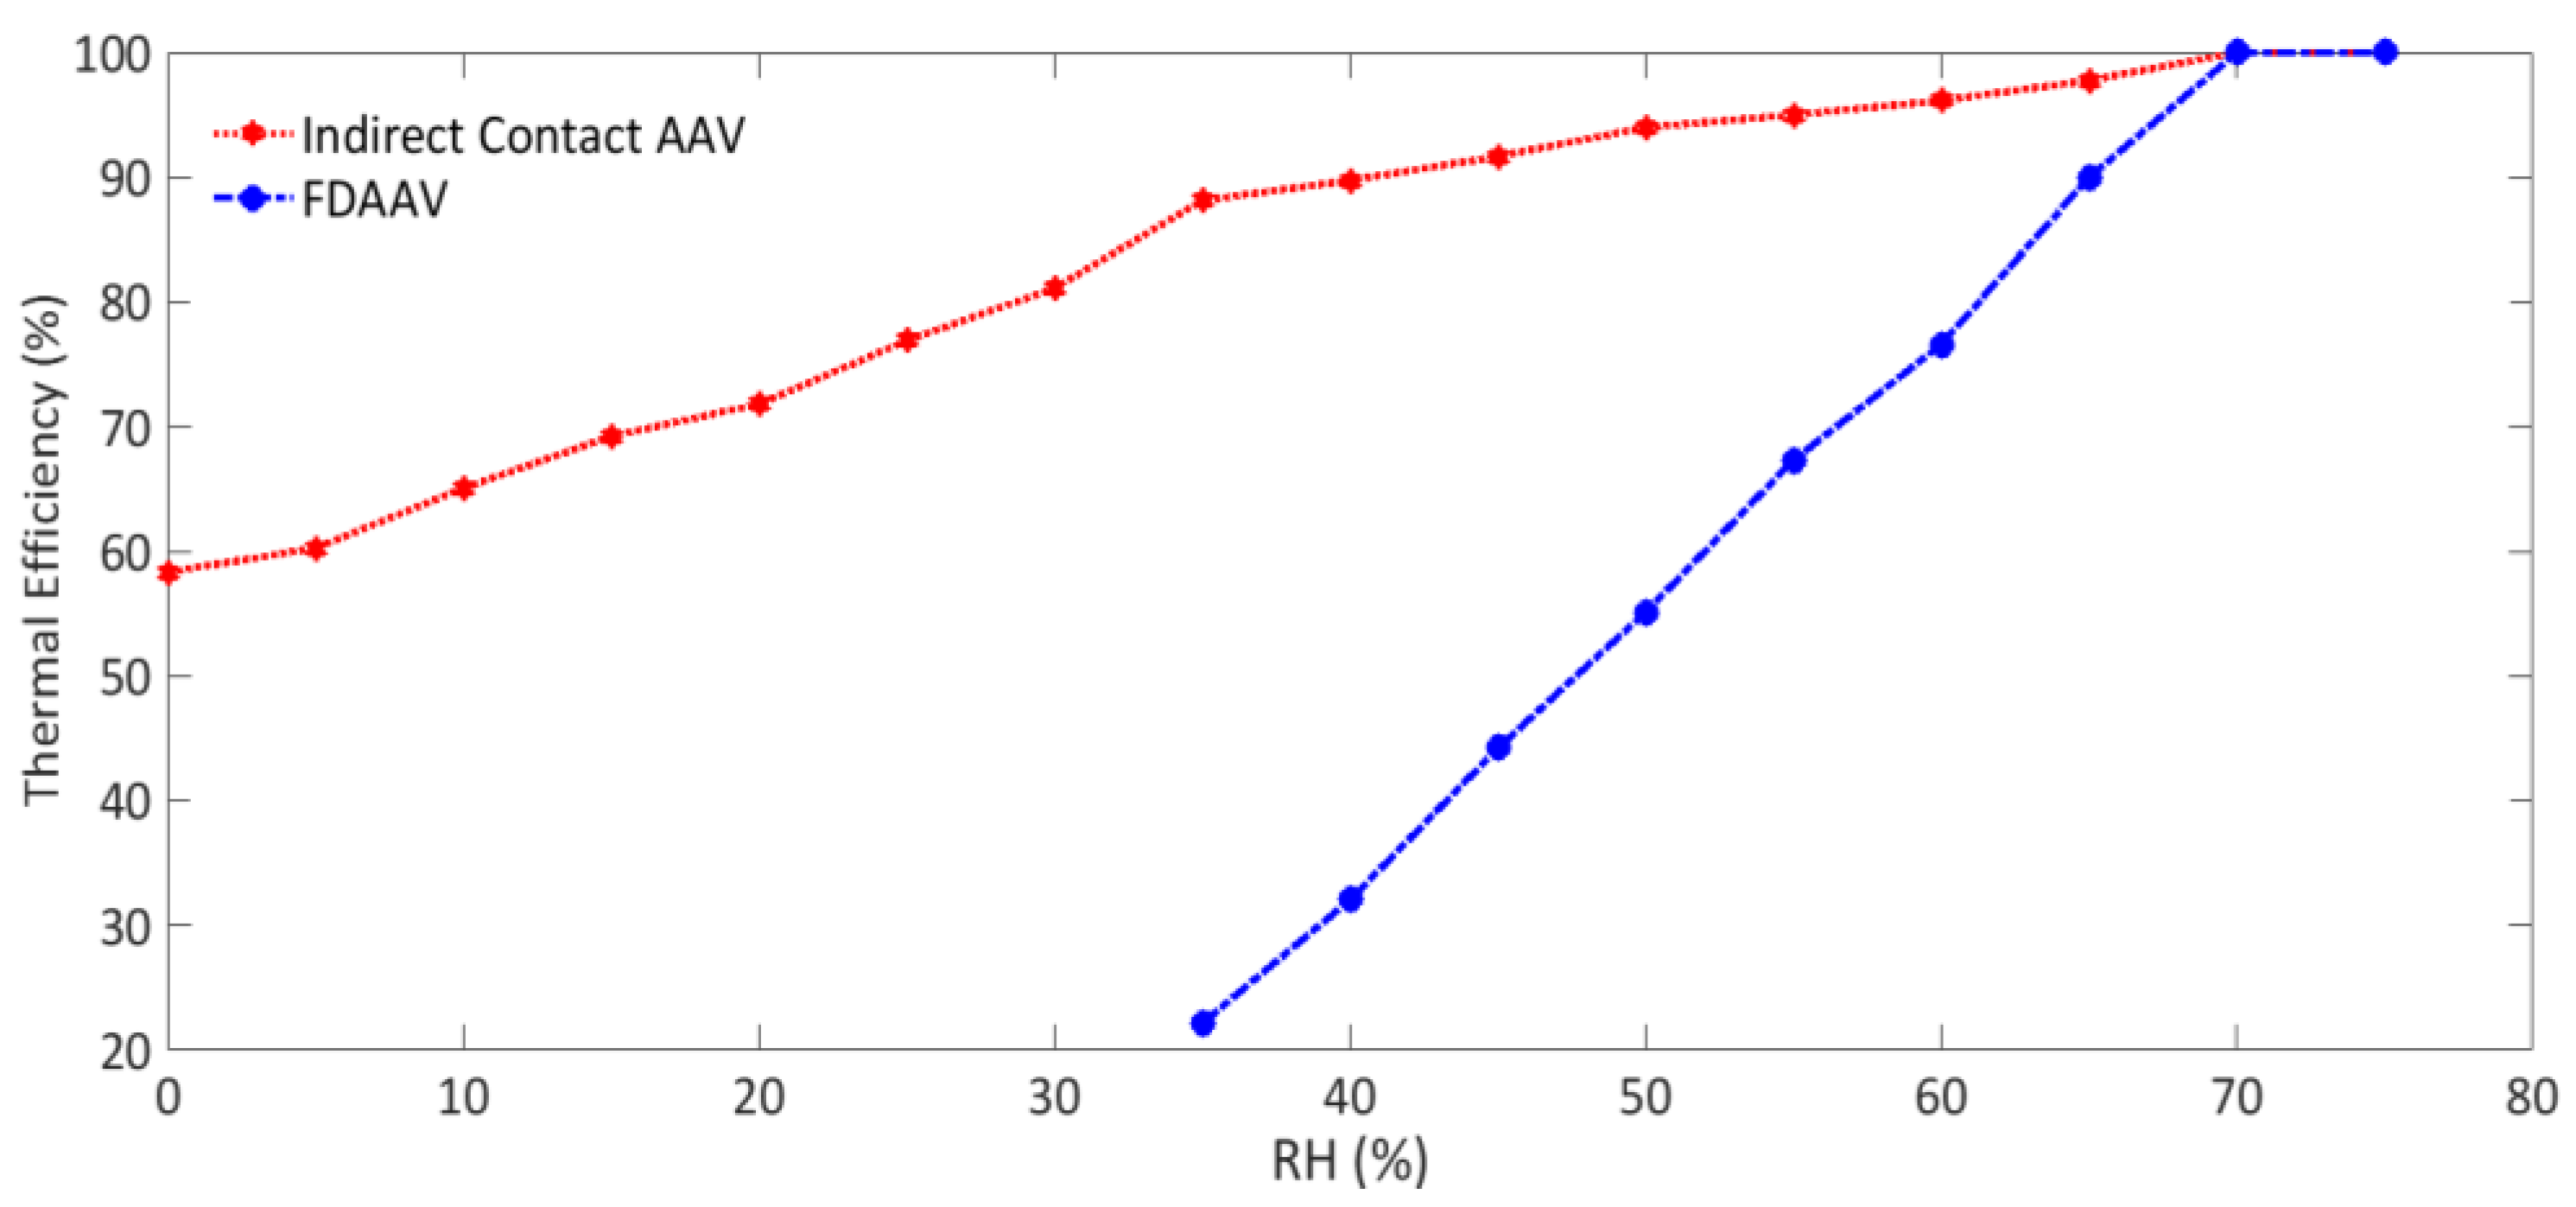
18].
Figure 14 shows that the greater the humidity in the ambient conditions, the greater the performance of the forced draft ambient air vaporizers (FAV).
Figure 15 also shows that at higher temperatures, the humidity has a greater effect on the total duty than at lower temperatures.
Utilizing a specially-designed test apparatus to simulate AAV terminals, Kim et al. (2013) could determine the effects that temperature and humidity had on frost formation [
7]. The experimental results showed that the frost thickness decreased with the increase in air temperature. It was also found that the frost thickness irregularly increased with the increase in relative humidity. With the increase in air velocity, the frost thickness also increased; however, from 6 m/s onwards of air velocity, pieces of formed ice would break off causing the frost thickness to decrease. The increase in mass flow rate of LNG also increased the frost thickness. From the experiment, it was concluded that the wind velocity and the mass flow rate of LNG had the greatest effect on the frost thickness.
Ambient air vaporizers transfer heat to LNG from the surrounding ambient air by making use of the temperature differential between this air and the LNG. Consequently, this ambient air is cooled, and the associated latent heat results in condensation. Thus, both sensible and latent heat from the air and water vapour, respectively, contribute to the vaporization of LNG. Condensed water forms on the external surfaces of the ambient air vaporizers and runs down under gravity. This condensate flows towards the lower half of the vaporizer where it often freezes on the external surfaces where ice forms. Ice formation on external surfaces of the vaporizer is influenced by several factors. Ice cover can be partial on the lower half to up to the full height of the external surface. Because of the forces the ice exerts on ambient air vaporizers, they are ideally designed to withstand the forces that can be generated by any percentage coverage of ice. To ameliorate this problem, vertical tube bundles are generally preferred to horizontal tube bundles. Ice build-up on the external surfaces of the vaporizer will cause a drop in efficiency, which will result in lowering the exit temperature of the natural gas from the vaporizer.
The rate at which ice builds up and the degree of coverage depends on a large number of factors, the main ones of which include the ambient air temperature and relative humidity, the LNG flow rate through the vaporizer and the materials used for vaporizer construction. Some of these variables such as the temperature and relative humidity of the ambient air undergo seasonal variation and are influenced by the climate in the location at which LNG regasification is conduced.
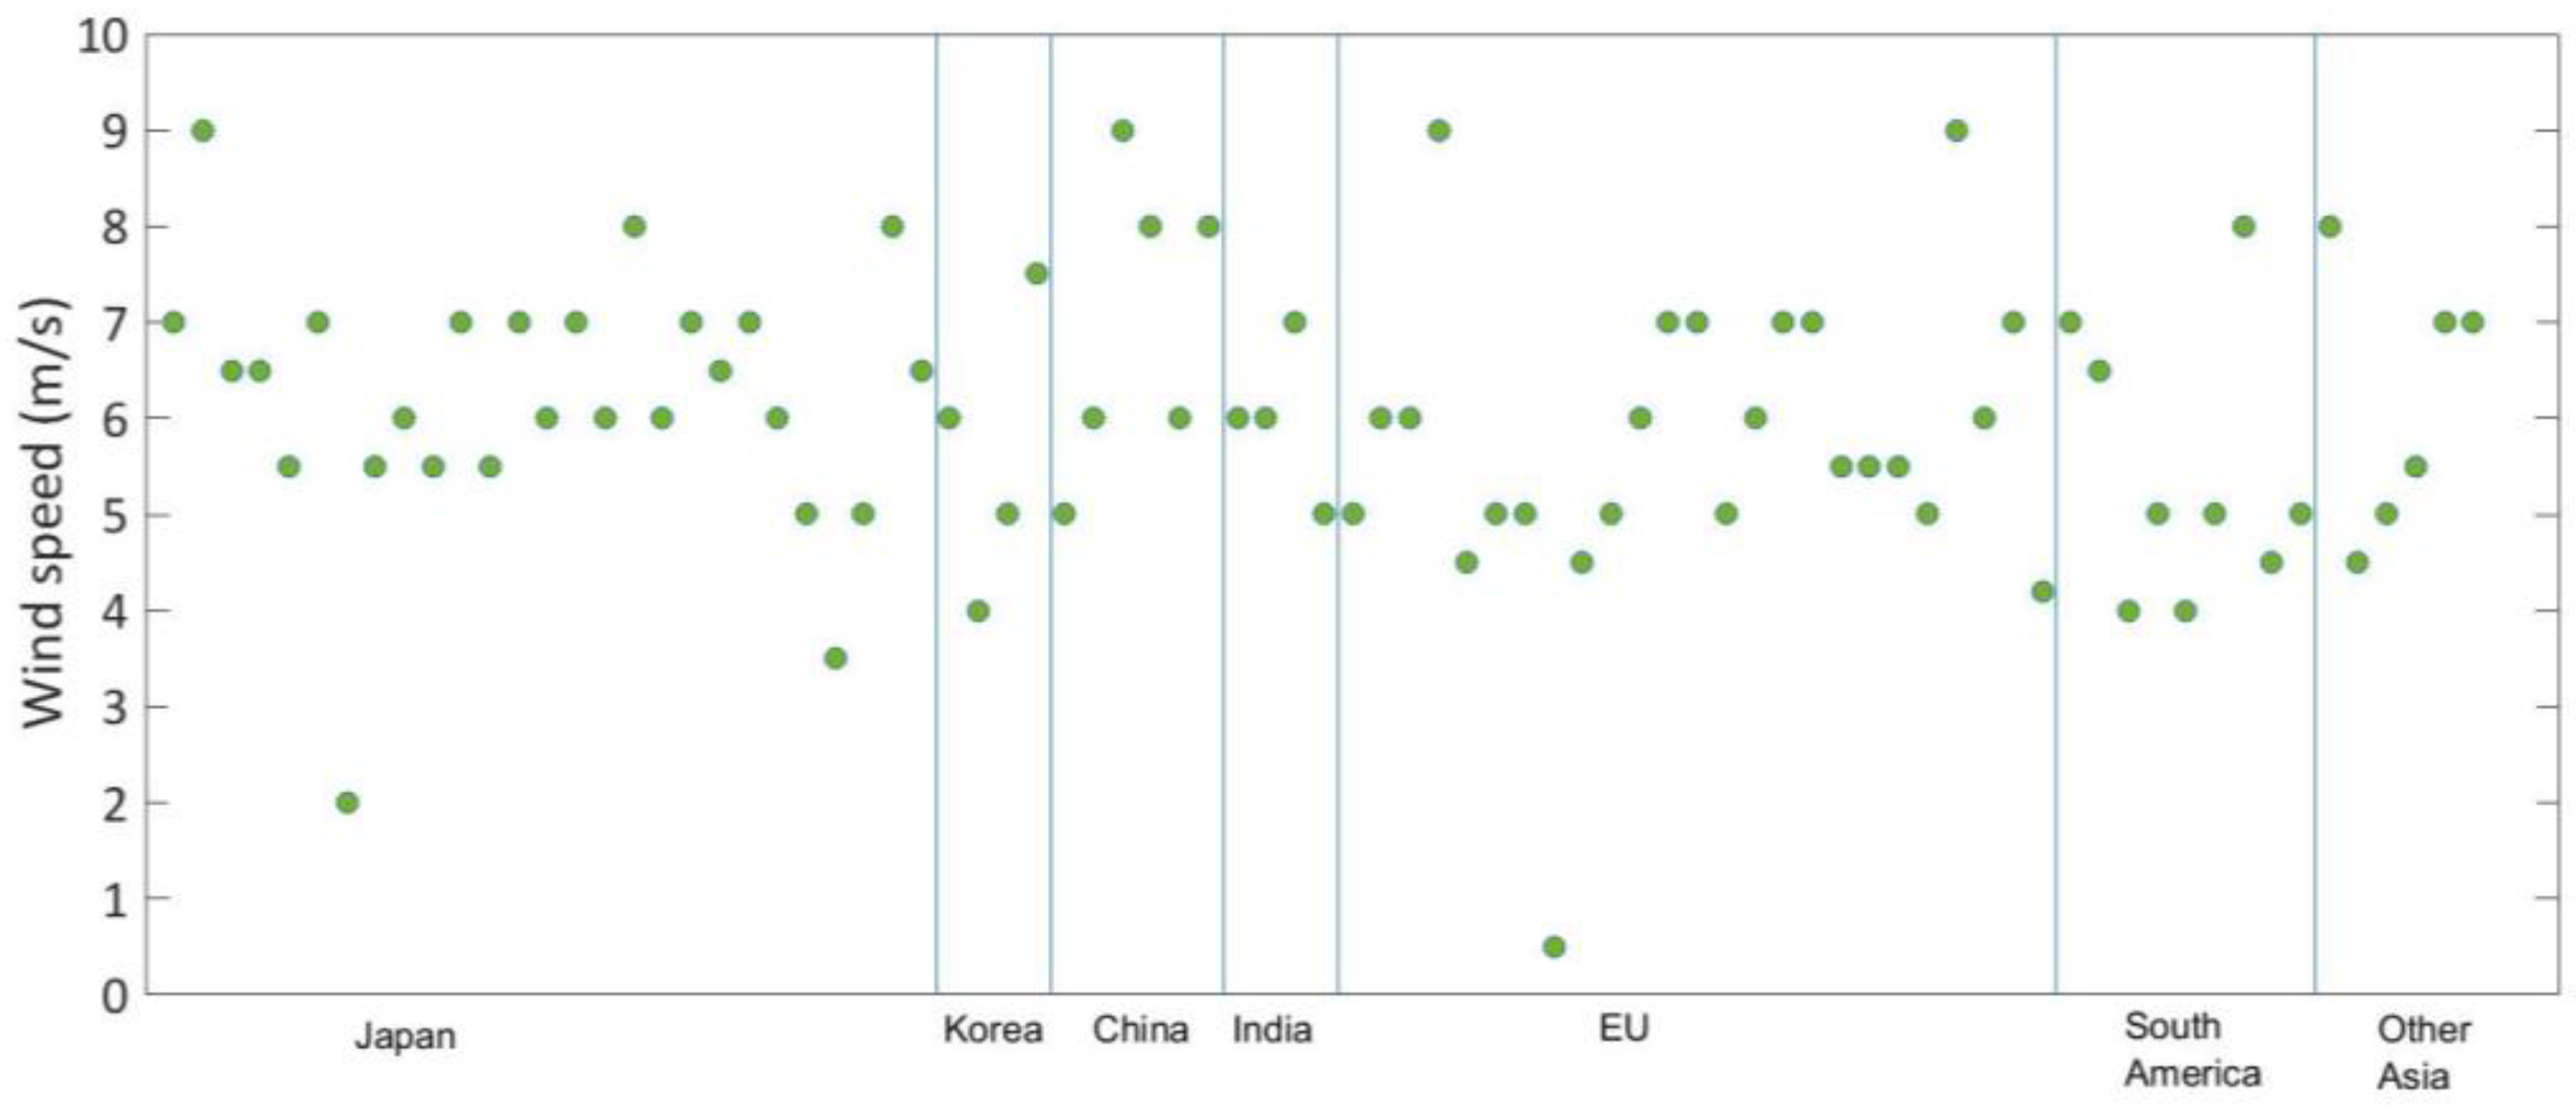
4.4. Maximum and Minimum Wind Speeds
It was found that with the increase in air velocity, the frost thickness also increased; however from 6 m/s onwards of air velocity, pieces of formed ice would break off, causing the frost thickness to decrease. An increase in mass flow rate of LNG also increased the frost thickness. From the experiment, it was concluded that the wind velocity and the mass flow rate of LNG had the greatest effect on the frost thickness [
7].
It is difficult to find substantive research work on the relationship between wind speed and frosting. Therefore, this area of knowledge may require further research in developing simulation models and testing. This holds significance for understanding the life cycle performance of the ambient air-based technology options from the regasification rates and efficiency perspective.
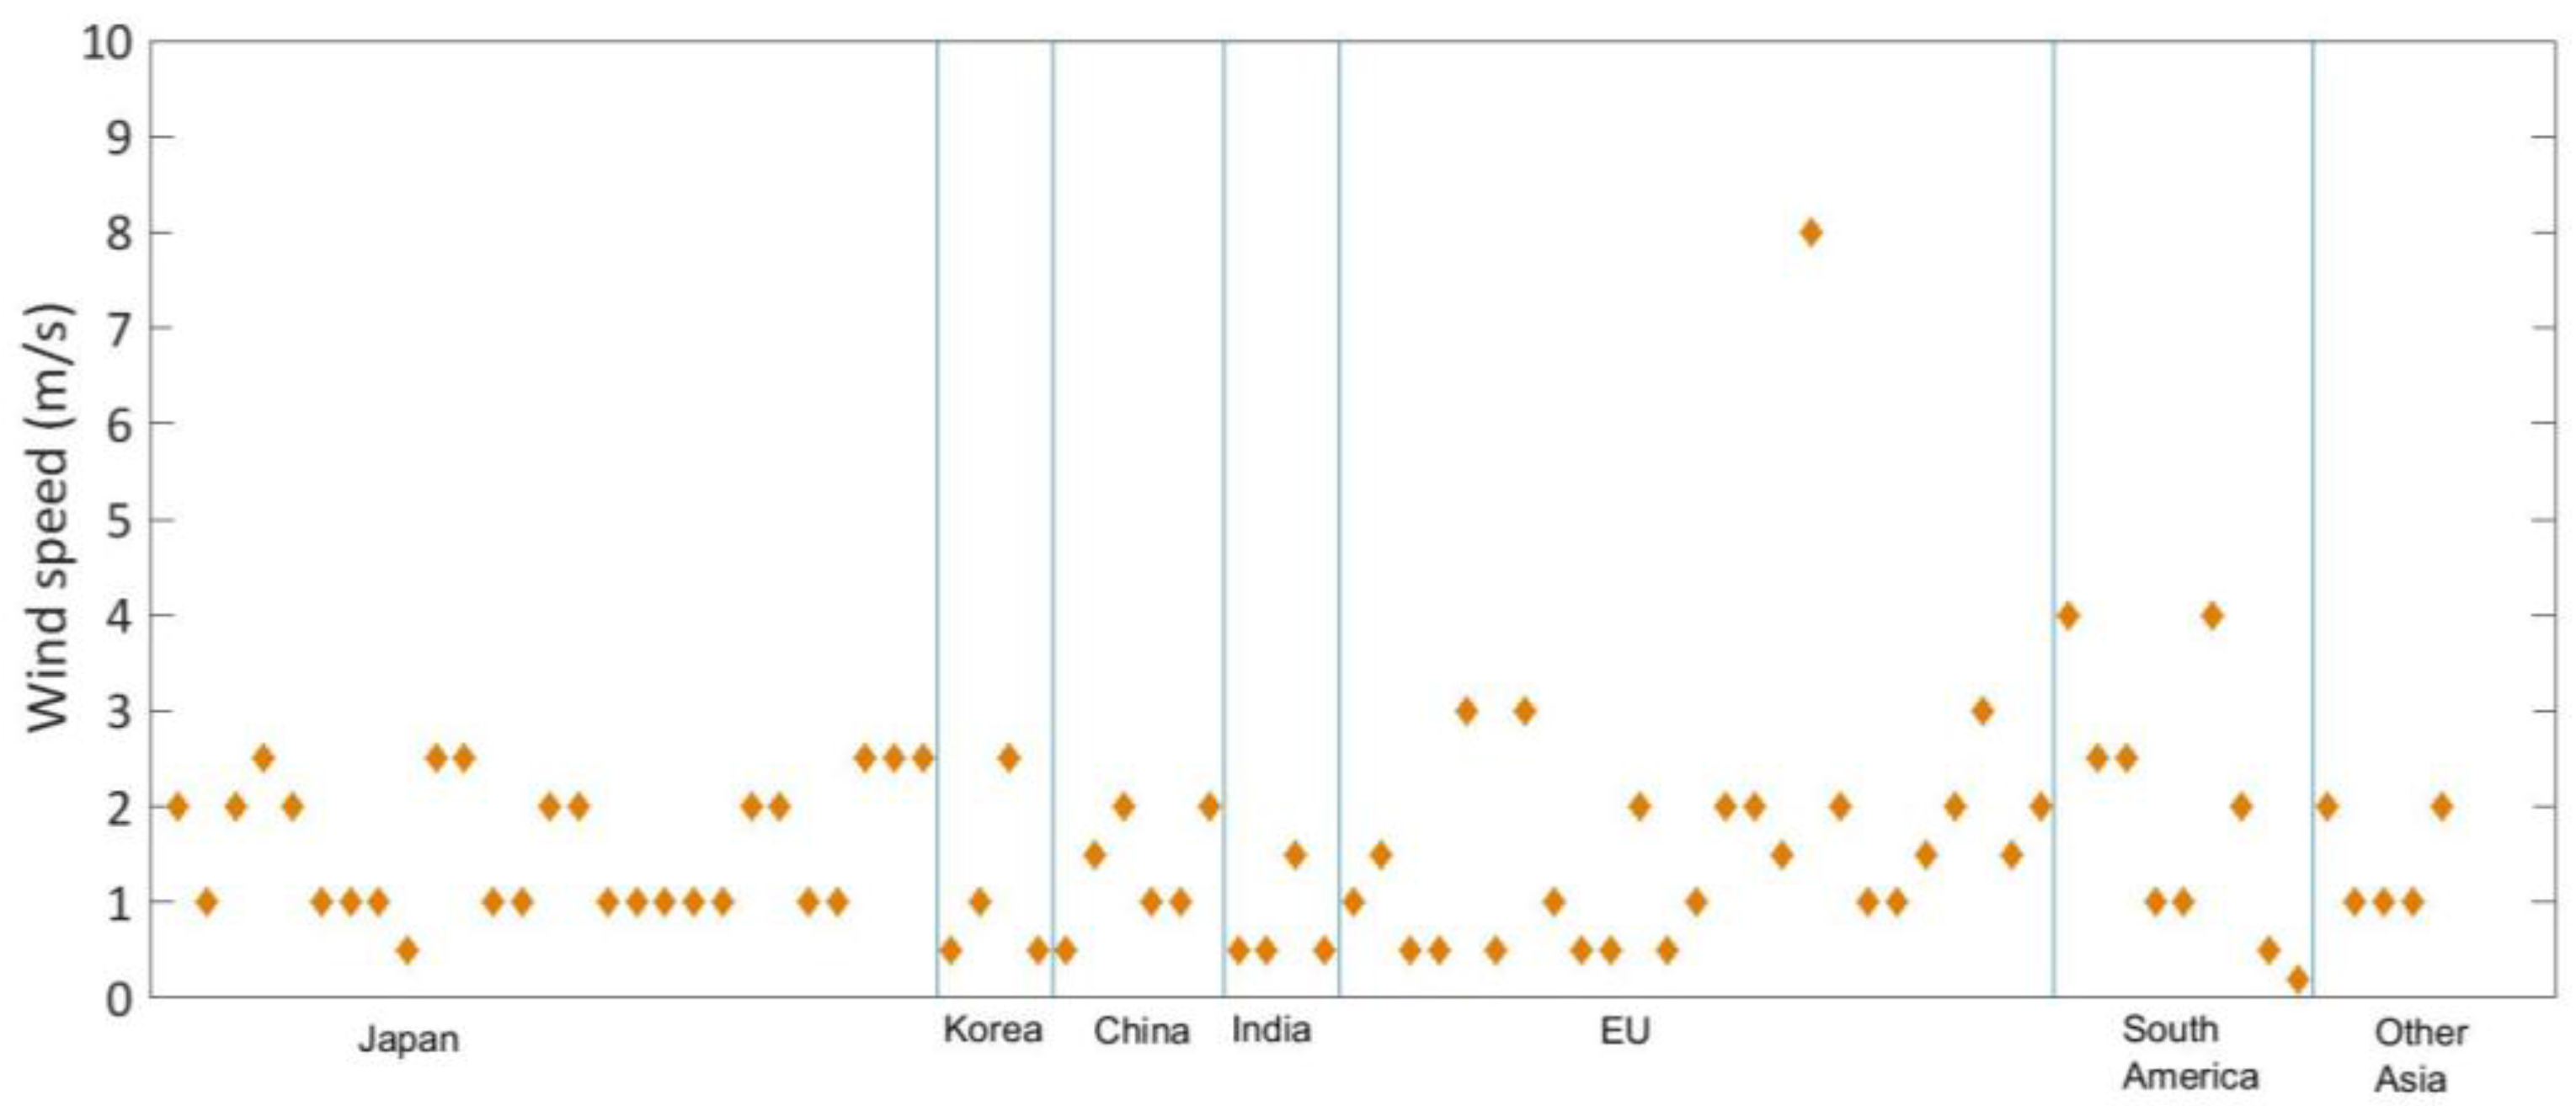
A high degree of variation has been observed in maximum and minimum wind speeds across the globe (see
Figure 16 and
Figure 17). The range being ~1 to 9 m/s; therefore, this is a very location specific variable, and it may be difficult to draw relationships between the regions.
When AAV/FAV units are in operation, water and ice form on the outside of the tubes due to the extremely cold operating temperatures. The longer the unit is left to run, the more ice builds up on the tubes, eventually reducing the unit’s performance. This requires the units to be periodically shut down to allow for defrosting [
19].
The energy extraction from the humid air is part sensible and part latent heat. The sensible heat is from the simple cooling of the air, and the latent heat is the point when the air is cooled down to below its dew point and the moisture starts to condense. When the moisture begins to condense, some of it is attached to the fins as ice, and the remainder of the moisture passes out the bottom of the vaporizer as fog [
8]. Although fog formation is considered benign, it can cause disruptions to human activity near terminals such as transport or maintenance [
8].
Fog can become an issue with AAV/FAV terminals; it is produced when the cold air from the vaporiser comes into contact with the warm humid air outside. The severity of the fog depends on many factors, including the ambient temperature, wind velocity, relative humidity and the distance between units. Although the fog is considered benign, dense fog can create operating issues due to the lack of visibility [
14].
4.5. Impact of Climate Change on Location Factors
The preceding discussion relates to the weather conditions in the different regions in the various regions of the world. Therefore, it is prudent to mention that regional weather patterns are expected to change during this century. Climate change impact is expected to see an increase in seawater and ambient air temperatures around the globe. The Intergovernmental Panel on Climate Change (IPCC) has already predicted that the rise in temperatures is expected to be seen during both winter and summer times [
20]. However, the IPCC modelling predicts that the increases may vary across the regions and over the period. For example, the greatest warming in winter is expected to be over both north-eastern Europe and Scandinavia (December–February) and in the summer in the Mediterranean (June–August) [
21].
The warming of Europe has been more than the global average (1.0–1.2 °C compared to 0.81–0.89 °C for the rest of the world). The current observations and modelling indicate that the relative humidity is not expected to increase in the future. This is because water vaporization will increase at higher temperatures, but the ambient air can hold more water at higher temperatures [
20].
As per the preceding discussion, it is evident that LNG regasification technologies are primarily based on seawater and ambient air temperatures. Therefore, the weather pattern changes may have significant impact on technology selection and on the design criteria for new terminals. The heat transfer fundamentals would suggest a 0.5–1.0 °C rise in the ambient conditions, which may have a significant impact on the selection and sizing of the heat exchanger systems.
Consequently, due to the positive impact of higher heat available from ambient air and seawater, the need to have large SCVs and to burn the gas for combustion heat may eventually be reduced and/or eliminated. A reduction in usage and/or elimination of SCVs in turn will help reduce greenhouse gas emissions. Therefore, it is conceivable that climate change may have a significant and positive impact on LNG regasification terminals in terms of environmental, efficiency and economic performance.
While it is not the intent of this paper to do a detailed evaluation of the impact of increased ambient air and the seawater temperatures on LNG terminals due to climate change, it may be argued that the new LNG terminals should consider a careful “climate adaptation” study at the concept and technology selection stages. Any such study, however, must be based on regional weather pattern modelling data and the results from IPCC to assess the location factor impact on technology selection and design options.
5. Conclusions and Policy Implications
From the discussion so far, it is clearly evident that while there is some material available from industry and commercial conferences, only a few research papers on this subject matter are available Therefore, future research areas that could help in enhancing the body of knowledge, as well as being useful to the industry include:
For an efficiently-managed LNG industry, the role of geography and meteorology needs considering on a case-by-case basis. From the study of location factors, the following conclusions can be drawn: Seawater vaporization is a viable technology option in more than 95% of the locations, worldwide. However, this is subject to any water quality considerations.
Ambient air conditions are best for AAVs/FAVs and IFVs in South America, India, Spain and other Asian countries (Singapore, Taiwan, Indonesia, Thailand) and provide a much cleaner regasification technology option.
Currently, cold energy utilization globally is less than 1% of the total potential. Considering 500 Mtpa LNG trade in the future, the potential for cold energy recovery is ~12 GW per annum, globally.
Climate change is expected to have a positive impact on the LNG regasification industry. However, the impact in some regions could be more pronounced due to regional variation of the climate change. Due to higher heat available, the operating efficiencies may rise and the need for SCVs may reduce.
While these conclusions are drawn based on location parameter data alone, it is the intent to compare the performance characteristics of different technology options using the thermodynamic models in subsequent papers. Future research areas that could help with enhancing the body of knowledge, as well as being useful to the industry include:
Relationship between wind speeds, relative humidity and frost and fog formation
Impact of seawater quality on technology selection
Climate adaptation study for new LNG terminals
Technology options for enhanced energy recovery of LNG cold energy
Retrofitting cold energy utilization in existing terminals
Techno economic feasibility of AAVs/FAVs vs IFVs for a given location(s)

 ,
, 


