1. Introduction
To support the sustainable growth of humanity, new technologies are being developed to solve real world problems such as energy depletion and environmental pollution. In the field of electrical power, which can be directly or indirectly related to these problems, new technologies such as smart grids are being developed [
1,
2]. Recently, nations worldwide have experienced electric energy shortages, which result from environmental problems and rapid economic growth. Consequently, the construction of new power generation and transmission facilities has been delayed because of these economic and environmental problems. Power companies have the tendency to operate their systems at peak load because of the electric energy shortage, and voltage reduction is performed to reduce the load demand at this peak [
3,
4,
5].
This voltage reduction can be accomplished by reducing the bus voltage, which is achieved through adjusting the taps of power transformers. If the bus voltage decreases, then the voltage-dependent load demand also decreases. This causes the demand power to decrease. Generally, voltage reduction methods are classified into three types: conservation voltage reduction (CVR), emergency voltage reduction (EVR), and routine voltage reduction (RVR) [
6]. However, CVR has been mainly used to reduce the demand load through voltage reduction.
Distribution voltage reduction was first carried out by the Pacific Gas and Electric (PG & E) company in 1948 to reduce the peak load [
7]. Afterwards, it was mainly used to decrease demand loads because energy saving became a social issue due to the 1970s oil shock. After PG & E tested the impact of voltage reduction in 1975, the California Power Commission asked power companies to test nominal voltage drops and implement constant voltage reductions. Since then, power companies have constantly tested distribution voltage reduction and proven its impact. In particular, the Independent Electrical System Operator (IESO), located in Ontario, Canada, performs distribution voltage reduction every 18 months to analyze the effects of power load reductions caused by voltage reduction and to check emergency measures [
8].
The US Department of Energy (DOE) reported that the voltage being supplied to more than 90% of normal homes and shopping centers is higher than the required level. Therefore, appropriate voltage reduction can effectively ensure energy saving and stable operation of systems at peak load.
The Korea Electric Power Corporation (KEPCO) also adjusts the taps of power transformers for voltage reduction when operational reserves are insufficient. When rolling blackouts occurred in 15 September 2011, taps of power transformers were adjusted to secure reserves of approximately 1000 MW. Since then, KEPCO has performed voltage reductions when reserve shortages occur at peak load during winter and summer.
One study in the literature [
9] describes the results of estimating the CVR of power distribution units using GridLAB-D, which was developed at the Pacific Northwest National Laboratory (PNNL). Another paper from the literature [
10] also describes the effect of adjusting the distribution voltage in smartgrid environments. In one study [
11], CVR factors were estimated by applying supply curves, and the energy saving costs were subsequently calculated. In another study [
12], energy saving by voltage reduction and its economic implications were evaluated. Some researchers [
13] described a volt/var control method and CVR, while others [
14] proposed a method to estimate the CVR factors by applying a voltage control technique that inhibits the occurrence of low voltage during distribution voltage reduction. KEPCO performed voltage reduction from the summer of 2012 to the spring of 2013 to analyze its effects. The results from analyzing the energy saving and voltage reduction effects in the KEPCO system using the Substation Operating Results Management System (SOMAS) data are described in the study by Nam et al. [
15]. Although the CVR factors vary with the type of load and the season, the typical values reported in the previous studies range from 0.3 to 0.9 [
16].
This paper introduces and describes a method to estimate CVR factors using measurement data from power distribution systems and presents the results of applying this method to the KEPCO system. The percentages of voltage and load changes are calculated from data obtained at the moment of abrupt voltage changes due to tap changes in the transformers of the power distribution system. Then, the ratio of the voltage change percentage and load change percentage is calculated to estimate CVR factors. In addition, the MAD is used to calculate load variations, which are reflected in the calculation of the load change percentage and utilizes to estimate CVR factors. The average of the CVR factors obtained by filtering the voltage and load changes and the estimated CVR factors are used to calculate the representative CVR factor of each distribution line.
As a result of evaluating the CVR factor of the KEPCO system, the CVR factor was estimated to be the largest during winter, with heavy heating loads. Additionally, the CRV factor was estimated to be the smallest during summer, when a large amount of air conditioners is being used. Because reactive power is sensitive to voltage changes, CVR factors for the reactive power were found to be much higher than those for the active power.
The composition of this paper is as follows.
Section 2 describes the CVR factor estimation method.
Section 3 gives the data measurements of the KEPCO distribution system.
Section 4 presents the results of estimating CVR factors of the KEPCO distribution system. Finally, conclusions of the study are provided in
Section 5.
2. Conservation Voltage Reduction (CVR) Factor Estimation Method
2.1. Definition of CVR Factors
In power distribution systems, loads are always subject to change. To quantitatively identify the effects of voltage reduction, the reduction of demand loads with respect to voltage changes needs to be estimated. The CVR factor is defined as the percentage of load reduction with respect to the percentage of voltage change, and is a quantitative indicator of demand load reductions with respect to voltage changes. Therefore, CVR factors are quantitative indicators that can be used to independently identify the effects of voltage reduction.
CVR factors for the active and reactive powers can be expressed using the voltage and load change percentages as follows:
- -
The active power CVR factor
- -
The reactive power CVR factor
where %∆V is the percentage of the voltage change, and %∆P and %∆Q are the percentage variations of the active and reactive demand loads, respectively.
2.2. Direct Method
In previous research studies, change of the demand load was calculated from the measured load when the voltage reduction was applied, and the estimated load assuming the voltage reduction was not applied. Therefore, the accuracy of the CVR factor depends on the accuracy of the load estimation. If the load variations are large, it is difficult to accurately estimate the demand loads; subsequently, large errors occur in calculating the CVR factor.
We propose a new method, named the direct method, to calculate the CVR factor by calculating voltage and load changes directly from measured data. In other words, it is a method through which CVR factors can be estimated using only measured values without requiring the estimation of demand loads.
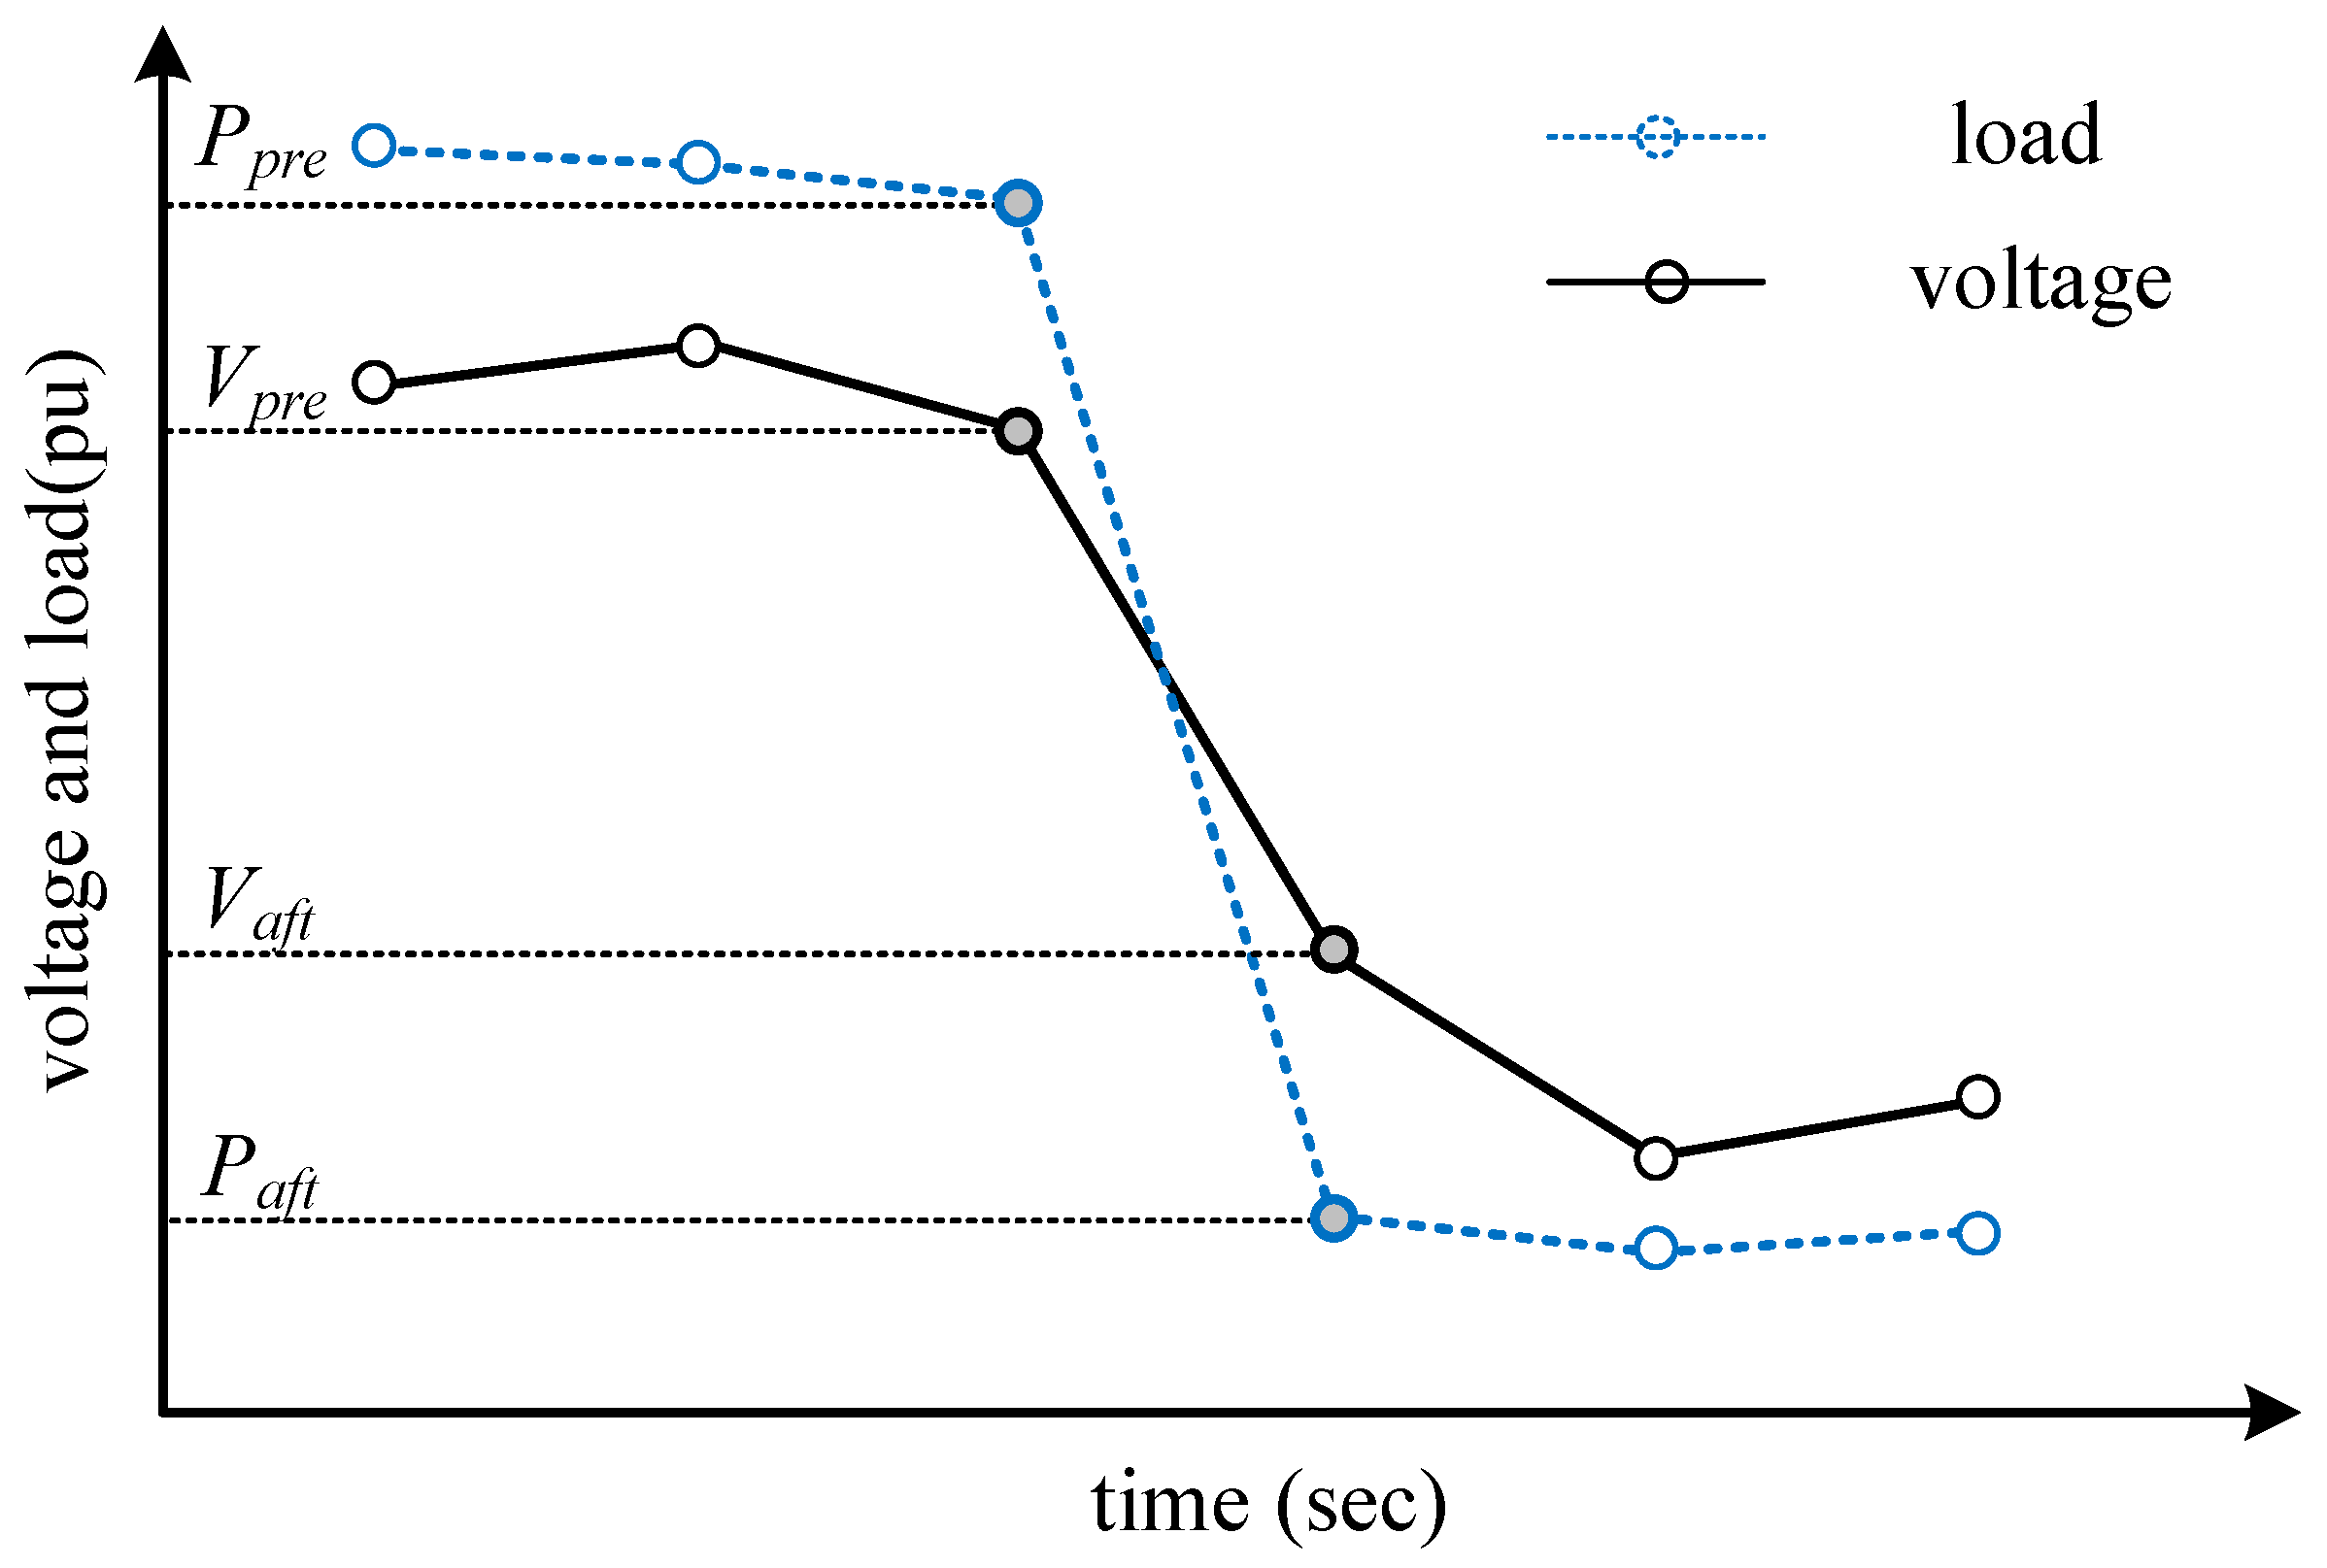
The voltage and load change percentages required in the calculation of CVR factors from measured values can be expressed as follows:
where
Vpre and
Vaft are the voltages measured before and after performing the voltage adjustment, respectively, and
Vmean is the mean voltage.
Ppre and
Paft are the active power loads measured before and after performing the voltage adjustment, respectively, and
Pmean is the mean active power load.
Qpre and
Qaft are the reactive power measured before and after performing the voltage adjustment, respectively, and
Qmean is the mean reactive power load. The variables with subscript ‘pre’ and ‘aft’ represent the single data point immediately prior to and after the voltage reduction, respectively, and the variables with subscript ‘mean’ refers to the average value of the two single point data.
The proposed method does not need to perform intentional tap changes for testing purposes. Instead, the voltage and load changes that occur when the tap changes, for voltage regulation purposes, are measured and utilized in the CVR factor calculation. Typical voltages and loads before and after changing the transformer taps are shown in
Figure 1.
2.3. Filtering
The transformer tap changes up to 10 times a day, although it depends on the load characteristics of the distribution lines. Therefore, measurement data of the voltage and load changes can be obtained as many times as the number of tap changes. The representative value of the CVR factor over a period of time (for example, a month or a season) can be calculated as follows:
Estimating CVR factors in power distribution systems requires sensitive mathematical calculations. For example, the voltage variation by one tap adjustment of a transformer is approximately 1%, and the range of typical CVR factor values is very small, ranging from 0.5 to 1.0. The filtering method directly influences the CVR factor estimation results. Thus, appropriate filtering is the most important part in estimating CVR factors. The representative CVR factor is calculated only using valid cases that satisfy the following filtering rules.
When the taps of transformers change, voltages and loads also change accordingly. Ideally, when the voltage decreases, the loads also decrease; when the voltage increases, the loads also increase. However, in some cases, the direction of the load change was opposite of the direction of the voltage change; thus, the calculated CVR factor values were negative. In those cases, it can be considered that the natural increase of the load is larger than the decrease of the load due to the voltage reduction. Therefore, it is reasonable to exclude these cases when calculating the representative CVR factor value. Only cases in which the measured voltage and the measured load change were in the same direction were chosen when calculating the CVR factor.
In the KEPCO system, on-load tap changers (OLTC) have 17 tap positions, which means that one tap change produces a voltage variation of approximately 1.25%. Thus, load changes that can occur in response to one tap change are limited. Therefore, very large load change percentages and small voltage change percentages calculated from the measured data are excluded.
Under a normal load, CVR factors consist of values ranging from 0.2 to 1.5%. Therefore, estimated CVR factors that are too high or too low are excluded.
Although the filtering criteria described in Equations (9)–(11) were chosen basically based on the intuition and engineering judgment, it can be applied to different system with minor modifications. For example, if the OLTC has 33 tap positions, then the parameter values of Equations (9) and (10) should be halved. The fine-tuning of the parameters would increase the accuracy of the CVR factor estimation, but it is left as a future work.
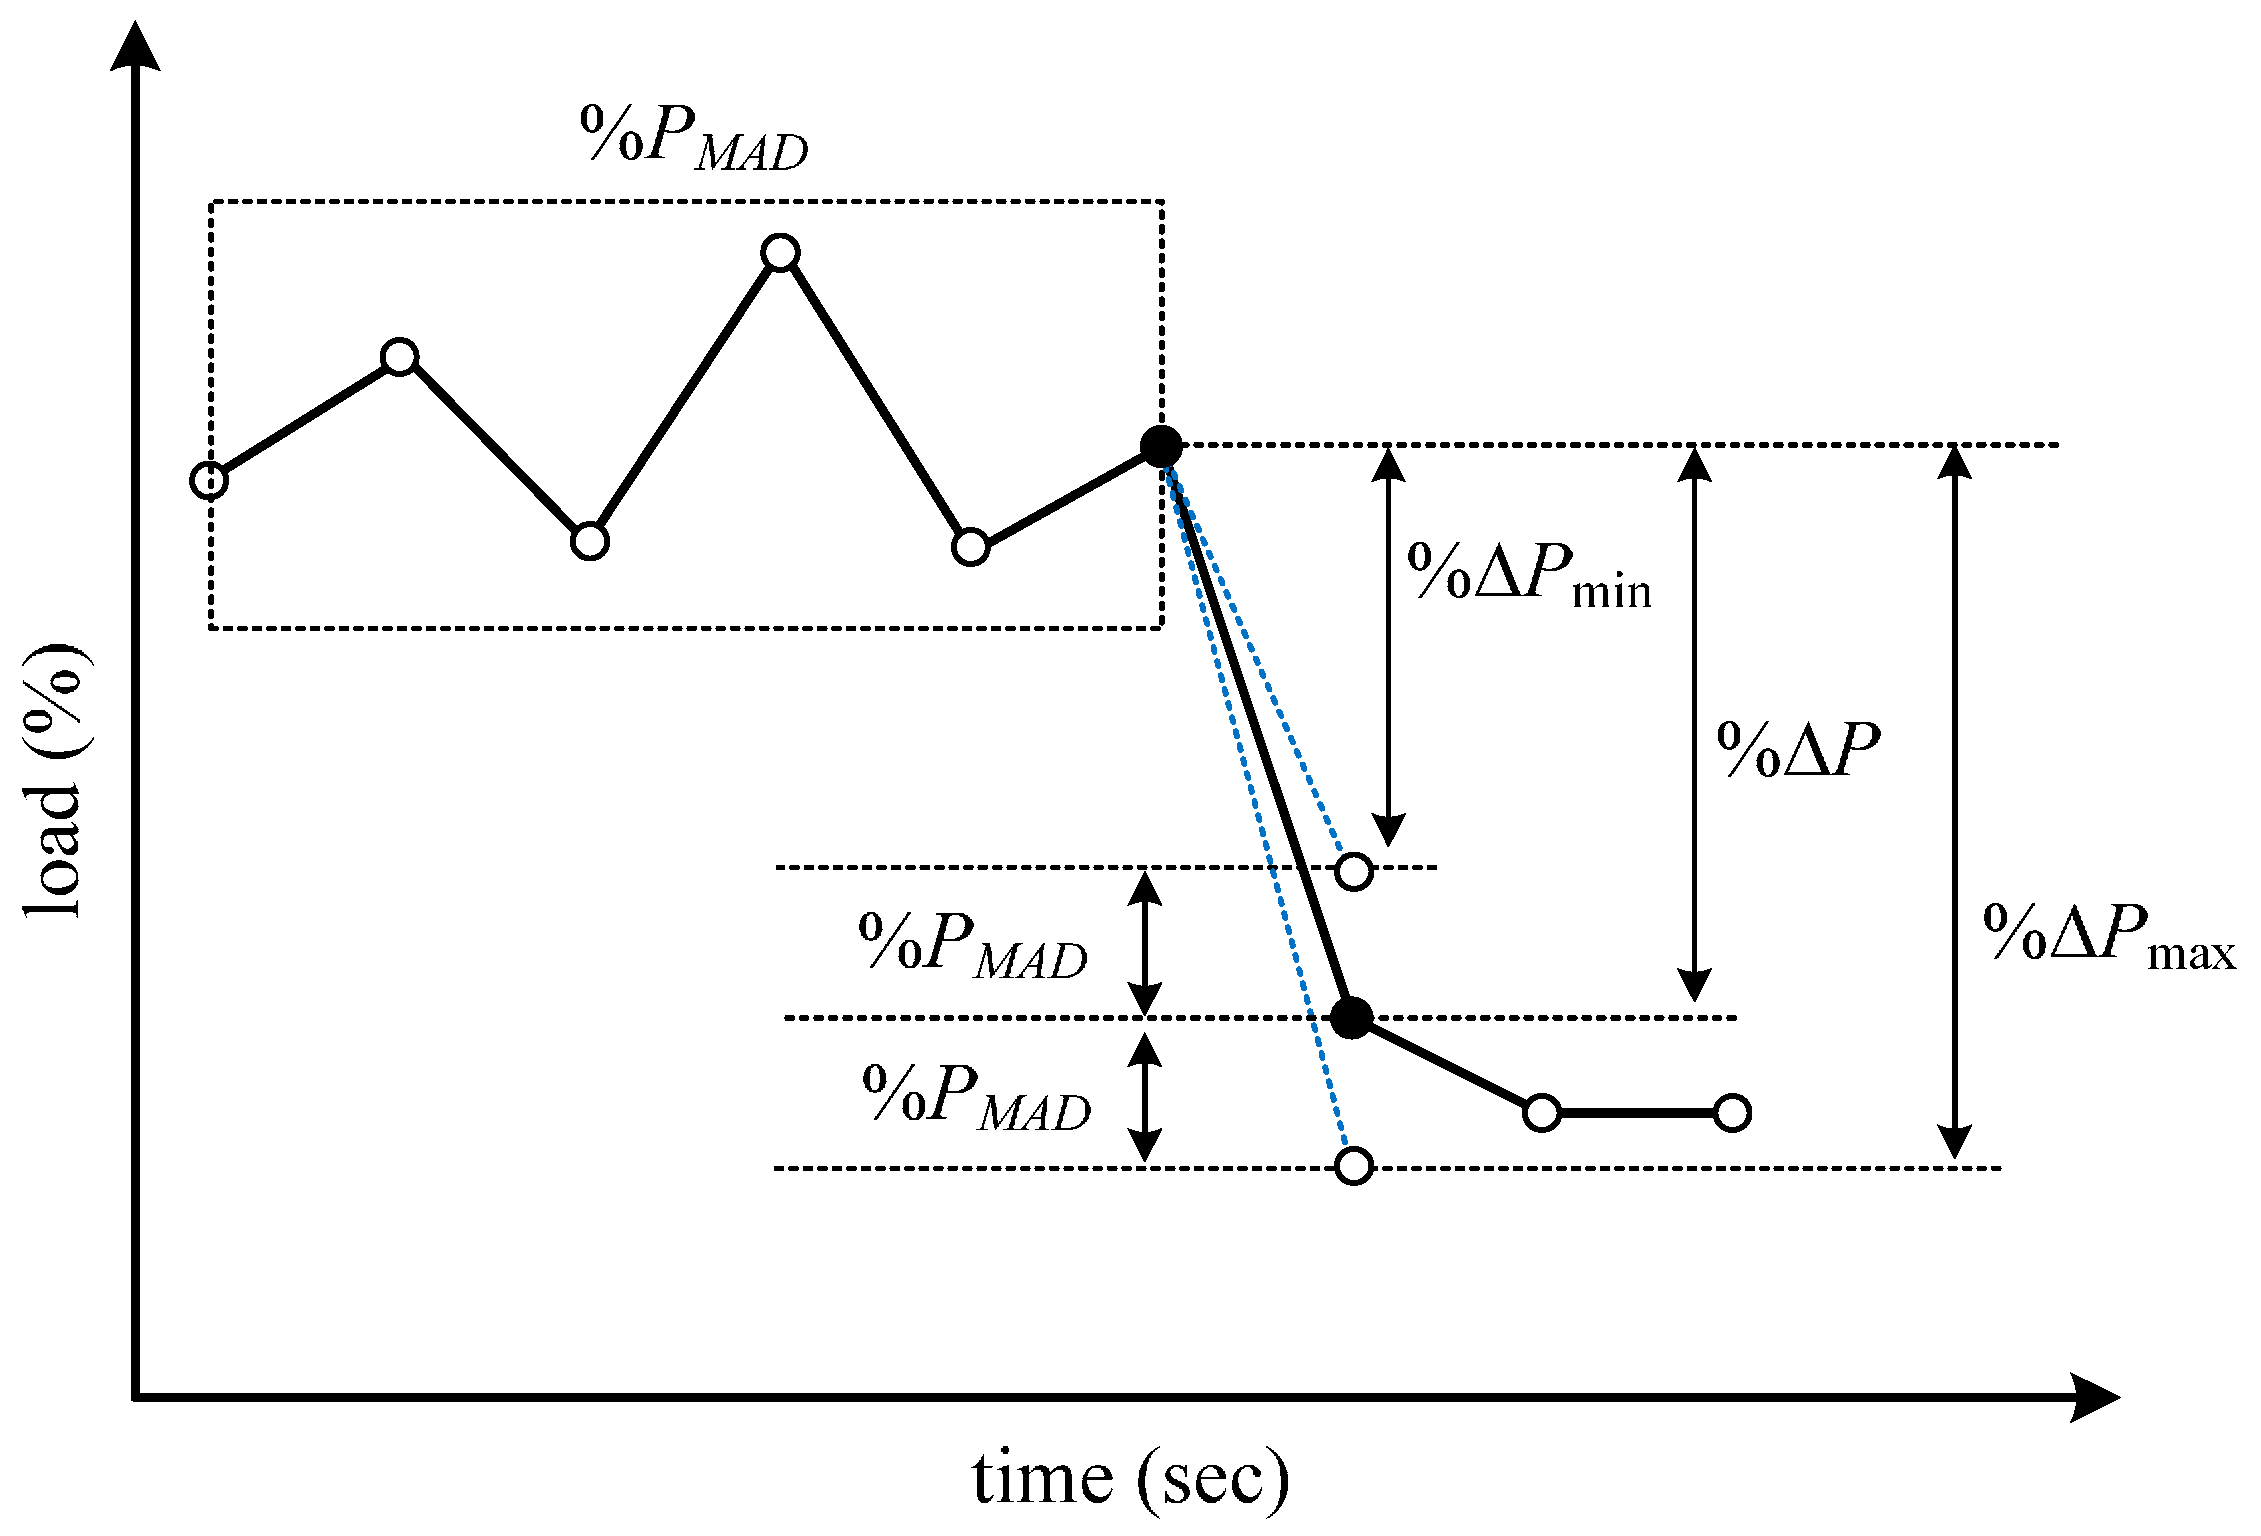
2.4. Mean Absolute Deviation (MAD) Direct Method
The direct method directly calculates the load change percentage from measured loads. Thus, the variation of load regardless of the voltage reduction affects calculated CVR factors. The MAD direct method is proposed to take into account the effect of natural variation in load. The load variations that occur right before tap changes is calculated and reflected in the calculation of the load change percentage. Load variation before tap changes can be calculated using MAD. This term refers to the average of the absolute deviations of each measured value from the mean. If
n measured values are represented as
P1,
P2, …,
Pn and the average value is
Pm, the MAD can be expressed as follows:
The MAD percentage right before tap changes (
) is expressed as follows:
The maximum and minimum load change percentages caused only by voltage reduction can be calculated as follows:
- -
The minimum load change percentage
- -
The maximum load change percentage
Figure 2 shows the MAD, the maximum load change percentage, and the minimum load change percentage.
The maximum and minimum load change percentages can be used to estimate the minimum and maximum CVR values as follows:
If the calculated load changes, ∆
Pmin and ∆
Pmax, satisfy the filtering rules in Equations (7)–(9) and the calculated CVR factors,
CVRmin and
CVRmax, satisfy the rule in Equation (11), the CVR factor can be calculated from Equation (18). However, if any of the above values does not satisfy the filtering rule, it is excluded from the CVR factor calculation.
3. Measurement of Distribution System Data in the Korea Electric Power Corporation (KEPCO) System
3.1. Acquisition of Distribution Line Data
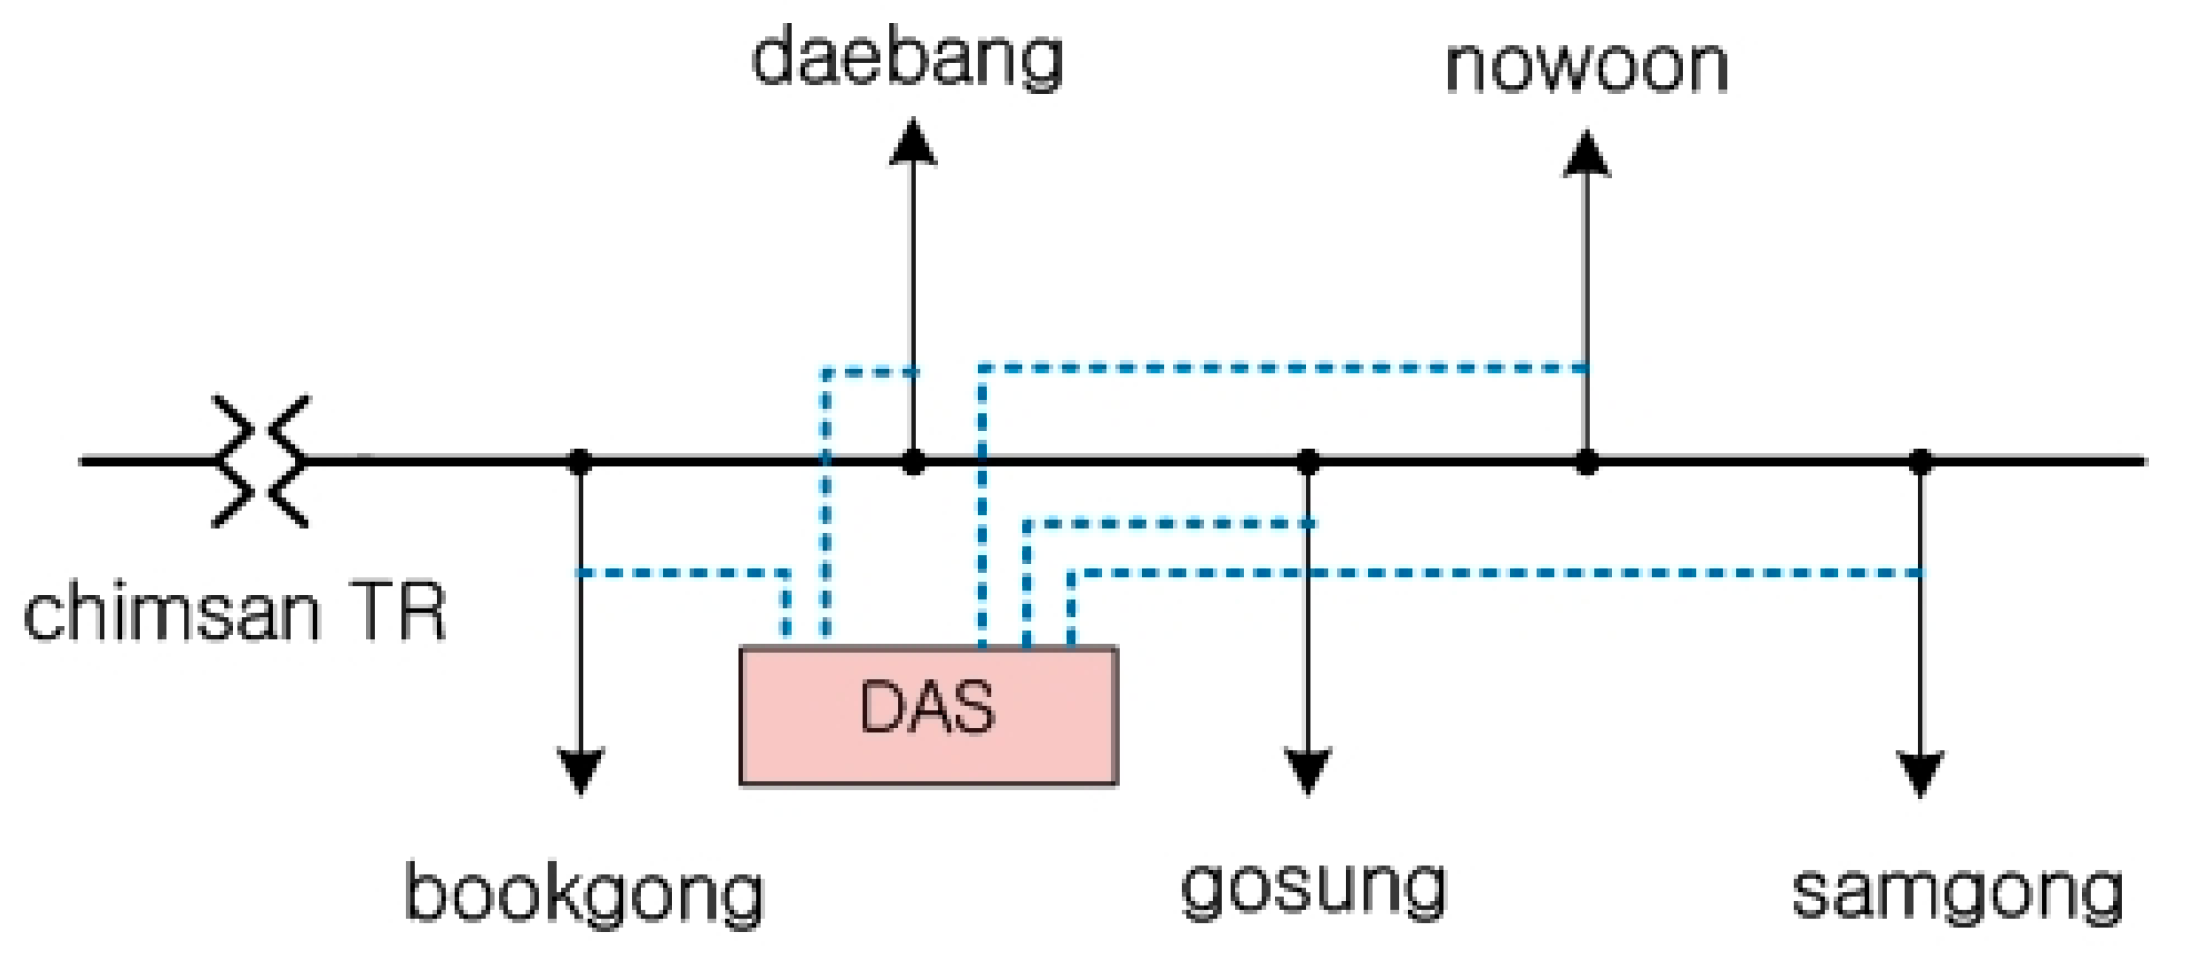
To estimate the CVR factor of each distribution line, a data acquisition system (DAS) was installed on the distribution lines, and the long-term voltage and load data were acquired from this system. The DAS used a sampling rate of 1 sample per second (sps). The sampling rate depends on the purpose of the data. For example, a very fast sampling rate is required for power quality analysis or protection. On the contrary, for the voltage regulation in a distribution system, an average value of several minutes is enough. The data sampling rate required for CVR factor estimation also varies depending on the method of analysis and scale of the load of the system. If the size of load is small and the sampling rate is low, it is not possible to accurately capture the load change at the moment of voltage reduction. Therefore, to estimate the CVR factor for a small load like a distribution line, a sampling rate, sufficiently faster than that used for the usual voltage regulation, is required.
In this study, data of the voltage, active power, and reactive power of the distribution lines connected to the Chimsan substation were acquired. The results of using this data in the CVR factor calculation are described in this chapter. The loads from this substation possess characteristics of residential and commercial areas.
Figure 3 shows the DAS and distribution lines of the Chimsan substation.
Table 1 shows the data acquisition line of the Chimsan substation and the data acquisition date.
3.2. Voltage and Load of the Chimsan Substation
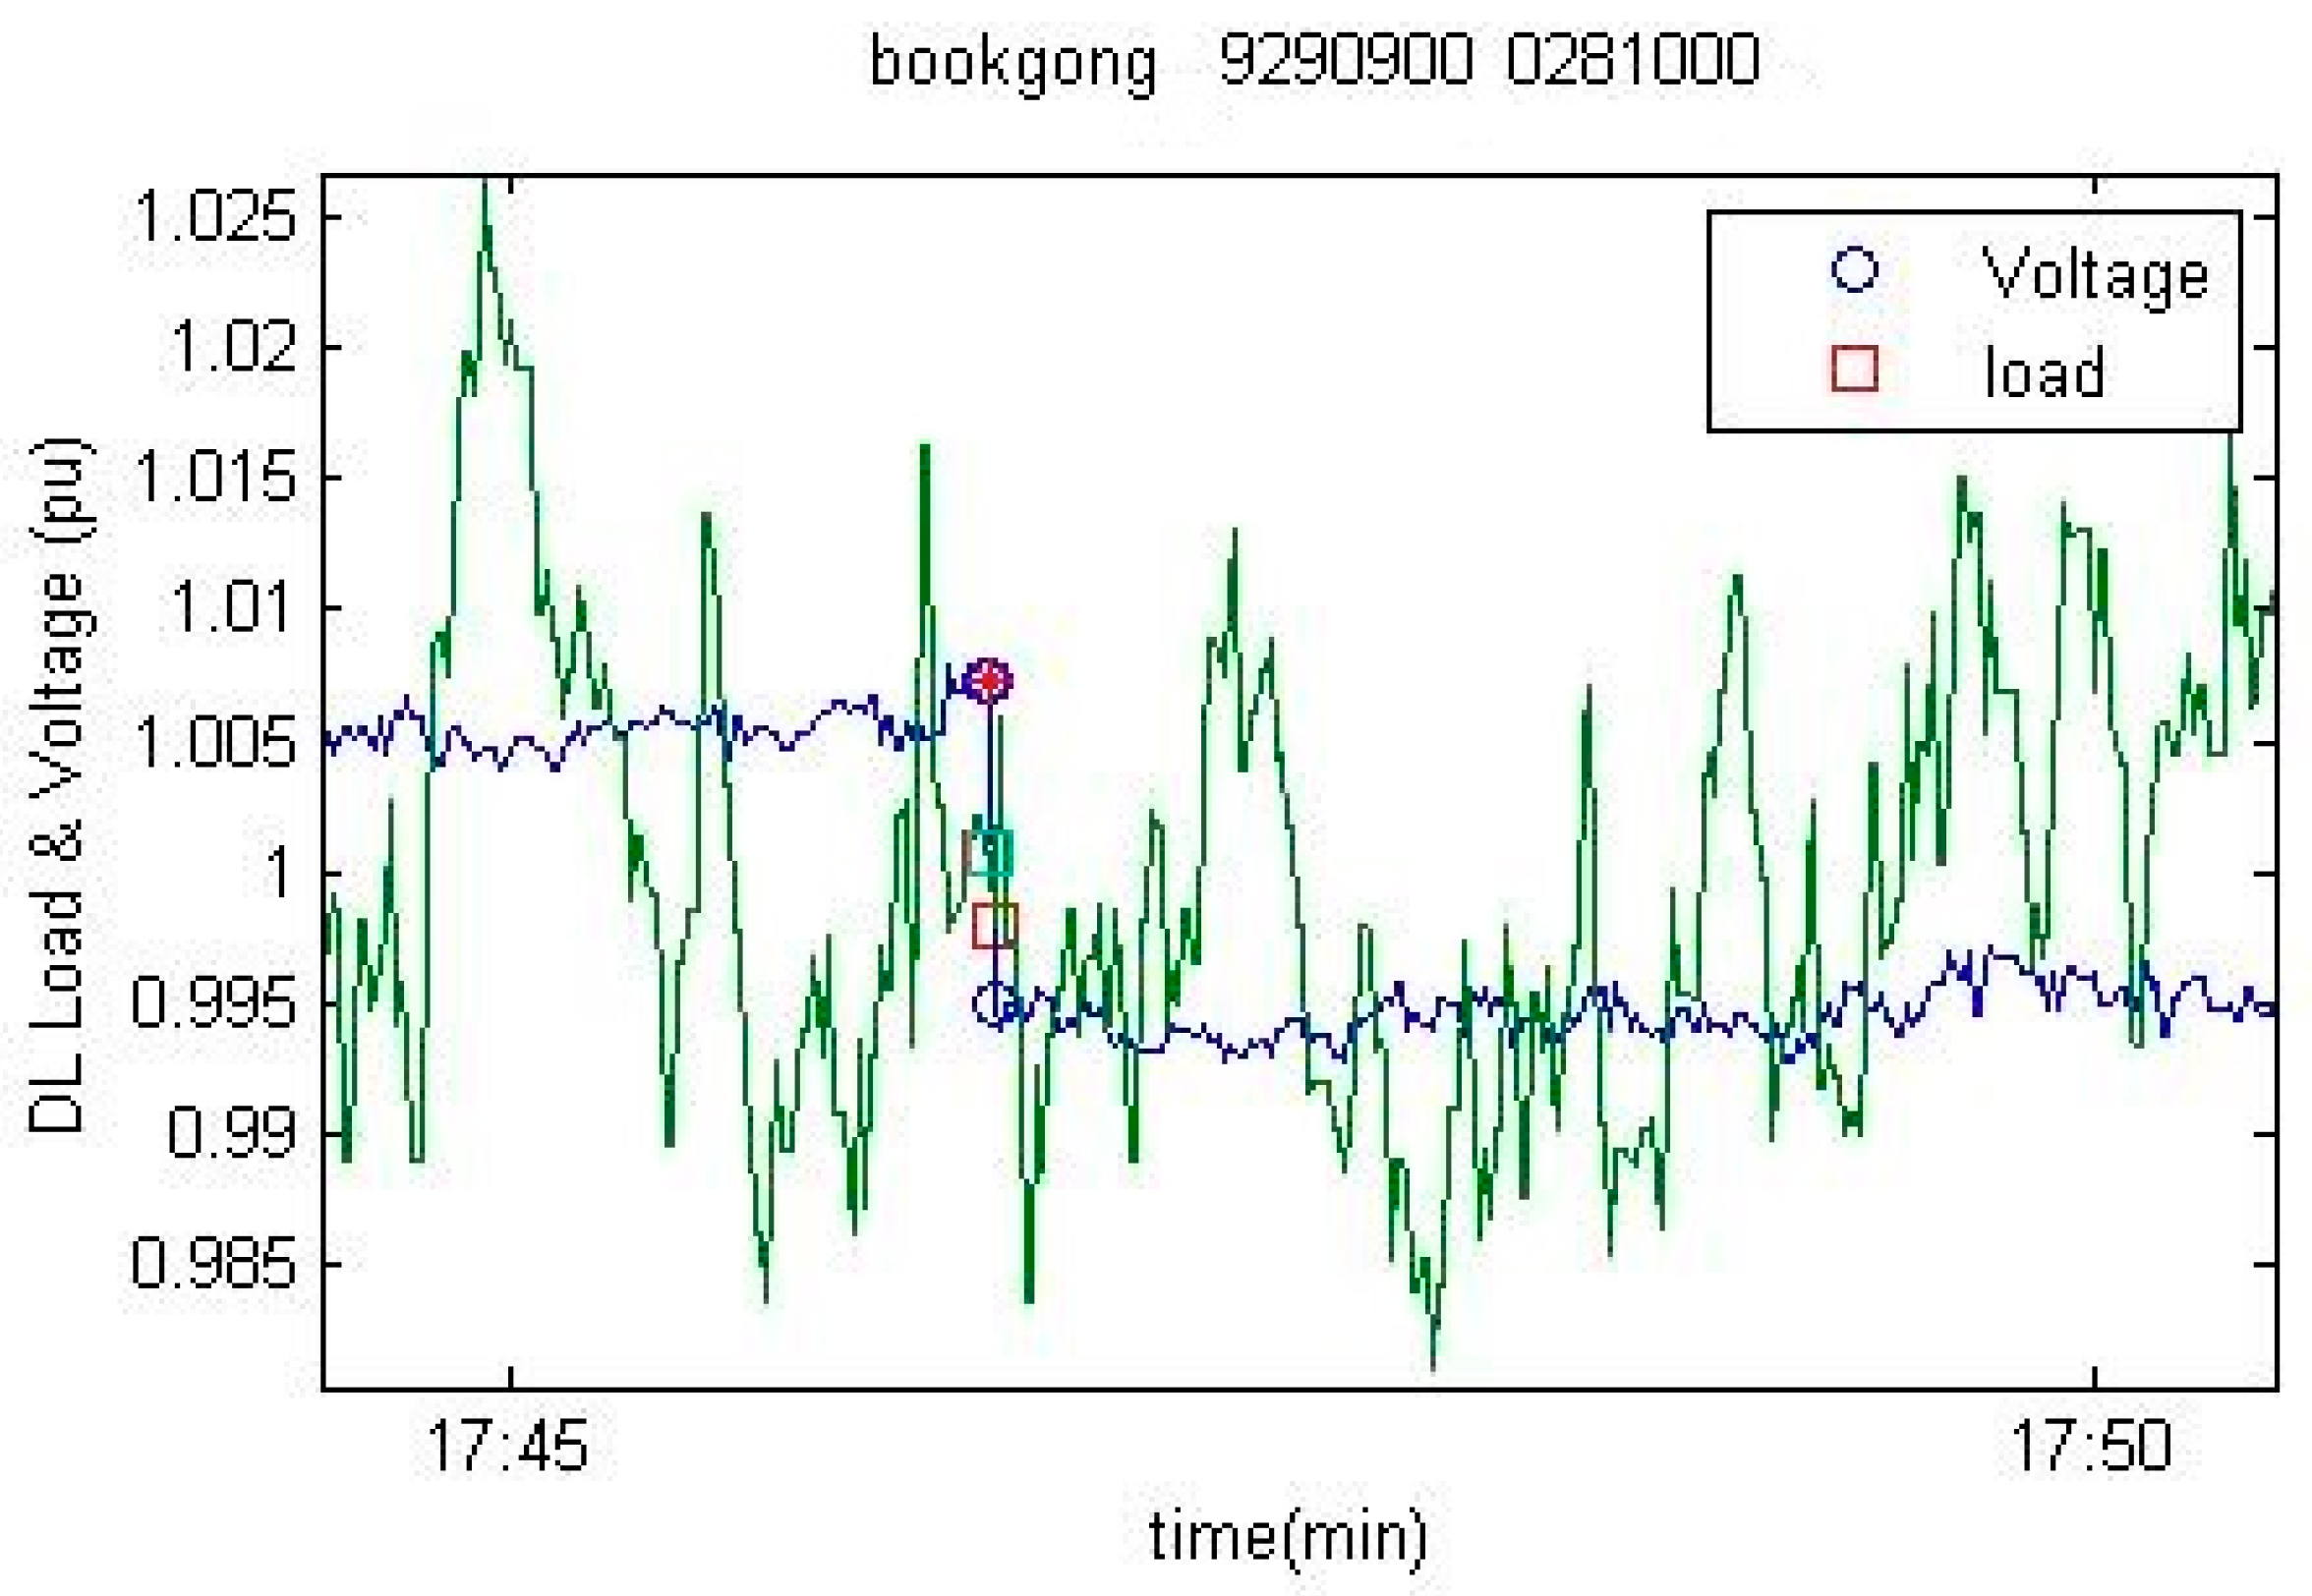
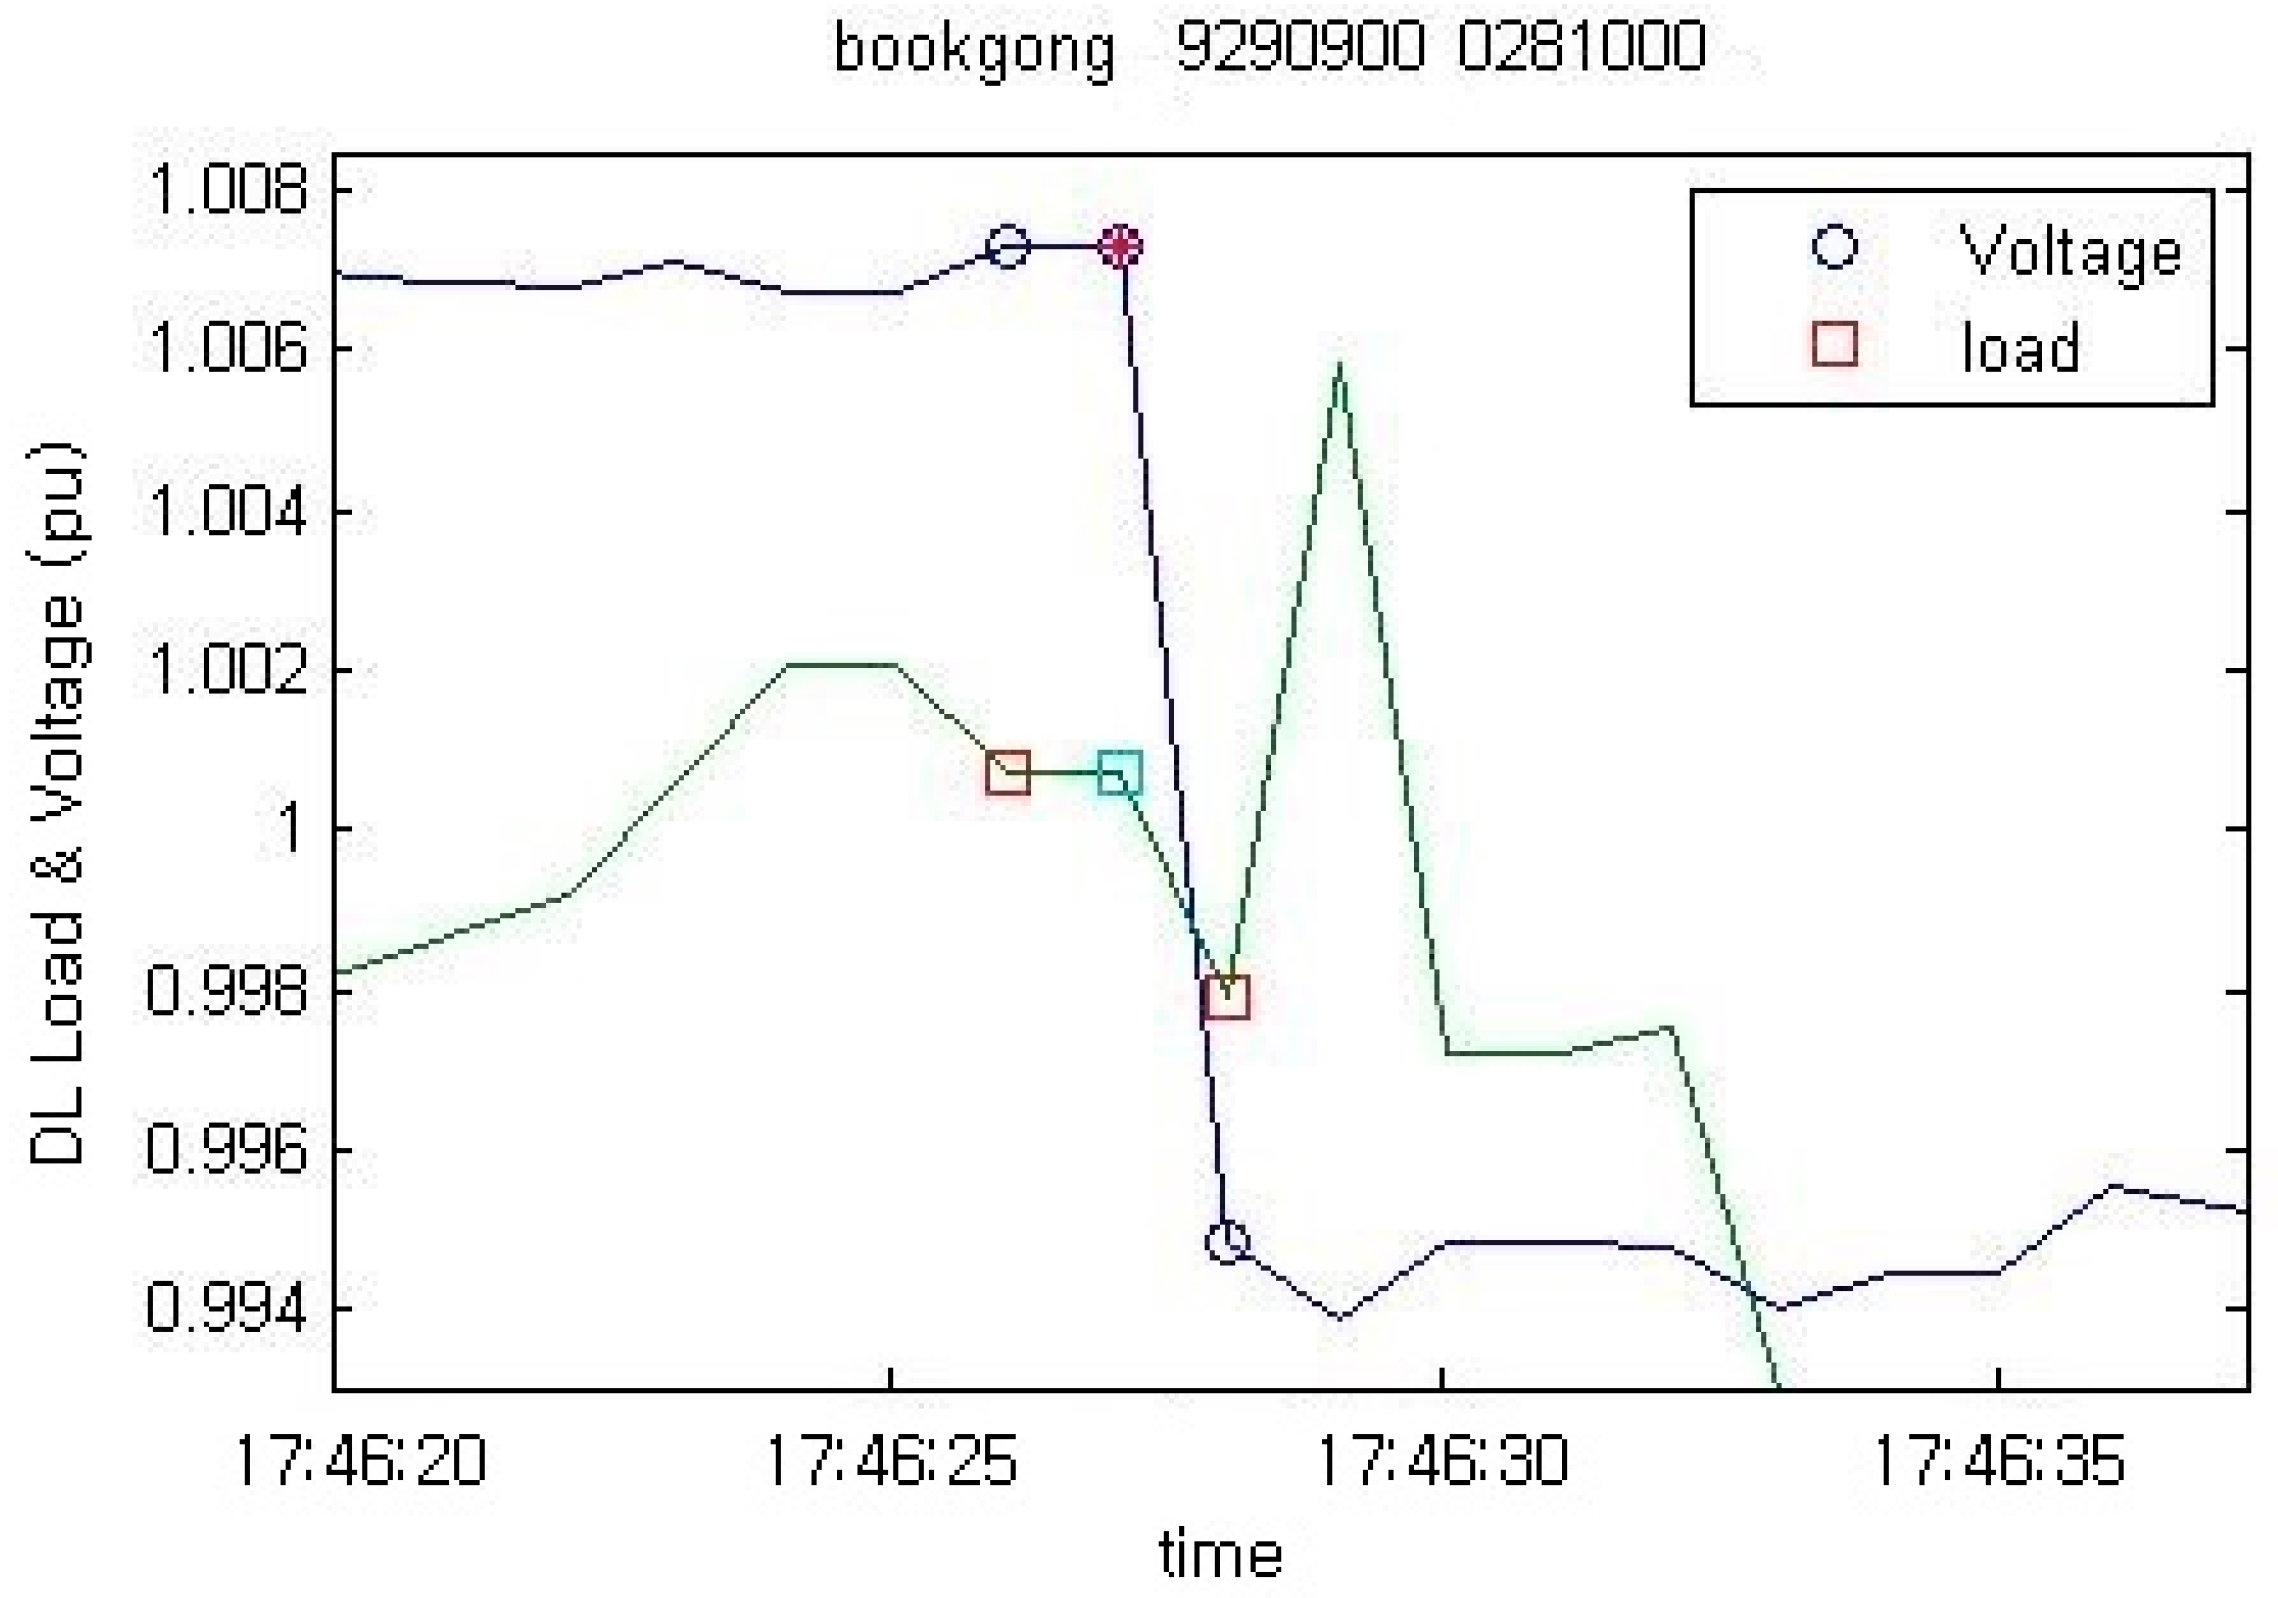
Figure 4 shows the load and voltage of the Bookgong distribution line (D/L) of the Chimsan substation, which were measured at a sampling rate of 1 sps. The normalized voltage and load values are shown in
Figure 4, where the green line represents load values and the blue line represents voltage values. Voltages before and after the tap change, which are indicated with circles, show a significant change. When the voltage changes, the direct method can be applied to the measured data to estimate the CVR factors.
Figure 5 shows an enlarged version of
Figure 4 around the tap change. As shown in the figure, voltage and load data at the moment of the tap change can be acquired from the distribution systems. Therefore, CVR factors can be estimated from the measured active and reactive power data of the distribution systems under normal operating conditions, devoid of any intentional voltage reduction test.
3.3. Data Processing
The amount of data acquired over a long period of time using a DAS for distribution lines can be very large. Performing iterative calculations on a large amount of data can require a considerable amount of computation time. Therefore, data acquired using the DAS were stored in a binary format so that it could be quickly called by the calculation program. In this study, these binary files were called to perform calculations of the CVR factors.
Several factors could be used to verify the acquired data. In this study, only measurement errors and data leakage were verified. No measurement errors were found in the acquired data because none of the data was significantly different from the standard deviation. However, leakage was found in the measured data because there were many parts in the data where timestamps were missing.
Approximately 60 data leakage cases occurred in 86,400 samples acquired during a single day. The leakage rate of the data acquired by the DAS was 0.07%. Because the leakage did not continuously occur, it did not significantly affect the estimation of the CVR factors. In addition, leaked data were replaced by the average value of the data before and after the loss.
For the DAS used in this study, the voltage, active power, and the reactive power data are stored in separate files with their own timestamp. Since voltage and load data immediately before and after the voltage reduction are used, time synchronization between voltage and load data is very important. If two measured data sets are not synchronized, the calculated CVR factor will contain a serious error. Therefore, time values had to be synchronized between the voltage and load data. In this study, the direct method was applied to the data after the preprocessing to check for time synchronization between the voltage and load data and correct it if necessary. Because there was a very large quantity of data, this time synchronization required a large amount of computation time. Therefore, when storing data in the DAS of the distribution lines, time synchronization must always be performed.
4. Estimation of CVR Factors of the KEPCO System
CVR factors were estimated by applying the direct method to the data acquired in the DAS installed on each distribution line of the Chimsan substation. Data before and after tap changes were extracted from each distribution line of the Chimsan substation. Voltage and load change percentages were calculated when signs of the extracted voltage and load changes were the same. In addition, CVR factors were calculated when the calculated values met the filtering conditions. CVR factors of the distribution lines were estimated by calculating the average of values that were within the CVR filtering range. The filtering conditions shown in
Table 2 were applied.
Table 3 summarizes the CVR factor calculated from the data measured from all D/Ls of the Chimsan substation by using the direct method. In the table, “
CVRp” represents average CVR factors, and “No” refers to the number of times that the filtering conditions were met. For example, filtering conditions were satisfied a total of 88 times in the Bookgong D/L measurement data during September 2016, and the representative CVR factor of this month was calculated to be 0.827. On the other hand, filtering conditions were not satisfied with regard to the measured data of the Nowoon D/L during June 2017, so CVR factors could not be estimated.
The Chimsan substation supplies electricity to metropolitan areas. The DAS data are acquired from D/Ls that feed both commercial and residential areas, which makes it difficult to distinguish the characteristics of the CVR factor between commercial and residential loads.
The average CVR factors were estimated to be in the range of 0.802–0.872 for all D/Ls of the Chimsan substation. The lowest mean CVR factor (0.802) was found in the Bookgong D/L, and the highest mean CVR factor (0.872) was found in the Samgong D/L. However, the estimated CVR factors were almost the same because D/Ls of the Chimsan substation are located in the same area and have similar load characteristics.
CVR factors were estimated by applying the MAD direct method to the data measured from all D/Ls of the Chimsan substation, and the mean CVR factor was calculated from these values. The filtering conditions of the MAD direct method are presented in
Table 4.
Table 5 lists CVR factors estimated by applying the MAD direct method to the DAS data acquired from the Chimsan substation. The CVR factors of the Nowoon D/L during June 2017 are not listed in the table because they could not be calculated due to a lack of data.
CVR factors were estimated to be in the range of 0.721–0.784 for all D/Ls of the Chimsan substation. In the MAD direct method, the lowest CVR factor was also found in the Bookgong D/L, and almost all other CVR factors were similar to those of the direct method. The MAD direct method produced lower CVR factor values than the direct method. Since many of the under-estimated cases have already been filtered by the filtering rule of Equations (5) and (6), the MAD direct method filtering conditions apply more to the over-estimated cases. Consequently, the MAD direct method produces lower values than the direct method. The introduction of MAD direct method would help prevent the overestimation of the effect of voltage reduction.
4.1. Seasonal Trend of Estimated CVR Factors
CVR factors of each season were estimated to analyze the effect of voltage reduction by season. The data measured at each D/L of the Chimsan substation can be classified by season as follows.
- -
September 2016: Early fall
- -
October 2016: Fall
- -
November 2016: Early winter
- -
February 2017: Winter
- -
June 2017: Early summer
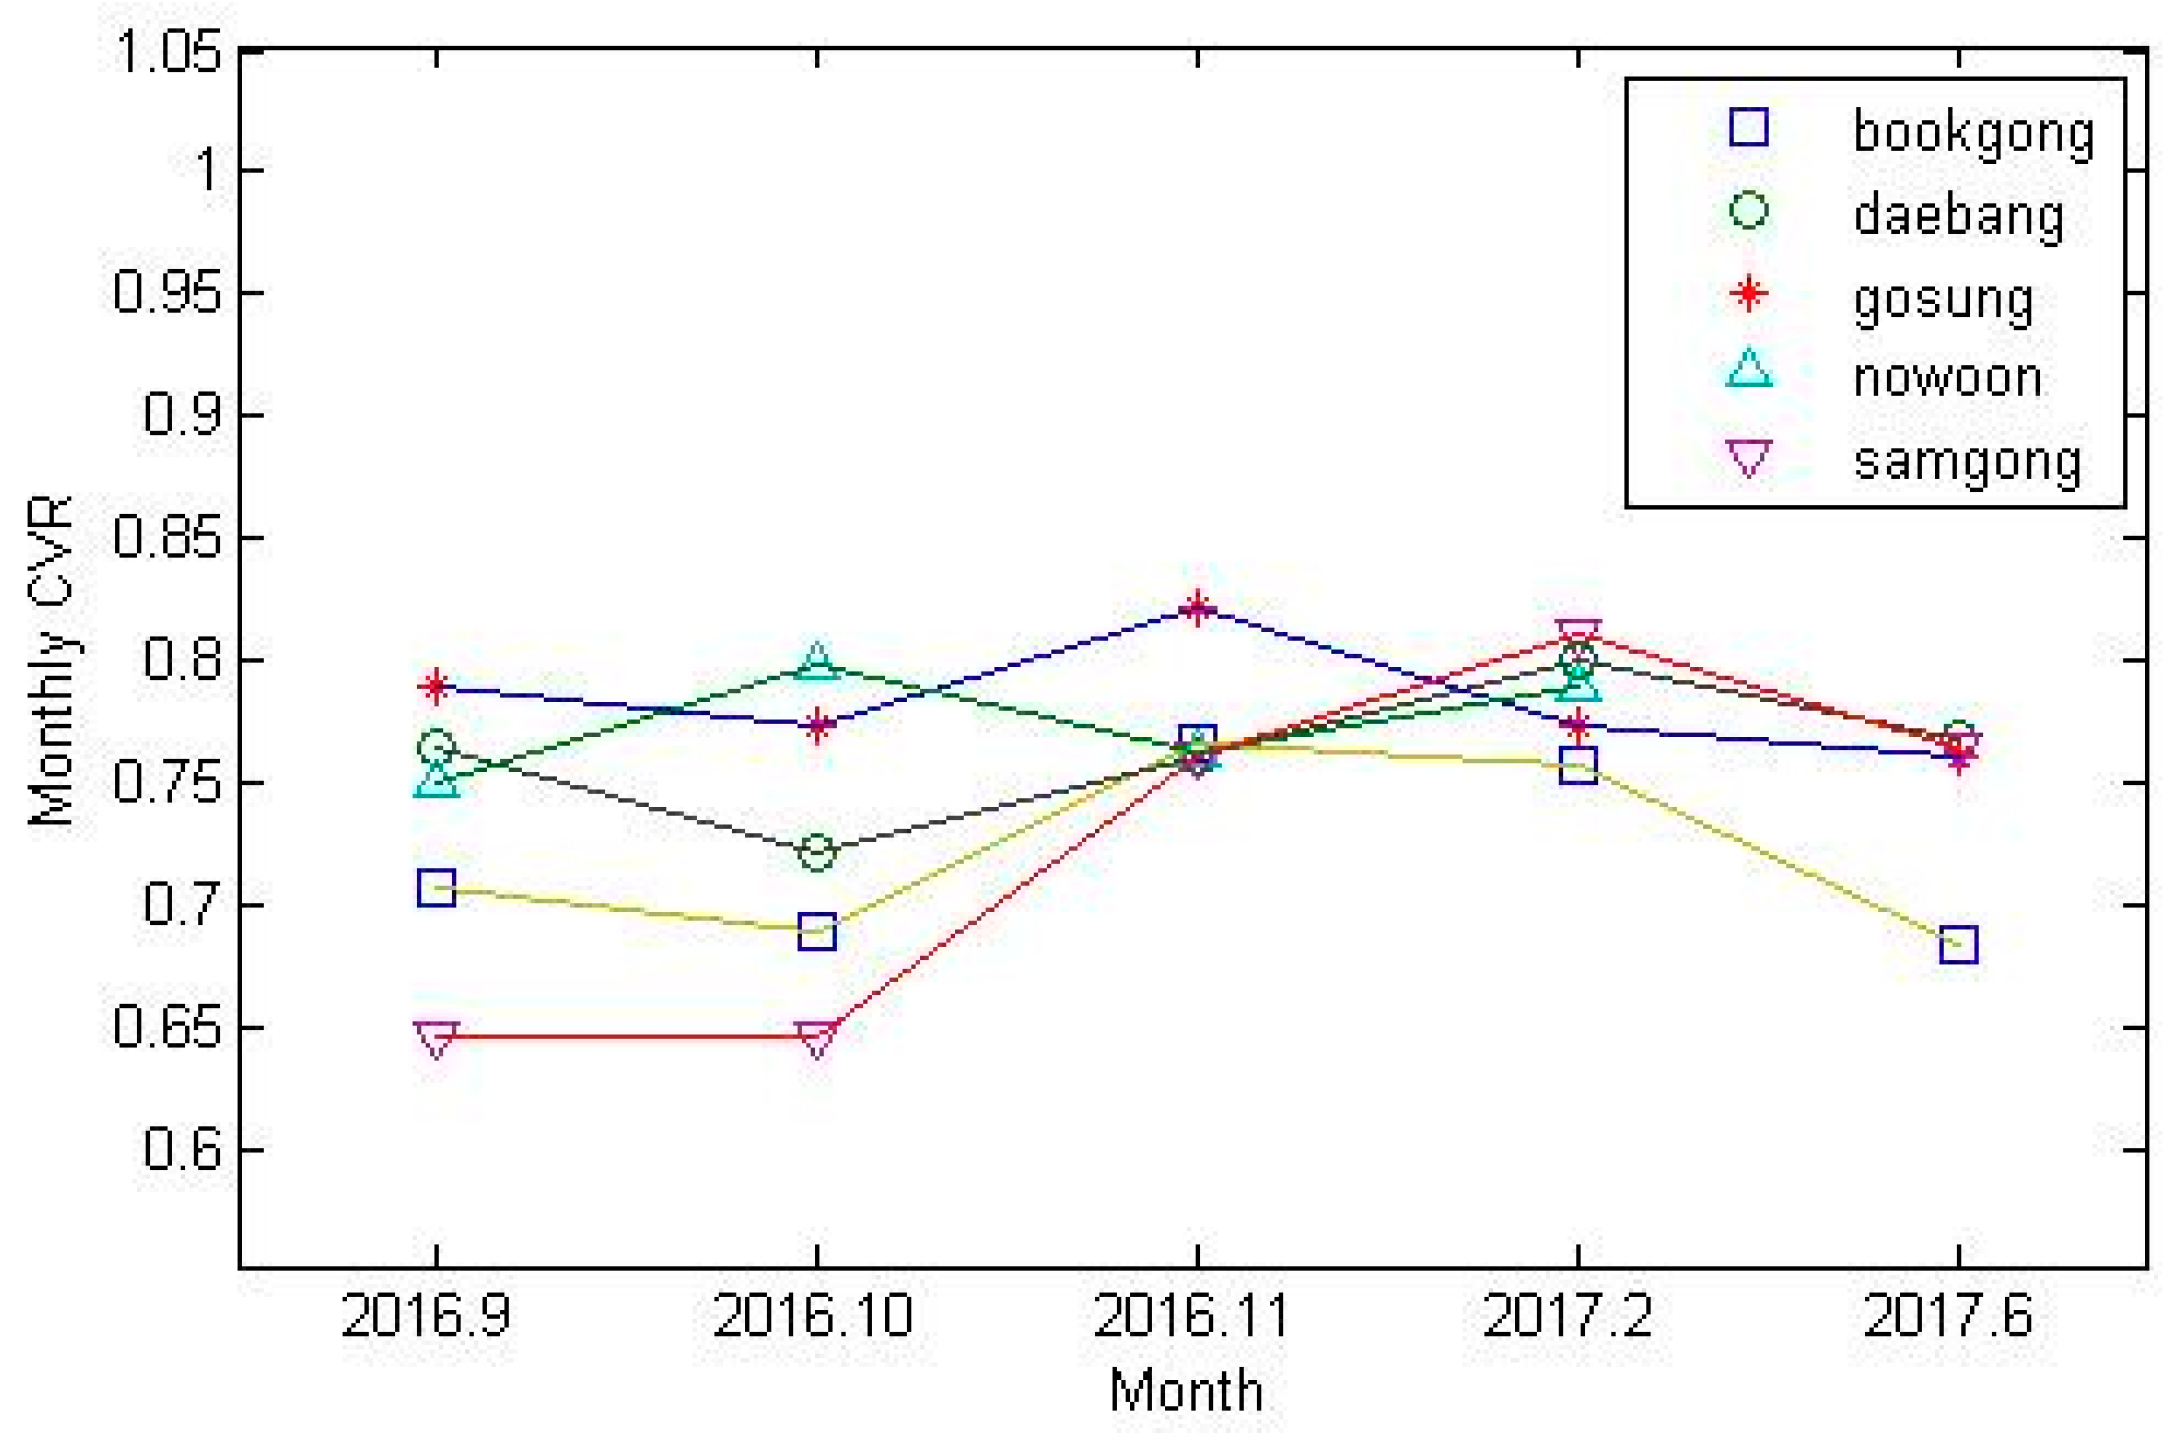
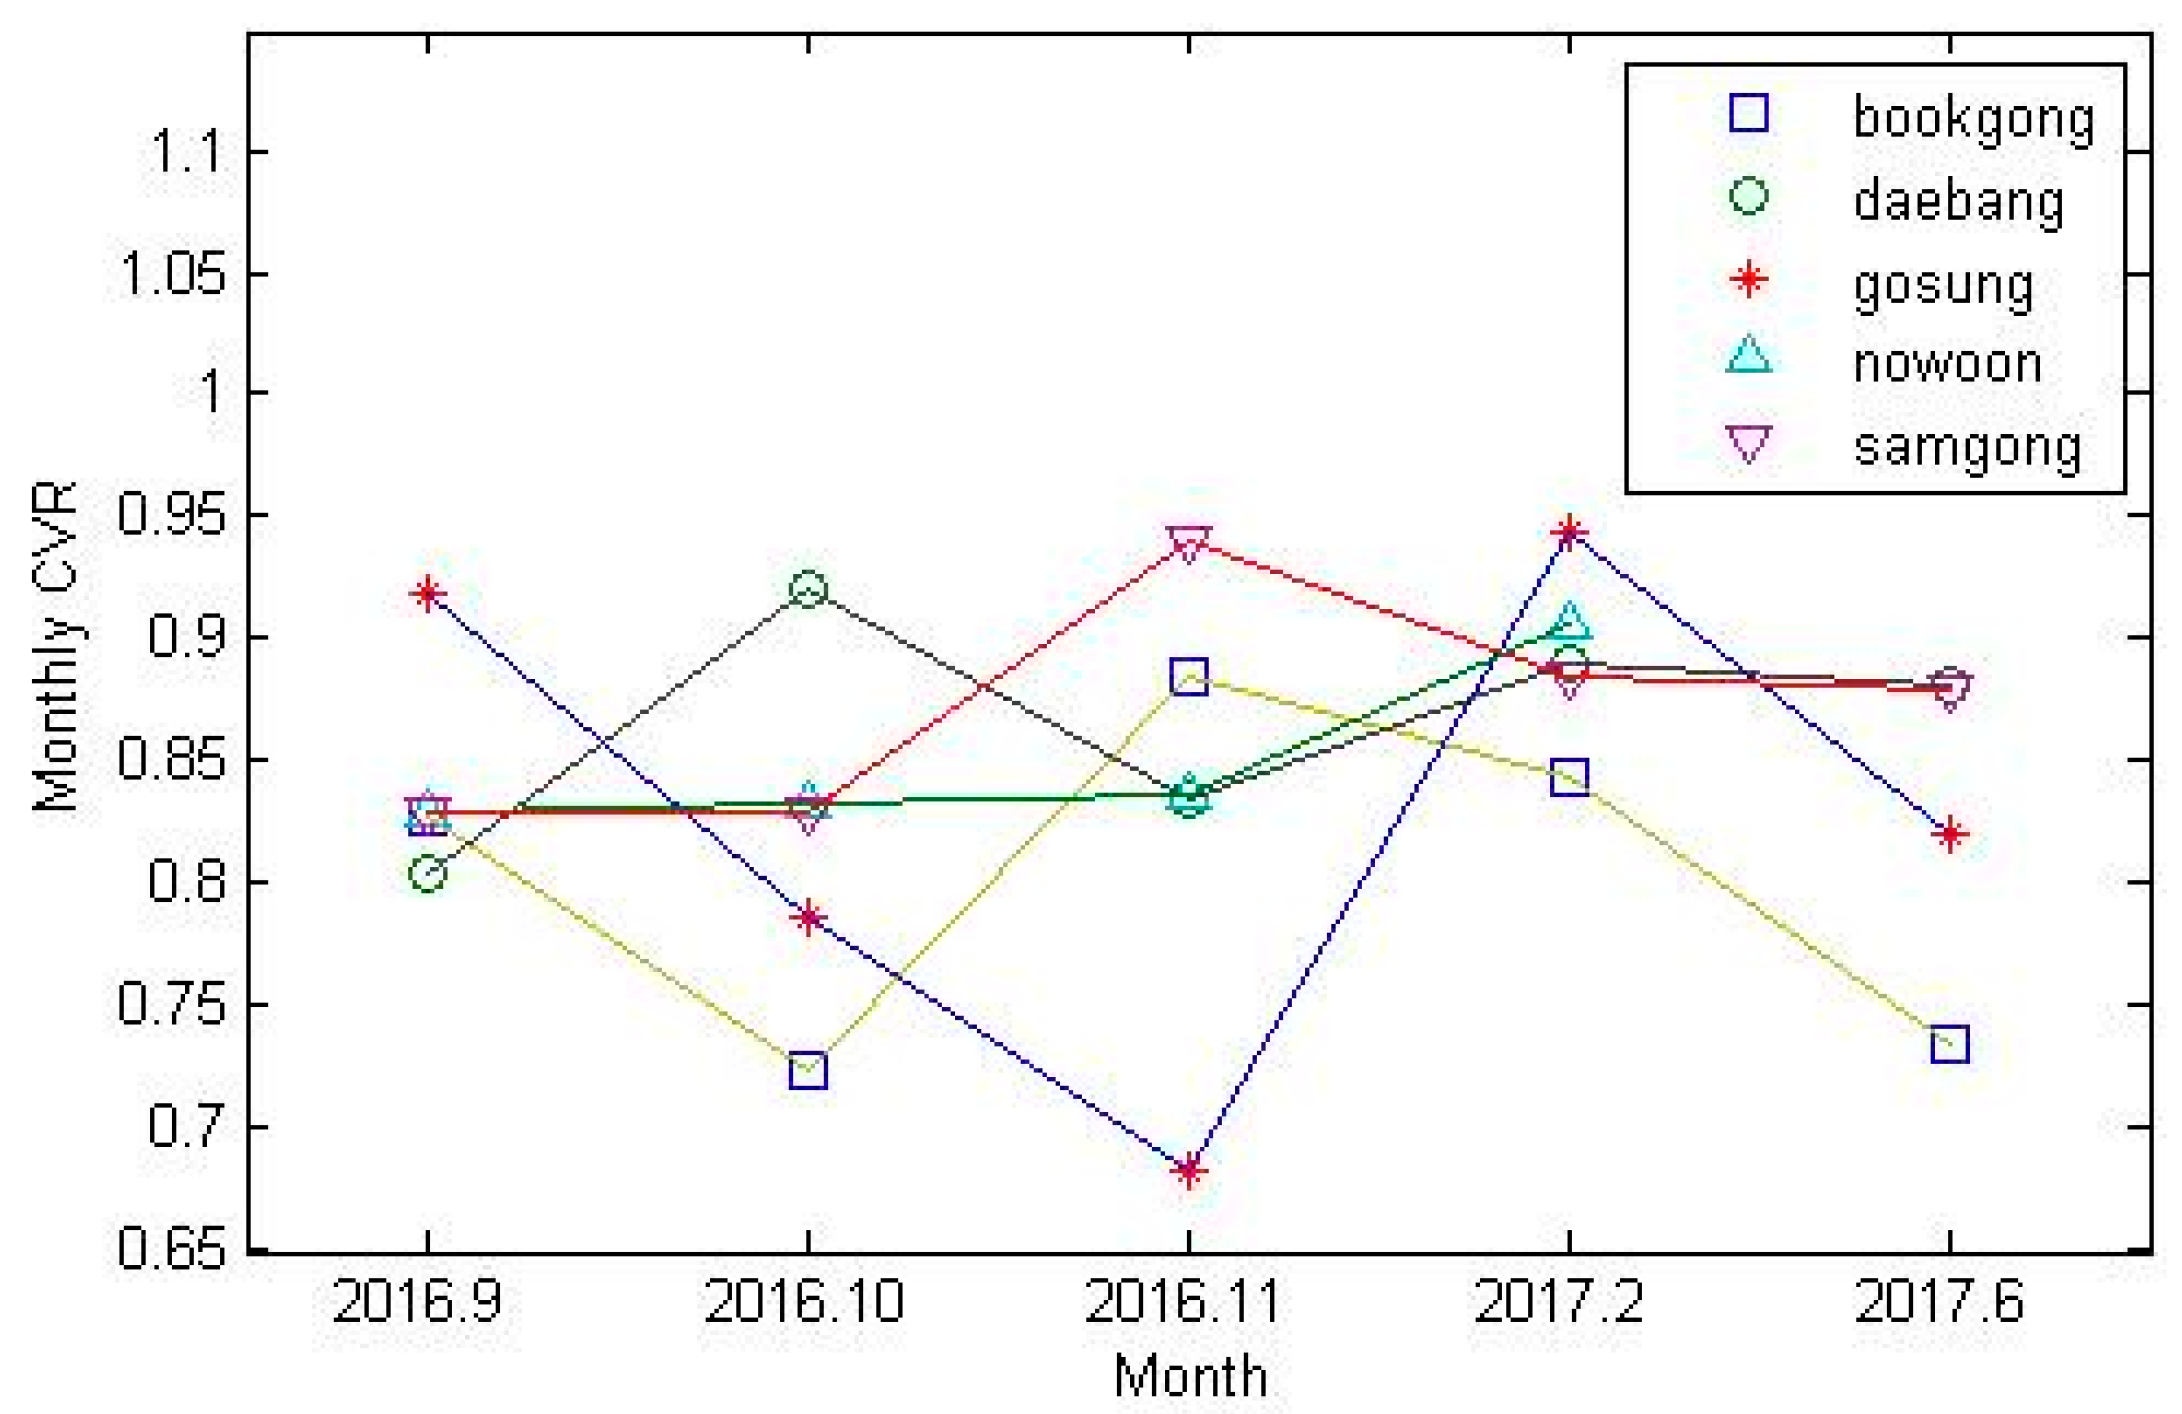
Figure 6 shows CVR factor values estimated by applying the direct method to the data measured for each D/L, and are further categorized by season.
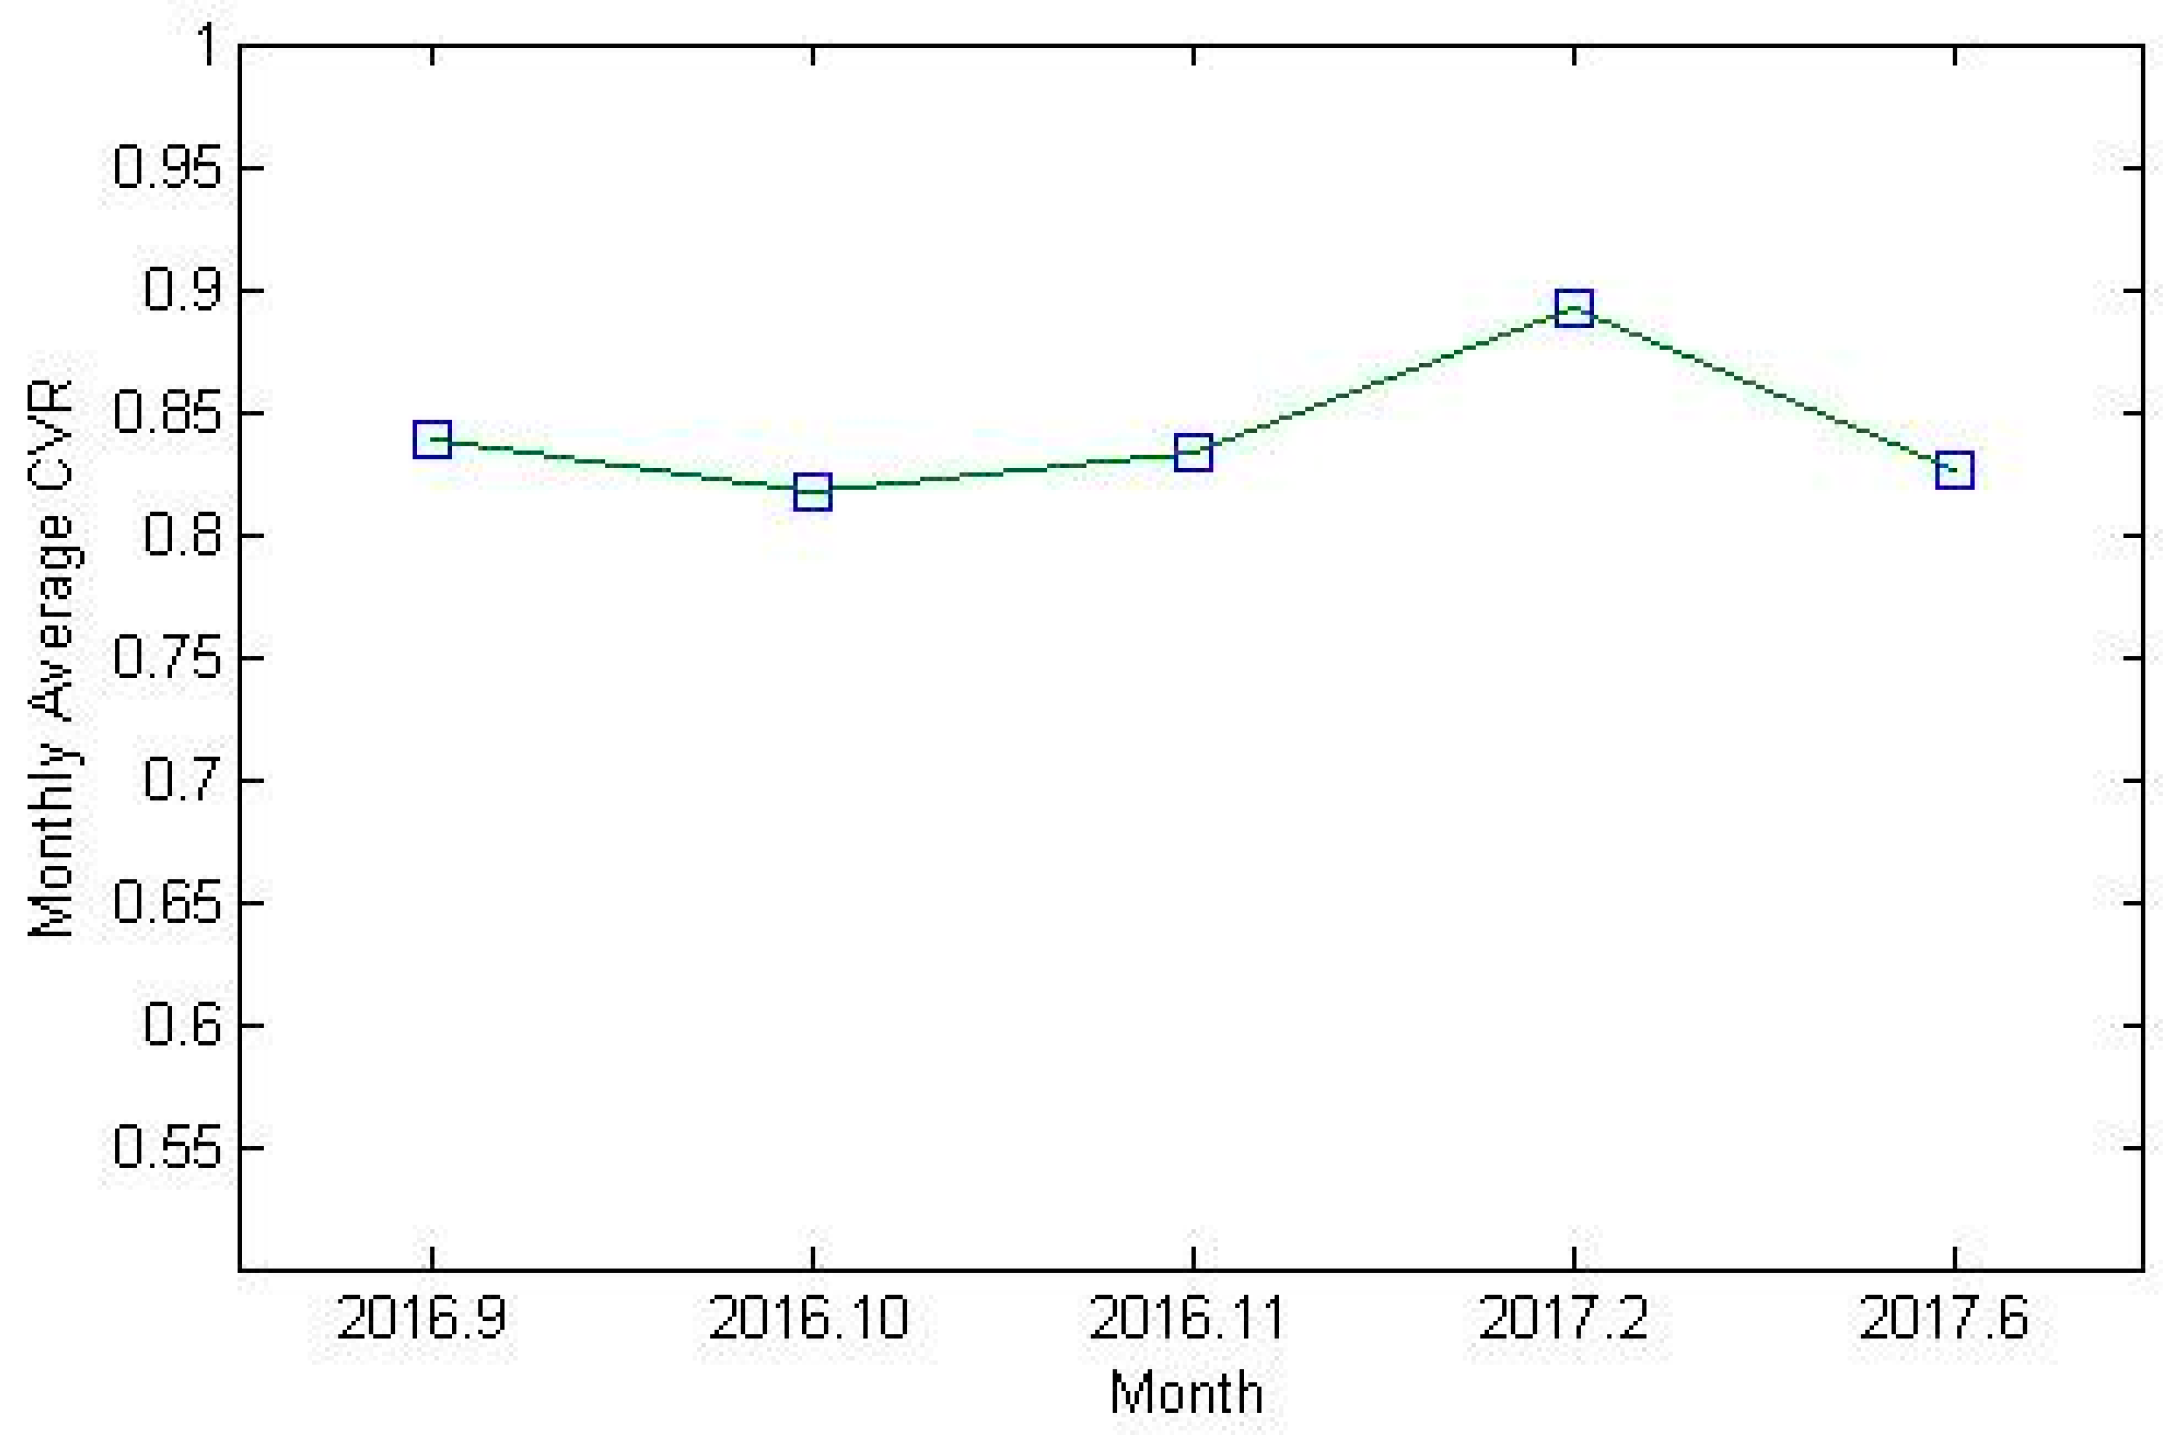
Figure 7 shows average CVR factors of all D/Ls classified by season. CVR factors were estimated to be high in early winter and winter, with the exception of the CVR factor of the Gosung D/L. The highest CVR factors were found in February 2017, which is considered winter.
Figure 8 shows CVR factor values estimated by season by applying the MAD direct method. CVR values were estimated to be high in early winter (November 2016) and winter (February 2017).
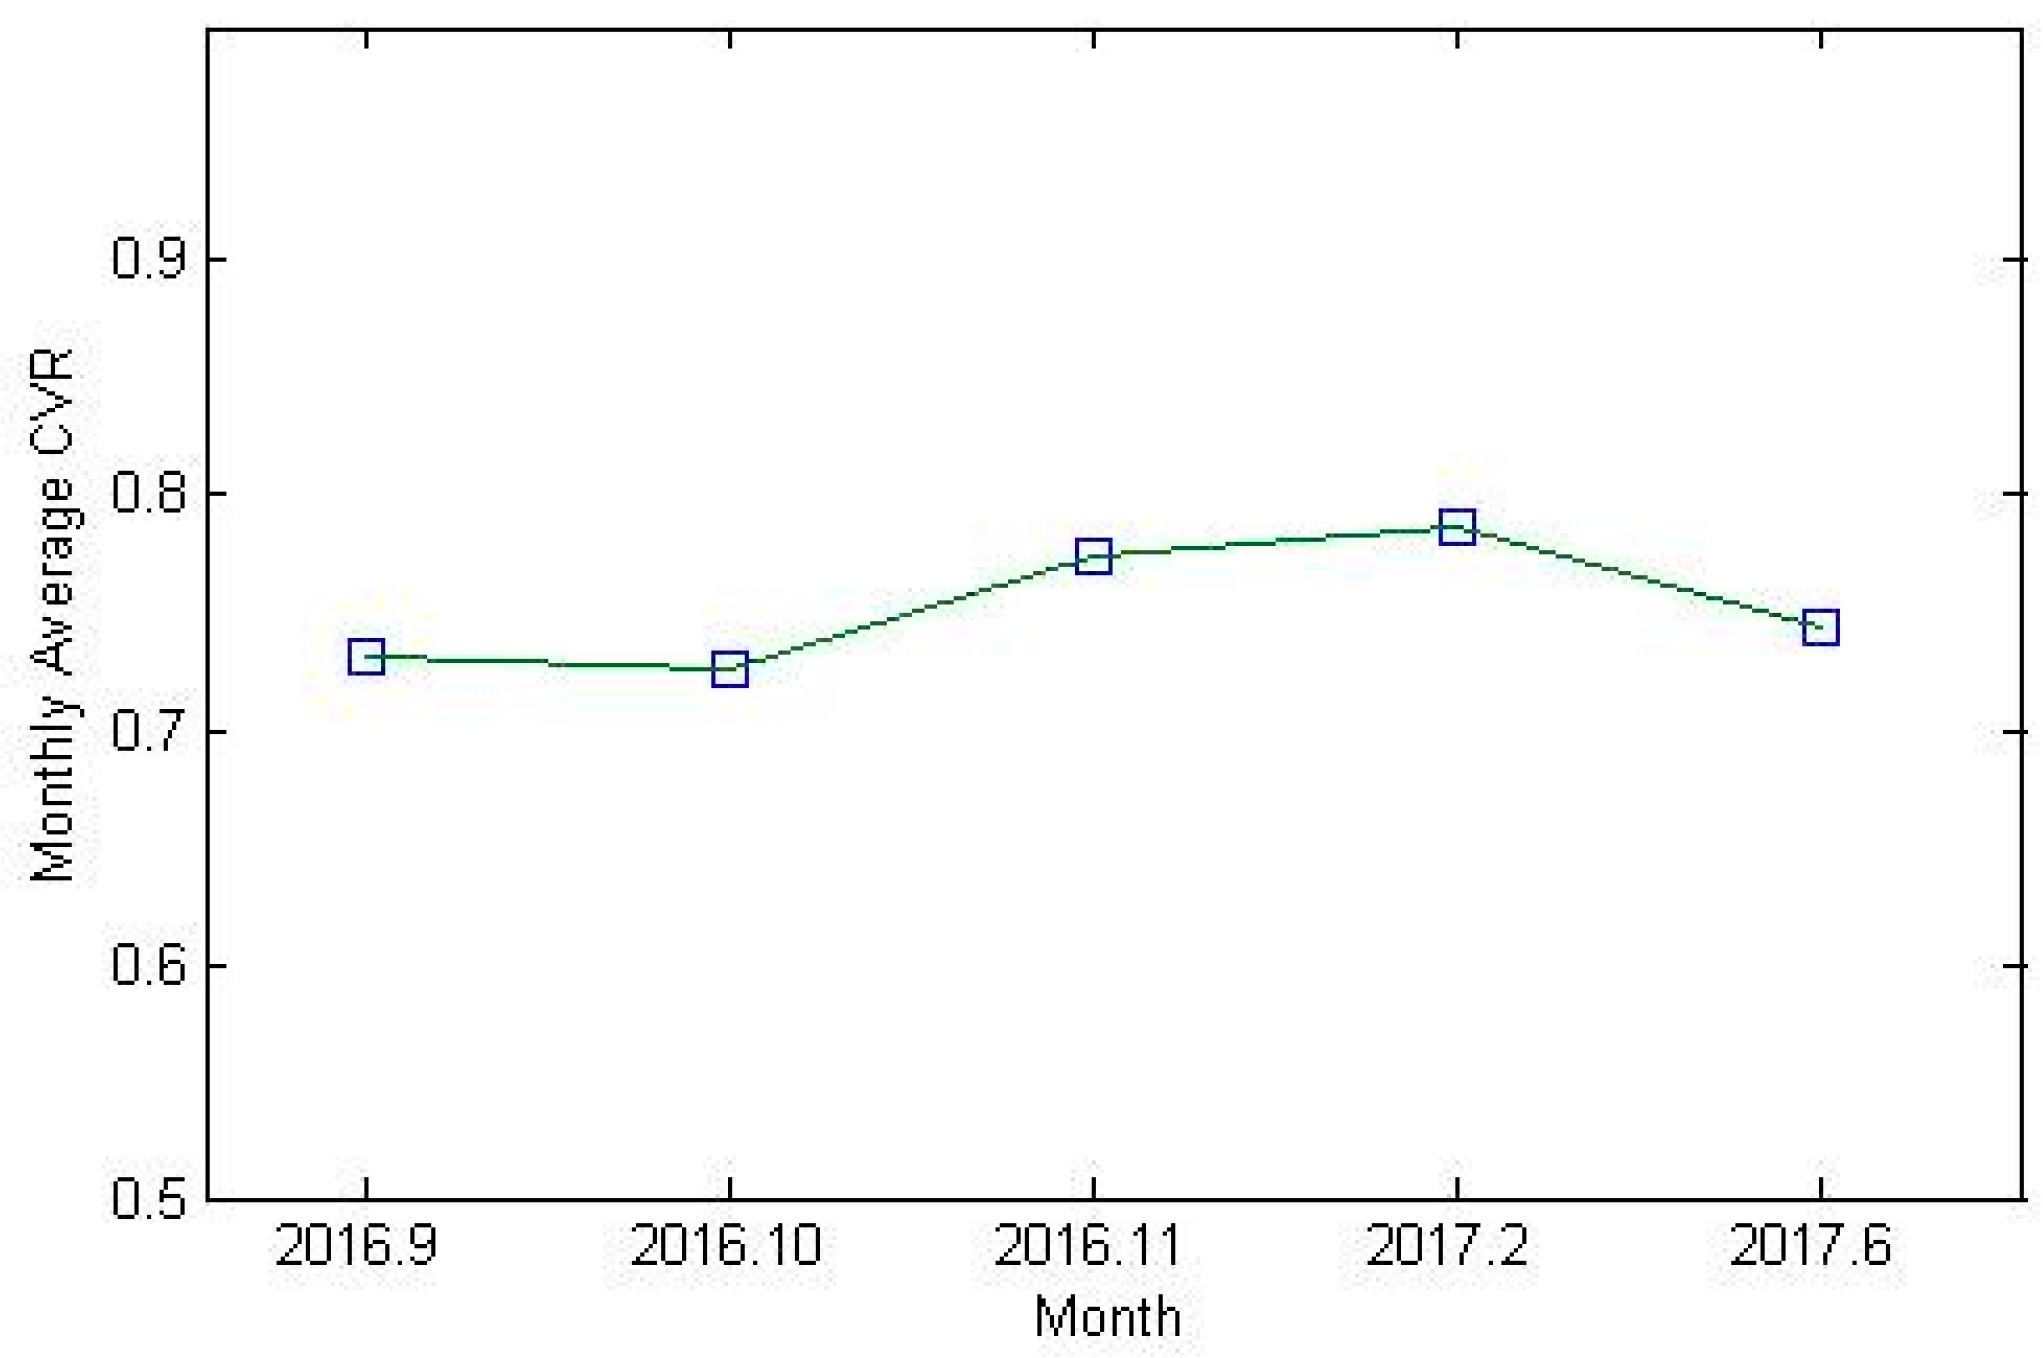
Figure 9 shows the mean CVR values of all D/Ls by season, which were calculated using CVR values estimated from applying the MAD direct method. In this case, the highest CVR factors were also found in winter (February 2017), followed by CVR factors of early winter (November 2016), as seen in the direct method case.
When analyzing data by season, CVR factors of early winter and winter were found to be higher than those of summer and fall. This is because many resistive loads such as heaters are used in the winter. Therefore, the largest voltage reduction effect is observed in winter when taking season into account.
4.2. Time Trend of the Estimated CVR Factors
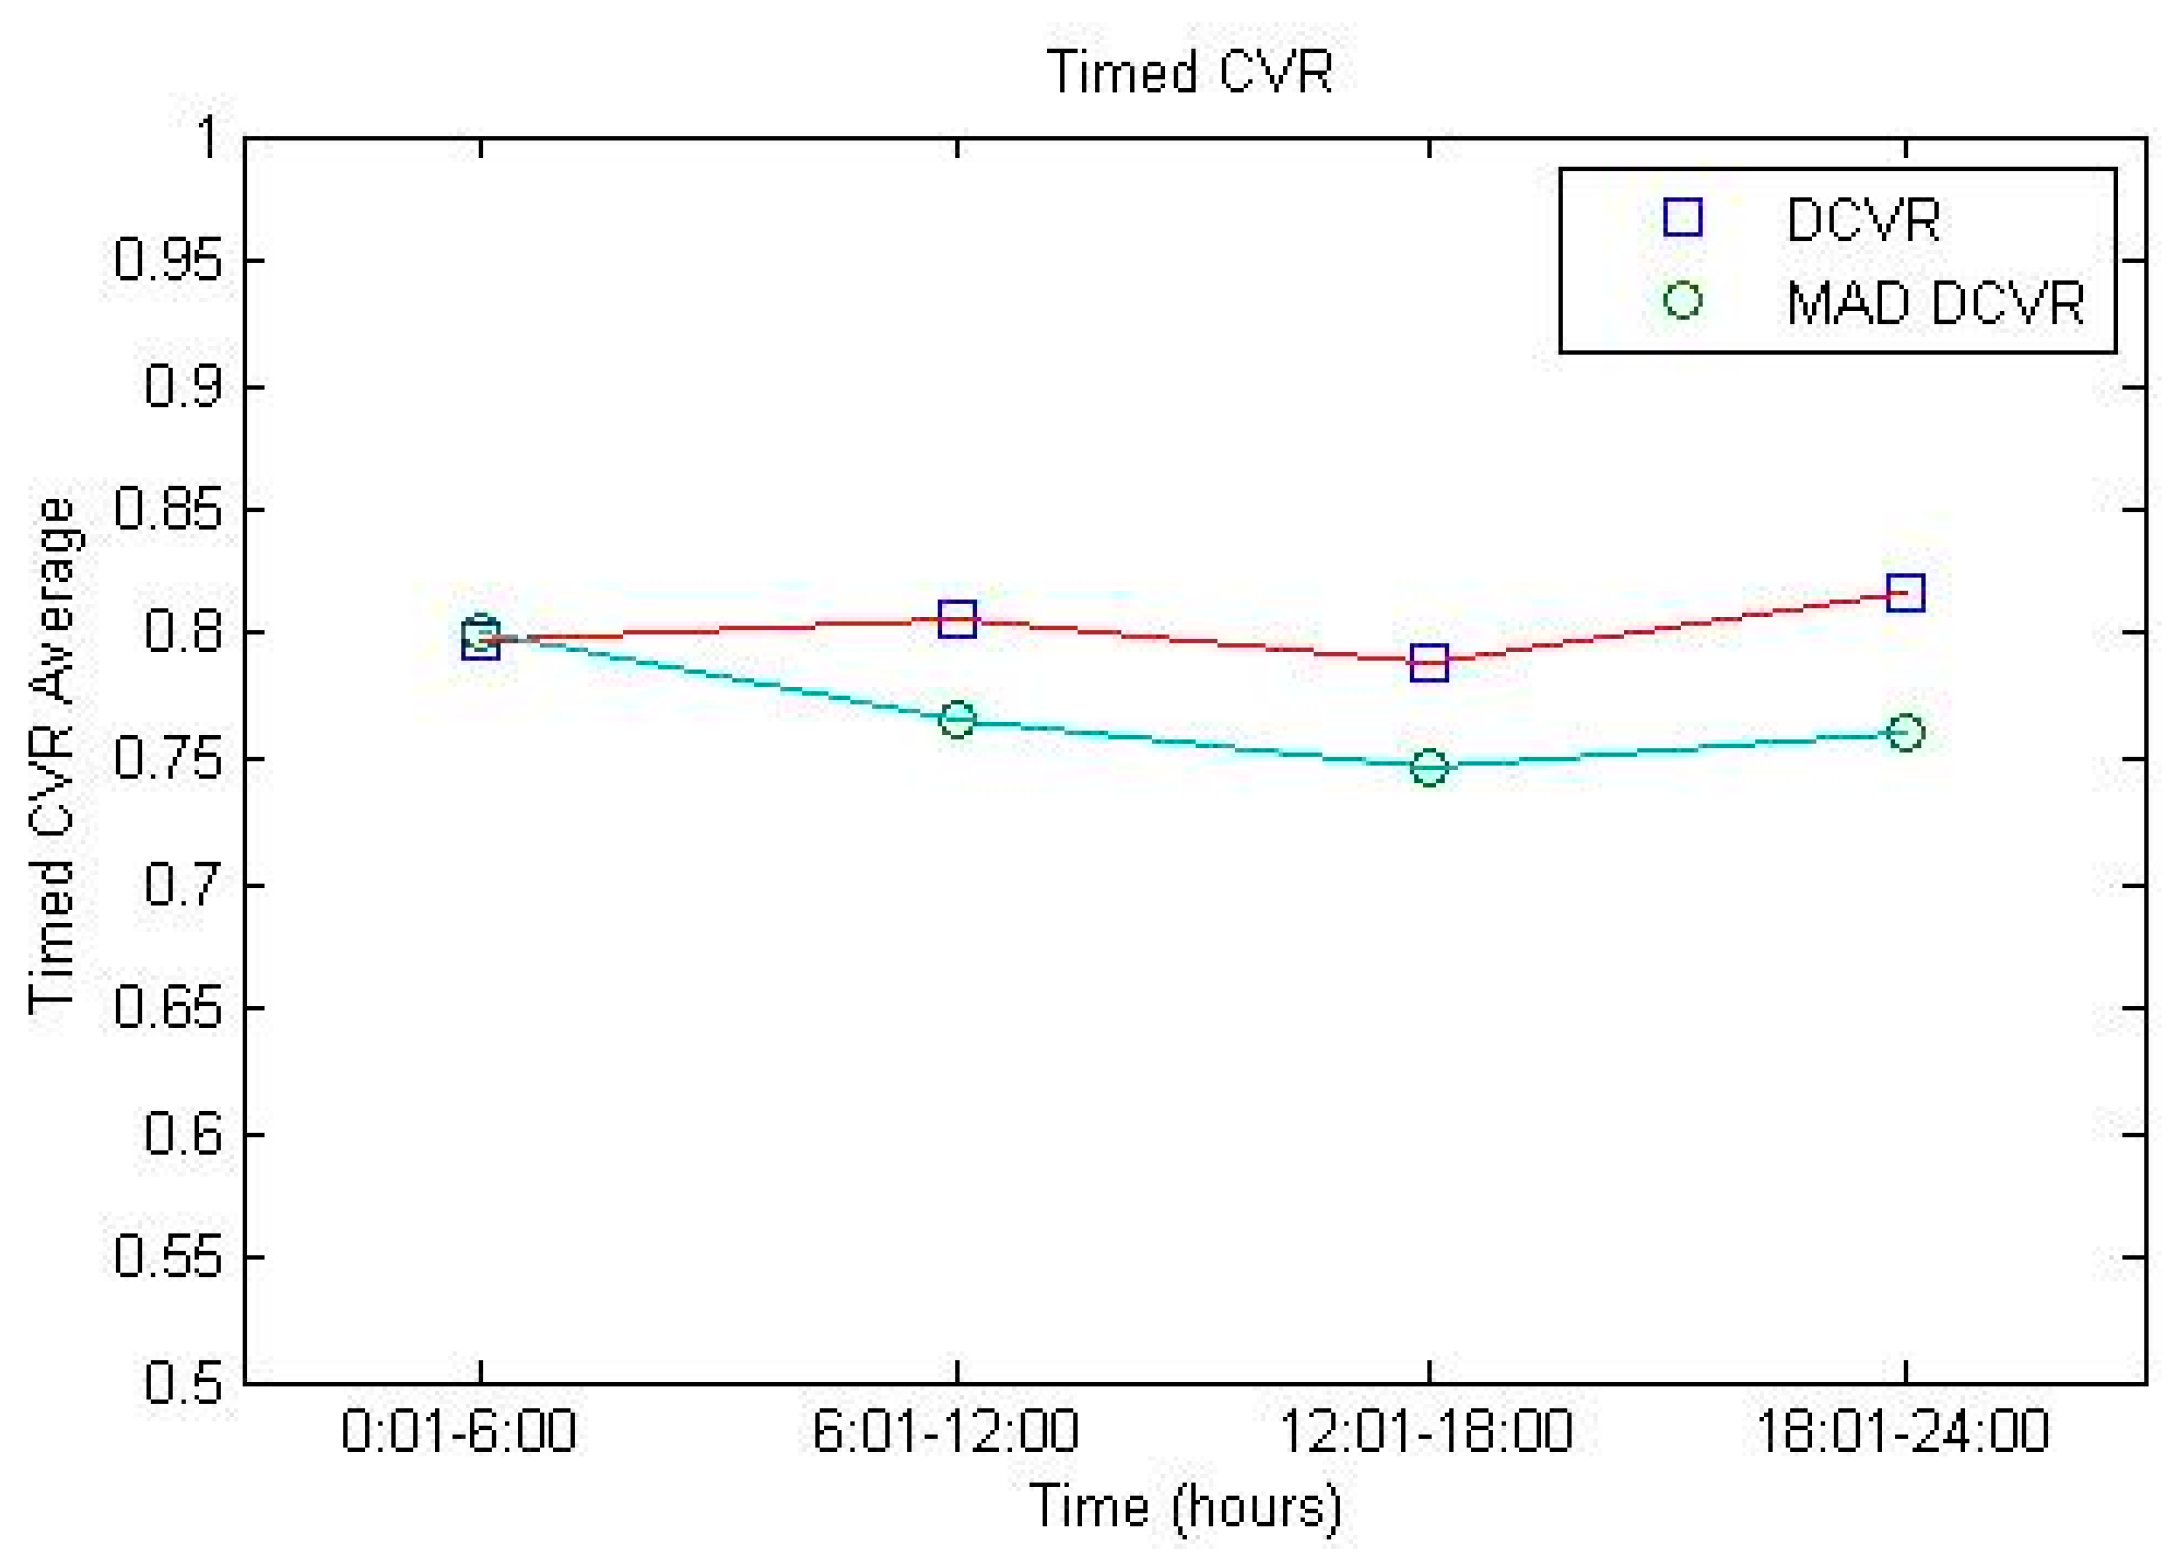
Figure 10 shows the mean CVR factors of all D/Ls of the Chimsan substation by time. The CVR factors estimated using both the direct method and MAD direct method were higher during the dawn and evening time periods than those during the daytime. This characteristic was due to larger heating loads at dawn and night.
4.3. Statistical Verification of the Estimated CVR Factors
Estimating the CVR factors for voltage reduction requires sensitive numerical calculations. In this study, many CVR factors were estimated from the DAS data of each D/L. Then, their mean was calculated to determine the representative CVR factor of each D/L.
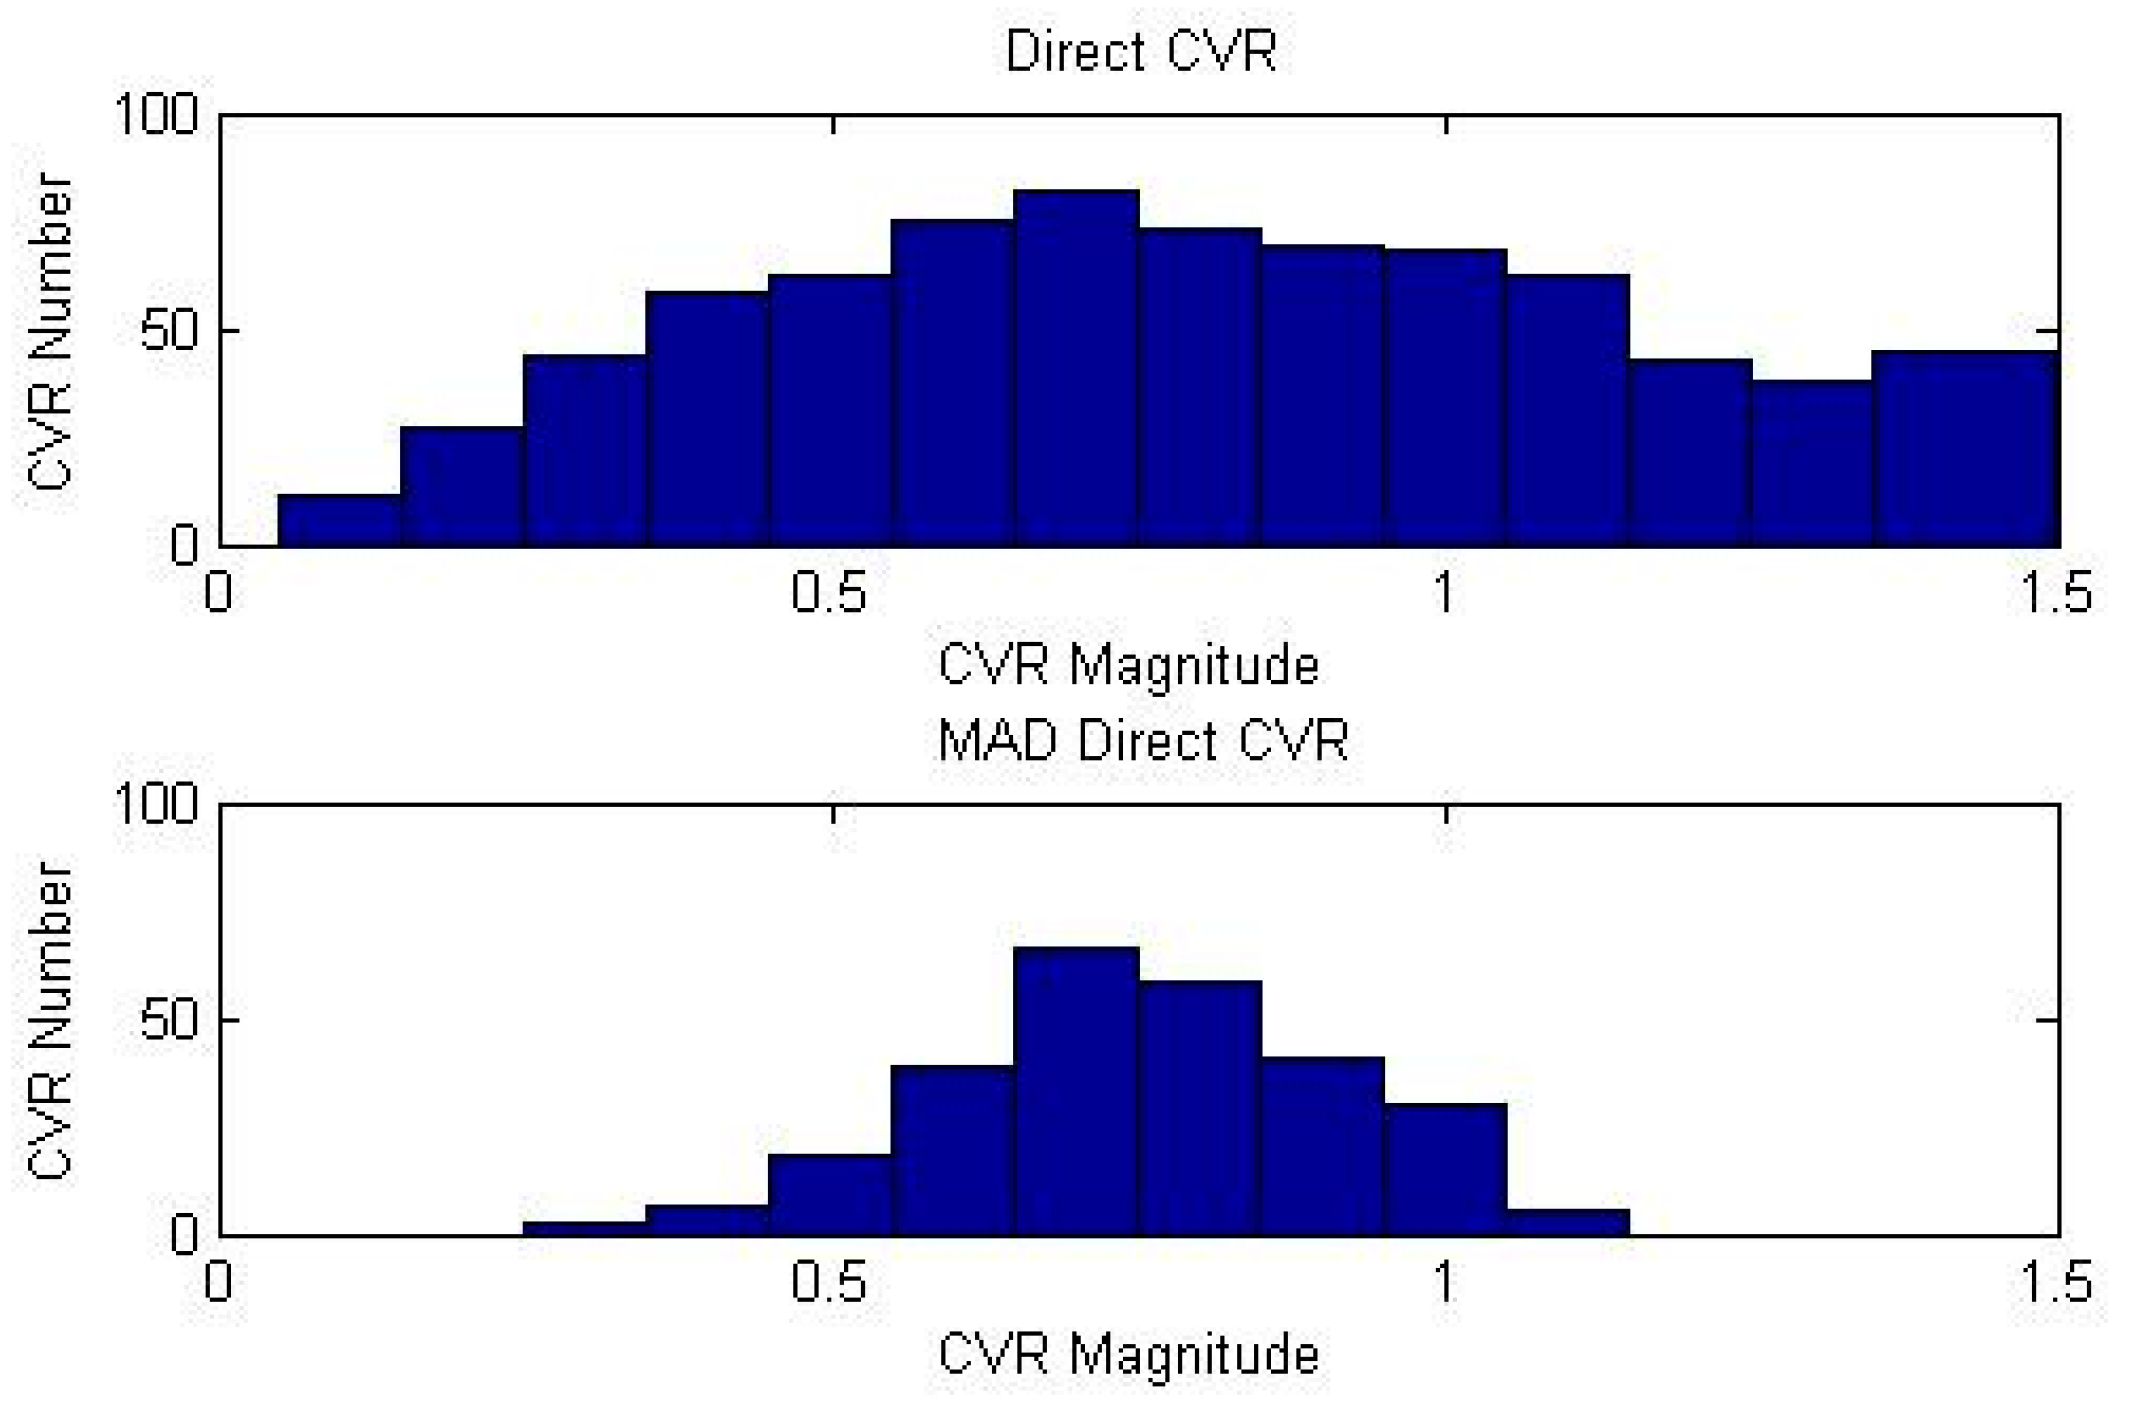
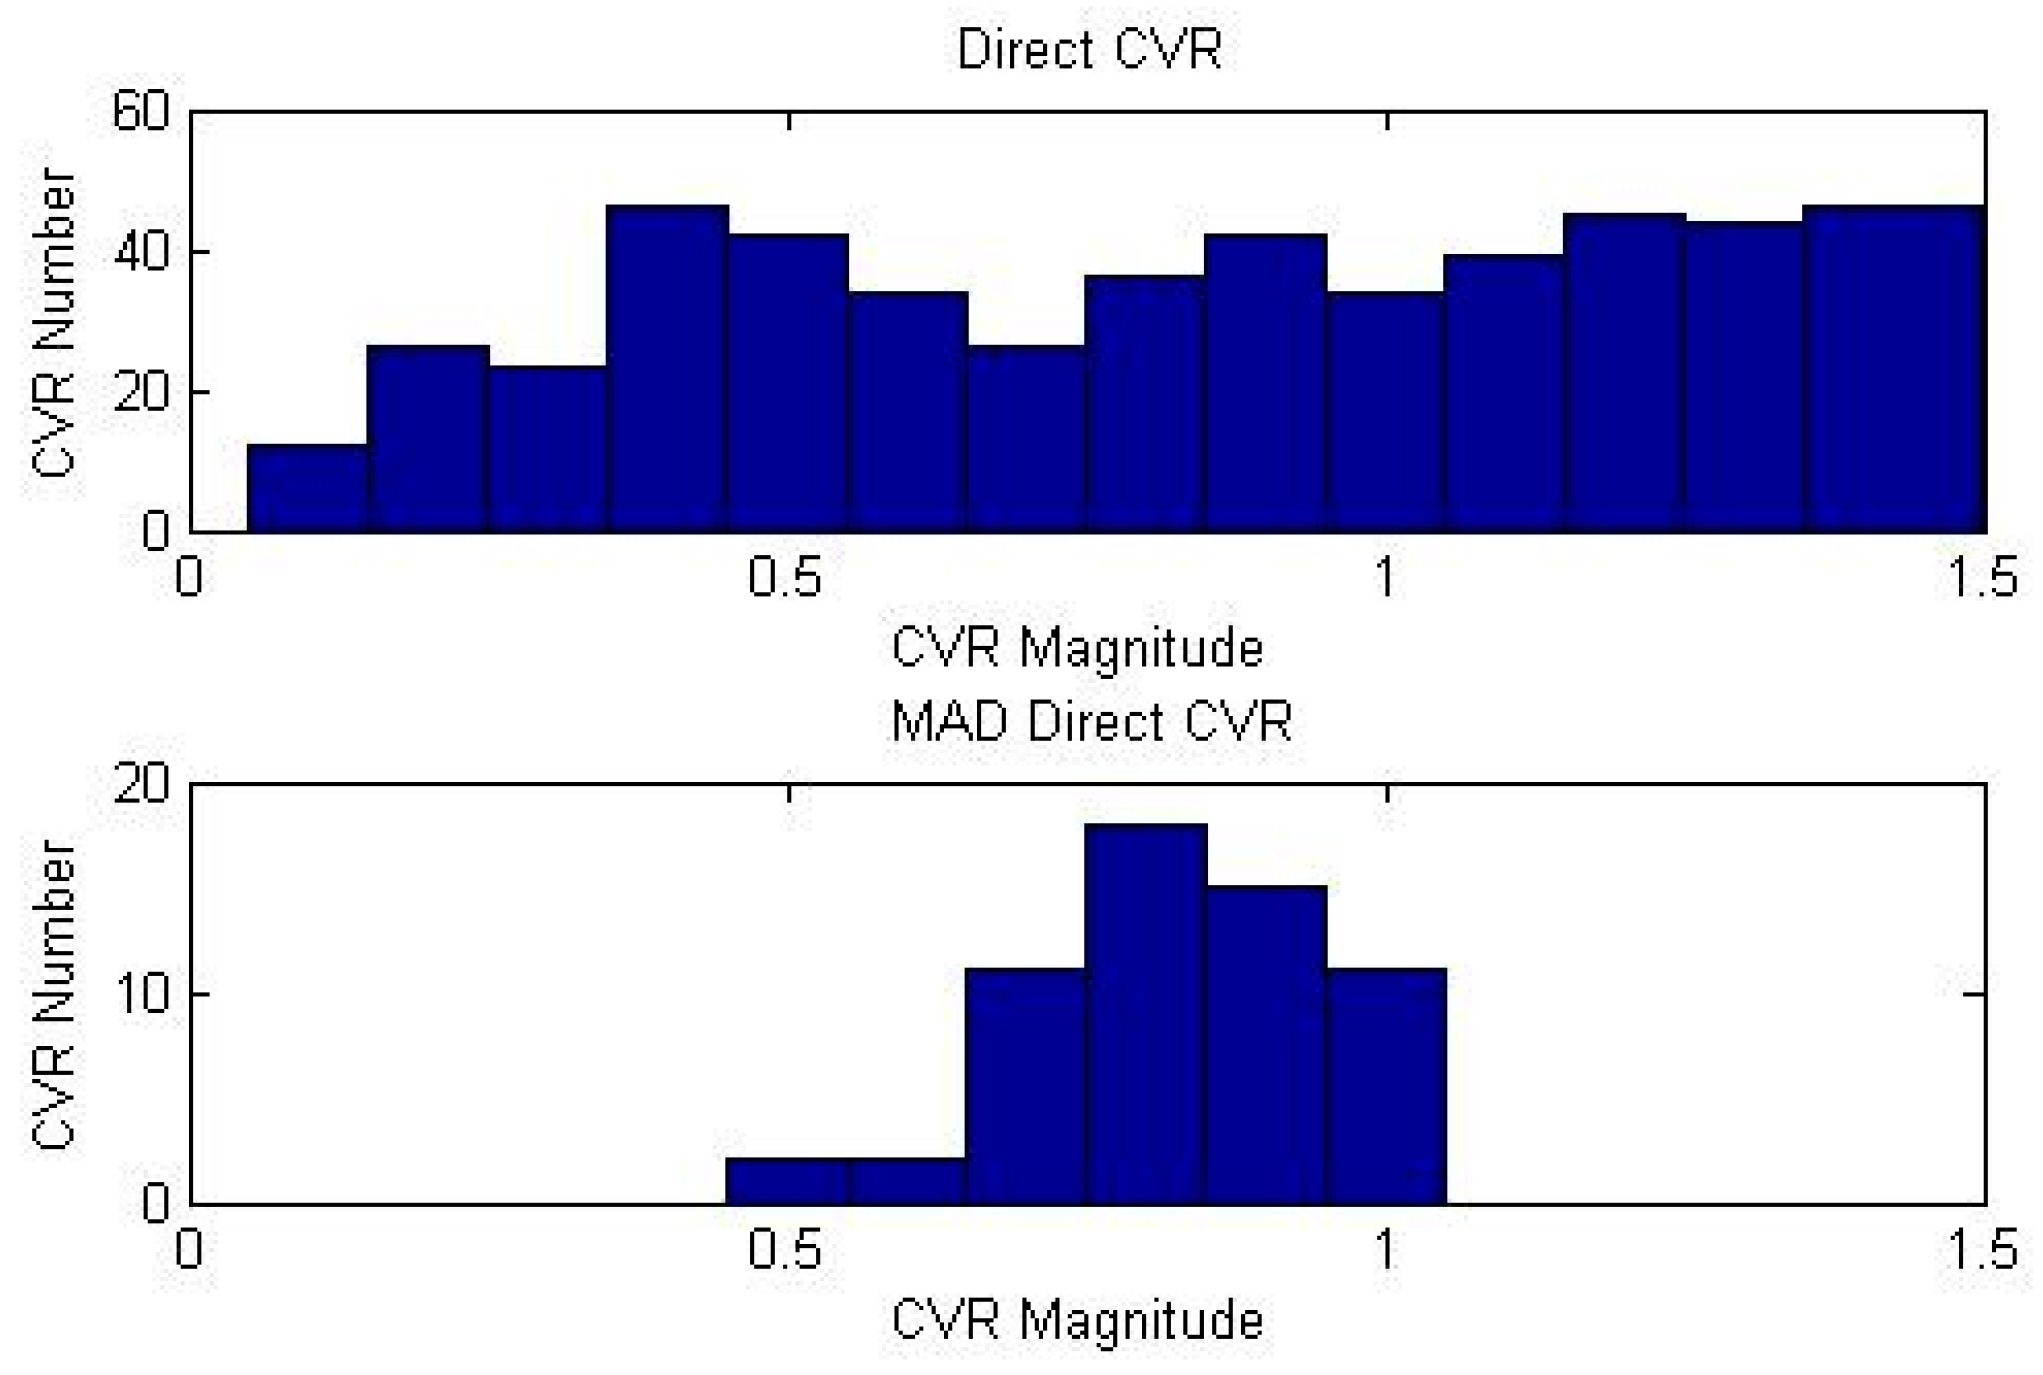
Figure 11 and
Figure 12 illustrate distribution diagrams of the CVR factor values of the Bookgong and Gosung D/L, respectively, which are estimated by the direct method and the MAD direct method.
When the distribution of the estimated CVR factors presents a normal distribution curve, the estimated CVRs can be considered accurate. The CVR factors of the Bookgong D/L show a normal distribution curve. However, CVR factor values of the Gosung D/L possess a wide range distribution; thus, they do not show a normal distribution curve. All CVR factors calculated from the MAD direct method produced normal distribution curves. Therefore, CVR factors estimated using the MAD direct method are considered more reliable.
4.4. Estimation of CVR Factors for Reactive Power
CVR factors of the reactive power were estimated by applying the direct method and the MAD direct method to the reactive power data acquired from the DAS installed in each distribution line of the Chimsan substation.
Table 6 lists the filtering conditions used to estimate CVR factors of the reactive power.
Table 7 summarizes the mean CVR factors calculated by applying the direct method to the reactive power data measured in all D/Ls of the Chimsan substation.
Table 8 lists the mean reactive power CVR values calculated by applying the MAD direct method. In the two tables, “
CVRq” represents average reactive power CVR factors, and “No” represents the number of times that the filtering conditions were satisfied. Additionally, “NaN” signifies that the CVR factor could not be calculated because the filtering condition was not satisfied.
The highest CVR factor (14.857) was estimated in the Bookgong D/L, and the lowest CVR factor (7.807) was observed in the Daebang D/L. Similar results were obtained from the MAD direct method, as shown in
Table 8. This suggests that the largest reactive power control effect could be obtained in the Bookgong D/L through voltage reduction.
CVR factors of the reactive power are much higher than those of the active power. This can be attributed to the fact that the reactive power is more sensitive to voltage changes than the active power.
In the Gosung D/L and Nowoon D/L, CVR factors for the reactive power could not be calculated in most cases.
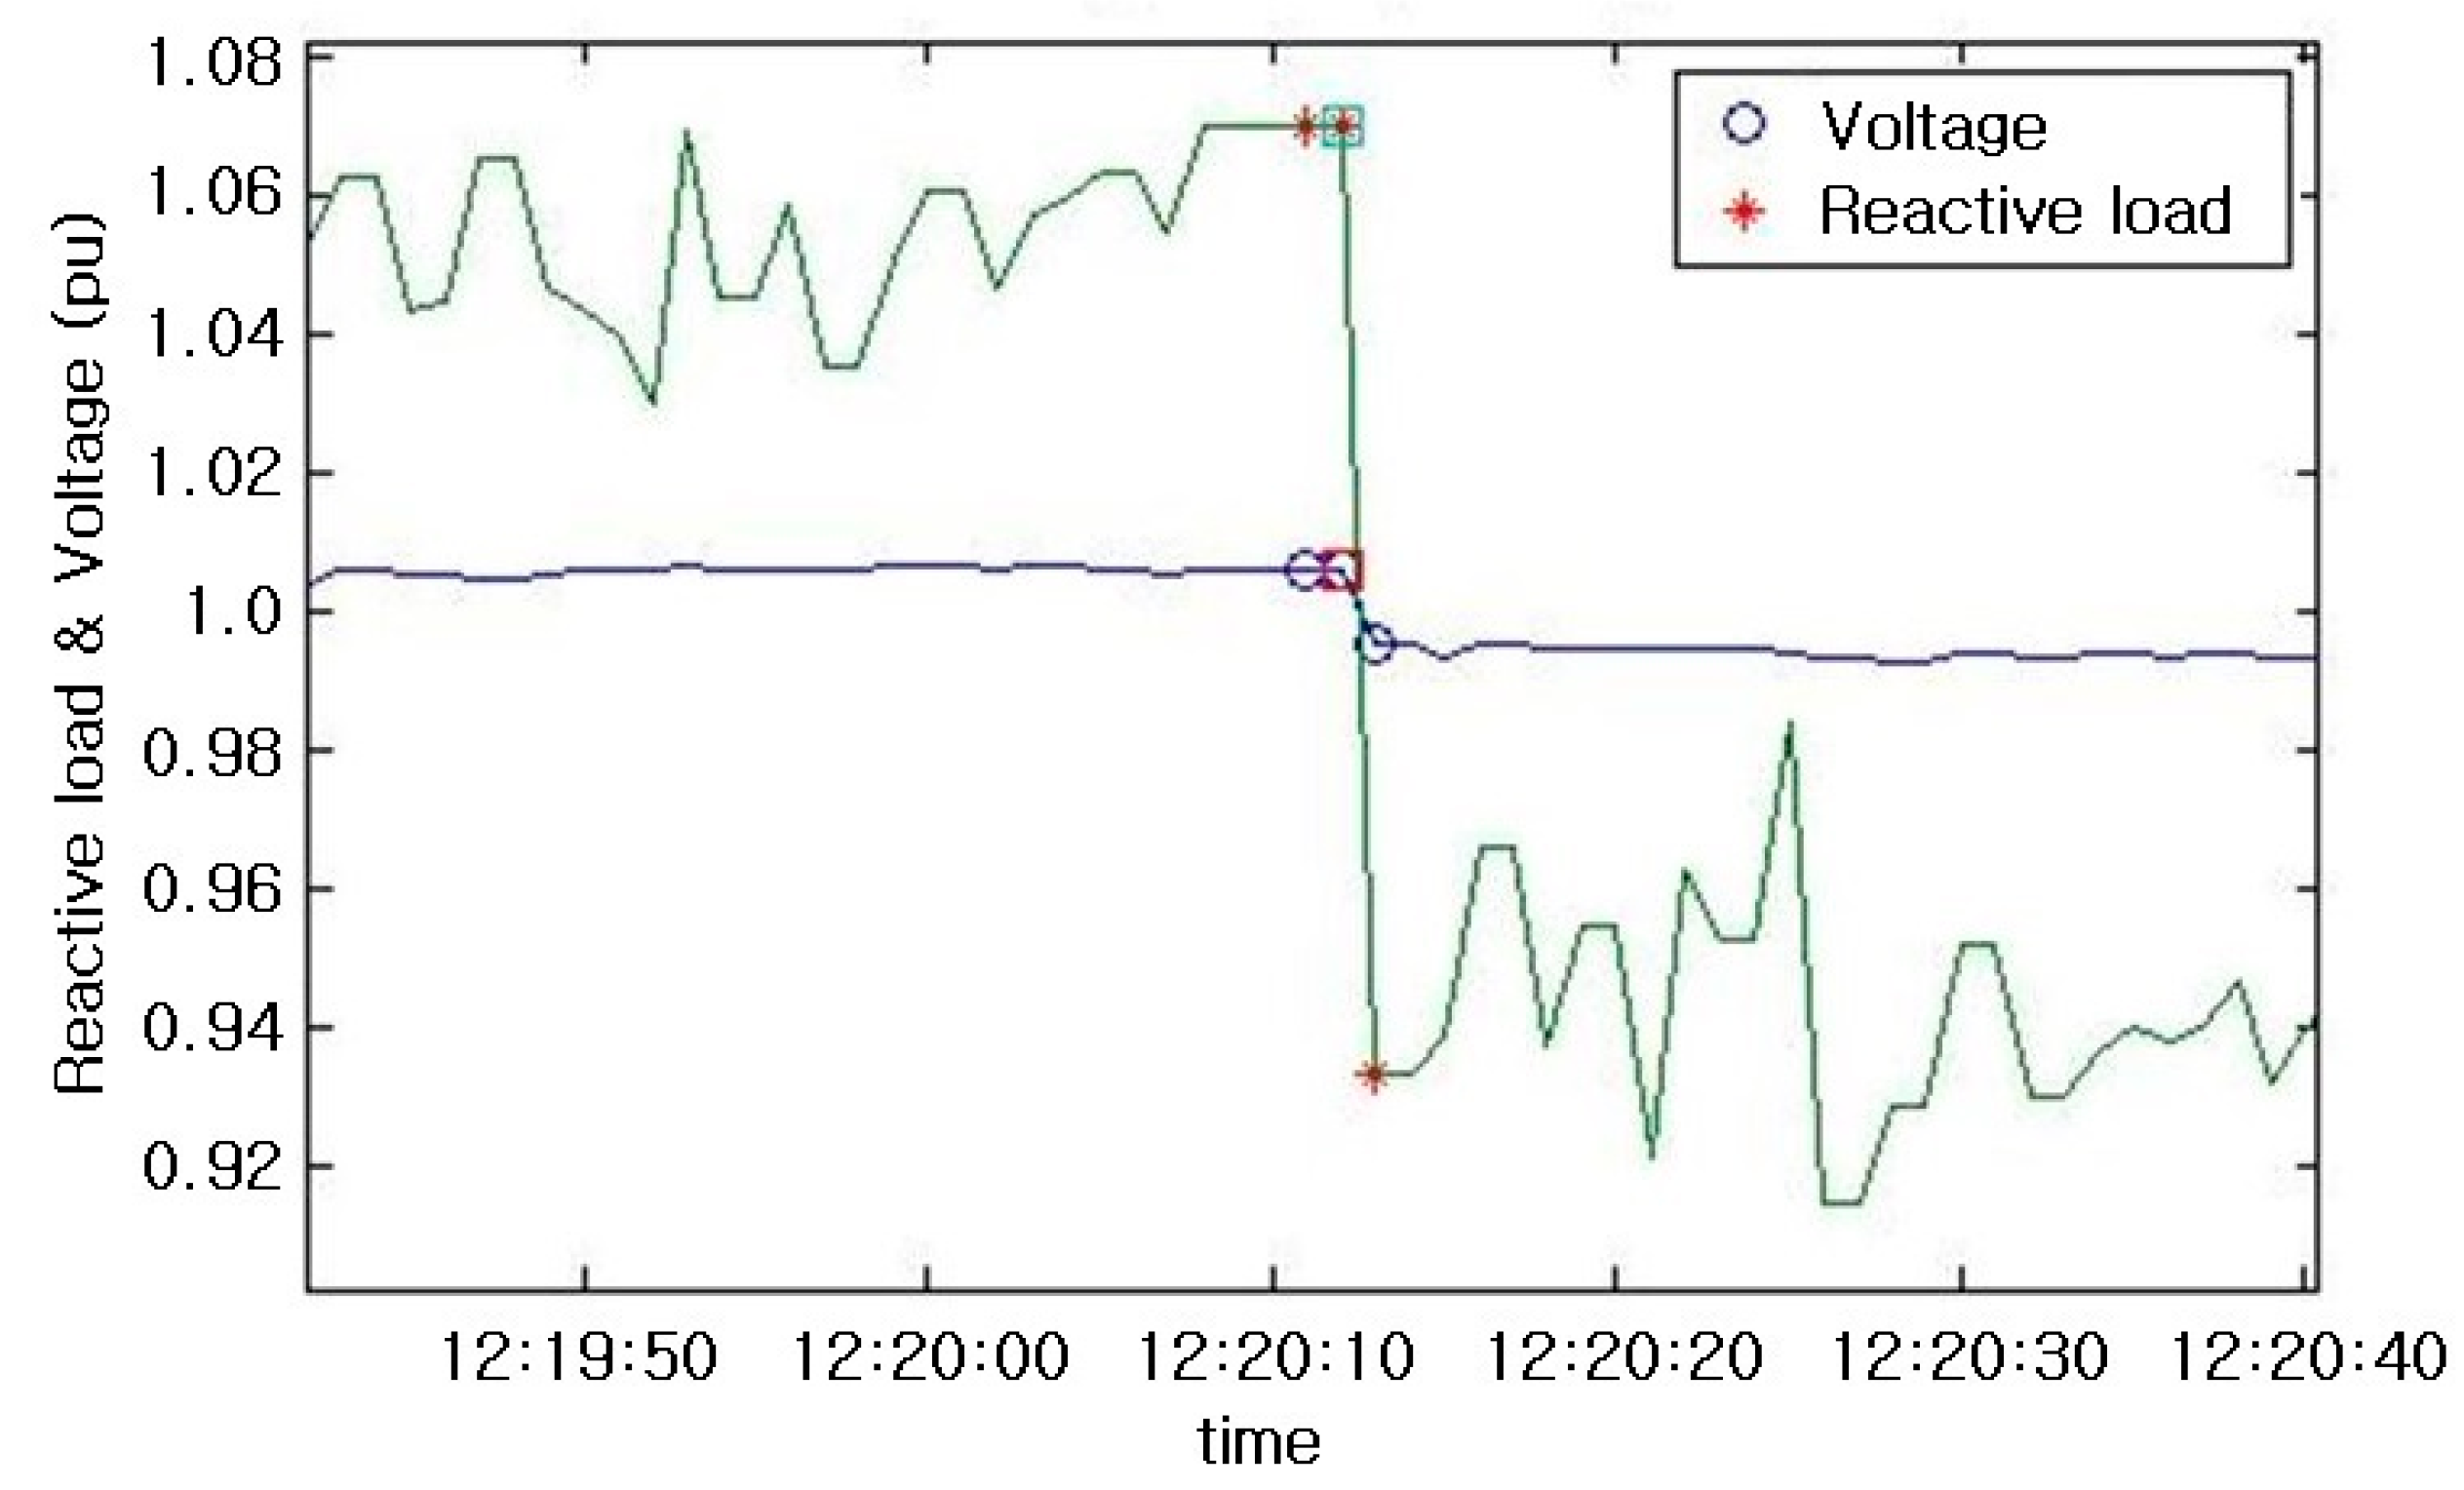
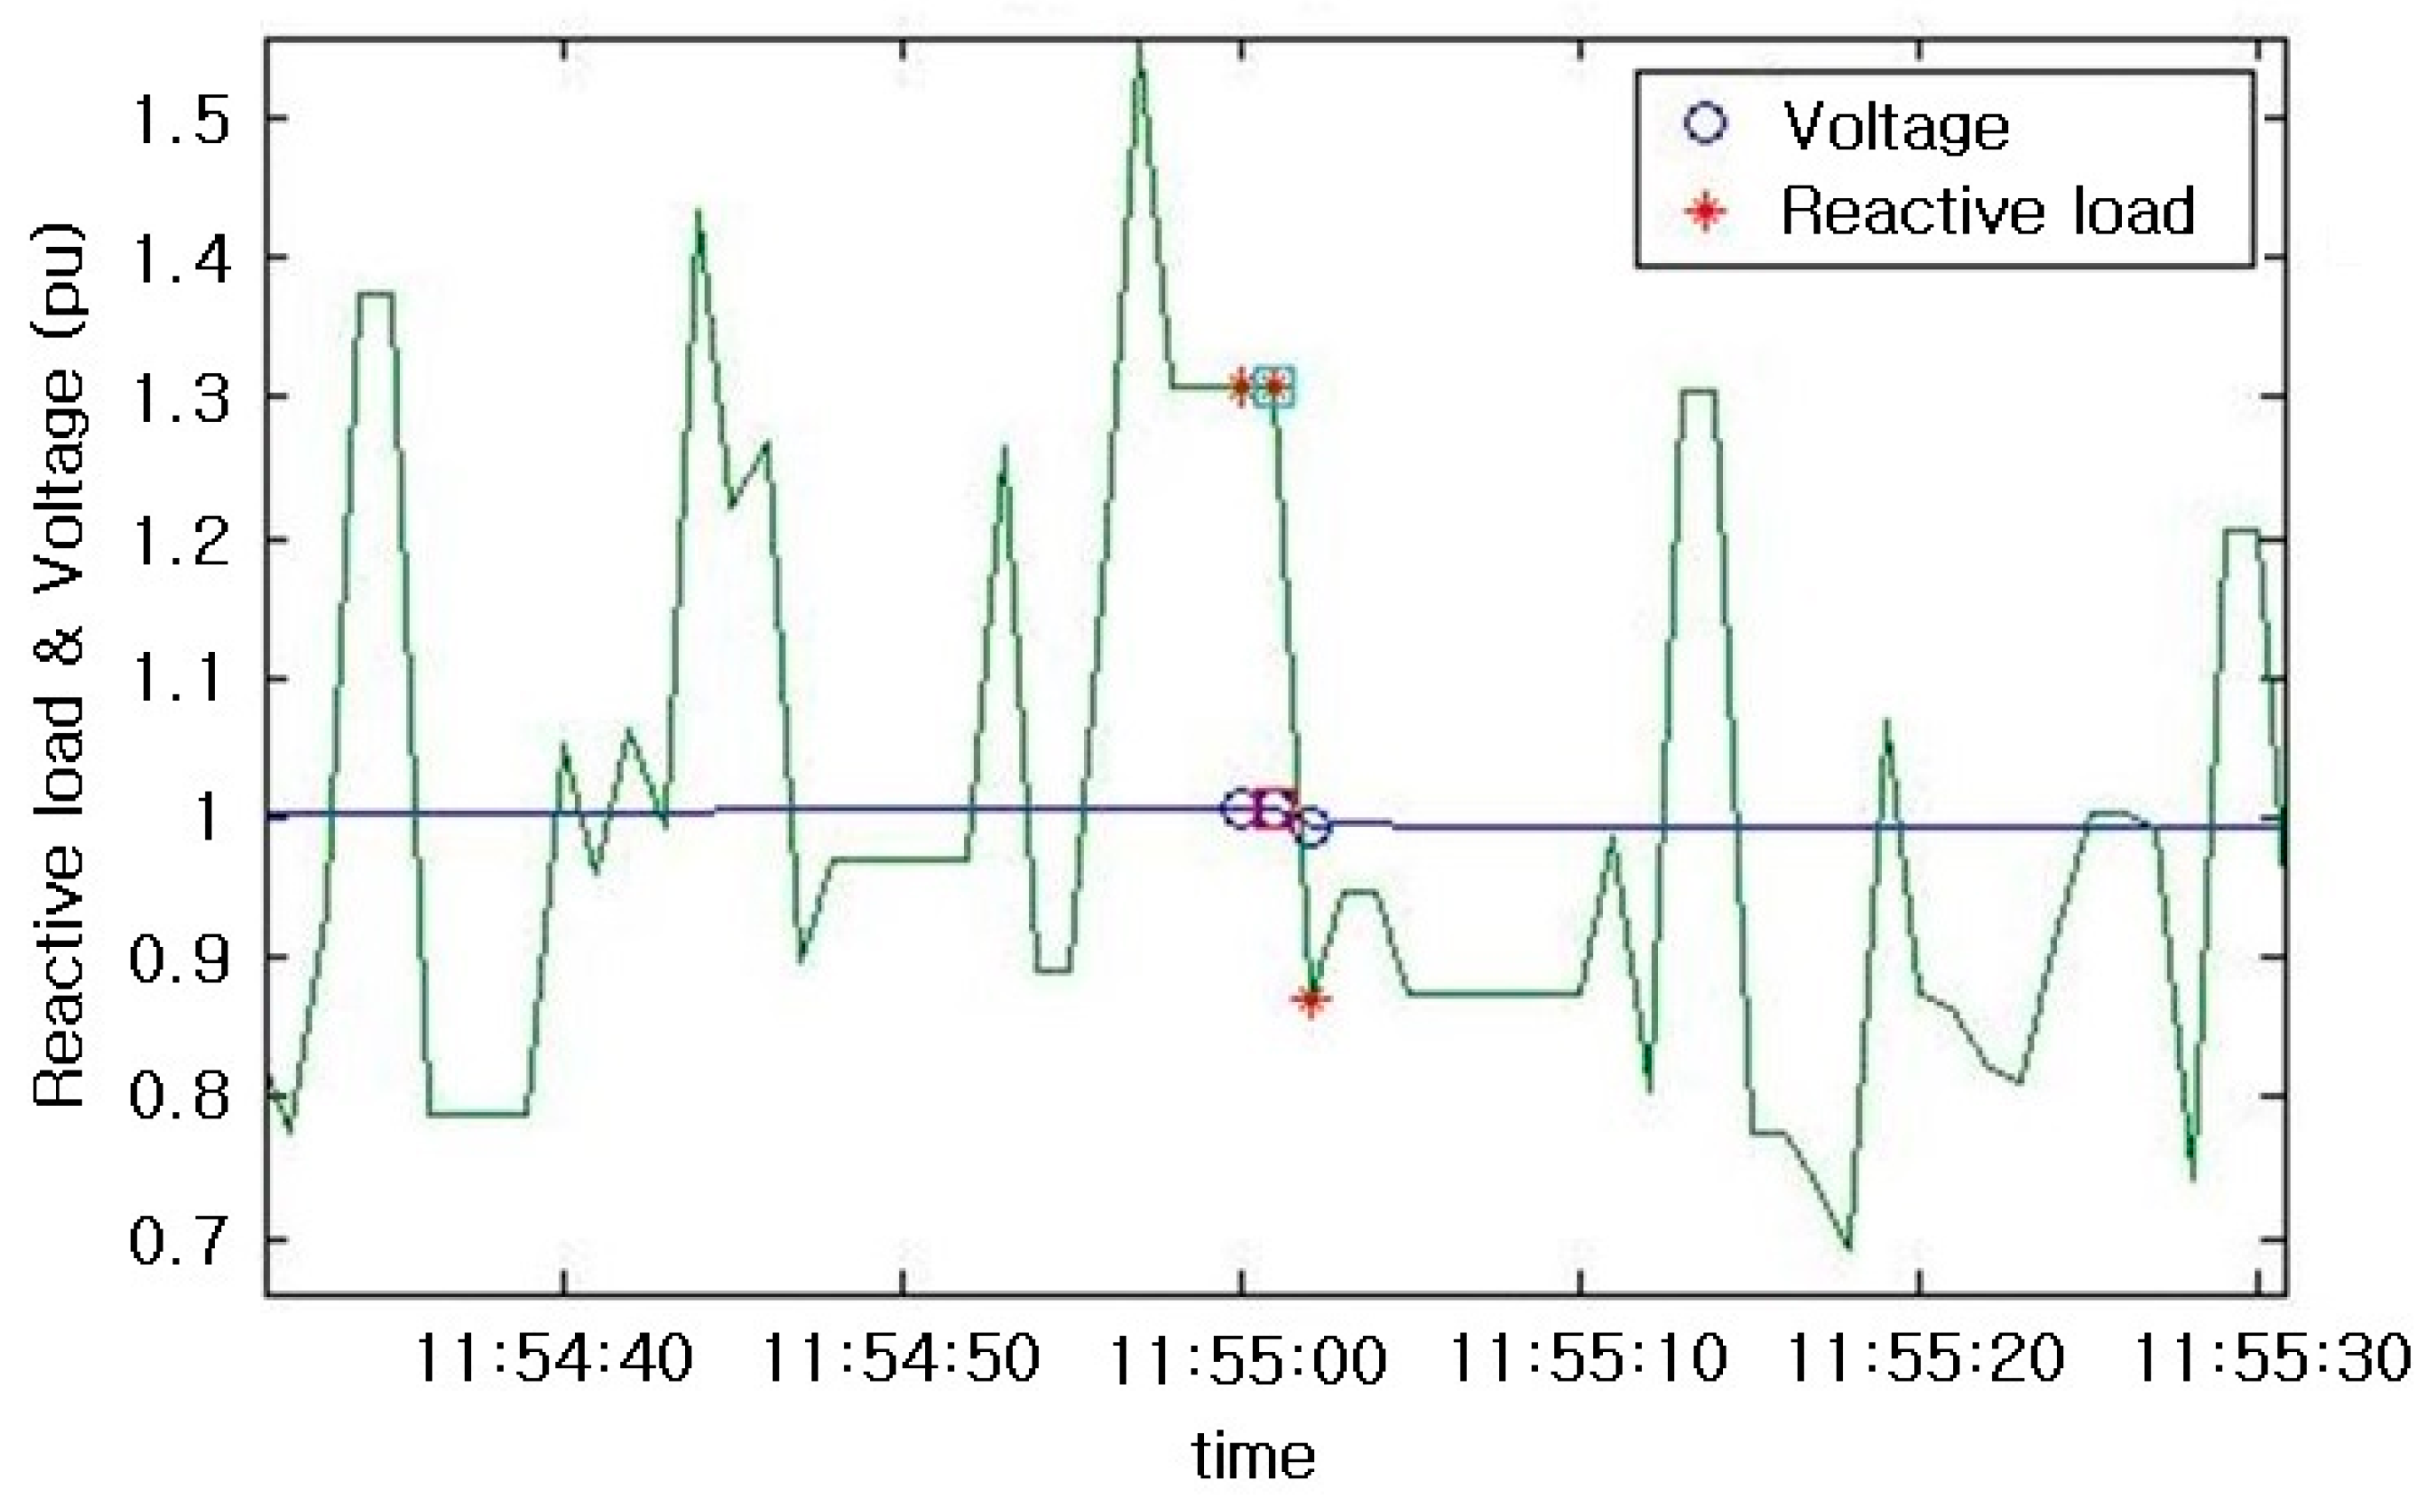
Figure 13 and
Figure 14 demonstrate larger images of the voltage and load values of the Bookgong D/L and the Nowoon D/L during voltage changes measured in June 2017. Whereas reactive power changes before and after tap changes are prominent in the Bookgong D/L data, reactive power changes caused by voltage changes are difficult to identify in the Nowoon D/L data. Thus, CVR factors could not be estimated.
4.5. Summary of the CVR Factor Estimation
CVR factors were estimated to be in the range of 0.802–0.872 when applying the direct method to the data measured at D/Ls of the Chimsan substation. When applying the MAD direct method, CVR factors were estimated to be in the range of 0.721–0.784. Similar mean CVRs were calculated because D/Ls of the Chimsan substation are located in the same area, and thus have similar load characteristics. Lower CVR factors were estimated when using the MAD direct method when compared with results obtained using the direct method.
When classifying results by season, high CVR factors were estimated in early winter and winter. When classifying by time, high CVR factors were estimated in the evening and at dawn. This can be attributed to the large amount of heat loads are used in the winter and in the evening.
Another finding is that the CVR factors of the reactive power were much higher than those of the active power. This is because reactive power is more sensitive to voltage changes. When applying the direct method to the reactive power data measured at D/Ls of the Chimsan substation, CVR factors were estimated to be in the range of 7.807–14.857. On the other hand, when applying the MAD direct method to the data, CVR factors were estimated to be in the range of 8.190–15.105.
5. Conclusions
This paper described a method to estimate CVR factors using data measured from power distribution systems and presented the results of its application to the KEPCO system.
Voltage and load change percentages were calculated from data acquired at the moment at which large voltage changes occurred due to tap changes in transformers of the distribution system. The ratio of the voltage change percentage and load change percentage was calculated to estimate CVR factors. In addition, the MAD direct method was used to calculate the load variations, which were incorporated in the calculation of percentage load changes in order to estimate CVR factors. The mean of the CVR factors was found after filtering voltage changes and load changes.
The results of estimating CVR factors of the KEPCO system revealed that the highest mean CVR factors were found during winter, which has high heating load. The lowest mean CVR factors were found in the summer, which has high constant power load. Because reactive power is sensitive to voltage changes, CVR factors of the reactive power were found to be much higher than those of the active power.
By testing the direct method and MAD direct method in the KEPCO system, we can confirm that CVR factors of both active and reactive power can be accurately estimated using data acquired from power distribution systems.

 ,
, 


