Analysis of the Potential of Low-Temperature Heat Pump Energy Sources

Abstract
:1. Introduction
2. Materials and Methods
2.1. Theoretical Analysis
2.2. Materials and Methods of Measurement
2.3. Statistical Evaluation
3. Results and Discussion
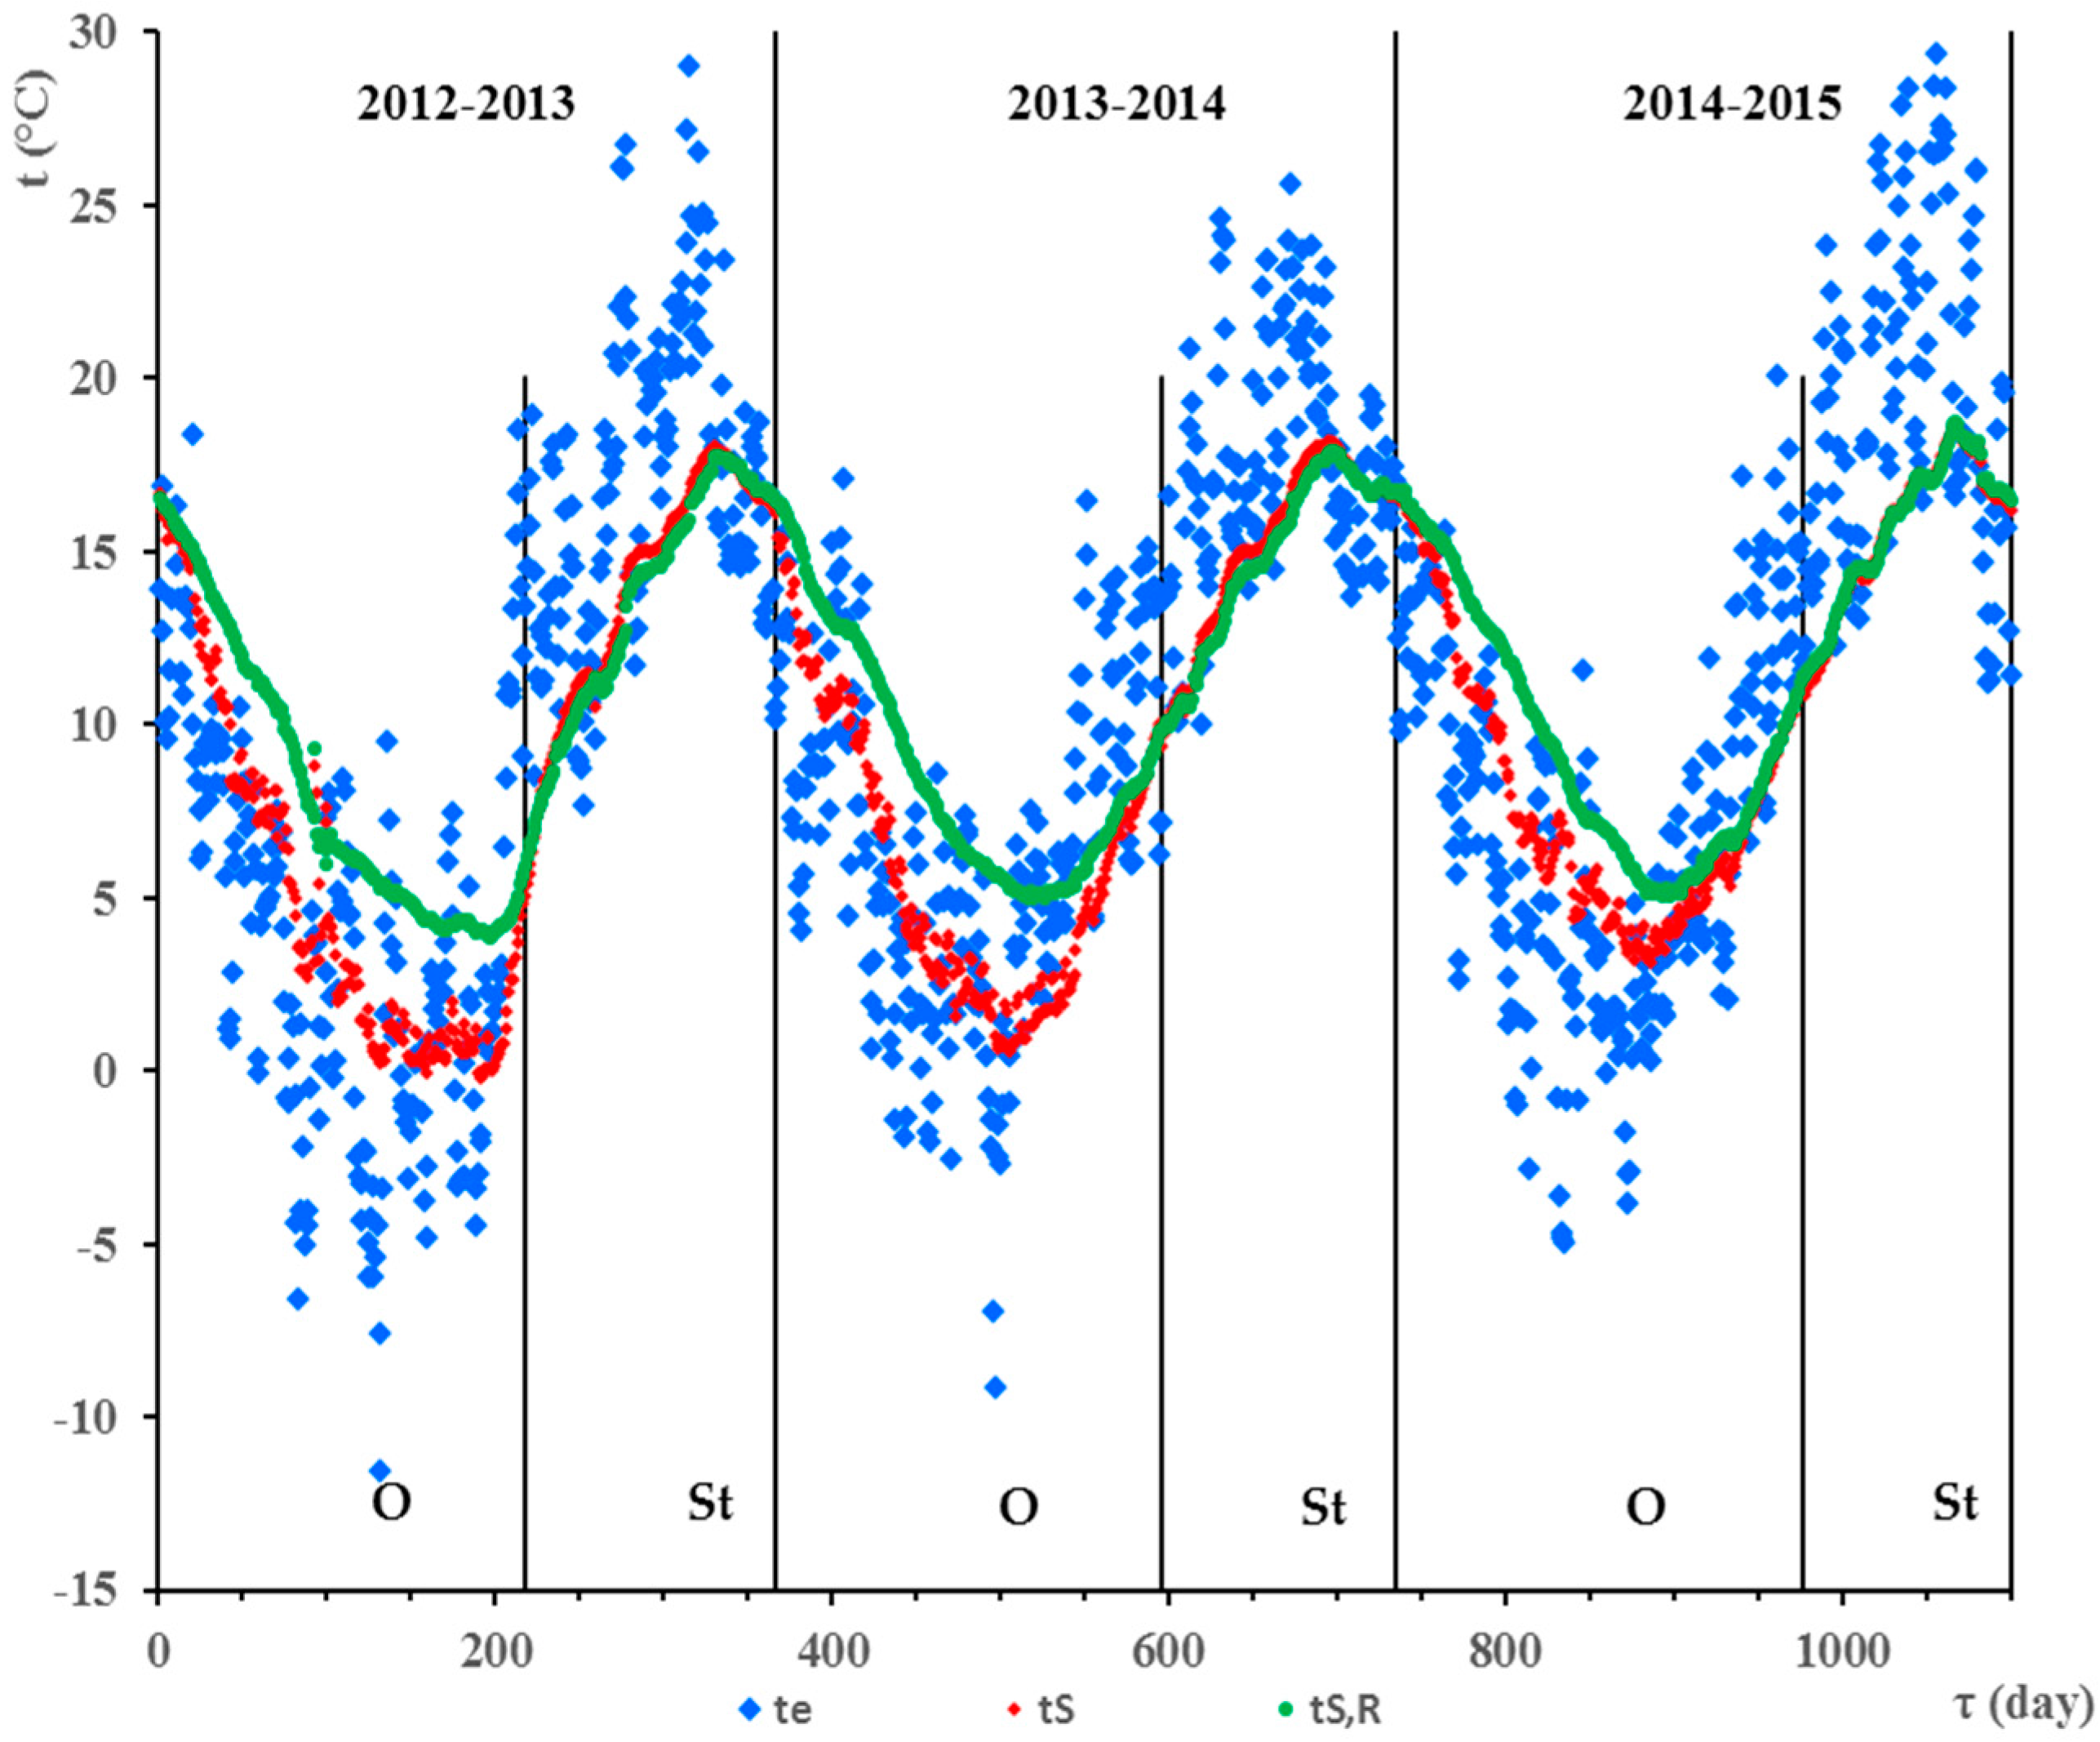
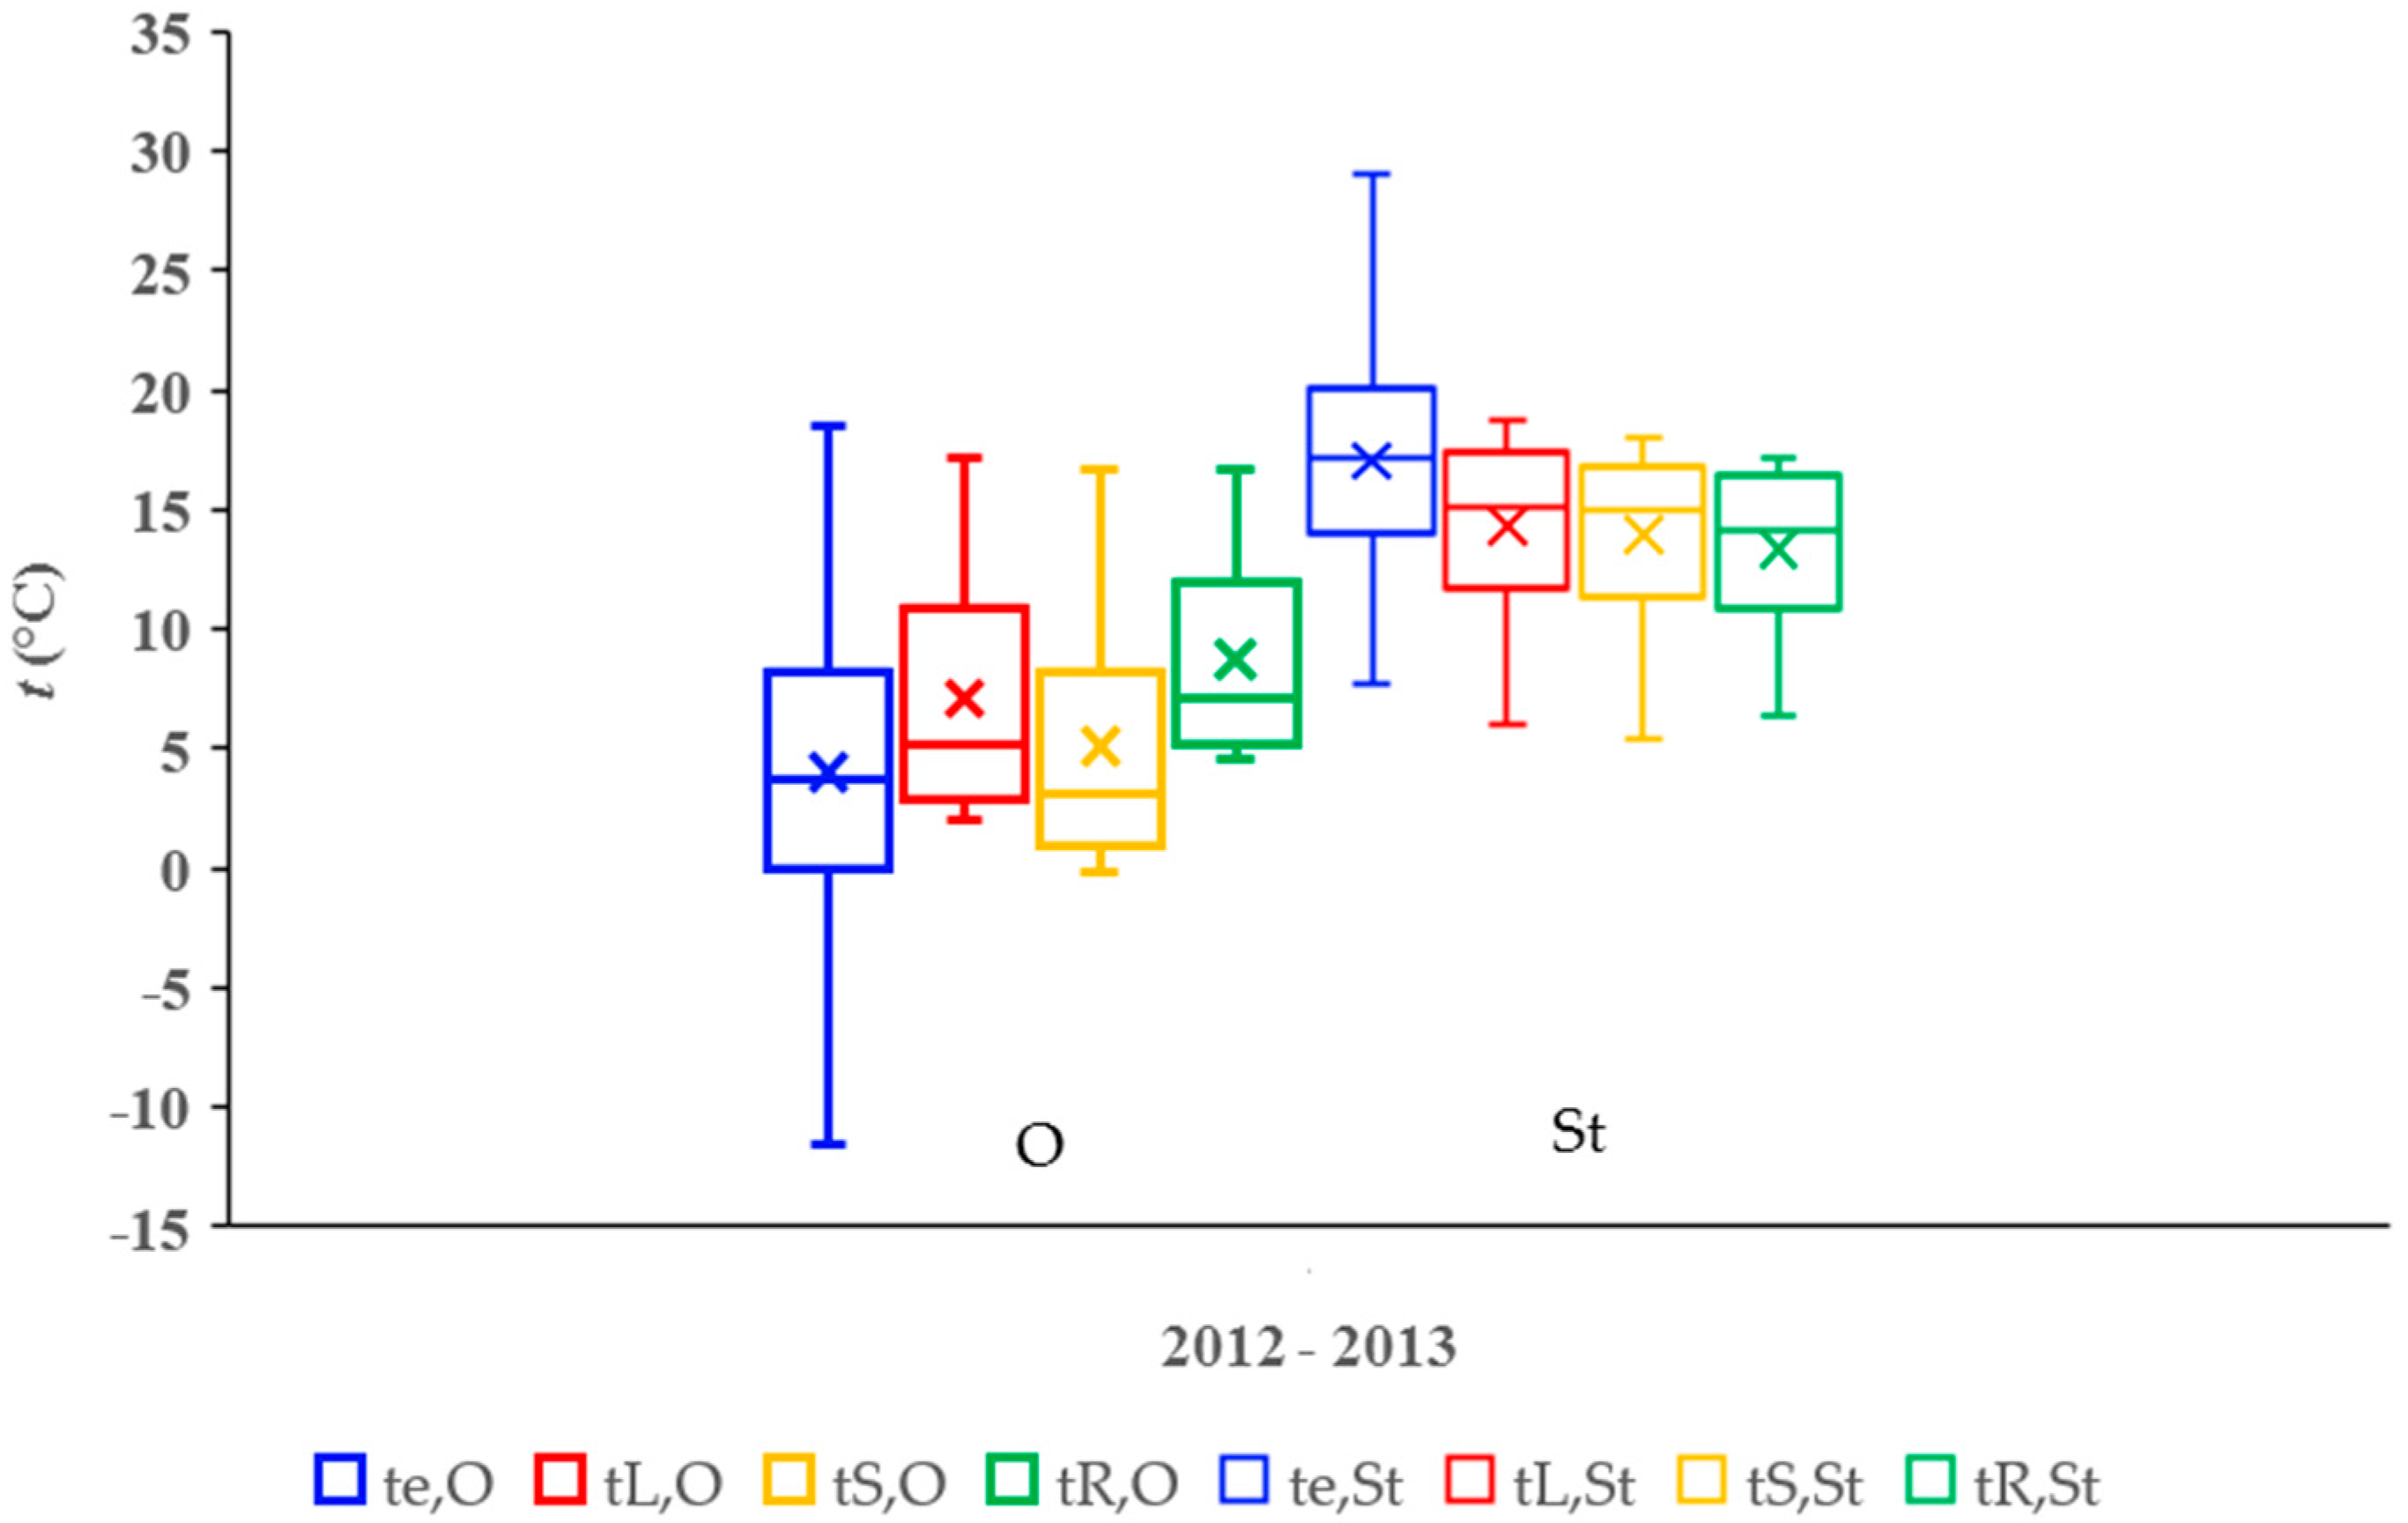
- Considerable variability exists in the air temperature set. The variation range, R and the coefficient of variation, S% were the highest in all monitored periods. Temperature difference between the lower quartile, Q1 and the minimum, xmin was also significantly the highest and was in the lowest temperature range. The interquartile ranges Q2–Q1 were also the highest.
- Except for the air temperature set, te,O median values of temperature were, closer to the minimum temperature, xmin than to the maximum temperature, xmax. Higher concentration of the temperatures was, therefore, in the lower temperature range.
- Ground mass temperatures tL,O in the proximity of the linear HGHE had the least variability among sets of temperatures of the monitored low-temperature energy sources, being the dataset with the lowest range, R and coefficient of variation, S%. Their lower and upper quartiles, Q1 and Q2 were the highest. For this set, temperature difference between the lower quartile, Q1 and the minimum, xmin was small and was in the highest temperature range.
- The variability of the set of average daily ground mass temperatures in the area of the slinky HGHE, tS,O, was larger. The range, R, and the coefficient of variation, S%, were higher than in the set of temperatures of the ground mass which was installed with the linear HGHE. The lower and upper quartile values of temperature, Q1 and Q2, were also lower. The difference between the lower quartile temperature, Q1, and the minimum, xmin fell in the lower temperature range. The characteristics of the temperature set, tS,O, are comparable to the values of the temperature set, te,O.
- Characteristics of the temperature sets, tLR,O and tSR,O, of the reference ground masses differ only insignificantly. This is due to different depths of measurement of the mass temperatures.
- The range, R, and coefficient of variation, S%, of the temperature sets tL,O and tS,O of the ground masses installed with HGHEs were higher than those of the temperature sets tLR,O and tSR,O of the reference ground mass. The lower and upper quartiles, Q1 and Q2, of the temperatures tLR,O and tSR,O were higher than those of temperatures tL,O and tS,O of the ground masses with HGHEs. The median of the temperature sets tLR,O and tSR,O was also higher than that of the sets tL,O and tS,O.
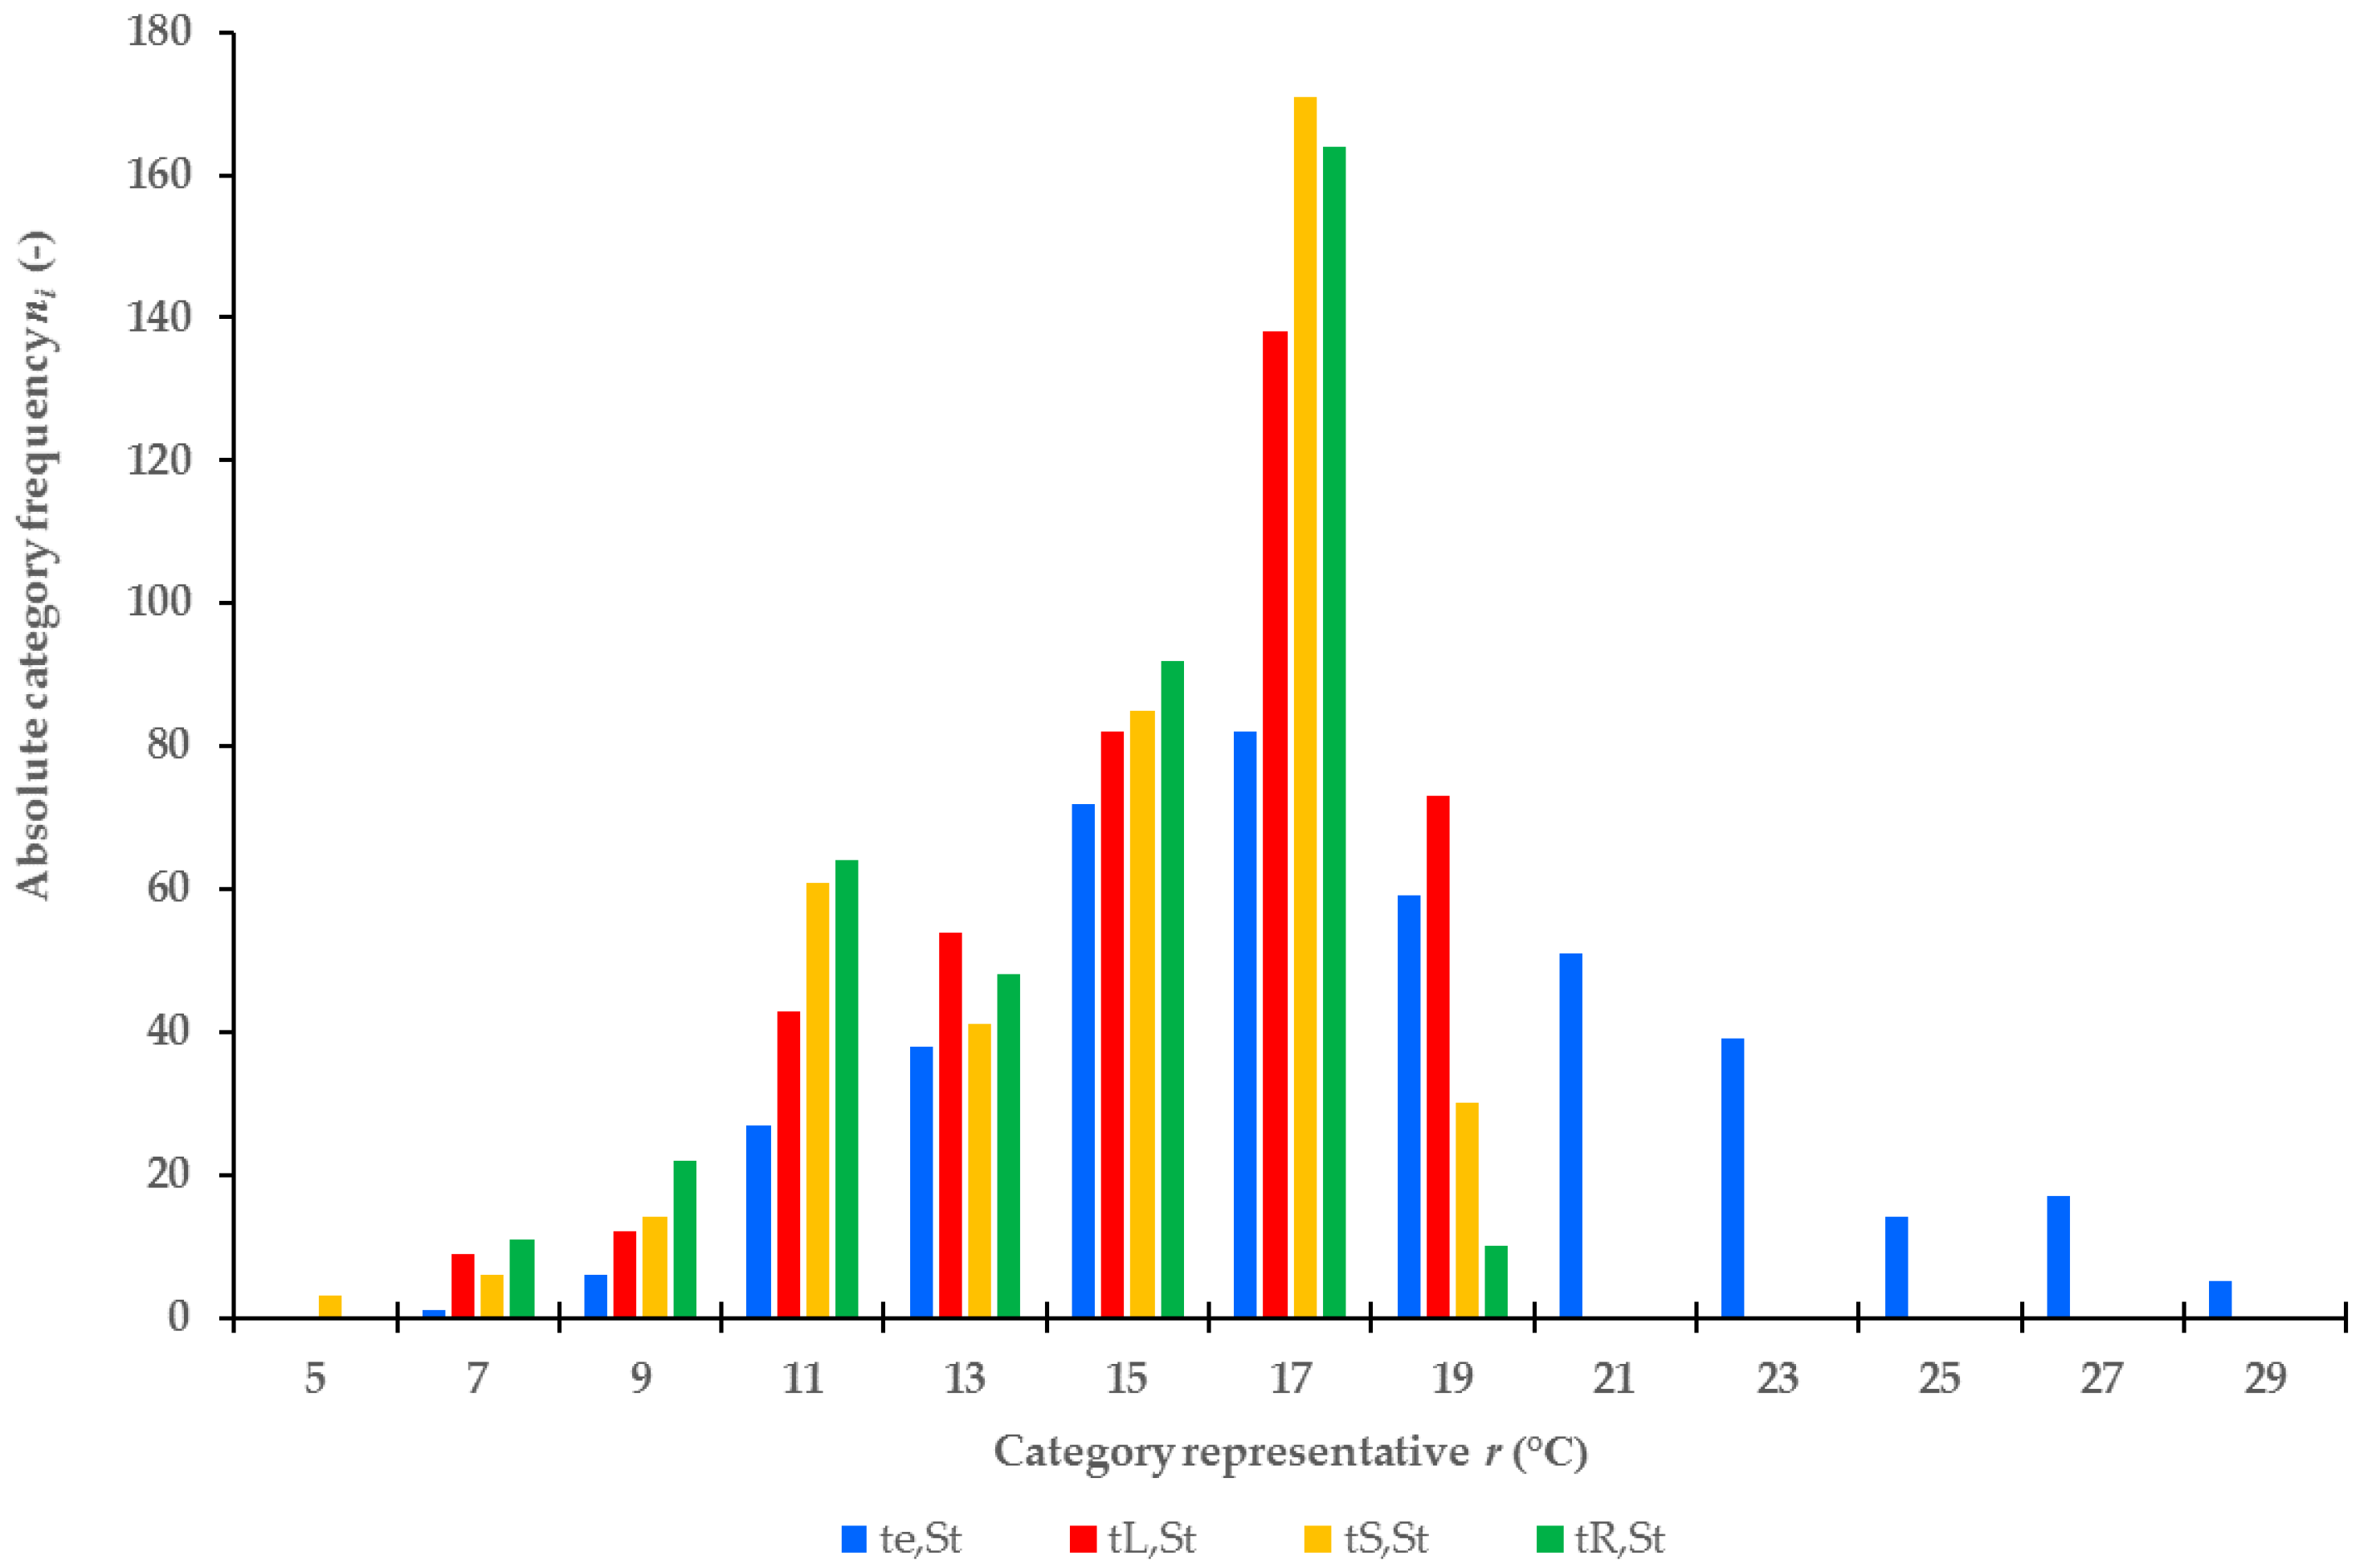
- The variability of the air temperature set remained high. The variation range, R, and the coefficient of variation, S%, were still the highest in all monitored periods. The differences between Q1 and xmin, between the quartiles Q1 and Q2, and the values of the quartiles were also the highest.
- With the exception of the air temperature set, te,St, the median values of temperature were closer to the maximum temperature, xmax. Higher concentration of the temperature was, therefore, in the higher temperature range.
- The variabilities of the sets of temperatures of the ground masses in the proximities of the HGHEs, tL,St and tS,St were smaller than the variability of the air temperature sets, te,St. The variation range, R, and the coefficient of variation, S%, of the temperature sets tL,St and tS,St, arithmetic mean, and median, differed insignificantly during the monitored periods of stagnation.
- The range, R, of the temperature sets tL,St and tS,St of the ground masses installed with HGHEs was higher than those of the temperature sets tLR,St and tSR,St of the reference ground mass. The lower and upper quartiles, Q1 and Q2, of the temperatures, tLR,St and tSR,St, were mostly lower than those of the temperatures tL,St and tS,St of the ground masses with HGHEs. The median, , of the temperature sets tLR,St and tSR,St were also mostly lower than those of tL,St and tS,St.
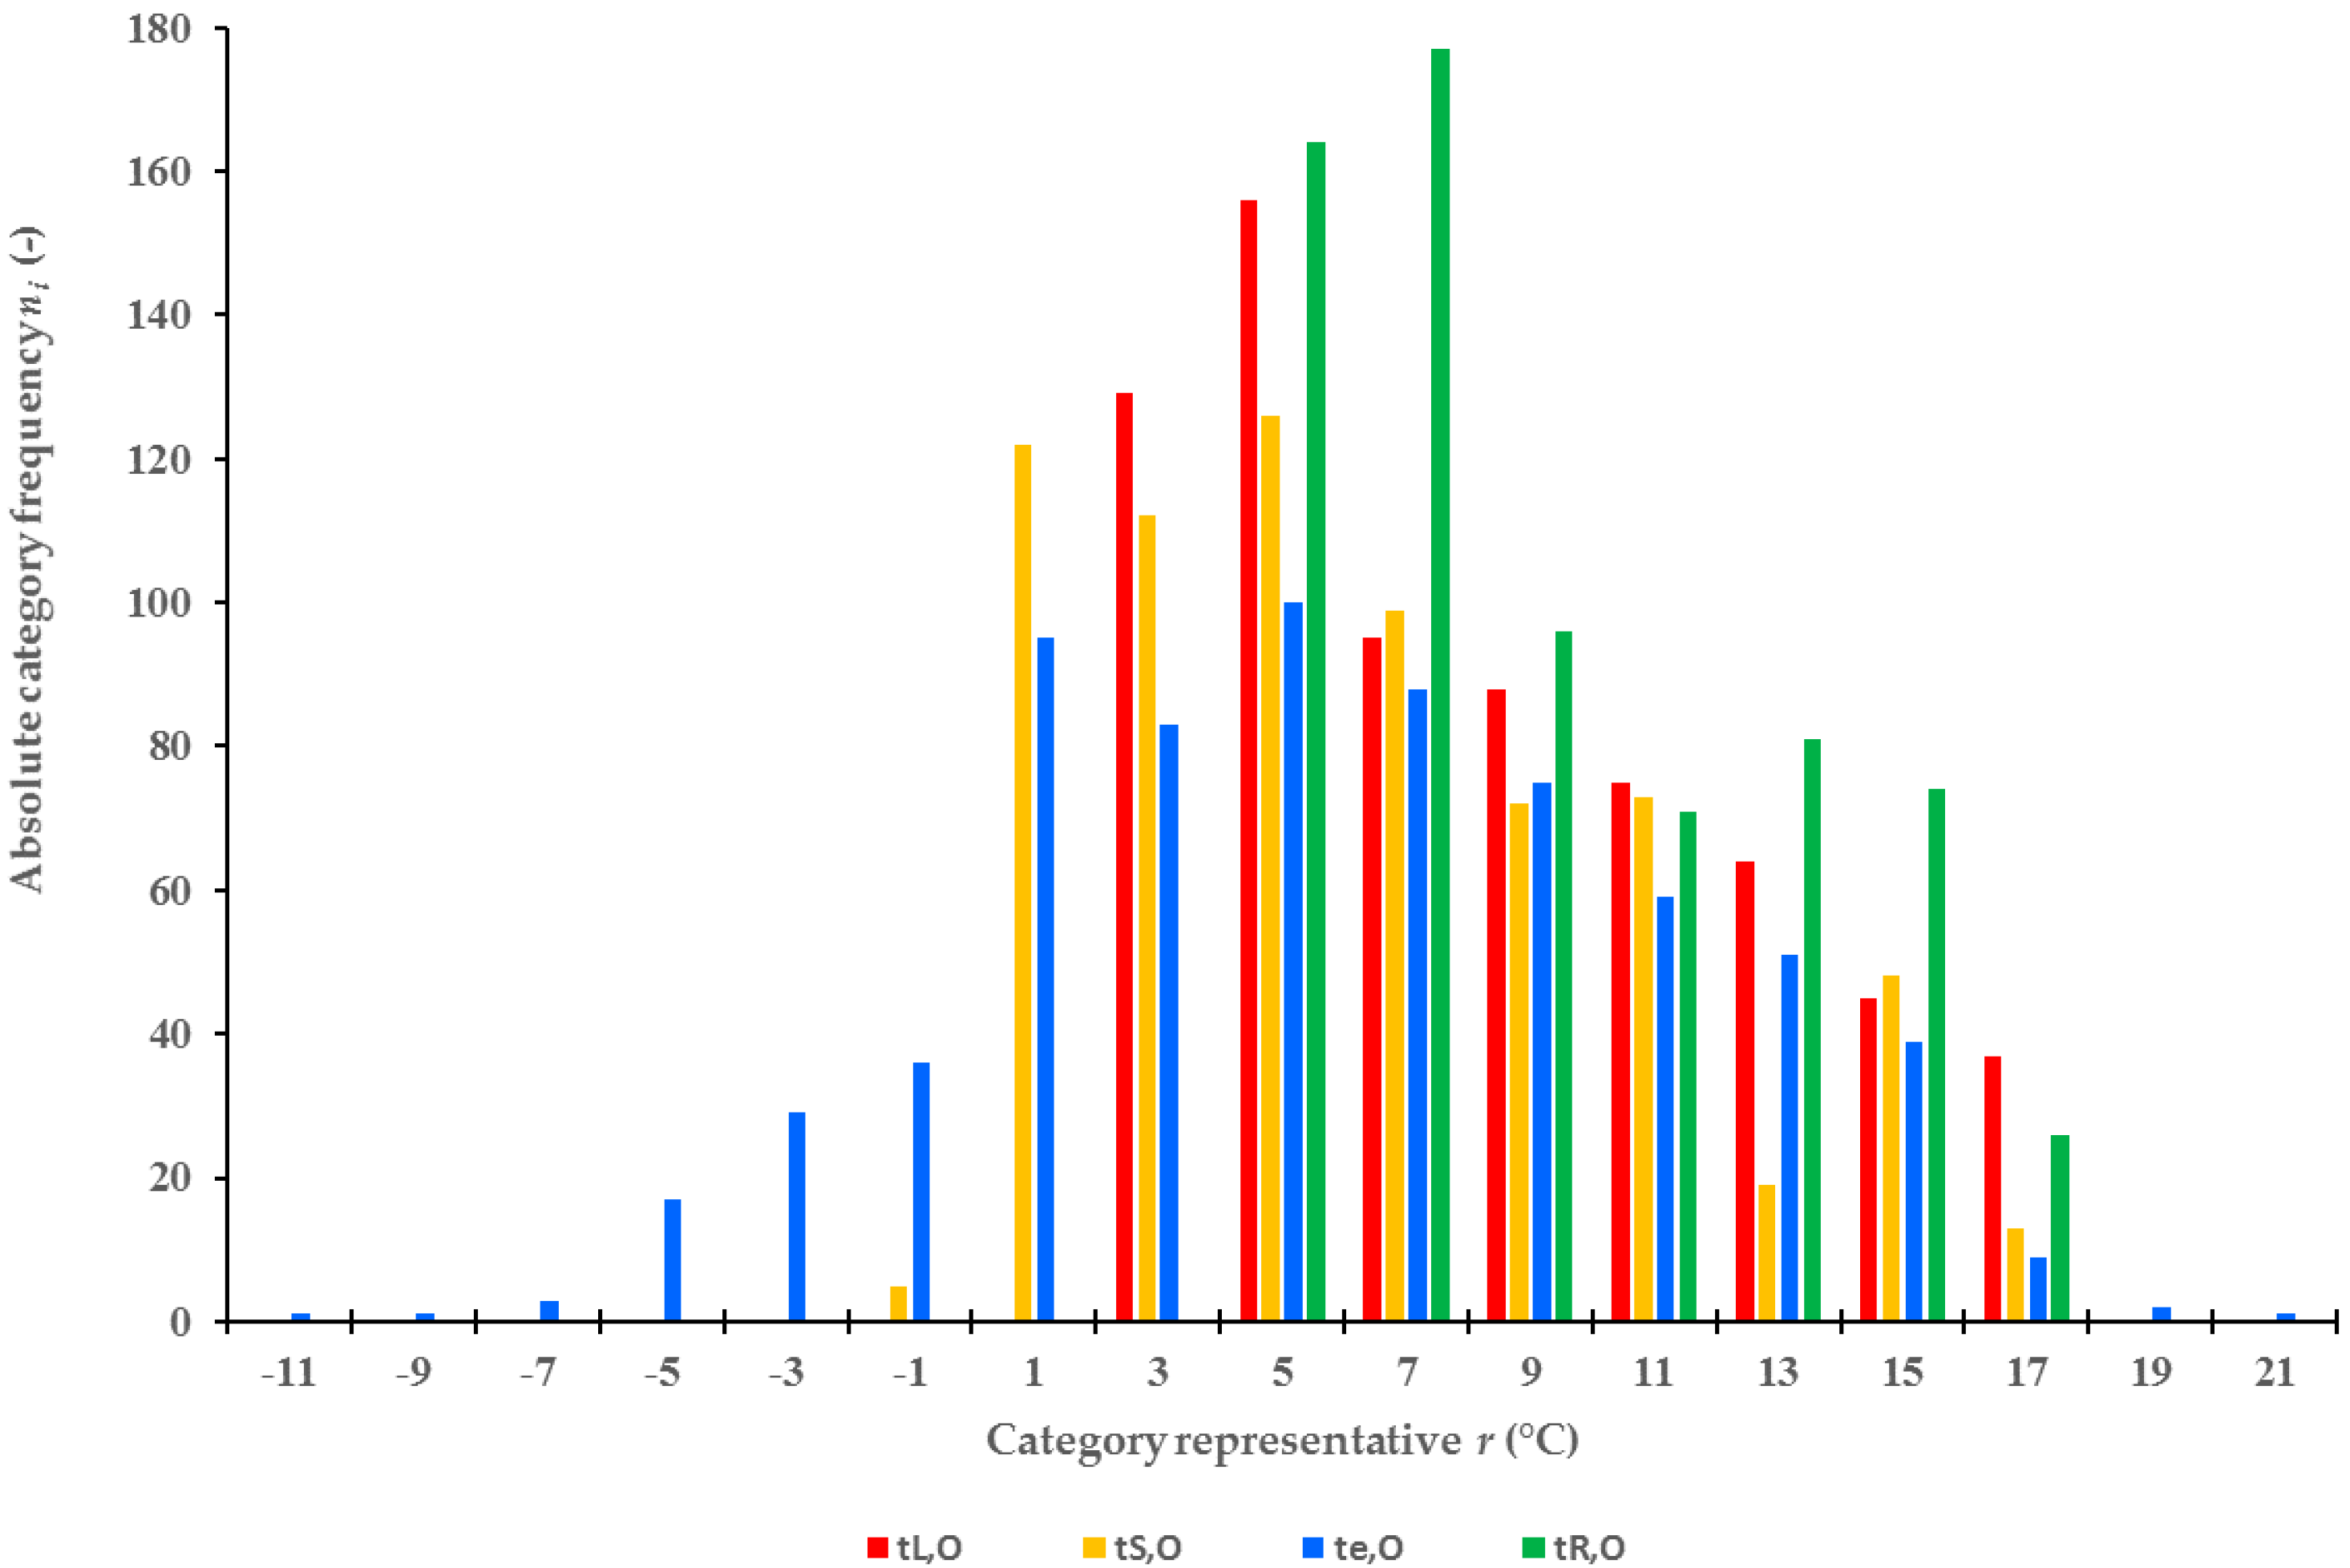
- The values of the test criterion, D2, for air temperature frequencies, te,O, were smaller in each heating period than the critical values of criterion D2,α. Therefore, the differences in temperature frequencies were not statistically significant.
- The differences in distribution of temperature frequencies of the ground masses in the proximity of the linear HGHE, tL,O, and in the proximity of the slinky HGHE, tS,O, were statistically significant. D2 > D2,α applies for the test criteria for temperatures in each heating period.
4. Conclusions
Author Contributions
Conflicts of Interest
Nomenclature
| A | Coefficient of skewness (-) |
| D2 | Test criterion (-) |
| D2,α | Critical value of test criterion (-) |
| O | Heating period |
| Q1 | Lower quartile (°C) |
| Q2 | Upper quartile (°C) |
| S | Standard deviation (K) |
| S2 | Variance (K2) |
| S% | Coefficient of variation (%) |
| St | Period of HGHE stagnation |
| Tb | Temperature at which the heat is brought into the Carnot cycle (K) |
| Tr | Temperature at which the heat is drawn out of the Carnot cycle (K) |
| ni | Absolute category frequency (-) |
| r | Category representative (°C) |
| t | Temperature (°C) |
| wi | Relative frequency (%) |
| xmax | Maximum (°C) |
| xmin | Minimum (°C) |
| Arithmetic mean (°C) | |
| Median (°C) | |
| Mode (°C) | |
| Δ | Difference (K) |
| εc | Cooling factor |
| εh | Heating factor |
| τ | Number of days (day) |
| Subscript | |
| B | Beginning of the heating period |
| e | Ambient environment |
| L | Linear HGHE |
| O | Heating period |
| R | Reference ground mass |
| S | Slinky HGHE |
| St | Period of stagnation |
References
- Gou, X.; Fu, Y.; Shah, I.A.; Li, Y.; Xu, G.; Yang, Y.; Wang, E.; Liansheng, L.; Wu, J. Research on a Household Dual Heat Source Heat Pump Water Heater with Preheater Based on ASPEN PLUS. Energies 2016, 9, 1026. [Google Scholar] [CrossRef]
- Ni, L.; Dong, J.K.; Yao, S.; Shen, C.; Qv, D.H.; Zhang, X.D. A review of heat pump systems for heating and cooling of buildings in China in the last decade. Renew. Energy 2016, 84, 30–45. [Google Scholar] [CrossRef]
- Touchie, M.F.; Pressnail, K.D. Testing and simulation of a low-temperature air-source heat pump operating in a thermal buffer zone. Energy Build. 2014, 75, 149–159. [Google Scholar] [CrossRef]
- Kim, J.; Nam, Y. A Numerical Study on System Performance of Groundwater Heat Pumps. Energies 2016, 9, 4. [Google Scholar] [CrossRef]
- Brandl, H. Energy foundations and other thermo-active ground structures. Geotechnique 2006, 56, 81–122. [Google Scholar] [CrossRef]
- Banks, D. An Introduction to Thermogeology: Ground Source Heating and Cooling, 2nd ed.; John Wiley & Sons: Chichester, UK, 2012; p. 546. ISBN 978-0-470-67034-7. [Google Scholar]
- Bufka, A.; Rosecký, D. Renewable Energy in 2014. Results the Statistical Survey; The Ministry of Industry and Trade of the Czech Republic: Prague, Czech Republic, 2016. (In Czech) [Google Scholar]
- Lund, J.W.; Boyd, T.A. Direct Utilization of Geothermal Energy 2015 Worldwide Review. In Proceedings of the World Geothermal Congress 2015, Melbourne, Australia, 19–25 April 2015; Available online: https://pangea.stanford.edu/ERE/db/WGC/papers/WGC/2015/01000.pdf (accessed on 16 April 2017).
- Popiel, C.; Wojtkowiak, J.; Biernacka, B. Measurements of temperature distribution in ground. Exp. Therm. Fluid Sci. 2001, 25, 301–309. [Google Scholar] [CrossRef]
- Rezaei, B.A.; Kolahdouz, E.M.; Dargush, G.F.; Weber, A.S. Ground source heat pump pipe performance with Tire Derived Aggregate. Int. J. Heat Mass Transf. 2012, 55, 2844–2853. [Google Scholar] [CrossRef]
- Song, Y.; Yao, Y.; Na, W. Impacts of soil pipe thermal conductivity on performance of horizontal pipe in a ground-source heat pump. In Proceedings of the Sixth International Conference for Enhanced Building Operations, Shenzhen, China, 6–9 November 2006; Available online: http://hdl.handle.net/1969.1/5465 (accessed on 16 April 2017).
- Blázquez, C.S.; Martín, A.F.; Nieto, I.M.; Aguilera, D.G. Measuring of thermal Conductivities of soils and rock to be used in the calculation of a geothermal installation. Energies 2017, 10, 795. [Google Scholar] [CrossRef]
- Kodešová, R.; Vlasáková, M.; Fér, M.; Teplá, D.; Jakšík, O.; Neuberger, P.; Adamovský, R. Thermal properties of representative soils of the Czech Republic. Soil Water Res. 2013, 8, 141–150. [Google Scholar]
- Kupiec, K.; Larwa, B.; Gwagera, M. Heat transfer in horizontal ground heat exchangers. Appl. Therm. Eng. 2015, 75, 270–276. [Google Scholar] [CrossRef]
- Wei, W.; Wang, B.; You, T.; Shi, W.; Li, X. A potential solution for thermal imbalance of ground source heat pump systems in cold regions: Ground source absorption heat pump. Renew. Energy 2013, 59, 39–48. [Google Scholar] [CrossRef]
- Nam, Y.J.; Gao, X.Y.; Yoon, S.H.; Lee, K.H. Study on the Performance of a Ground Source Heat Pump System Assisted by Solar Thermal Storage. Energies 2015, 8, 13378–13394. [Google Scholar] [CrossRef]
- Tarnawski, V.R.; Leong, W.H.; Momose, T.; Hamada, Y. Analysis of ground source heat pumps with horizontal ground heat exchangers for northern Japan. Renew. Energy 2009, 34, 127–134. [Google Scholar] [CrossRef]
- Gonzalez, R.G.; Verhoef, A.; Vidale, P.L.; Main, B.; Gan, G.; Wu, Y. Interactions between the physical soil environment and a horizontal groundcoupled heat pump, for a domestic site in the UK. Renew. Energy 2012, 44, 141–153. [Google Scholar] [CrossRef]
- Hepburn, B.D.P.; Sedighia, M.; Thomas, H.R.; Manju, H.R. Field-scale monitoring of a horizontal ground source heat system. Geothermics 2016, 61, 86–103. [Google Scholar] [CrossRef]
- Mošna, F. Statistical Tools of Excel. In Proceedings of the 16th International Conference APLIMAT 2017, Bratislava, Slovakia, 31 January–2 February 2017; pp. 1101–1106. [Google Scholar]
- Pratt, J.W.; Gibbons, J.D. Concepts of Nonparametric Theory; Springer: New York, NY, USA, 1981; pp. 318–344. ISBN 978-1-4612-5933-6. [Google Scholar]
- Neuberger, P.; Adamovský, R.; Šeďová, M. Temperatures and Heat Flows in a Soil Enclosing a Slinky Horizontal Heat Exchanger. Energies 2014, 7, 972–987. [Google Scholar] [CrossRef]
- Pauli, P.; Neuberger, P.; Adamovský, R. Monitoring and Analysing Changes in Temperature and Energy in the Ground with Installed Horizontal Ground Heat Exchangers. Energies 2016, 9, 555. [Google Scholar] [CrossRef]
- Inalli, M.; Esen, H. Experimental thermal performance evaluation of a horizontal ground-source heat pump system. Appl. Therm. Eng. 2004, 24, 2219–2232. [Google Scholar] [CrossRef]
- Adamovský, D.; Neuberger, P.; Adamovský, R. Changes in energy and temperature in the ground mass with horizontal heat exchangers—The energy source for heat pumps. Energy Build. 2015, 92, 107–115. [Google Scholar] [CrossRef]


| Quantile Characteristics | 2012–2013 | 2013–2014 | 2014–2015 | ||||||||||||
|---|---|---|---|---|---|---|---|---|---|---|---|---|---|---|---|
| Linear HGHE (°C) | Slinky HGHE (°C) | Air (°C) | Linear HGHE (°C) | Slinky HGHE (°C) | Air (°C) | Linear HGHE (°C) | Slinky HGHE (°C) | Air (°C) | |||||||
| tL,O | tLR,O | tS,O | tSR,O | te,O | tL,O | tLR,O | tS,O | tSR,O | te,O | tL,O | tLR,O | tS,O | tSR,O | te,O | |
| Mean (°C) | 7.08 | 9.30 | 5.11 | 8.16 | 3.98 | 7.75 | 9.40 | 6.01 | 8.78 | 6.45 | 9.20 | 10.01 | 7.90 | 9.51 | 6.87 |
| Standard deviation S (K) | 4.76 | 3.74 | 4.94 | 4.05 | 5.70 | 3.91 | 3.12 | 4.00 | 3.37 | 4.75 | 3.68 | 3.36 | 3.72 | 3.58 | 5.14 |
| Minimum xmin (°C) | 2.00 | 5.23 | −0.19 | 3.87 | −11.54 | 2.75 | 5.84 | 0.59 | 4.96 | −9.13 | 4.45 | 6.01 | 3.13 | 5.05 | −4.96 |
| Maximum xmax (°C) | 17.14 | 16.74 | 16.71 | 16.51 | 18.50 | 16.93 | 15.78 | 16.09 | 16.46 | 17.09 | 17.06 | 16.53 | 16.58 | 16.77 | 20.06 |
| Median (°C) | 5.11 | 7.78 | 3.06 | 6.27 | 3.66 | 6.54 | 8.36 | 4.98 | 7.94 | 6.07 | 8.29 | 9.07 | 6.75 | 8.69 | 6.50 |
| Lower quartile Q1 (°C) | 2.90 | 5.85 | 0.91 | 4.54 | −0.11 | 4.33 | 6.71 | 2.48 | 5.80 | 3.25 | 6.23 | 7.11 | 4.88 | 6.53 | 2.72 |
| Upper quartile Q2 (°C) | 10.89 | 12.44 | 8.22 | 11.51 | 8.13 | 10.73 | 12.36 | 9.39 | 11.69 | 9.74 | 11.82 | 12.92 | 10.56 | 12.49 | 11.01 |
| Variance S2 (K2) | 22.66 | 13.98 | 24.42 | 16.41 | 32.50 | 15.29 | 9.74 | 16.01 | 11.37 | 22.52 | 13.54 | 11.29 | 13.82 | 12.83 | 26.47 |
| Coefficient of variation S% (%) | 67.24 | 40.22 | 96.77 | 49.67 | 143.10 | 50.43 | 33.21 | 66.57 | 38.40 | 73.56 | 40.00 | 33.55 | 47.07 | 37.69 | 74.93 |
| Range R (K) | 15.14 | 11.51 | 16.90 | 12.64 | 30.03 | 14.18 | 9.94 | 15.50 | 11.50 | 26.22 | 12.62 | 10.52 | 13.45 | 11.72 | 25.03 |
| Interquartile range Q2–Q1 (K) | 7.98 | 6.59 | 7.30 | 6.97 | 8.24 | 6.40 | 5.65 | 6.91 | 5.89 | 6.49 | 5.59 | 5.81 | 5.69 | 5.96 | 8.29 |
| Quantile Characteristics | 2013 | 2014 | 2015 | ||||||||||||
|---|---|---|---|---|---|---|---|---|---|---|---|---|---|---|---|
| Linear HGHE (°C) | Slinky HGHE (°C) | Air (°C) | Linear HGHE (°C) | Slinky HGHE (°C) | Air (°C) | Linear HGHE (°C) | Slinky HGHE (°C) | Air (°C) | |||||||
| tL,St | tLR,St | tS,St | tSR,St | te,St | tL,St | tLR,St | tS,St | tSR,St | te,St | tL,St | tLR,St | tS,St | tSR,St | te,St | |
| Mean (°C) | 14.31 | 13.06 | 13.97 | 13.62 | 17.05 | 15.48 | 14.39 | 15.25 | 14.88 | 17.57 | 16.35 | 15.30 | 15.60 | 15.68 | 19.32 |
| Standard deviation S (K) | 3.49 | 3.03 | 3.38 | 3.38 | 4.31 | 2.50 | 2.41 | 2.46 | 2.49 | 3.46 | 2.12 | 2.12 | 2.18 | 2.10 | 4.73 |
| Minimum xmin (°C) | 6.04 | 6.54 | 5.43 | 6.20 | 7.68 | 10.35 | 9.67 | 9.74 | 9.90 | 9.98 | 12.13 | 10.98 | 10.88 | 11.40 | 11.20 |
| Maximum xmax (°C) | 18.73 | 16.64 | 18.06 | 17.77 | 29.04 | 18.48 | 17.20 | 18.19 | 17.90 | 25.58 | 19.27 | 17.93 | 18.60 | 18.70 | 29.38 |
| Median (°C) | 15.14 | 13.77 | 15.02 | 14.46 | 17.20 | 16.24 | 14.87 | 16.05 | 15.53 | 17.04 | 17.02 | 15.91 | 16.36 | 16.37 | 18.48 |
| Lower quartile Q1 (°C) | 11.66 | 10.72 | 11.29 | 10.92 | 13.95 | 13.41 | 12.29 | 13.30 | 12.65 | 15.18 | 14.91 | 13.83 | 14.22 | 14.38 | 15.55 |
| Upper quartile Q2 (°C) | 17.44 | 16.00 | 16.76 | 16.77 | 20.13 | 17.50 | 16.55 | 17.22 | 16.97 | 20.04 | 18.05 | 17.07 | 17.19 | 17.13 | 22.77 |
| Variance S2 (K2) | 12.16 | 9.19 | 11.41 | 11.41 | 18.54 | 6.23 | 5.82 | 6.07 | 6.21 | 11.97 | 4.51 | 4.49 | 4.76 | 4.40 | 22.39 |
| Coefficient of variation S% (%) | 24.36 | 23.20 | 24.18 | 24.80 | 25.26 | 16.13 | 16.76 | 16.16 | 16.74 | 19.69 | 12.99 | 13.85 | 13.98 | 13.37 | 24.49 |
| Range R (K) | 12.69 | 10.11 | 12.63 | 11.57 | 21.36 | 8.13 | 7.53 | 8.45 | 8.00 | 15.60 | 7.14 | 6.95 | 7.72 | 7.30 | 18.18 |
| Interquartile range Q2–Q1 (K) | 5.78 | 5.27 | 5.47 | 5.85 | 6.18 | 4.09 | 4.26 | 3.92 | 4.32 | 4.86 | 3.14 | 3.24 | 2.97 | 2.75 | 7.22 |
| Heating Period | Mode (°C) | Relative Frequency wi (%) | |
|---|---|---|---|
| 2012–2013 | tL,O | [2.10; 4.00] | 41.3 |
| tS,O | [0.10; 2.00] | 37.6 | |
| 2013–2014 | tL,O | [4.10; 6.00] | 27.4 |
| tS,O | [2.10; 4.00] | 24.3 | |
| 2014–2015 | tL,O | [4.10; 6.00] | 23.2 |
| tS,O | [4.10; 6.00] | 32.8 | |
© 2017 by the authors. Licensee MDPI, Basel, Switzerland. This article is an open access article distributed under the terms and conditions of the Creative Commons Attribution (CC BY) license (http://creativecommons.org/licenses/by/4.0/).
Share and Cite
Neuberger, P.; Adamovský, R. Analysis of the Potential of Low-Temperature Heat Pump Energy Sources. Energies 2017, 10, 1922. https://doi.org/10.3390/en10111922
Neuberger P, Adamovský R. Analysis of the Potential of Low-Temperature Heat Pump Energy Sources. Energies. 2017; 10(11):1922. https://doi.org/10.3390/en10111922
Chicago/Turabian StyleNeuberger, Pavel, and Radomír Adamovský. 2017. "Analysis of the Potential of Low-Temperature Heat Pump Energy Sources" Energies 10, no. 11: 1922. https://doi.org/10.3390/en10111922
APA StyleNeuberger, P., & Adamovský, R. (2017). Analysis of the Potential of Low-Temperature Heat Pump Energy Sources. Energies, 10(11), 1922. https://doi.org/10.3390/en10111922