Article

The Future of Sustainable Energy Production in Pakistan: A System Dynamics-Based Approach for Estimating Hubbert Peaks

1
State Key Laboratory of Water Environment Simulation, School of Environment, Beijing Normal University, Beijing 100875, China
2
Institute for Energy, Environment and Sustainable Communities, University of Regina, Regina, SK S4S 0A2, Canada
3
Department of Electrical Engineering, Energy Environmental Engineering Research Group, Mehran University of Engineering and Technology, Jamshoro 76062, Pakistan
4
Department of Mechanical Engineering, Quaid-e-Awam University of Engineering, Science and Technology, Nawabshah 67450, Pakistan
5
State Key Joint Laboratory of Environmental Simulation and Pollution Control, School of Environment, Beijing Normal University, Beijing 100875, China
*
Author to whom correspondence should be addressed.
Energies 2017, 10(11), 1858; https://doi.org/10.3390/en10111858
Submission received: 7 October 2017 / Revised: 24 October 2017 / Accepted: 25 October 2017 / Published: 13 November 2017
(This article belongs to the Section L: Energy Sources)

Abstract

:
This paper presents an effort pertaining to the simulation of the future production in Pakistan of different primary energy resources, i.e., coal, natural gas and crude oil, thereby constructing Hubbert peaks. In this context, the past 45 years’ production data of primary energy resources of Pakistan have been analyzed and simulated using a generic STELLA (Systems Thinking, Experimental Learning Laboratory with Animation) model. The results show that the Hubbert peak of Pakistan’s crude oil production has been somehow already achieved in 2013, with the highest production of 4.52 million toe, which is 1.51 times the production in 2000. Similarly, the natural gas peak production is expected in 2024 with a production of 32.70 million toe which shall be 1.96-fold the extraction of the resource in the year 2000. On the other hand, the coal production in the country has been historically very low and with a constant production rate that is gradually picking up, the peak production year for the coal is anticipated to be in the year 2080 with an estimated production of 134.06 million. Based on the results of this study, which provide a greater understanding of future energy patterns, it is recommended that an energy security policy be devised for the country to ensure sustained supplies in the future.

1. Introduction

Pakistan is located in South Asia, covering an area of 796,095 km2 of land with latitudes 24° and 36° north and longitudes 61° and 76° east [1]. At the moment, the country is termed as an energy deficient nation and relies heavily on imported fossil fuels [2,3,4]. According to estimates around 60% of the total foreign exchange of the Pakistanis is spent on importing the fossil fuels. The country is importing an estimated 308.9 thousand barrels of oil per day while the domestic production is less than 63,000 barrels per day [5]. Pakistan is also an importer of the coal, despite the fact that there are around 187 billion tonnes of total coal reserves in the country [6]. The country, however, otherwise has limited fossil energy resources of its own and has a low per capita energy consumption of 501.6 kg oil equivalent compared to the global average of 1790 kg oil equivalent [7,8]. Pakistan is, therefore, facing significant challenges in the energy sector towards meeting the demand which is growing at a rate of 11 to 13% per year. The energy requirement of Pakistan was 62.56 million tons of oil equivalent (toe) in 2008–2009 [9] which are estimated to rise to the level of reach to 179 million toe in the next two decades.
The ongoing energy crisis in the country can be traced back to the power policies of the early 1990s. These policies opened the doors for private sector investors to produce electricity by installing thermal power plants based on imported oil and natural gas. As such, a significant change in the energy fuel mix (Figure 1) of the country was observed owing to the huge quantity of oil and natural gas that was imported. This also changed the energy consumption paradigm across various sectors in the economy (Figure 2), adversely impacting some of these sectors such as transportation and power generation sectors [9,10].
The import of fossil fuels had substantially raised Pakistan’s energy import bill over the years. As a result of these power policies, the oil import bill, which was USD 530 million in 1994, has surpassed USD 1400 million in recent years. This expenditure on importing oil represents 40% of the country’s total fossil fuel import bill, which is otherwise USD 14.5 billion and accounts for 20% of all foreign exchange spending [16]. It is, therefore high time to adopt energy management practices which should focus on reducing the country’s reliance on imported fossil fuels and explore the local potential of primary energy supplies as well as harnessing renewable energy resources in the overall energy fuel mix.
This paper analyses, assesses and simulates the historical and future primary energy production of Pakistan to provide an opportunity to the energy planning and policy makers to consider the estimated results of this study which duly take care existing reserves and their expected lifetime.
In this context, one of the possible ways to simulate the oil, coal and natural gas cumulative production and ultimate recovery is to construct Hubbert peaks based on historical data by assuming constant extraction rates of these resources. This paper is thus the first effort of its kind which taking into account the historical and anticipated future production rates of primary energy commodities hypothesises the production pattern in the way proposed by M.K. Hubbert.
The remainder of the paper is organized as follows: Section 2 provides a detailed account of the primary energy resources of Pakistan, while Hubbert peaks and their applications are discussed in Section 3. The methodological framework is implemented in Section 4. The results of this study are provided and discussed in Section 5, and finally conclusions and policy recommendations are contained in Section 6.

2. Primary Energy Resources of Pakistan

2.1. Coal

Among the different primary energy resources, coal is the most abundant fossil fuel of Pakistan. Hence, with huge estimated coal reserves of 185.175 billion tons, Pakistan ranks as the fourth richest country worldwide [17,18]. Some studies suggest that by utilising this huge coal potential, Pakistan could produce as much as 100,000 MW of electricity for a lifetime of 30 years [19].
The lignite coal reserves of the country constitute about 97% of the total coal reserves, whereas the remaining 3% are bituminous and sub-bituminous coal [20]. The total coal reserves in the country as on 30 June 2014, are reported by the Hydrocarbon Development Institute of Pakistan (HDIP) to be 186,007 million tons, which has been categorized as measured reserves; 7775 million tons, indicated reserves; 19,412.5 million tons; inferred reserves; 44,524 million tons and hypothetical reserves being 114,293 million tons (Table 1).
Balochistan province is believed to be one of the most mineral-rich areas of the country, but in the 1990s huge reserves of lignite coal were discovered in the Tharparkar district of Sindh Province (Figure 3). These reserves are so huge that they represent almost 95% of the total reserves of the country. The Thar coalfields are about 8800 km2 in area and are estimated to contain about 193 Gt of lignite coal [21]. The figure below shows some major reservoirs of oil, gas and coal mentioned in the 2015 Pakistan Energy Yearbook. Because indigenous coal resources are abundant in the country, the government therefore plans to incorporate more and more coal into the energy fuel mix. This will possibly replace oil which is often imported. However, the consumption of the coal in the country is not encouraging owing to the availability of subsidised and clean fuel, i.e., natural gas [6]. However, according to an earlier study, which examined the liaison between coal consumption and economic growth of Pakistan over the period 1971–2009 [22], there is a positive correlation between economic growth and coal consumption. The elasticity between the two variables has been found ranging from 0.11 to 0.14. This proved that 1% rise in coal consumption causes 0.11–0.14% growth in the income.
The statistics provided by HDIP in the form of an energy yearbook starting from 1992 show that coal consumption (demand) only exists in three sectors of the economy, i.e., the domestic, industrial and power generation sectors (Figure 4). Of these, the coal consumption demand for domestic and power generation use is extremely low compared to the industrial sector. The utilisation of coal mainly takes place in the cement and bricks kiln industries which consume comparatively more coal. The quality of locally available coal reserves in the country is, however, not so promising because its low heating value. The heating value of Thar coal ranges from 6223 to 10,288 Btu which is comparatively low. Similarly, the coal seam thickness in the Thar fields is, in the range of 0.25–12.58 m, which raises questions about the economic viability of the coal reserves at certain locations. Further, the dislocation of Thar coal fields, non-availability of basic access infrastructure and other fundamental issues are key barriers to the development of the Thar coal fields. Consequently, Pakistan still imports four million tons of coal to meet its needs [23].

2.2. Natural Gas

The first ever reserves of natural gas of the Pakistan were discovered in 1952 in the Sui district Baluchistan Province. These reserves had substantial natural gas, and supply from the Sui gas field commenced in 1955 [6]. Since then natural gas had formed a major portion of the primary energy supplies of Pakistan. Later additional natural gas reserves have also been discovered in other parts of the country, with major fields in Sindh and Balochistan provinces. In 2017, natural gas supplies constituted 47% of the total primary energy supplies. All the major consumer groups, i.e., domestic, commercial and industrial sectors, are supplied by locally available natural gas. This available cheap source of gas has contributed greatly to the economic development and improved the industrial output substantially. However, this indigenous sources of gas are now believed to be depleting as the production from the Sui gas field has reduced over the years [23]. On the other hand, with increased demand ensuring the supply of natural gas is becoming a serious challenge. Over the past couple of decades, natural gas consumption has increased substantially, making Pakistan one of the biggest consumers of natural gas in South Asia. This is largely due to the low price. Although the overall consumption of natural gas is not higher in the transport sector compared to the power and industrial sectors (Figure 5), nevertheless, the demand in the transport sector, which commenced in 2002, has increased significantly over the years because of the high efficiency of this fuel, wherein one kg of compressed natural gas provides better mileage when compared to one-litre of diesel or petrol [24]. The association of natural gas vehicles reported that Pakistan has the highest number of vehicles running on CNG, i.e., 3.1 million with 3330 CNG refuelling stations until December 2008 [25].
From an economic point of view, natural gas demand is correlated to the individual income. In this context, Khan [26] concluded that medium-to-long-term gas demand for Pakistan is based on the single-equation market demand model which states that per capita natural gas demand is positively related to per capita real income, the average real price of natural gas and real prices of substitutes.
The historical natural gas records show that Pakistan did not import natural gas until 2014. There are around sixteen different companies in Pakistan involved in natural gas supply and distribution. These companies produced/processed around 1,486,993 million CFt of natural gas in 2014 (Table 2). Oil and Gas Development Company Limited (OGDCL) is one of largest natural gas supplying companies, with a market share of 28.7% of the natural gas produced/processed in 2014.
The natural gas demand in the power generation sector is also substantially high. It is mainly owing to power policies of the country from 1994 onwards which encouraged the private sector investments in the power generation based on cheap and clean fuels. As such, various independent power producers have set up power plants based on natural gas and oil. It is evident from Figure 5 above that natural gas consumption was higher in the industrial sector in 2007. One of the possible explanations for this fact could be that since 2006, electricity load shedding has become a regular power management practice to manage the electricity shortfall. Therefore, the industrial sector started consuming extra natural gas to produce power locally at captive power units. Similarly, a continuous rise in natural gas demand in the domestic sector is also evident since natural gas is also used by domestic consumers to produce electricity when the on-grid electricity is not available during load shedding hours. However, there is no segregated data available to suggest natural gas demand for producing electricity by the domestic sector. A detailed analysis pertaining the natural gas production, imports and consumption is provided in the Results and Discussion section of this paper.

2.3. Crude Oil and Petroleum Products

Pakistan has a total sedimentary area of 827,268 km2 which includes both onshore and offshore areas, which could be used for exploration and development of oil and gas. In 2007, the exploration density was quite low, i.e., around one well/1446 km2 of the available area [6]. The main factor that contributes to ensuring the enhanced amount of the proven reserves and probable recovery is the amount of exploration activity. Since exploration is the first step; therefore, the more the exploration the higher the success and probability of making further discoveries. The other element that affects the success rate is the nature of the geographic area, i.e., the larger the sedimentary area the better are the chances and vice-versa. According to some reports, the success rate of exploratory activities in Pakistan is actually quite high, i.e., seven times the world average based on the drilling density which is five times lower than the world average [27]. The latest figures (Table 3) shows that until 2014, Pakistan had dug 1214 development wells and 891 exploratory wells with an overall success ratio of 1:3.1. These successful discoveries include 80 oil wells and 108 gas/condensate sites.
Different companies are licensed for crude oil exploration and processing, led by OGDCL which undertakes nearly a 50% share in the activities. In 2013–2014 there were a total of nine different oil refining companies undertaking refining activity of 18.8 million tons of oil/year. These companies not only processed and refined locally produced oil (3.89 million tonnes) but also refined imported crude oil which amounts to twice the locally produced oil, i.e., 7.92 million tonnes. During the fiscal year 2013–2014, the oil supplies showed a significant increase of 9.7% compared to the previous year. Thus, oil contributed 34.4% of the primary energy supply. Oil production moved up by 13.5% from 76,277 barrels per day in 2012–2013 to 86,533 barrels per day in 2013–2014. Extensive activities are reported in the upstream sector where 50 exploratory and 50 development/appraisal wells were drilled (Figure 6).
The drilling efforts resulted in 28 discoveries, mostly of the gas/condensate. Imports of crude oil by the refineries increased by 8.6%, and the import of motor spirit has also increased by 26%; as such, the overall import of petroleum products increased by 3% in the year 2013–2014 as compared to the previous year. The oil import bill for the year 2013–2014 thus stood at USD 15.47 billion [9]. Oil and petroleum products, therefore, hold a very important position in the energy profile of Pakistan. The main consuming sectors of oil and petroleum include the domestic, industrial, transport, power generation, agriculture and other government sectors (Figure 7).
The highest demand for oil and petroleum commodities is by the transport sector followed by the power and industrial sectors. This is because the mode of transportation in the country is mainly road-based, i.e., the country lacks mass transit systems, and the contribution of rail-based transportation is very limited. Similarly, a major portion of electricity is generated by oil-fired power plants which result in a significant demand for oil by the power generation sector. The consumption of oil in domestic and agriculture sectors is comparatively very low. In the case of agriculture, a possible explanation for low consumption is because this important sector is not fully mechanized in Pakistan. The consumption of oil in agriculture sector mainly involves tractors and seed sowing machines.

3. Hubbert Peaks and Its Applications

3.1. History and Rationale

Depletion of hydrocarbon resources is of great concern due to the limited availability and peak production of these resources expected in the near future. Worldwide estimates of these limited resources in different regions compel us to take this matter more seriously. Therefore, the growth curve models based on historical data using Hubbert’s thesis has been constructed to forecast future production and estimate the current reserves around the world [28]. M.K. Hubbert was the first to use a quantitative technique called Logistic Growth Curve or Hubbert’s Curves to simulate the production of conventional crude oil in the lower 48 states of the USA. Based on historical production data and existing reserves, Hubbert predicted that crude oil production in the USA would peak in the late 1960s or early 1970s and decline thereafter [29]. He faced some critics at that time, but despite that, the predicted peak indeed occurred in the 1970s and despite remarkable advances in technology and additional reserves discoveries in Alaska, currently, the USA produce 50% of the oil compared to 1970 level. The Hubbert peak production idea was initially rejected by the majority of academicians and businessmen. It was not until 1998 when two geologists, Dr. Colin J. Campbell and Jean Laherrere published a paper entitled “The end of cheap oil” followed by a speech on oil depletion at the Clausthal University of Technology in Germany; when Hubbert curves again gained attention [30]. From there onwards, the Hubbert theory of oil depletion has been used as a method to forecast the future the global oil production stating that oil production in large regions follows a bell-shaped curve over time [31,32]. Hubbert theory and production curves continue to have both followers and critics today. The theory is especially criticized for not considering the likelihood of an increase in the price of crude oil due to decreased supply and varying production from time to time which will eventually affect the total size of reserves. Thus, the main criticism of the Hubbert curve concerns two factors: the impact of technological development and the effect of the oil price on oil supply [33].
Originally, Hubbert developed his prediction empirically. He simulated past production data by a normal or Gauss bell-shaped curve based on two major assumptions: (i) the production rate must start from zero, rise to a maximum, then decline to zero and (ii) the area under the production curve is equal to the ultimate oil recovery as time approaches infinity. Later, Hubbert established the mathematical base for the model where a logistic curve was employed to fit cumulative oil production against time [34]. According to Gallagher [35], an idealised Hubbert curve (IHC) is defined as having features of production data as a result of a constant growth-rate under constant resource limits. Thus, IHC represents a potential production curve developed from cumulative production data and offers a new perspective for estimating peak production periods and leftover resources. He provided the IHC model data which shows that idealized global peak crude oil production would happen in 2009 at 83.2 Mb/d (30.4 Gb/y). Thus, IHC simulations of truncated past oil production data provided similar results and indicated that this methodology could be useful as a forecasting tool. The Hubbert production model can be used to simulate the historical production data (say coal production) and predict production in the future as under [36]:
Q =   U R R 1 + e ( t t max ) / w
where Q is the cumulative coal production, URR the ultimately recoverable resources, t the year, tmax the year of coal peak and w a parameter that varies to least the residual sum of squares of fitted values and observed values.
In the literature based on Hubbert curves addressing the fossil fuels resources and reserves mostly, certain terms with acronyms such as: “Estimated Ultimate Recovery” (EUR), “Ultimate Recoverable Resources” (URR), “Ultimate Recovery” (UR), or simply “Ultimate” are used. These terms describe the total recovery from a field, which is the sum of past cumulative production, remaining proved plus probable (2P) reserves, backdated reserves and undiscovered risked mean resources. However, these quantities should not be confused with the different levels of recoverability of different amounts of fossil fuels [37]. The logistic fit used to forecast coal extraction in the USA varies with the length of data used in the simulation process. The results obtained by using time series up to 1989, 1999 or 2009 predicts different results, i.e., 52, 71 or 96 Gigatonnes of reserves, respectively. It further forecasted that the peak production should have arrived in 1951, 1967 or 1986, which is not the case. Instead, production has improved since 1986. This explains the drawback of the Hubbert model, i.e., not being able to project the decline in supply. On the other hand, an exponential curve depicts the same variation with the difference being an everlasting increase in the supply which is also not acceptable. However, it can be said that without sufficient evidence the logistic curve cannot be accepted either [38]. According to Brandt [31], there are noteworthy challenges in the present approaches for forecasting future oil production. Two types of issues arise, the first one as a result of using poor data, and the second one coming from the uncertain terminology and procedures employed. The problem of data availability is due to lack of access to oil data and available resources, i.e., the exact quantity of oil is still not known. However, this uncertainty is addressable as the exploration activities improve the estimates of the reserves.

3.2. Comparisons of Hubbert Peak for Forecasting Fossil Fuel Production

There has been an active debate for a long time about the availability of oil in the future. Thus, according to one school of thought, peak oil production is likely to happen, which will end the availability of cheap oil now or in the near future. The other school of thought are the “unconcerned” ones who believe that there will be no problem in the availability of oil in future. This difference of opinion between concerned and unconcerned groups is because of a potential lack of common points of reference [39]. However, it is a fact that the production rate of any mineral resource will peak and then decrease till the exhaustion of the economically recoverable reserves. Thus, what is left for debate is the time at which the production will reach its peak. Hence, what needs to be done if the peak is likely to happen in the near future is to arrange alternative fuels and ways of recycling. Nevertheless, the debate about the time of peak is still ongoing, for resources ranging from oil to phosphate rocks [40].
In the meantime, there are various studies in the literature pertaining to forecasting and finding the peak consumption of fossil fuels. A few of these important studies are discussed hereinunder. Forecasts of oil production in Brazil, according to the Hubbert model and different probabilities for adding reserves were made by Szklo, et al. [41]. They explained why the Hubbert model might be more appropriate to the Brazilian oil industry than that of Hoteling, as it implicitly emphasises the impacts of information and depletion on the derivative over the time of the accumulated discoveries. Their findings showed that Brazilian oil industry is at a stage where the positive impacts of information on expanding reserves (mainly through discoveries) may offset the negative impacts of depletion. Tao and Li [42] used the generic STELLA (Systems Thinking, Experimental Learning Laboratory with Animation) model to simulate the Hubbert Peak for Chinese oil production. This model has provided some solid results, and therefore, demonstrated to be robust. In this study, three scenarios were developed to estimate the Chinese oil peak. According to scenario 1 of this model, the Hubbert Peak for China’s crude oil production would arise in the year 2019 with a value of 199.5 million tonnes, which is about 1.1 times the 2005 output. For the Chinese raw coal production, Tao and Li [43] applied the generic STELLA model to simulate the Hubbert Peak. According to this simulation, the coal peak in China would be attained between the year 2025 and 2032, with peak production at about 3339–4452 million tonnes. Using the logistic growth model of Lin and Liu [36], the coal peak of China is estimated to be reached in the year 2025, and the peak production would be 3.83 billion tons.
Lin and Wang [44] used a logistic growth model and Gaussian curve model to forecast the production peak and import trends of natural gas in China. The logistic growth curve was used to fit the historical data of natural gas production and predict the future production of natural gas. Reference [45] estimated Brazil’s oil production curves according to different URR scenarios (P95, P50 and P5) by applying a modified multi-Hubbert model. This model improved the classic methodology by adding productive cycles and allowing the revision of the assumption that production rate is strictly proportional to the first power of both depletion and information effects. Chavez [46] evaluated two scenarios for the oil production in Peru applying a Hubbert model. The first, in which a low investments in exploration and production and social and environmental barriers undermine the development of oil resources beyond the limits characterized as 2P; the second one is more optimistic, wherein current exploratory and production areas in Amazonia and low-explored offshore-shelf basins are developed, thus, increasing EUR to 3P reserves plus contingent resources. Maggio and Cacciola [37] used a predictive model based on a variant of the multi-cyclic Hubbert approach to forecasting the future trends of the world’s fossil fuel production. Starting from historical data on oil (crude and NGL), natural gas, and coal production, and taking into consideration three possible scenarios for the global scale (i.e., cumulative production plus remaining reserves plus undiscovered resources). This approach allowed them to determine that when these important energy sources would peak and start to deplete. Wang, et al. [47] used a multicycle Hubbert model to forecast China’s annual natural gas production and determine the peak production. In this study, the peak year and the future production trends based on several different URR scenarios were estimated. Moreover, in this study, a small-sample effective rolling GM (1,1) model was proposed for the first time to forecast exponential natural gas consumption with different lengths of data sets.

4. Theoretical and Methodological Framework

Hubbert’s thesis can be expressed as: “the yearly production pattern of any mineral adapts a bell-shaped symmetrical curve because of its geological occurrence (volume). Thus, when half of the total reserves are produced the curve reaches its peak, it is from this point onwards when the production gradually decreased to extraction, and the depletion of the resource starts” [40]. The curve fitting models such as the one proposed by Hubbert has been reported in the literature to be appropriate for forecasting first-order future production. It is especially considered suitable for data having indeterminate ultimately recoverable resources (URR) and when the producers are the price-takers in an economy. Therefore, various methods have been used to simulate oil production curves worldwide. These techniques can be broadly classified into three categories: the economic-based approach, the geophysical and hybrid models [45]. The economics-based approaches encompass economic variables such as oil prices, production costs, technological inputs and regulatory policies which drive the oil supply. The geophysical techniques involve curve fittings such as Hubbert production peaks and oil depletion theory being the most accepted approach [46]. Wang and Feng [48] identified four key factors that affect the results of curve fitting models, i.e., ultimately recoverable resources (URR), curve shape, number of cycles and maximum depletion rate. They also analyzed the influence of these factors on the model results theoretically.
The practice of looking into all fossil fuels and their reserve depletion independently and seriously is because certain fuels cannot be directly substituted by the others. This is evident from the high oil prices which would not have been as high if it could be replaced with natural gas. The plateau of oil production had already been witnessed in the year 2005 and even since the oil price is continuously rising which indicates that there are issues with respect to substituting oil with fuels. [49]. The Hubbert production model which was originally developed for oil has been used several times for forecasting all manner of fossil fuels since the time it was first introduced. This technique is used widely because of its simplicity and accuracy to estimate peak production, the peak year, and production of oil, natural gas and coal by stimulating growth over the time using simple derivation [47]. Suppose, for natural gas; peak production will be a point when its production will reach to its highest production and then the production will decline. The supporters of this theory further argue that for every fossil fuel before we determine the Hubbert peak, the reserves would have been fully explored, identified and confirmed and therefore at any point in time these reserves would continue to deplete. On the other hand, the opponents of peak theory claim that although the volumes of fossil fuels reserves are fixed, the estimates derived from peak theory are ambiguous and that the technological and economic factors are equally significant as of geological considerations [44].
It is true that there exist many uncertainties in estimating peak production for oil or other fossil fuels. Therefore, to find out the exact time of peak level production is difficult owing to multiple reasons. It is mainly because of inadequate knowledge of fossil fuels reserves in the underground followed by the complex relationship between economic factors such as oil production, demand, regional GDP growth, and global oil production. Similarly, the urge for exploration activities increases with increase in demand and when supply is limited accompanied by high prices, leaving little space for geological reasoning [50]. Despite these apprehensions, it is important to estimate the future primary energy production especially for a country like Pakistan which is suffering from an energy crisis. These crises are the result of poor planning and foresightedness in the energy sector. Therefore, the estimation of peak production of oil, natural gas and coal in the country will open new horizons for policy planners to consider and help minimize the import of fossil fuel by anticipating indigenous potential production and finding alternatives. The methodology followed in this study follows the work of Tao and Li [43] and Tao and Li [42] which has been briefly discussed in an earlier section of this paper. As such, the Hubbert peak production for coal, natural gas and oil of Pakistan has been simulated using historical data from the year 1971 to 2015. There are two key sources of historical data used in this study which are International Energy Agency (IEA) and Hydrocarbon Development Institute of Pakistan (HDIP), the ministry of petroleum and natural resources of the Government of Pakistan. However, in most of our analysis, we have used the IEA data because it dates back to 1971, while the HDIP’s data is only available from 1992 onwards. The HDIP data has been used for two reasons: one, to validate the IEA data by comparing it to the HDIP data and secondly because the IEA data does not consider imports. Therefore, we used the HDIP data for reporting the imports. The calculation of import of energy commodities have been performed in two ways: one from 1992 onwards we used the actual or real import data provided by HDIP; second, from 1971 to 1992 we used the definition of IEA for supply, i.e., Supply = Total production + import—international marine bunkers—international aviation bunkers. Thus, for the period where we did not have the actual import, we omitted the consumption in international marine and aviation bunkers and simply subtracted the production from supply and have reported it as the import.
The generic dynamic modelling tool STELLA 9.0.1 has been used for most of the simulation and modelling work in this study and analysis. It is because STELLA is highly effective, handy and suitable for dynamic modelling which involves time series data as well. The first step in the model was developing a conceptual MAP (Figure 8) of the variables required for the Stella interface.
For Hubbert peak estimation, two flow variables, two stock variables, and six subsidiary variables (converters) have been used. These parameters mainly include annual production, ultimate production, cumulative production and Hubbert production. Before putting data into the model, we calculated the historical production in the suitable units, cumulative production till a base year (2015), and ultimate recovery (using proven reserves + cumulative production until the base year).
The sub-window called “Model” in STELLA is used to transfer data into the model by defining information flow using converters. The production function is a temporal phenomenon, therefore, to be transferred to a graphical import table. The sub-window called “Equation” in Stella was used to set up equations for calculating Hubbert peaks used by Tao and Li [43] and Tao and Li [42] in their analysis for calculating Hubbert peaks for Chinese oil and coal. We repeatedly simulated coal, natural gas and crude oil using STELLA software by updating the annual production, ultimate production, cumulative production and Hubbert production for each commodity. One of the advantages of using STELLA amongst the other tools is that we simulated three different levels of production elasticity being the low, medium and high rate of future production which resulted into different peaks in different years in the future. The detailed results obtained in these cases are provided in the following Section 5 along with the discussion.

5. Results and Discussion

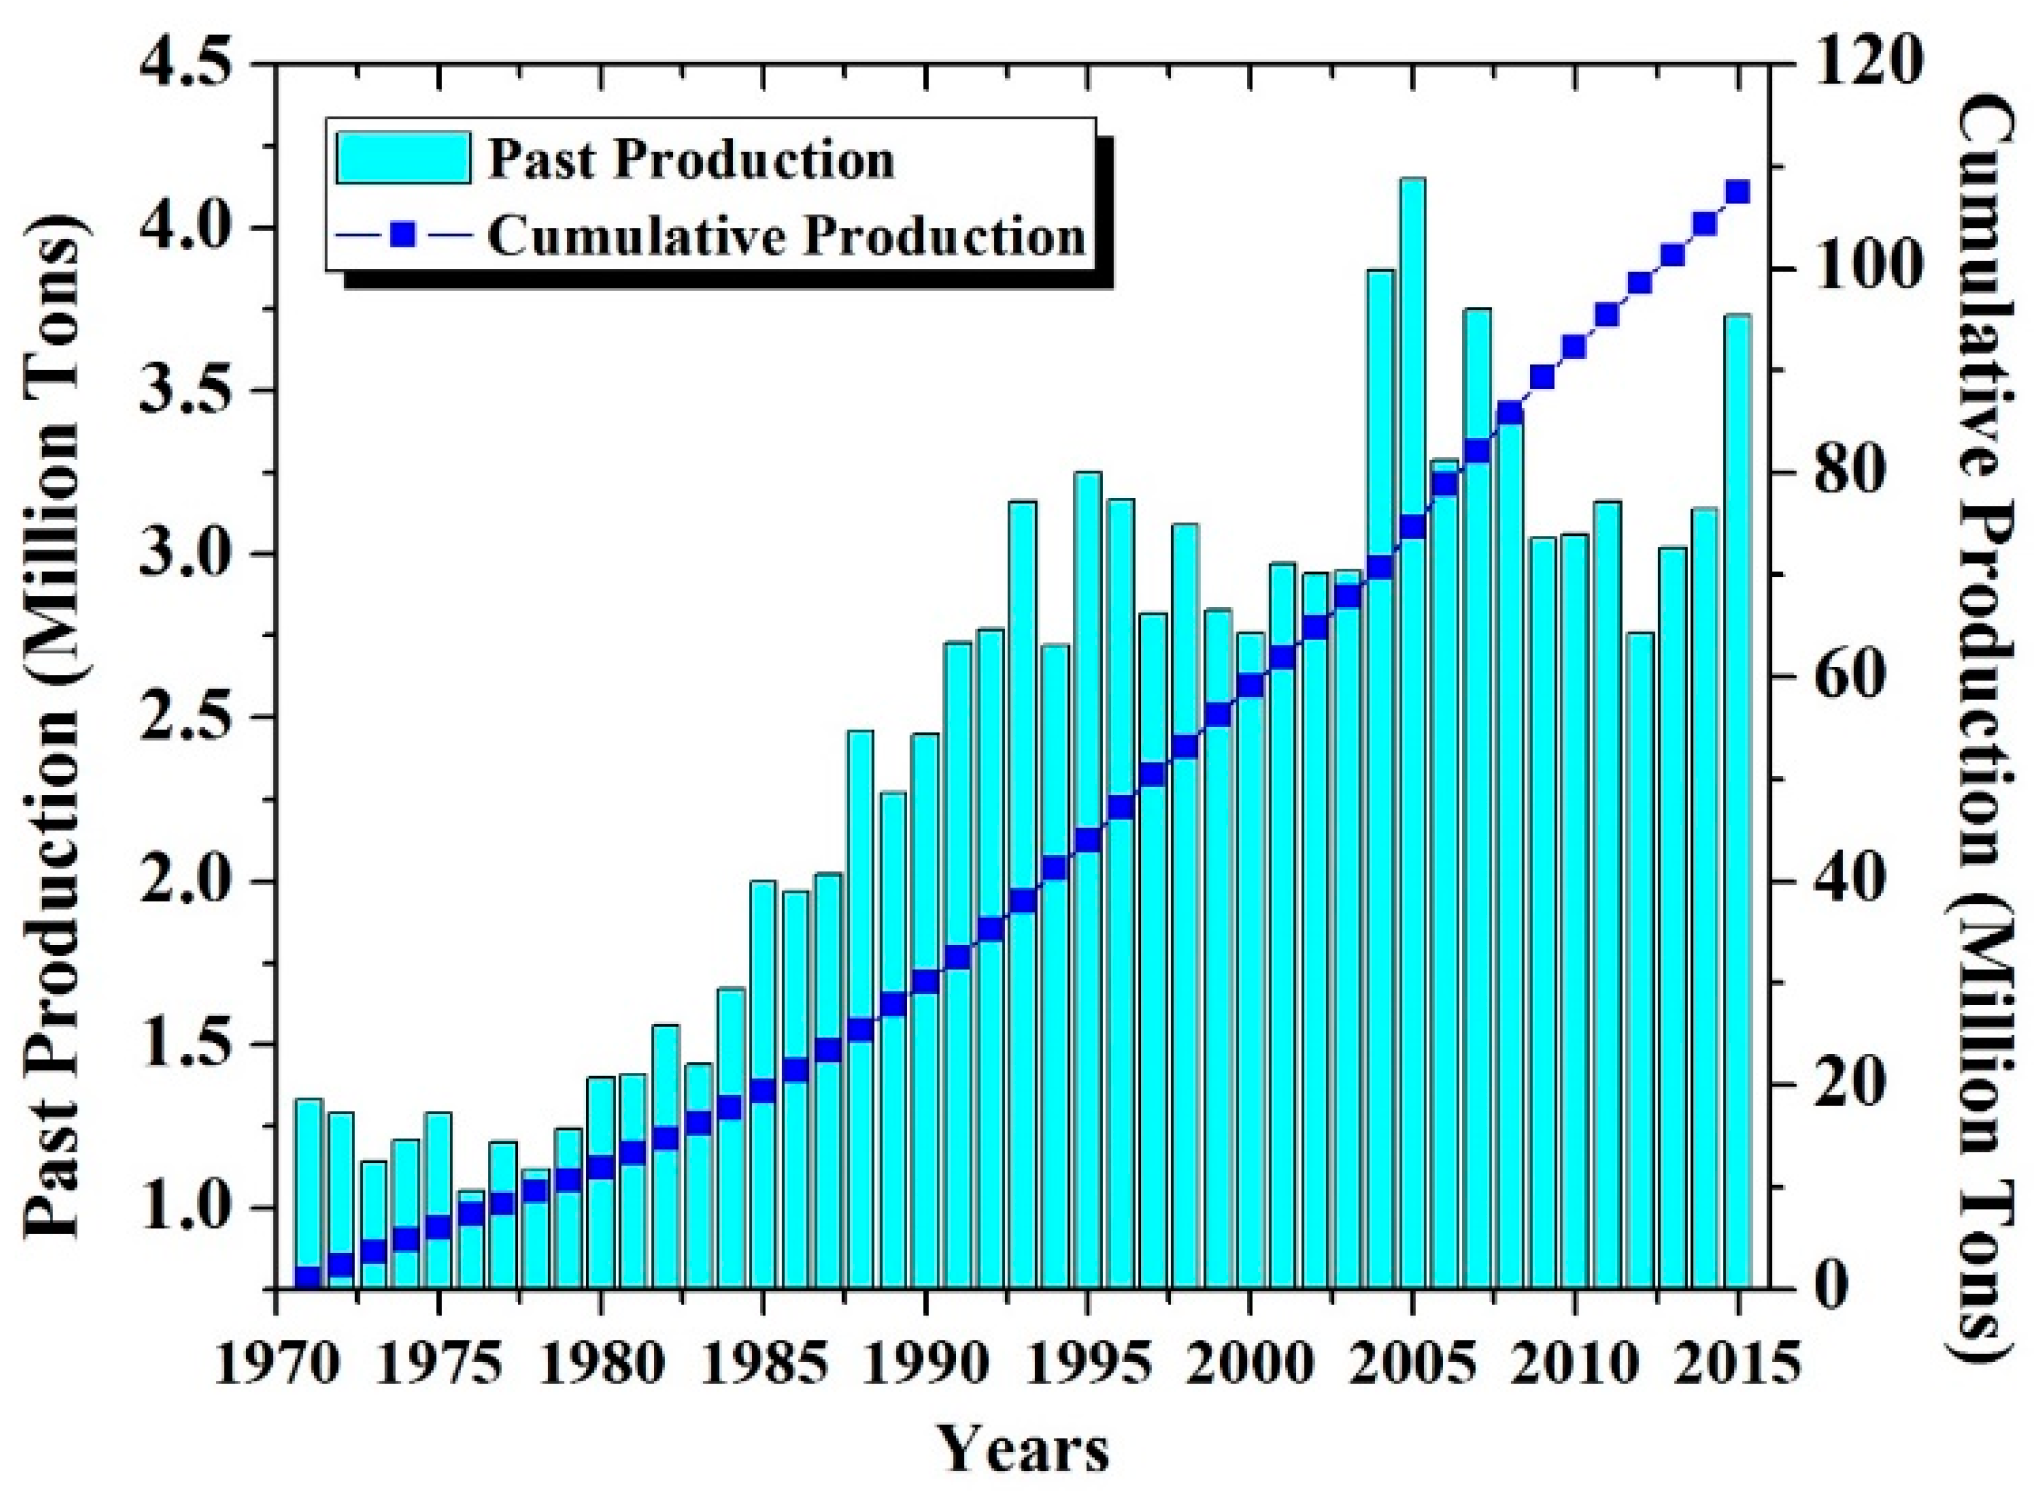
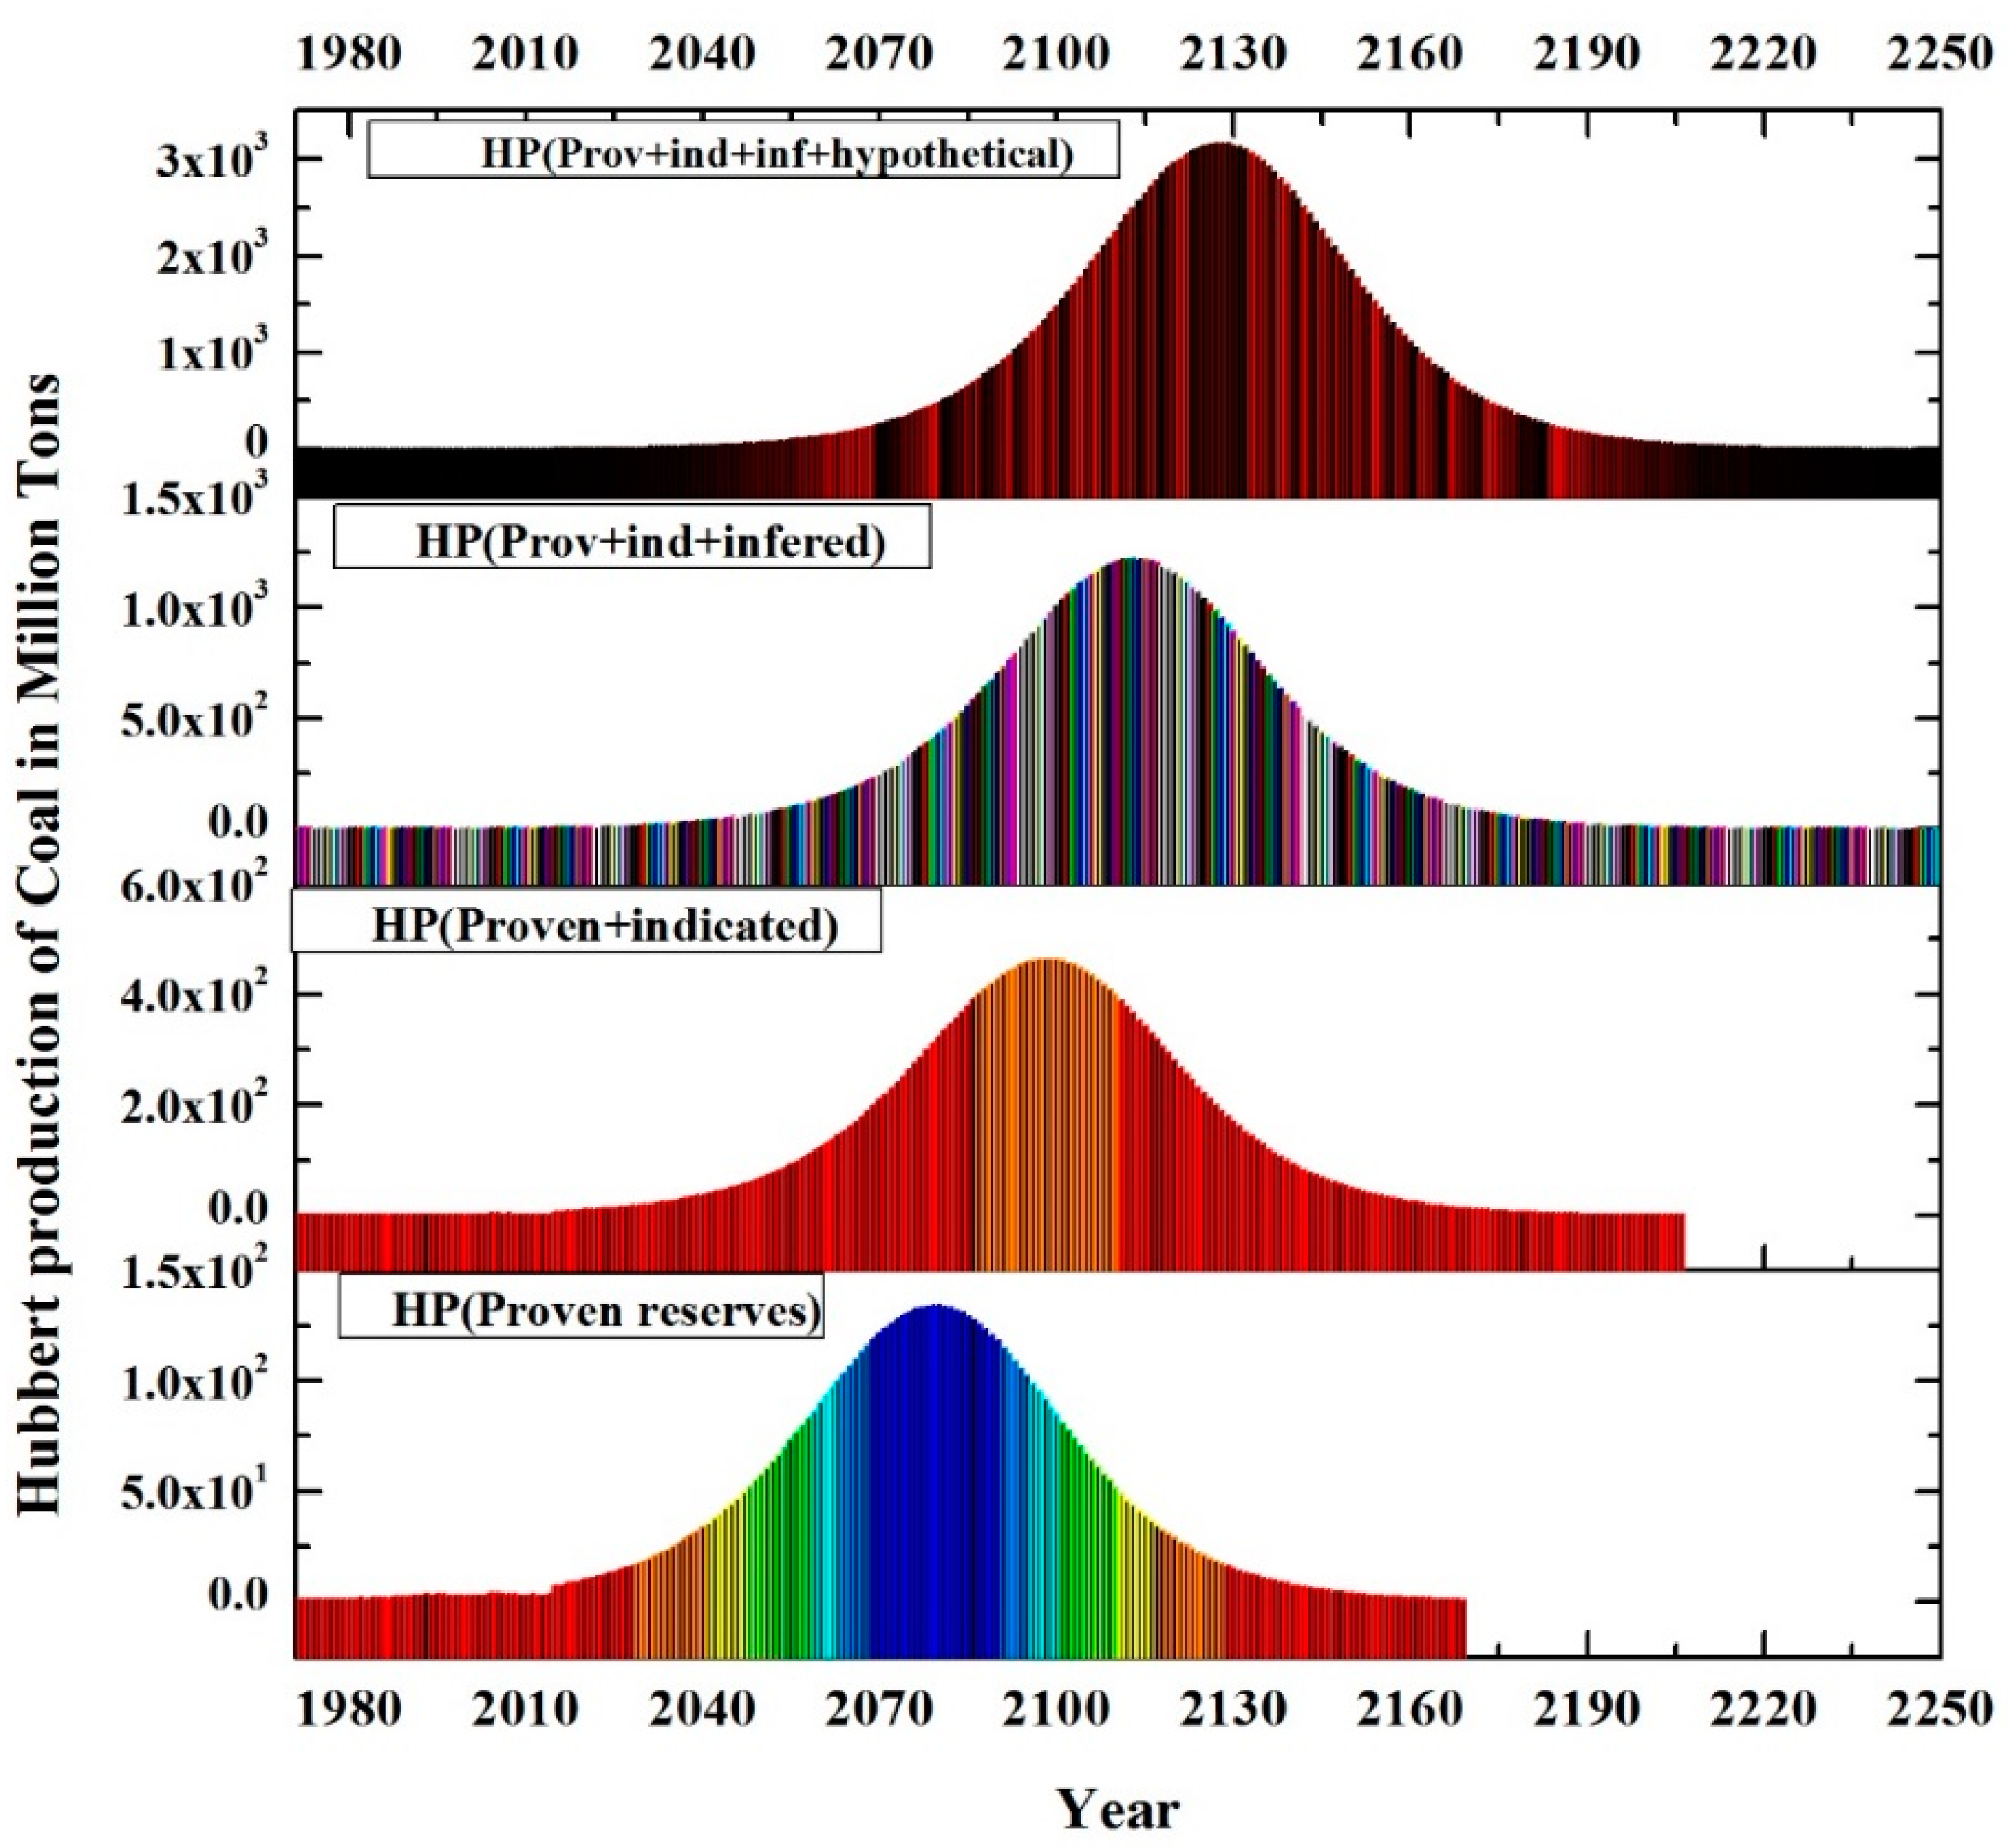
5.1. The Peak Production of Coal

Beside coal production within the country, it is equally important to investigate the total coal supply and importation along with coal consumption by the different sectors of the economy. Thus, historical coal supply data has been compiled which illustrate that although there are sufficient reserves of coal in the country, coal is still being imported, as shown in Figure 9. The coal production within the country increased from 597 ktoe in 1971 to 1098 ktoe in 1990 and finally to 1403 ktoe in 2014. Thus, there was only 2.0% of annual compound growth in the coal production during the past 44 years. Since most of the coal produced in the country is bituminous to sub-bituminous; therefore, some coal products are also imported. The estimated coal imports increased from 59 ktoe in 1971 to 903 ktoe in 1990, which marked 2052 ktoe in 2014. In 2014 only 169 ktonne of coal was transformed for power generation, while 4859 ktonne of bituminous coal, 1168 ktonne lignite coal, 16 ktonne coke-oven coke and 733 TJ blast furnace gas was used in the industrial sector alone.
Taking into consideration the past and cumulative coal production data (Figure 10) the Hubbert production peak was simulated using the STELLA modelling tool. The key variables which defined the Hubbert peak were ultimate recovery based on the total proved reserves along with actual production data as time series input. The results of coal peak production suggest that the peak production year in the Pakistan will be in the year 2080 with total coal production of 134 million tons of coal (Figure 11—HP proven reserves). These results are based on the total proven reserves reported by the ministry of petroleum and natural resources of Government of Pakistan as of latest reported until 30 June 2014.
The existence of coal reserves follows a classical phenomenon of geological occurrence and abundance based on exploratory surveys and are, therefore, they are reported as being proven, indicated, inferred and hypothetical coal reserves. We do not have such a classification and record keeping published by the government for other fossil fuels, i.e., crude oil and natural gas. It is believed that other countries may have such data which could be useful for in-depth analysis and more appropriate estimates of reserves under various probabilities. As such, besides forecasting coal peak production based on proven reserves, the analysis has also been undertaken considering the reserves with other levels of probabilities. Thus, we also estimated peak production by hypothesizing that the reserves suggested by geological studies being indicative, inferred or hypothetical and if these turn out to be recoverable would require determining updated production peaks. This supposition has an obvious effect on the estimates, and our results support the same outcome, i.e., the peak goes further than the peak obtained when the only smaller volume of proven coal reserves are considered.
For Pakistan, the definition of reserves being proven implies the measured reserves, having a high level of geological assurance, i.e., coal that lies within a radius of 0.4 km from the point of measurement. On the other hand, coal with lesser geological assurance are classified as indicated reserves, inferred reserves and hypothetical reserves being 1.4 to 1.2 km, 1.2 to 4.8 km and beyond 4.8 km away from the point of its measurement. Thus, after including even the three less probable reserves alongside the proven reserves, the peak production year varies (Figure 11).
This proves that there is an obvious effect of the total size of the reserves on production cycle and that with the passage of time as the technology advances and more and more exploratory activities are conducted the volume of the reserves will increase and hence the peak years will move forward (Table 4). On the other hand, if the rate of extraction increases due to government policies then the resource will deplete quickly and peak year will be experienced sooner.

5.2. The Peak Production of Natural Gas

For the future production and availability of natural gas, we have assessed the historical total natural gas supply as the sum of domestic production and import. Besides, the total supply, an important component of the demand-supply management is the final consumption (Figure 12). A detailed description of natural gas consumption across various sectors of the economy of Pakistan has already been presented in Section 2.2 of the paper. Out of the all the primary energy supply sources, natural gas is the only source of energy which has not been imported till 2014. This is perhaps because the government had plans to produce and utilize the enormous amount of natural gas from domestic reserves. The total supply of natural gas, therefore, increased from 2361.2 ktoe in 1971 to 10,077.2 ktoe in 1990 which reached the level of 26,285.3 ktoe in 2014. Thus, an overall 5.5% of annual compound growth can be observed in the past 44 years.
In order to estimate future production using Hubbert peak, we followed the yearly natural gas production data of IEA. Since it required total original recoverable reserves, so we followed the HDIP, the ministry of petroleum and natural resources data, according to which original recoverable reserves till June 2014 were 1101.62 million toe. Based on these two sources, the cumulative production till 2015 was 690.01 million toe (HDIP) and 620 million toe (IEA). We have used the IEA data to forecast production peak for natural gas in Pakistan. The results show that the peak production year for natural gas is expected to be in the year 2024 with a production of 32.70 million toe of natural gas (Figure 13). This amount of natural gas production is almost double the amount of production in the year 2000. The results of this study further suggest that the cumulative production rises continuously until the peak is achieved after which the productions start to decline thereby reaching its minimum limits.
There are various oil and gas exportation and development companies currently operating in Pakistan as mentioned in Section 2.2 of this paper. These exploratory and development activities are ongoing in all provinces of the country. Therefore, the production from different wells/sites is different from the estimations, i.e., certain wells have already reached their peak production limits and are in the stage of decline, while the others are still young. In this regard, an important study has also been undertaken by the Petroleum Institute of Pakistan (PIP) [51] thereby forecasting the future production of oil and gas in the country till 2025. However, according to the results of PIP [51] production of natural gas will be highest in 2017, i.e., 4.2 BCFD and from 2017 onwards the production will decline and shall be 2.4 BCFD in 2024. Thus, from the PIP study perspective, 2017 can be regarded as the peak production year of natural gas. PIP [51] further reported that in 2016 and 2017 the production from United Energy Pakistan (UEP) would rise along with a contribution from OGDCL’s KPD-TAY (Kunar Pasakhi Deep and Tando Allah Yar Field Development Project).
Mari gas is expected to remain the largest producer till the end of the forecast period (2025) with supplies of slightly less than 500 MMCFD in 2024. This field contributed to 15% of the country’s total gas supplies in 2015, and its share will increase to 21% by 2024 as output from other maturing fields declines at a higher rate. The production from the Uch field will peak around 450 MMCFD in 2017/2018 before declining to nearly 300 MMCFD in 2024. A declining trend also persists in the Sui field’s gas output throughout the forecast period, from an average of 420 MMCFD in 2015 to less than 250 MMCFD in 2024. A similar trend will be observed in the Qadirpur field, however, with a higher depletion rate as production is estimated at below 230 MMCFD in 2024 compared 450 MMCFD in 2015. The Qadirpur and Sui fields combined are nevertheless still anticipated to contribute about 20% of the total natural gas output of the country in 2024.
Thus, the outlook for natural gas production in the country is no encouraging, either from the perspective of discoveries nor the situation of already existing fields. This problem is further aggravated by the security situation in the country alongside increasing development costs and limited economic opportunities for exploration companies to make discoveries. This is mainly why the country’s natural gas production has not increased significantly from the year 2003 onwards. We can see that production in 2013, 2014 is even less than 2012 production of 26.5, 26.3 million toe and 27.1 million toe, respectively (Figure 14). According to PIP [51], this is because of the higher decline rates from maturing larger gas-producing fields such as Sui, Qadirpur, and Zamzam which have outweighed additions from newer fields. UEP has outperformed in enhanced natural gas output as well as with production, rising by nearly 49% between 2012 and 2014. The company’s output from the operated portfolio jumped to an average of 206 MMCFD in 2014 and increased further to over 400 MMCFD in 2015. We tested the possibility of change in the peak production year of natural gas with an increase in production rate during the forecasted period. The results suggest that with a low rate of production the production will be even lower than the current one, i.e., 25.82 million toe, expected in 2026. Similarly, under medium and high production rate the peak is expected in 2024 (production 29.26 million toe) and 2024 (production 32.70 million toe), respectively.

5.3. The Peak Production of Crude Oil

The crude oil and natural gas liquids (NGL) production has been analyzed and considered as one fuel, i.e., crude oil, throughout this paper and therefore by crude oil we mean both fuels collectively from now onwards. The production and availability of crude oil reserves in the country are less than those of coal and natural gas. Therefore, so far a substantial amount of crude oil has had been imported. The total supply increased from 3048.5 ktoe in 1971 to 10,522 ktoe in 1990, which was 24,155.25 ktoe in 2014. Thus, a compound annual growth rate of 4.7% was observed in the past 44 years. However, a major portion of this supply consisted of import which was 2451.5 ktoe in 1971, 9424.01 ktoe in 1990 and 19,954.21 ktoe in 2014. This reveals that Pakistan has been importing more than 80% of crude oil compared to its domestic supplies of less 20% since 1971 (Figure 15). We followed the same approach for estimating peak production and peak year of crude oil as have been undertaken for coal and natural gas. According to statistics published by HDIP, the ministry of petroleum and natural resources, the total original recoverable reserves of crude oil until June 2014 were 149.81 million toe. They further reported that the cumulative production till 2014 was 102.39 million toe.
Since we followed the IEA’s historical production data, a cumulative production amount of 104.84 million toe till 2015 have been used in our analysis (Figure 16). The results suggest that the peak production year for crude oil year had already passed in 2013 when the production was 4.52 million toe (Figure 17). Thus, from this point onwards the production is already on the decline and is continuously decreasing. Therefore, it is anticipated that the if further reserves of crude oil are not found in the country then the situation regarding availability of crude oil will worsen for the country and the imports of oil would rise in coming years.
The forecasting undertaken by PIP [51] also provides similar results as those of this study, with the difference that they have reported 2016 as a peak year. According to their estimates, after production rose to its peak in 2016, crude oil/condensate production will decline at a compound annual growth rate of 13.7% till 2024. The major share of crude oil production until 2016 is reported to come from OGDCL. Similarly, the Adhi field is expected to witness an increase in output to the tune of 8500 BPD in 2016 before entering its declining phase, while the Tal block is projected to enter a declining phase from 2015 onwards. Likewise, the production from the Nashpa field which currently produces around 20,500 BPD is anticipated to fall to approximately 14,000 BPD by 2020 and less than 10,000 BPD by 2024. Thus, both theoretical and ground situation support the thesis that crude oil reserves are on the verge of exhaustion in the country. Although around 50 exploratory and 50 development wells were drilled in 2014 alone, yet these attempts are not only insufficient, but have not delivered so far for fulfilling the country’s ever-rising demand for oil and petroleum products.

6. Conclusions and Policy Recommendations

Pakistan is not even on the list of the top 30 oil-producing countries. Therefore, this study might not be very fruitful towards understanding/estimating the phenomenon of global oil or gas peak. However, this work, on the other hand, designed in the spirit of facilitating Pakistan’s energy planning process, is significantly important as the country is facing an acute energy supply shortage. As such, this study is first of its kind which addresses primary energy production in the long run and provides important insights to devise a rational energy policy. We estimated peak production of coal, natural gas and crude oil in Pakistan using the Hubbert thesis. Our results are different for all three fuels, which is mainly because that all of these resources are supplied, produced, imported, consumed and available differently. Therefore, different policy narratives can be derived regarding the exploration, management, allocation, substitution and production of coal, natural gas and crude oil in the future.
We noticed that coal is the only abundant fossil fuel in Pakistan and production is expected to peak in 2080 with a production of 134.06 million tonnes. Therefore, the power production sector which is one of the key consumers of natural gas and oil can replace these with coal until renewable sources of energy are put into place. Since private sector investors own most of the thermal power plants, these companies should be encouraged to replace the oil and gas with coal using state of the art technologies. It should be noticed that coal run technologies carry significant environmental consequences regarding environmental emissions leading to air pollution and global warming. Thus, the substitution of oil and gas with coal must be accompanied by carbon-capture and storage technologies to mitigate the aforementioned negative impacts. The final decision in this regard shall also incorporate economic assessments based on cost-benefit analysis of coal, oil and gas run power plants. Our results suggest that oil is the scarcest energy resource in the country and the majority of what is available has already been produced. Therefore, sectors like transport need a revival thereby introducing better mass transit systems. The country lacks state of the art railways system followed by a lack of subways and fast trains. Thus, with the sixth biggest population in the world, public transport systems needs to be improved, which will save a handsome amount of natural gas and oil. We conclude that indigenous primary energy resources with its current production/availability are not sufficient to fulfill the anticipated energy demand. Thus, for optimal benefits both non-renewable and renewable energy resource development should be streamlined and projects based on the resources planned side by side, even if the country needs to import some inevitable quantity of fossil fuels in future.

Acknowledgments

This work was supported by National Key Research Program of China (2016YFC0502209), the National Natural Science Foundation of China (51522901), and the Fundamental Research Funds for the Central Universities. The authors extend deeper appreciation to the anonymous reviewers and editors for their constructive comments for improving the paper. The authors would like to greatly acknowledge the data management team of International Energy Agency (IEA), Hydrocarbon Development Institute of Pakistan (HDIP), Ministry of Petroleum and Natural Resources, Pakistan for the provision of data during this research.

Author Contributions

Syed Aziz Ur Rehman and Yanpeng Cai designed the study and undertook modeling work. Nayyar Hussain Mirjat and Gordhan Das Walasai analysed the model results, refined the technical aspects of the study, improved and finalized the manuscript. Izaz Ali Shah and Sharafat Ali along with Syed Aziz Ur Rehman undertook data collection and management task alongside developing preliminary write up of the study.

Conflicts of Interest

The authors declare no conflict of interest.

References

  1. Bhutto, A.W.; Bazmi, A.A.; Zahedi, G. Greener energy: Issues and challenges for Pakistan—Biomass energy prospective. Renew. Sustain. Energy Rev. 2011, 15, 3207–3219. [Google Scholar] [CrossRef]
  2. Douggar, M.G. Energy situation in Pakistan: Options and issues. Renew. Energy 1995, 6, 151–157. [Google Scholar] [CrossRef]
  3. Valasai, G.; Uqaili, M.; Memon, H.; Samoo, S.; Mirjat, N.; Harijan, K. Assessment of Renewable Energy for Electricity Generation: Using Pakistan TIMES Energy Model. Sindh Univ. Res. J. 2016, 48, 775–778. [Google Scholar]
  4. Valasai, G.D.; Uqaili, M.A.; Memon, H.R.; Samoo, S.R.; Mirjat, N.H.; Harijan, K. Overcoming electricity crisis in Pakistan: A review of sustainable electricity options. Renew. Sustain. Energy Rev. 2017, 72, 734–745. [Google Scholar] [CrossRef]
  5. Khan, H.A.; Pervaiz, S. Technological review on solar PV in Pakistan: Scope, practices and recommendations for optimized system design. Renew. Sustain. Energy Rev. 2013, 23, 147–154. [Google Scholar] [CrossRef]
  6. Muneer, T.; Asif, M. Prospects for secure and sustainable electricity supply for Pakistan. Renew. Sustain. Energy Rev. 2007, 11, 654–671. [Google Scholar] [CrossRef]
  7. Shaikh, F.; Ji, Q.; Fan, Y. The diagnosis of an electricity crisis and alternative energy development in Pakistan. Renew. Sustain. Energy Rev. 2015, 52, 1172–1185. [Google Scholar] [CrossRef]
  8. Baloch, M.H.; Abro, S.A.; Sarwar Kaloi, G.; Mirjat, N.H.; Tahir, S.; Nadeem, M.H.; Gul, M.; Memon, Z.A.; Kumar, M. A Research on Electricity Generation from Wind Corridors of Pakistan (Two Provinces): A Technical Proposal for Remote Zones. Sustainability 2017, 9, 1611. [Google Scholar] [CrossRef]
  9. Energy-Yearbook, P. Pakistan Energy Yearbook; Hydrocarbon Development Institute of Pakistan: Islamabad, Pakistan, 2015; p. 142. [Google Scholar]
  10. Memon, T.A.; Harijan, K.; Soomro, M.I.; Meghwar, S.; Valasai, G.D.; Khoharo, H. Potential of Electricity Generation from Rice Husk-A Case Study of Rice Mill. Sindh Univ. Res. J. 2017. [Google Scholar] [CrossRef]
  11. Hydrocarbon Development Institute of Pakistan (HDIP). Pakistan Energy Yearbook 1997; Hydrocarbon Development Institute of Pakistan, Ministry of Petroleum and Natural Resources, Government of Pakistan: Islamabad, Pakistan, 1998; p. 75.
  12. Hydrocarbon Development Institute of Pakistan (HDIP). Pakistan Energy Yearbook 2002; Hydrocarbon Development Institute of Pakistan, Ministry of Petroleum and Natural Resources, Government of Pakistan: Islamabad Pakistan, 2003; p. 91.
  13. Hydrocarbon Development Institute of Pakistan (HDIP). Pakistan Energy Yearbook 2007; Hydrocarbon Development Institute of Pakistan, Ministry of Petroleum and Natural Resources, Government of Pakistan: Islamabad, Pakistan, 2008; p. 120.
  14. Hydrocarbon Development Institute of Pakistan (HDIP). Pakistan Energy Yearbook 2012; Hydrocarbon Development Institute of Pakistan, Ministry of Petroleum and Natural Resources, Government of Pakistan: Islamabad, Pakistan, 2013; p. 125.
  15. Hydrocarbon Development Institute of Pakistan (HDIP). Pakistan Energy Yearbook 2015; Hydrocarbon Development Institute of Pakistan, Ministry of Petroleum and Natural Resources, Government of Pakistan: Islamabad, Pakistan, 2016; p. 147.
  16. Uddin, W.; Khan, B.; Shaukat, N.; Majid, M.; Mujtaba, G.; Mehmood, A.; Ali, S.M.; Younas, U.; Anwar, M.; Almeshal, A.M. Biogas potential for electric power generation in Pakistan: A survey. Renew. Sustain. Energy Rev. 2016, 54, 25–33. [Google Scholar] [CrossRef]
  17. Mirjat, N.H.; Uqaili, M.A.; Harijan, K.; Valasai, G.D.; Shaikh, F.; Waris, M. A review of energy and power planning and policies of Pakistan. Renew. Sustain. Energy Rev. 2017, 79, 110–127. [Google Scholar] [CrossRef]
  18. Valasai, G.D.; Mirjat, N.H.; Uqaili, M.A.; Memon, H.U.R.; Samoo, S.R.; Harijan, K. Decarbonization of Electricity Sector of Pakistan—An Application of Times Energy Model. J. Clean Energy Technol. 2017, 5. [Google Scholar] [CrossRef]
  19. Javaid, M.A.; Hussain, S.; Maqsood, A.; Arshad, Z.; Arshad, M.A.; Idrees, M. Electrical Energy Crisis in Pakistan and Their Possible Solutions. Int. J. Basic Appl. Sci. 2011, 11, 38–52. [Google Scholar]
  20. Malkani, M.S. A review of coal and water resources of Pakistan. Sci. Tech. Dev. 2012, 31, 202–218. [Google Scholar]
  21. Karim, S.; Bhutto, A.W. Coal gasification for sustainable development of the energy sector in Pakistan. Energy Sustain. Dev. 2005, 9, 60–68. [Google Scholar]
  22. Kumar, S.; Shahbaz, M. Coal Consumption and Economic Growth Revisited: Structural Breaks, Cointegration and Causality Tests for Pakistan. Energy Explor. Exploit. 2012, 30, 499–522. [Google Scholar] [CrossRef] [Green Version]
  23. Rauf, O.; Wang, S.; Yuan, P.; Tan, J. An overview of energy status and development in Pakistan. Renew. Sustain. Energy Rev. 2015, 48, 892–931. [Google Scholar] [CrossRef]
  24. Malik, S.N.; Sukhera, O.R. Management of natural gas resources and search for alternative renewable energy resources: A case study of Pakistan. Renew. Sustain. Energy Rev. 2012, 16, 1282–1290. [Google Scholar] [CrossRef]
  25. Zuberi, M.J.S.; Torkmahalleh, M.A.; Ali, S.M.H. A comparative study of biomass resources utilization for power generation and transportation in Pakistan. Int. J. Hydrog. Energy 2015, 40, 11154–11160. [Google Scholar] [CrossRef]
  26. Khan, M.A. Modelling and forecasting the demand for natural gas in Pakistan. Renew. Sustain. Energy Rev. 2015, 49, 1145–1159. [Google Scholar] [CrossRef]
  27. Alahdad, Z. Pakistan’s Energy Sector: From Crisis to Crisis-Breaking the Chain; Pakistan Institute of Development Economics: Islamabad, Pakistan, 2012; p. 50. [Google Scholar]
  28. Sorrell, S.; Speirs, J. Using growth curves to forecast regional resource recovery: Approaches, analytics and consistency tests. Philos. Trans. A Math. Phys. Eng. Sci. 2014, 372, 20120317. [Google Scholar] [CrossRef] [PubMed]
  29. Al-Husseini, M. The debate over Hubbert’s Peak: A review. GeoArabia 2006, 11, 181–210. [Google Scholar]
  30. Zhao, L.; Feng, L.; Hall, C.A.S. Is peakoilism coming? Energy Policy 2009, 37, 2136–2138. [Google Scholar] [CrossRef]
  31. Brandt, A.R. Testing Hubbert. Energy Policy 2007, 35, 3074–3088. [Google Scholar] [CrossRef]
  32. Bardi, U.; Lavacchi, A. A Simple Interpretation of Hubbert’s Model of Resource Exploitation. Energies 2009, 2, 646–661. [Google Scholar] [CrossRef]
  33. Rehrl, T.; Friedrich, R. Modelling long-term oil price and extraction with a Hubbert approach: The LOPEX model. Energy Policy 2006, 34, 2413–2428. [Google Scholar] [CrossRef]
  34. Nashawi, I.S.; Malallah, A.; Al-Bisharah, M. Forecasting World Crude Oil Production Using Multicyclic Hubbert Model. Energy Fuels 2010, 24, 1788–1800. [Google Scholar] [CrossRef]
  35. Gallagher, B. Peak oil analyzed with a logistic function and idealized Hubbert curve. Energy Policy 2011, 39, 790–802. [Google Scholar] [CrossRef]
  36. Lin, B.-Q.; Liu, J.-H. Estimating coal production peak and trends of coal imports in China. Energy Policy 2010, 38, 512–519. [Google Scholar] [CrossRef]
  37. Maggio, G.; Cacciola, G. When will oil, natural gas, and coal peak? Fuel 2012, 98, 111–123. [Google Scholar] [CrossRef]
  38. Keith, D.; Moreno-Cruz, J. Pitfalls of coal peak prediction. Nature 2011, 469. [Google Scholar] [CrossRef] [PubMed]
  39. Jakobsson, K.; Bentley, R.; Söderbergh, B.; Aleklett, K. The end of cheap oil: Bottom-up economic and geologic modeling of aggregate oil production curves. Energy Policy 2012, 41, 860–870. [Google Scholar] [CrossRef]
  40. Giraud, P.-N. A Note on Hubbert’s Thesis on Mineral Commodities Production Peaks and derived Forecasting Techniques. Procedia Eng. 2012, 46, 22–26. [Google Scholar] [CrossRef]
  41. Szklo, A.; Machado, G.; Schaeffer, R. Future oil production in Brazil—Estimates based on a Hubbert model. Energy Policy 2007, 35, 2360–2367. [Google Scholar] [CrossRef]
  42. Tao, Z.; Li, M. System dynamics model of Hubbert Peak for China’s oil. Energy Policy 2007, 35, 2281–2286. [Google Scholar] [CrossRef]
  43. Tao, Z.; Li, M. What is the limit of Chinese coal supplies—A STELLA model of Hubbert Peak. Energy Policy 2007, 35, 3145–3154. [Google Scholar] [CrossRef]
  44. Lin, B.; Wang, T. Forecasting natural gas supply in China: Production peak and import trends. Energy Policy 2012, 49, 225–233. [Google Scholar] [CrossRef]
  45. Saraiva, T.A.; Szklo, A.; Lucena, A.F.P.; Chavez-Rodriguez, M.F. Forecasting Brazil’s crude oil production using a multi-Hubbert model variant. Fuel 2014, 115, 24–31. [Google Scholar] [CrossRef]
  46. Chavez-Rodriguez, M.F.; Szklo, A.; de Lucena, A.F.P. Analysis of past and future oil production in Peru under a Hubbert approach. Energy Policy 2015, 77, 140–151. [Google Scholar] [CrossRef]
  47. Wang, J.; Jiang, H.; Zhou, Q.; Wu, J.; Qin, S. China’s natural gas production and consumption analysis based on the multicycle Hubbert model and rolling Grey model. Renew. Sustain. Energy Rev. 2016, 53, 1149–1167. [Google Scholar] [CrossRef]
  48. Wang, J.; Feng, L. Curve-fitting models for fossil fuel production forecasting: Key influence factors. J. Nat. Gas Sci. Eng. 2016, 32, 138–149. [Google Scholar] [CrossRef]
  49. Reynolds, D.B. World oil production trend: Comparing Hubbert multi-cycle curves. Ecol. Econ. 2014, 98, 62–71. [Google Scholar] [CrossRef]
  50. Brecha, R. Ten Reasons to Take Peak Oil Seriously. Sustainability 2013, 5, 664–694. [Google Scholar] [CrossRef]
  51. Petroleum Institute of Pakistan (PIP). Pakistan Energy Outlook, 2015; Petroleum Institute of Pakistan: Karachi, Pakistan, 2015; p. 148. [Google Scholar]
Figure 1. Percent share of fuels in the total energy mix: 1992–2015 [11,12,13,14,15].
Energies 10 01858 g001
Figure 2. Historical share of energy consumption in different sectors [11,12,13,14,15].
Energies 10 01858 g002
Figure 3. Map of the major coal, oil and natural gas production sites in Pakistan.
Energies 10 01858 g003
Figure 4. Coal consumption (demand) across various sector in Pakistan.
Energies 10 01858 g004
Figure 5. Natural gas consumption across various sectors (1992–2014).
Energies 10 01858 g005
Figure 6. Exploratory and development wells drilled in Pakistan.
Energies 10 01858 g006
Figure 7. Oil and petroleum products consumption across various sectors (1992–2014).
Energies 10 01858 g007
Figure 8. The STELLA interface depicting the Hubbert production as a flow.
Energies 10 01858 g008
Figure 9. Historical Supply, production, consumption and import of coal (ktoe).
Energies 10 01858 g009
Figure 10. Coal past vs. cumulative production in million tons.
Energies 10 01858 g010
Figure 11. Coal Hubbert production peaks under multiple probabilities.
Energies 10 01858 g011
Figure 12. Historical supply, production, and consumption of natural gas (ktoe).
Energies 10 01858 g012
Figure 13. Hubbert and cumulative production peak for natural gas (Million toe).
Energies 10 01858 g013
Figure 14. Natural gas past and cumulative production (million toe).
Energies 10 01858 g014
Figure 15. Historical supply, production, consumption and import of oil and petroleum products.
Energies 10 01858 g015
Figure 16. Past and cumulative production for oil (million toe).
Energies 10 01858 g016
Figure 17. Hubbert and cumulative production peak for oil (Million toe).
Energies 10 01858 g017
Table 1. Pakistan coal reserves as on 30 June 2014 (million tonnes).
ProvinceMeasuredIndicatedInferredHypotheticalTotal
Sindh766419,37044,290114,132185,456
Balochistan541313416217
Punjab552411145235
Khyber Pakhtunkhwa1.54.584-90
Azad Kashmir117-9
Grand Total7775.519,412.544,524114,293186,007
Data source: Energy Yearbook 2015.
Table 2. Supply of gas from different companies in Pakistan.
Supply of Gas from Company/OperatorShare in Gas (%)Country of OriginNumbers of Non-Associated Gas Fields in PakistanProduction (2014)
PunjabSindhKPKBaluchistanTotalMillion CFt
Oil and Gas Development Company Limited28.75Pakistan7421454427,579
Pakistan Petroleum Limited 15.90Pakistan16018236,445
Mari Petroleum Limited14.56Pakistan06017216,448
ENI Pakistan Limited 2.01Italy 04004178,612
BHP Billiton Pakistan 7.03Multi-national 01001104,570
MOL Pakistan 7.05Hungary00404104,838
OMV Maurice7.60Austria 04004112,980
OPL0.23Pakistan100013431
PEL0.48Pakistan060067133
POGC0.25Poland000003726
POL0.36Pakistan200025358
Tullow0.00UK02002-
UEPL5.05Pakistan069006975,126
Dewan Petroleum0.45Pakistan200026684
PETRONAS0.00Malaysia03003-
Hycarbex0.27USA010014063
Grand Total 1,486,993
BHP: Broken Hill Proprietary; OPL: Ocean Pakistan Limited; PEL: Petroleum Exploration Limited; POGC: Polish Oil and Gas Company; POL: Pakistan Oilfields Limited; UEPL: United Energy Pakistan Limited; PETRONAS: Petroliam Nasional Berhad; KPK: Khyber Pakhtunkhwa; Data source: Energy yearbook, 2015.
Table 3. Summary of oil and gas exploration activities as on 1 July 2014.
Activities/Information Response
Exploratory wells891
Development wells1214
Sedimentary area827,268 km2
Exploratory drilling densityOne well per 928 km2
Discoveries288
• Oil80
• Gas/condensate108
Overall success rate1:3.1
Data source: Energy Yearbook, 2015.
Table 4. Hubbert production peak of Coal under various assumptions of reserves size.
Reserves TypeReserves Quantity 1Cumulative Production Till 2015 2Ultimate Recovery 3Peak Production 4Peak Year
Measure or Proven77761107886 1342080
Proven + Indicated27,18811027,298 4642099
Proven + Indicated + Inferred 71,714 11071,824 12212114
Proven + Indicated + Inferred + Hypothetical186,007110186,11731642128
1, 2, 3, 4: all in million tons.

