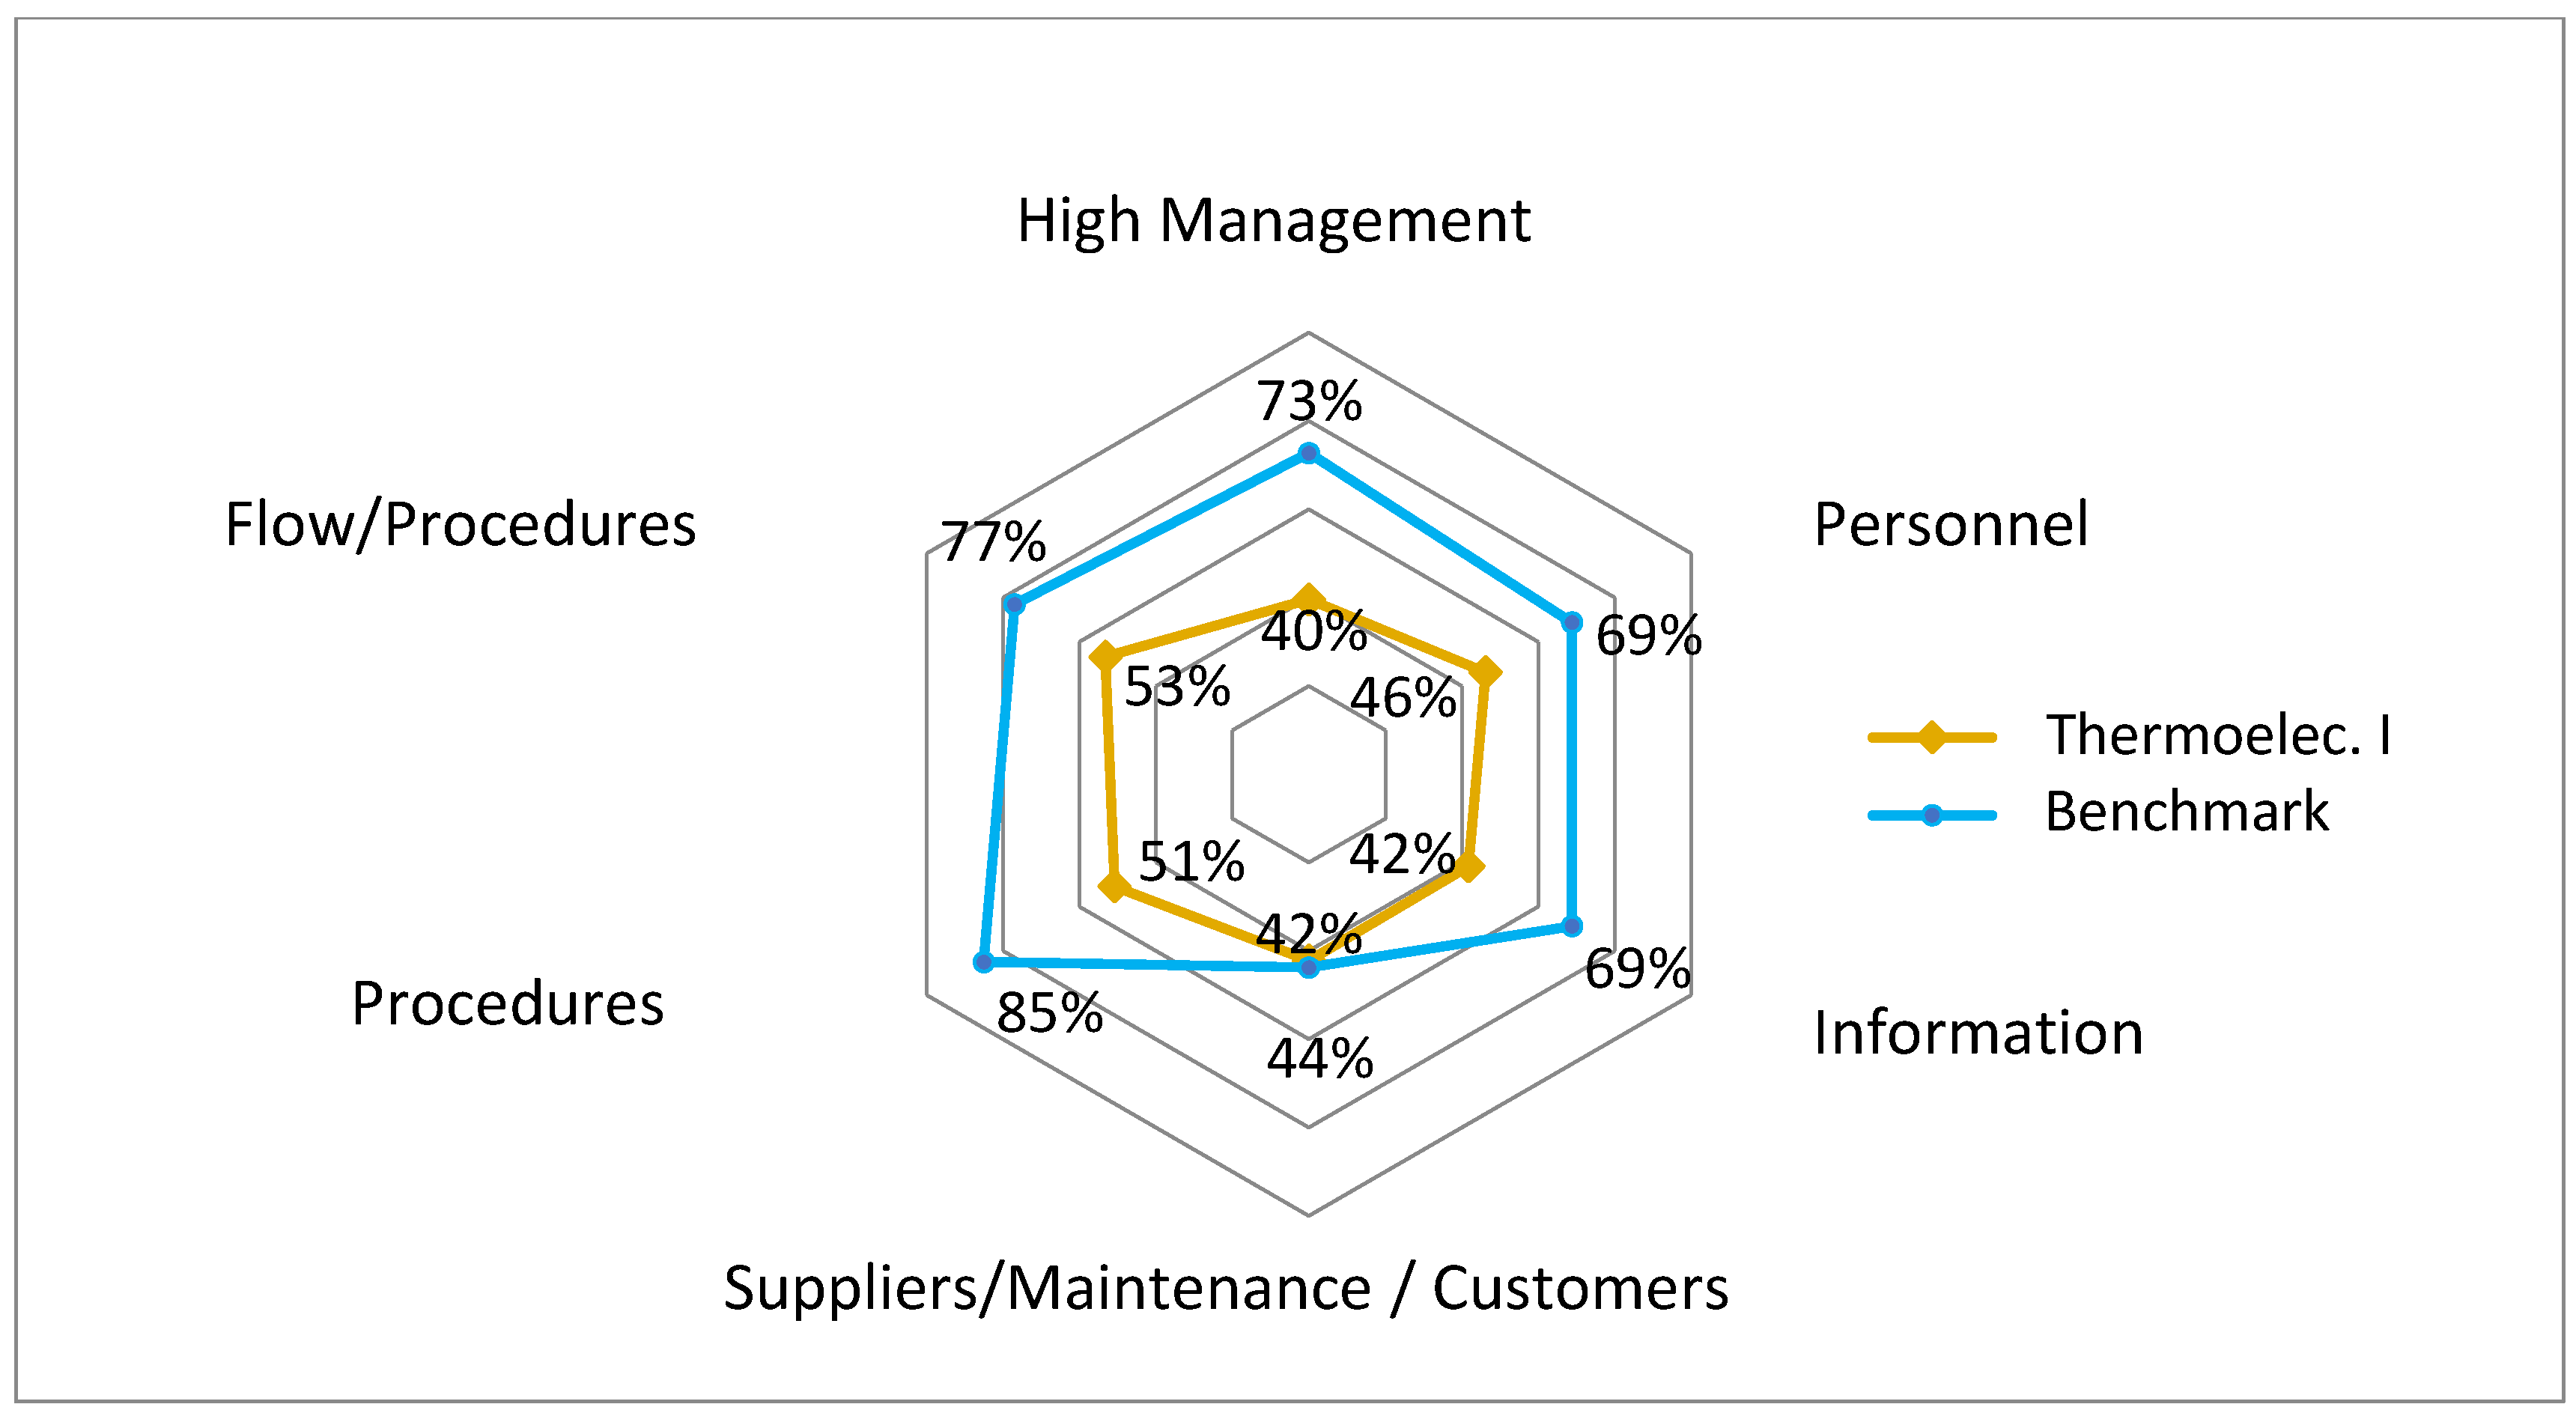
The diagnostic stage consisted in the application of the questionnaire to twelve people, including the head of maintenance and specialists from each area. All of them fulfilled the prerequisite of working at the company for more than 1 year. Once the completed questionnaires were collected, the average values were calculated. These were then compared to a benchmark thermoelectric power station located in Spain and owned by the same company. The benchmark power station was chosen because of its world-renowned efficiency, its experience with lean projects and its technical similarity to Thermoelectric I. Besides, both power stations have approximately the same size and capacity and, therefore, they are perfectly comparable.
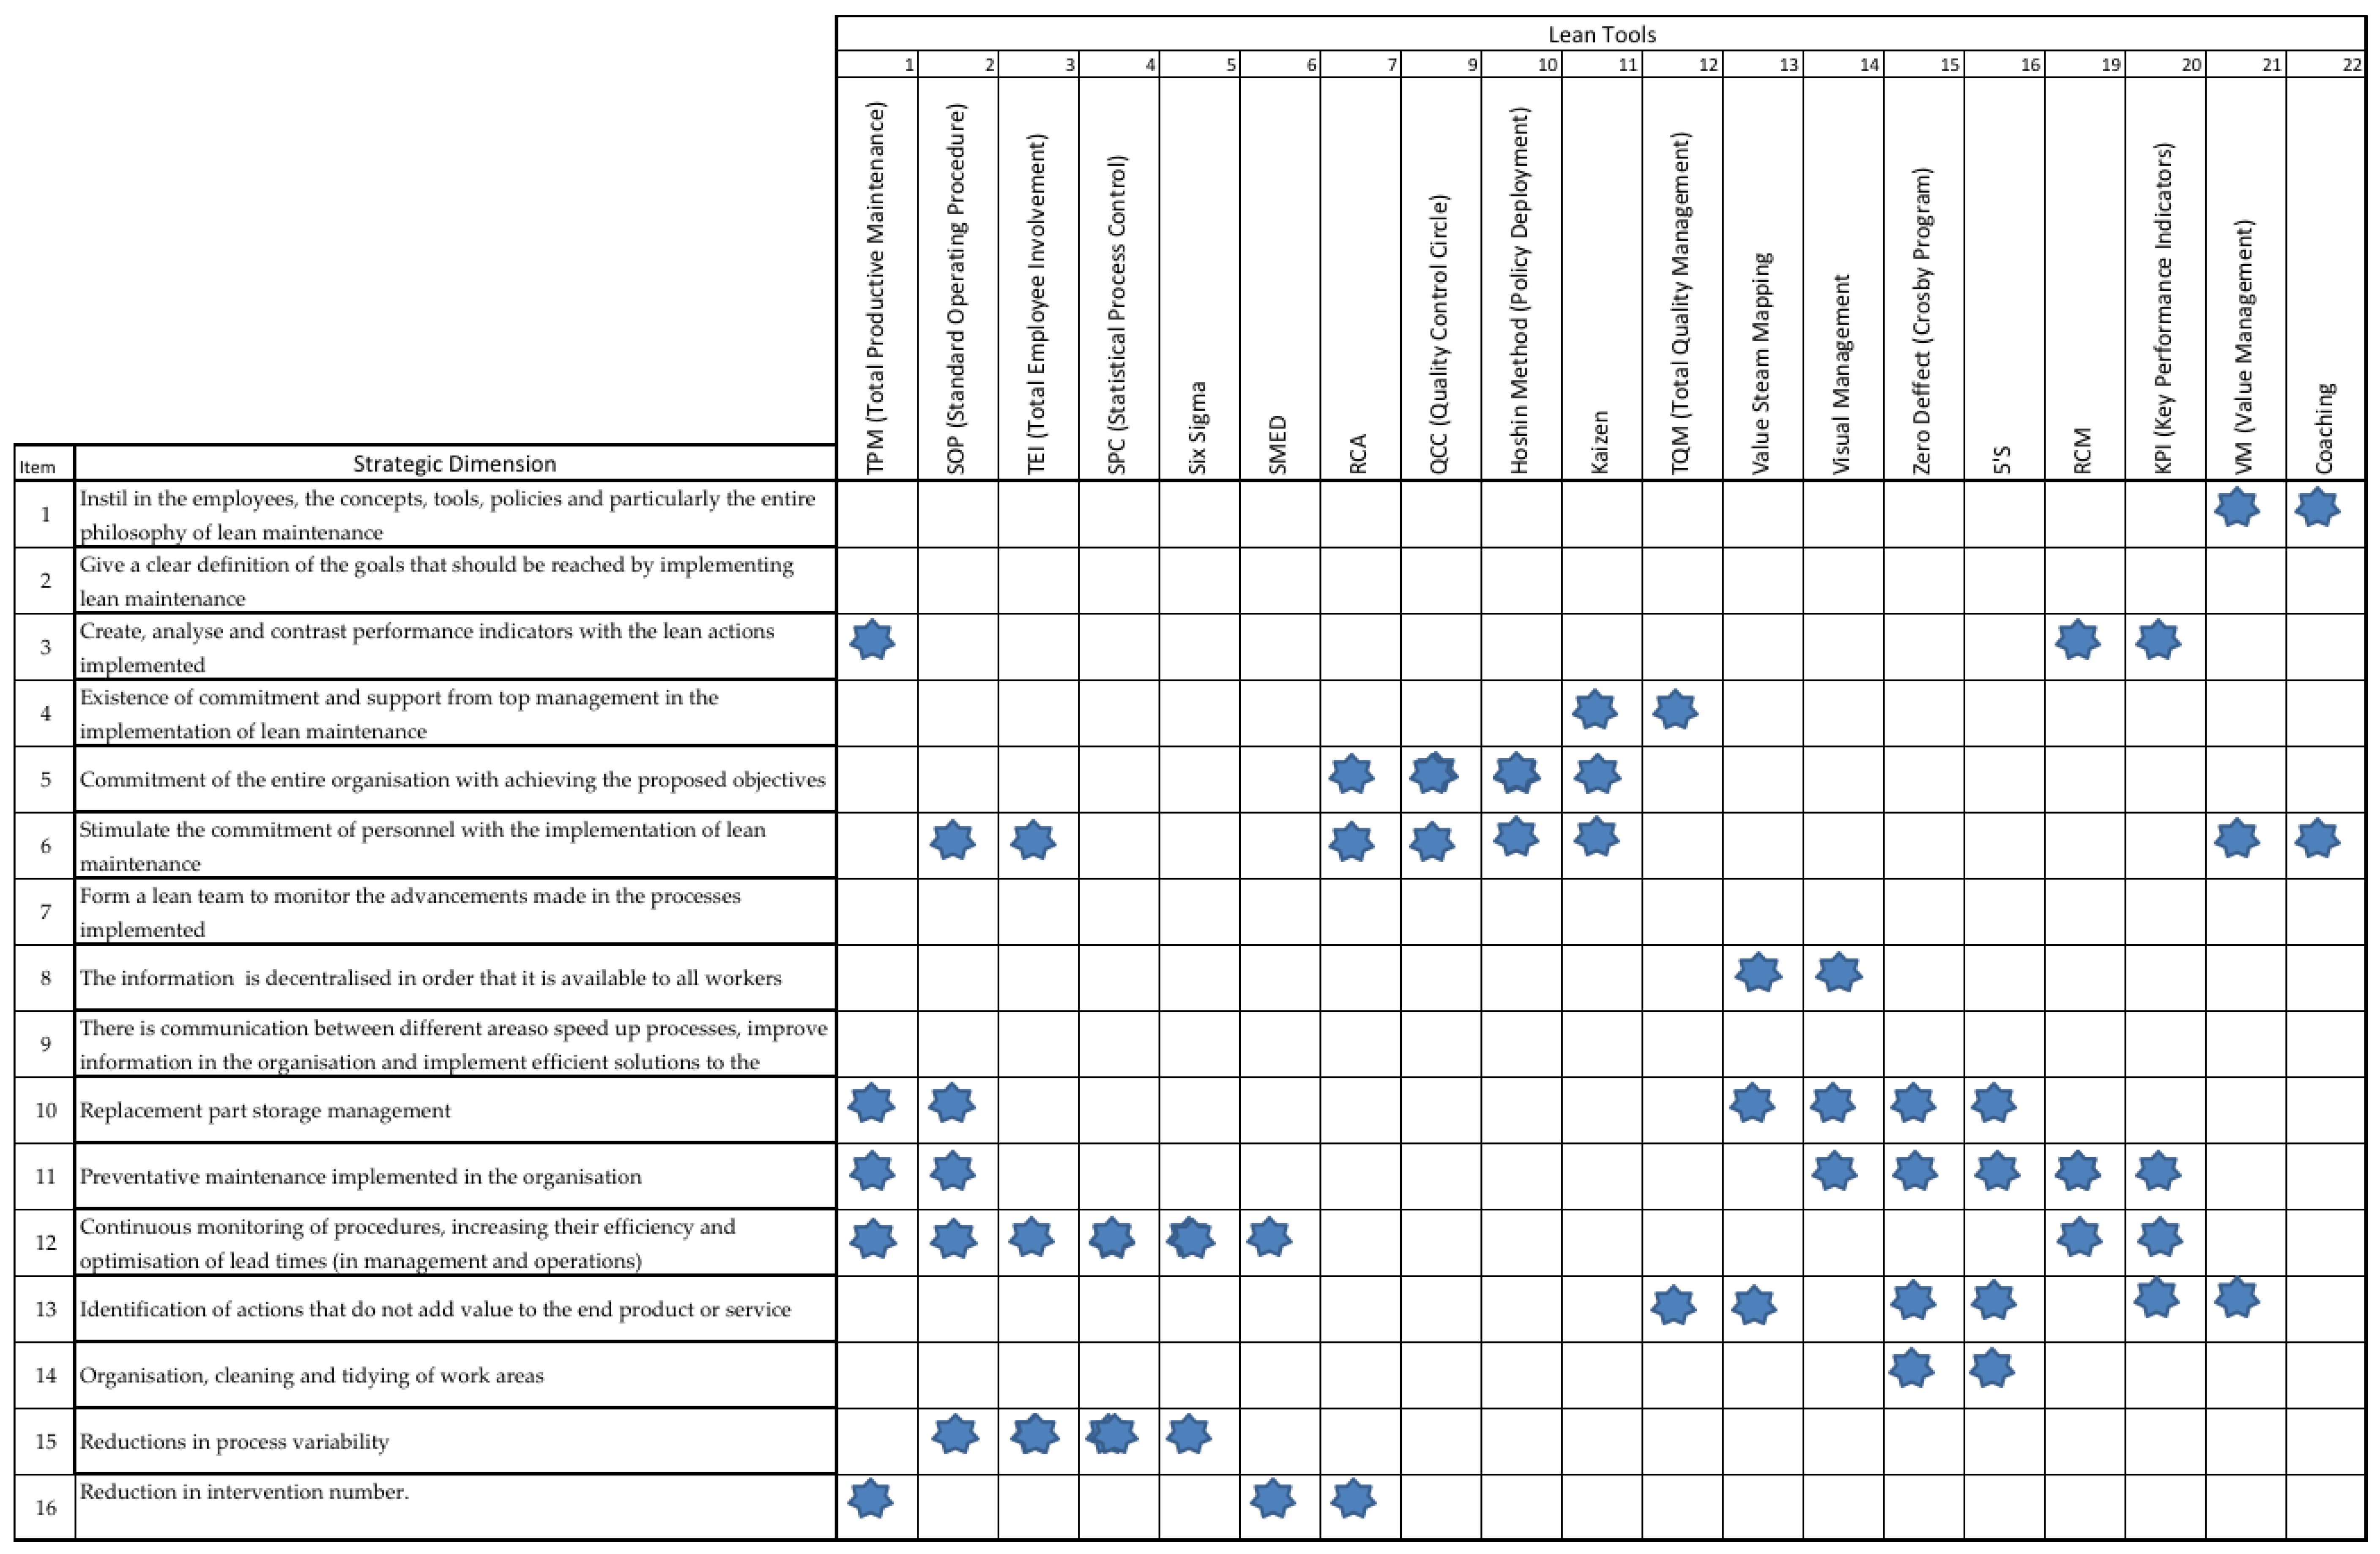
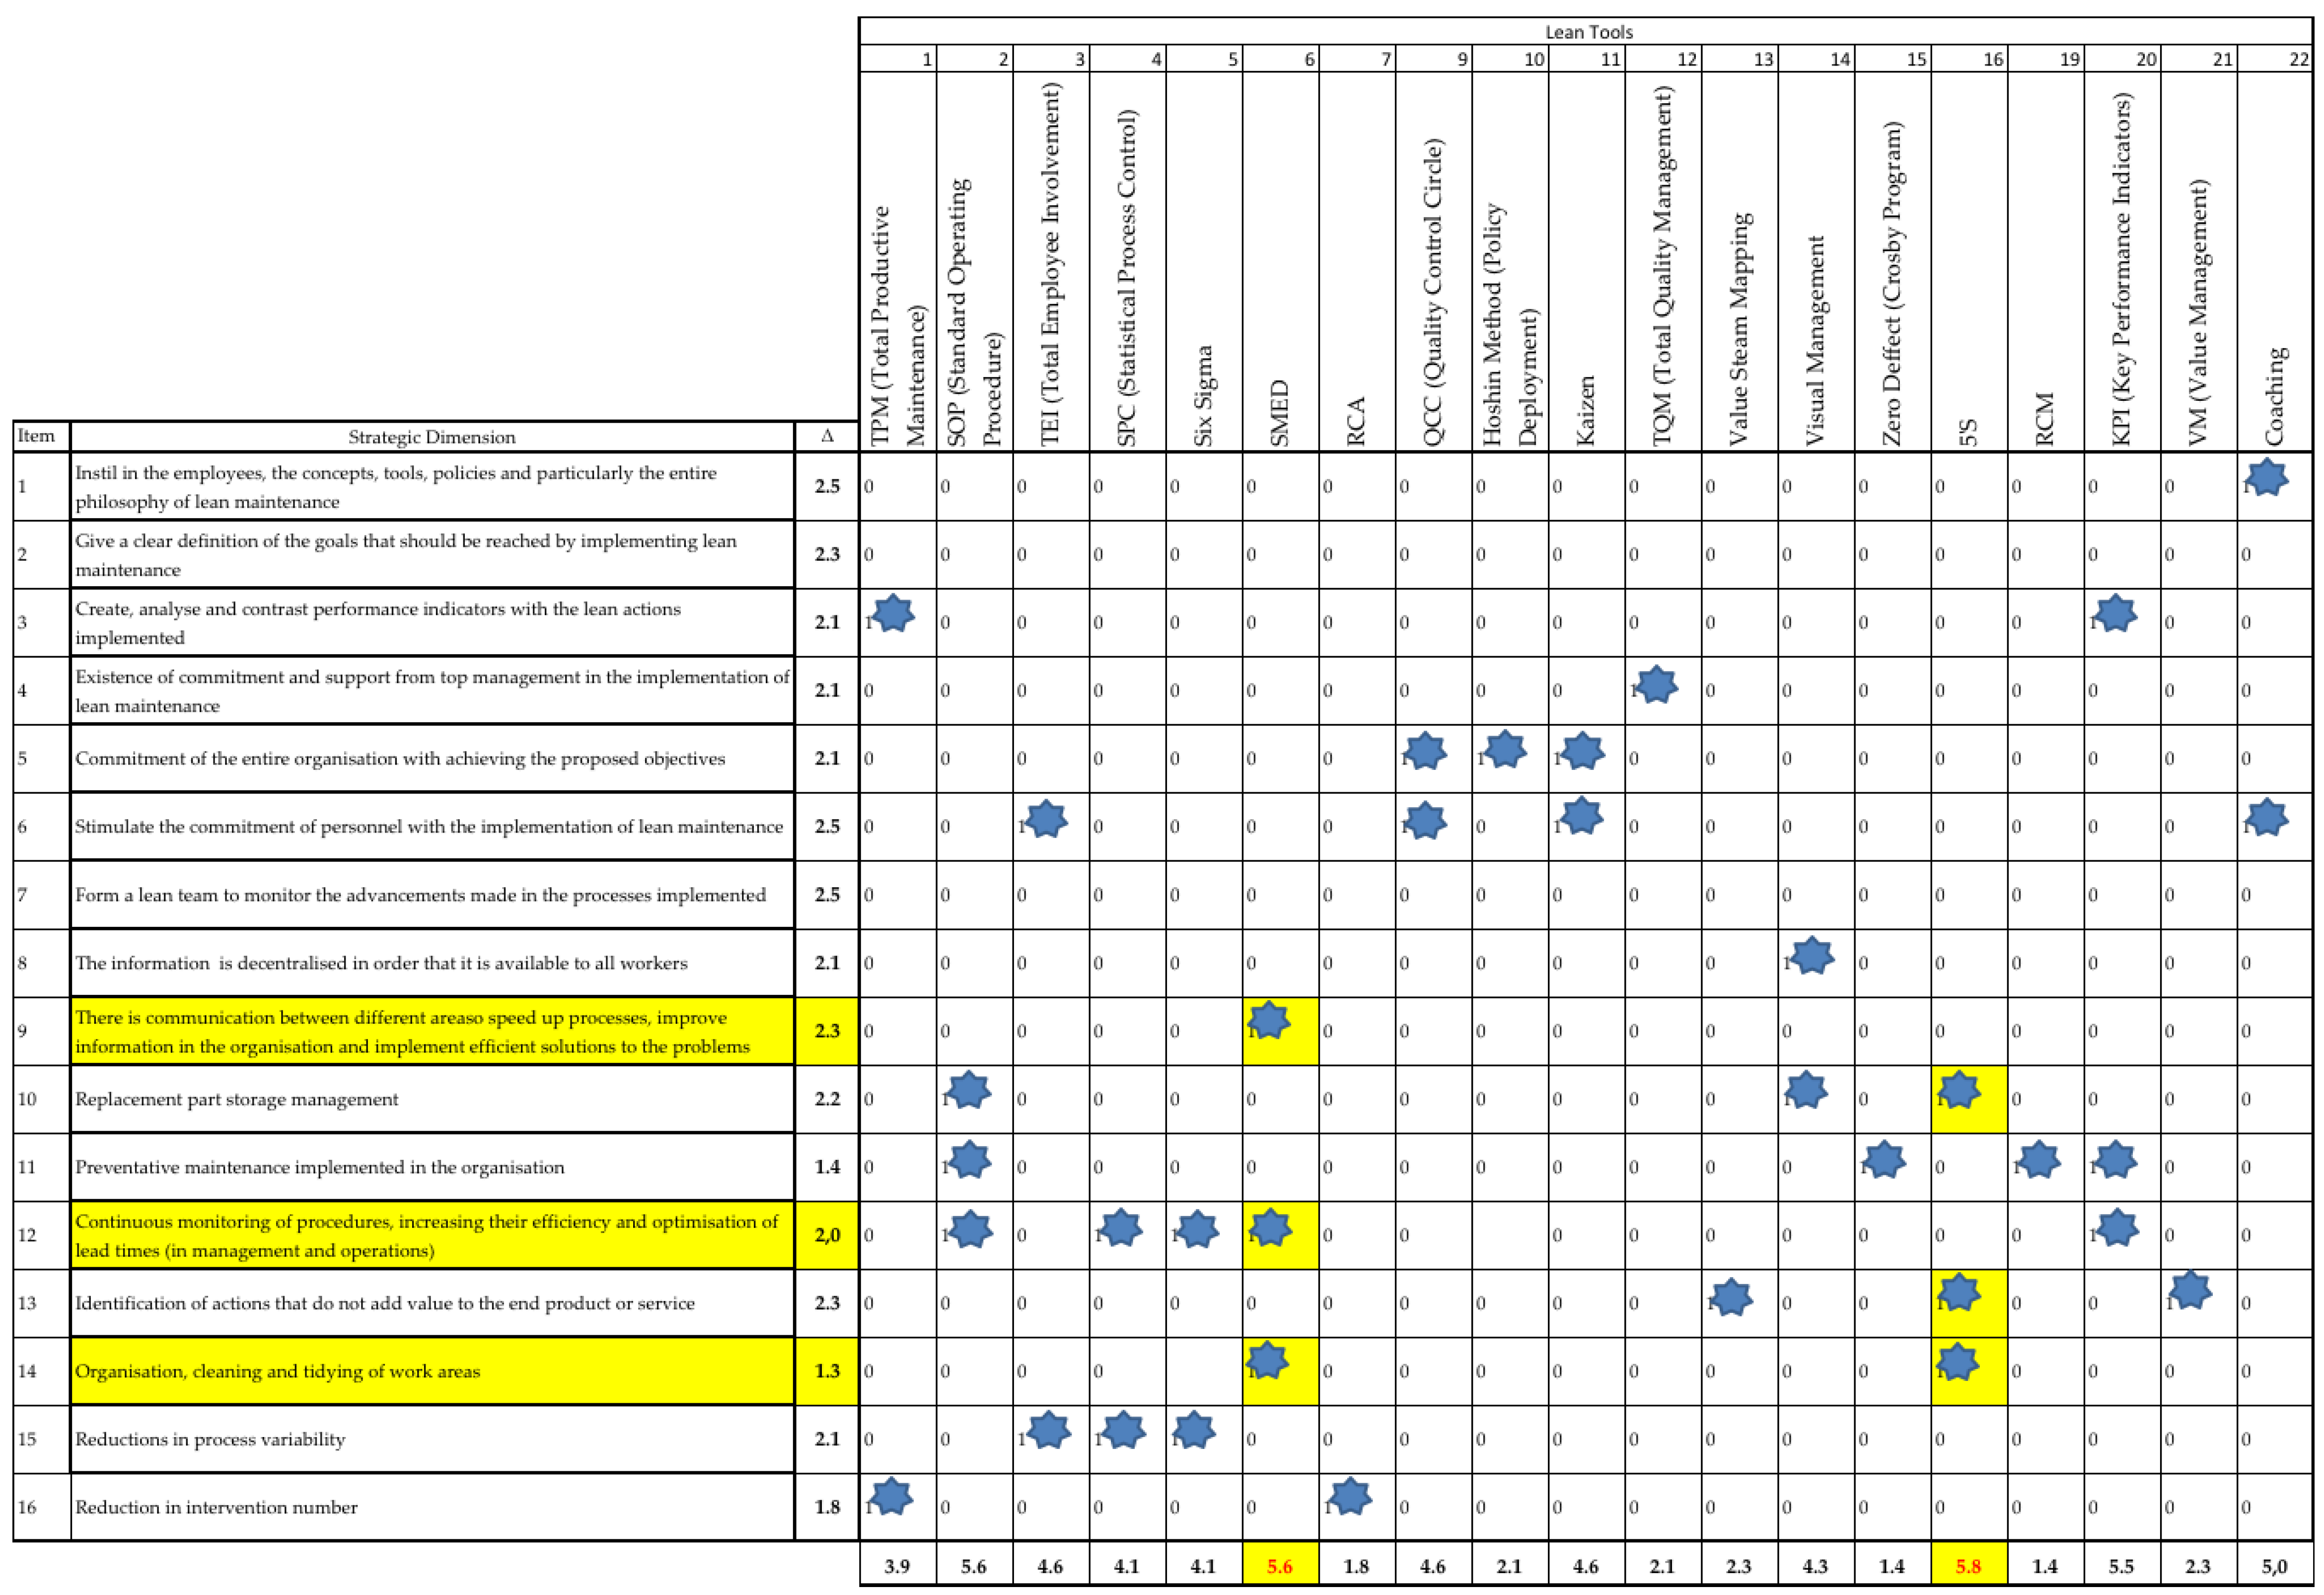
For Thermoelectric I, the lean tool with the highest score is the 5S. This technique can address the highest number of strategic dimensions lacking in “excellence” but does not affect the worst evaluated dimensions. The second highest score is obtained by the Single Minute Exchange of Dies (SMED) and are also linked with three strategic dimensions with low assessments. The table then successively recommends tools that have less impact on the deficiencies identified in the organization. From that results, an action plan was established and approved, considering the application of both aforementioned lean tools, the implementation teams formation was then carried out, and the project times were defined. The main achievements of this method are discussed below.
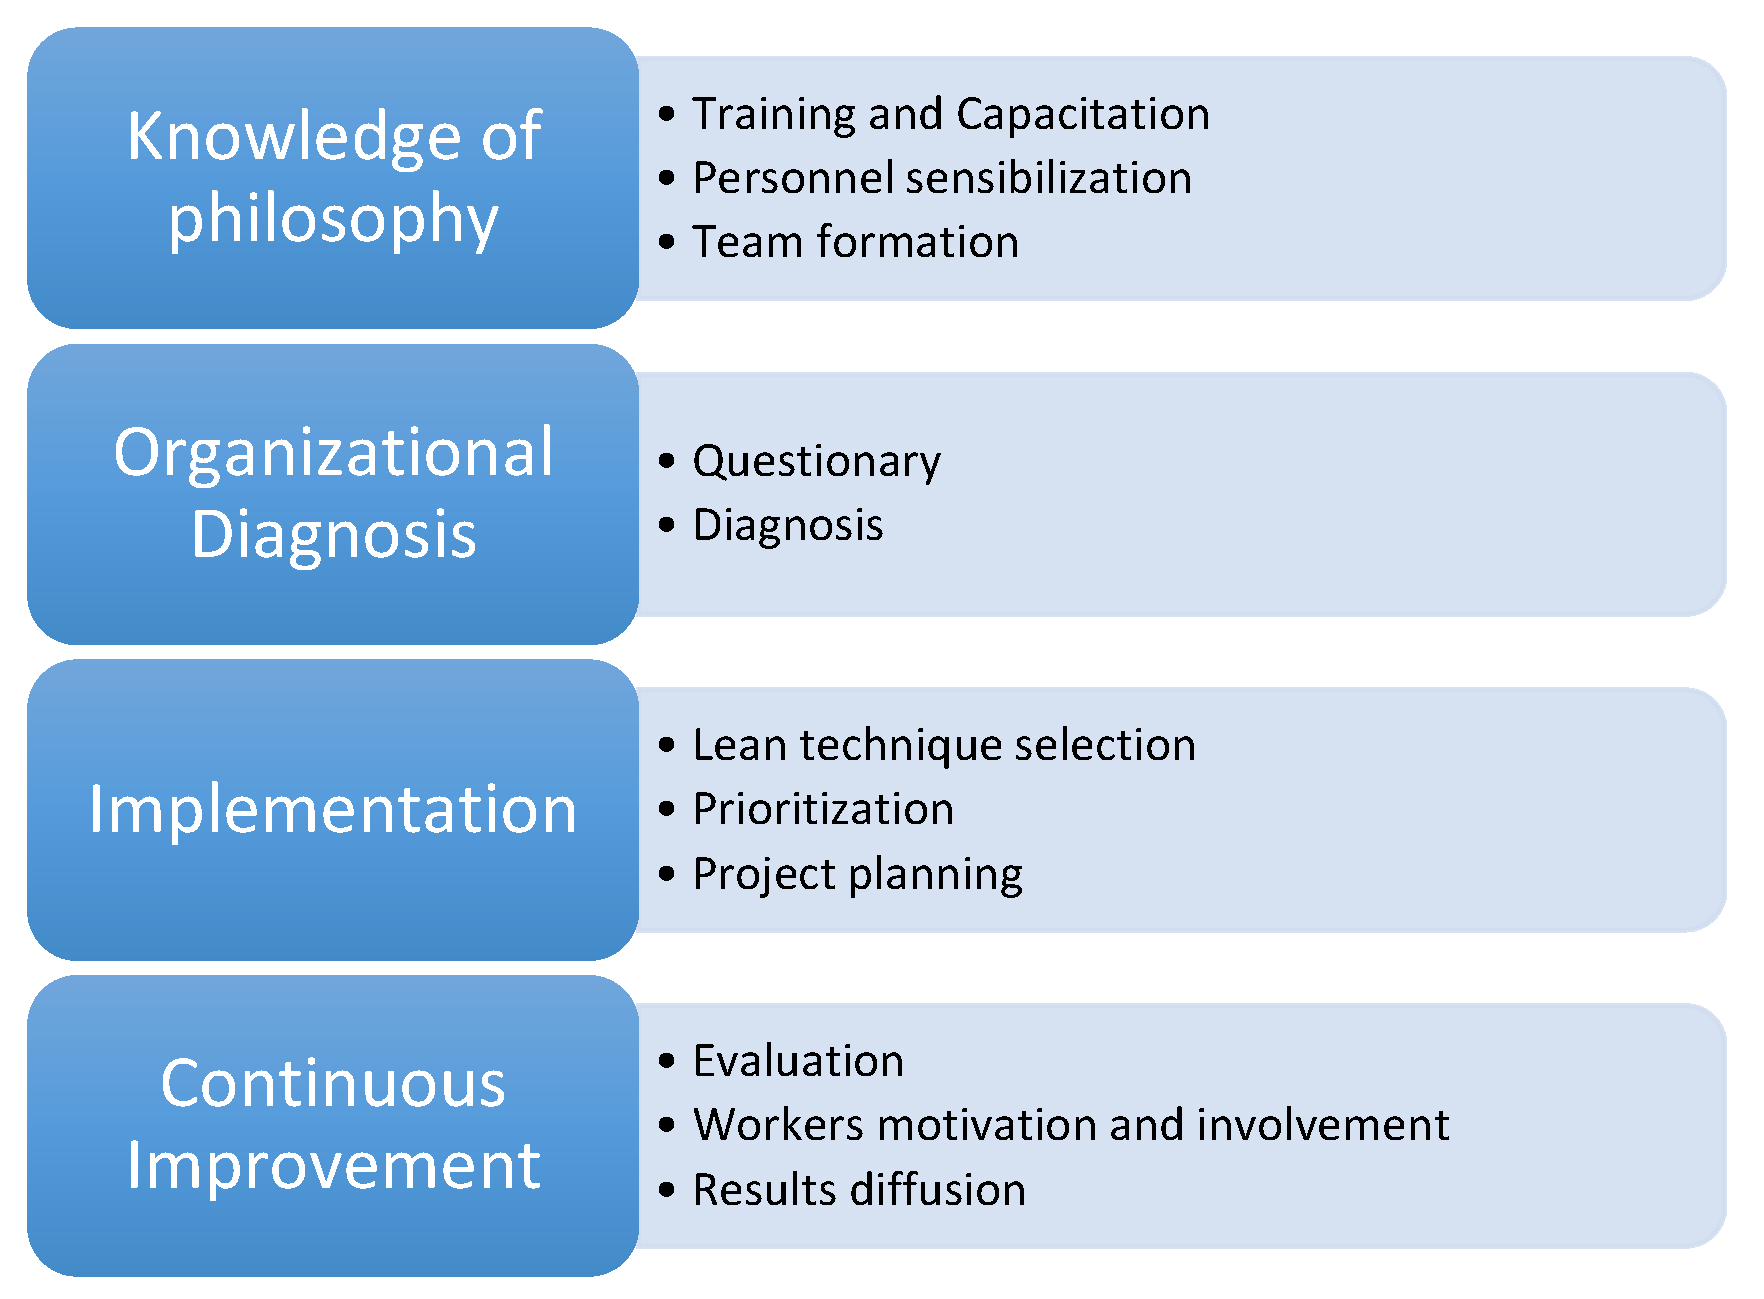
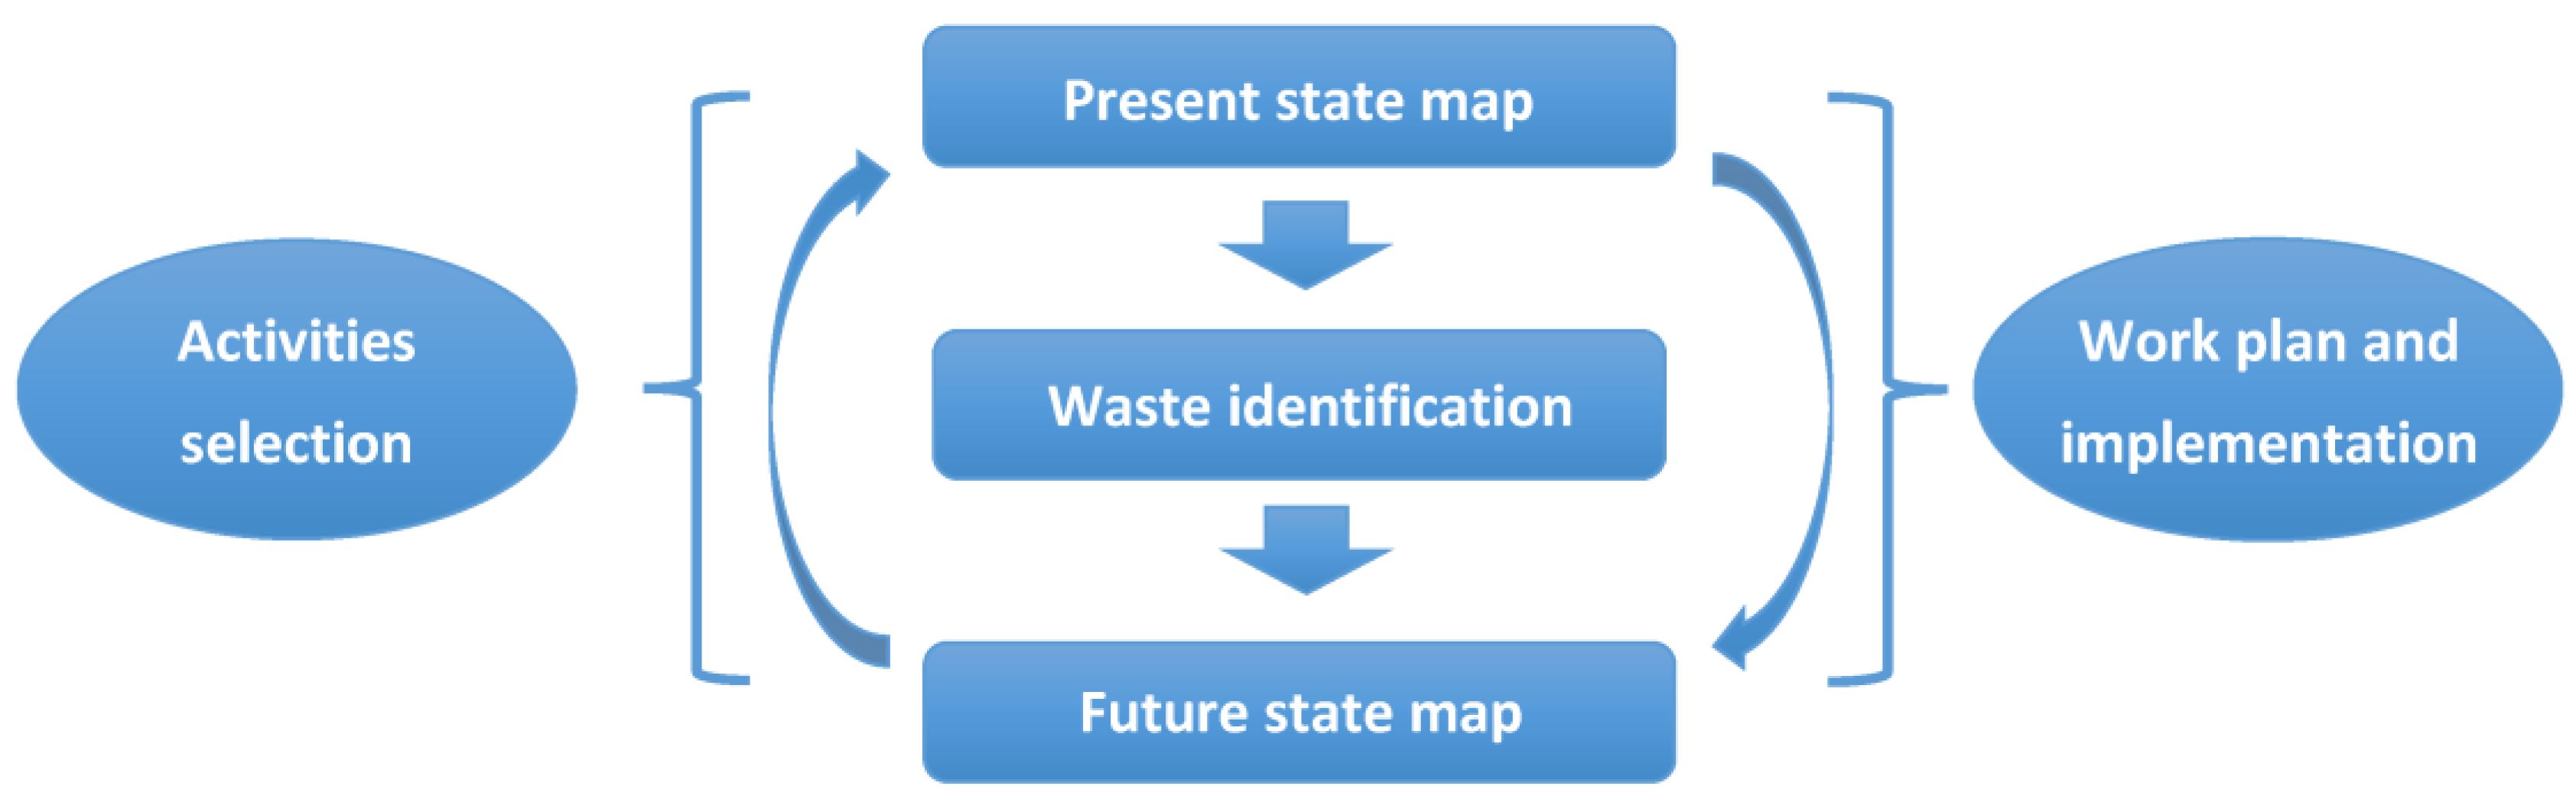
As it was commented before, after the diagnostic phase, the work teams elaborated the projects selecting the proper lean tools which are most adequate to improve the performance standards in the deficient areas. These projects were established in a simple manner, as a sequence of implementation steps, with a planned completion time to each one of them and the estimated cost of their implementation. It was the responsibility of top management to analyze the cost-benefit ratio that the implementation of the tool will provide. This stage constitutes the final filter that let the implementation activities start. Once the action plan was established and approved, the department head assigned each member his/her responsibilities within the plan, in addition to establishing the completion times. Once the projects were started, each area dedicated to a given project had to publish its monthly results and the compliance level of each parameter were evaluated.
In order to show how the improvement projects are defined and implemented, two pilot lean tools implementation will be discussed in the following paragraphs. The selected lean tools correspond to the 5S technique, which was applied in-between the repair and maintenance shop and the spare parts warehouse. The second one corresponds to the SMED technique that was applied to a preventive and repair interventions in a set of coal pulverizers.
5.1. Project I, 5S
In order to solve some of the shortcomings detected by the organization’s diagnosis, such as the lack of management of spare parts and supplies, the lack of adherence to the procedures in the warehouse and the lack of organization and order in some work areas, 5S was implemented in the facilities mentioned above.
In conjunction with the mechanical engineering area, before beginning the first phase of the 5S implementation, an assessment was made of the shop’s current situation. Then, the team discussed and listed the activities required to complete the implementation and defined a Gantt chart where dates, executors, responsible and percentages of fulfilment were stablished.
Among the most important steps in the implementation of 5S in the shop we can mention: identification and classification of manual tools discarding the unnecessary or unused ones, creation of a 5S map where the localization of each manual tool in the shop is indicated, relocation of the existing equipment according to repair routines, definition of cleaning routines where the main responsible is the corresponding operator, etc. In addition, the visual management implemented allows to know the state in which the machines are. With this, both the operator and the maintainer can know if they are in conditions for their operation or if they require any maintenance action. Through a new distribution of equipment and workstations in the workshop, it was possible to define routes with complete safety, well-defined operating locations, emergency exits and therefore, the optimization of available space.
The case of the spare parts warehouse was totally different from the one of the workshop. Lack of organization, poor distribution of space and lost spare parts have a larger impact on the maintenance and maintainability of equipment. The effort that was made in the warehouse was much greater than in the workshop. For this case, new racks were incorporated in order to be able to achieve an optimal distribution of the used space, classifying materials and spare parts by generating unit, frequency of use, dimensions, and other characteristics. A lot of material was eliminated, such as already used spare parts, obsolete parts and unusable structural material. These were sold, generating about USD 20,000 in extra profits that were used to finance other parts of the projects. It was possible to verify important advances in cleaning, new distribution of physical space, use of visual management for information, recognition of existing inventory, establishment of new management indicators and standardization of logistic procedures inside the warehouse.
As an illustration of the positive effects that the implementation of 5S in the spare parts warehouse caused, let us analyze those used in corrective maintenance interventions at the water treatment plant. Looking at the warehouse activities related to that plant, a reduction of 50% in spare parts search and delivery times was obtained. After the application of the 5S technique MTTR was recalculated as a form to evaluate the effect of the reduction in spare part logistic times maintainability. The mean time in corrective maintenance activities before 5S implementation, 10.36 h, was reduced to 5.18 h. Considering that the cost per man-hour of personnel is USD 15/h, the reduction in costs could be USD 8500 per year (with almost 100 search and delivery operations for spare parts in the year).
Table 5 shows the obtained results (Mean Time to Repair and Mean Time between Failures) from that evaluation.
The columns called “Before 5S” show the values of the MMTR and MTBF for different failure modes. The columns called “After 5S” show the results obtained for both parameters after application of the 5S method (assuming a 50% reduction in search times of the correspondent spare parts). The results were used to calculate the new availability of the water treatment plant. Using a simulator, new MTTR and MTBF values were obtained for each piece of equipment in the system. From the simulation study, and as result of the implementation of 5S in the spare part storage system, an increase of 1.17% in plant availability was predicted. This difference in availability can be associated with the generation of additional electricity throughout the year and an increased capacity of 6225.18 MW. The results indicate that by implementing 5S in the spare part storage system, annual profits may increase by approximately USD 300,000. The numbers clearly show the potential impact of implementing this type of tool in the spare parts storage system.
5.2. Project II, SMED and VSM
The overall objective of this project was to demonstrate that by using the Single Minute Exchange of Dies and Value Stream Mapping method, maintenance procedures could be improved, reducing the duration of interventions (corrective and preventive maintenance), positively impacting the availability of a set of Coal Pulverizers.
The application of the SMED method is very useful for maintenance tasks, since it impacts on the maintainability and availability of physical assets, increasing their use and production and improving the efficiency of the entire production system.
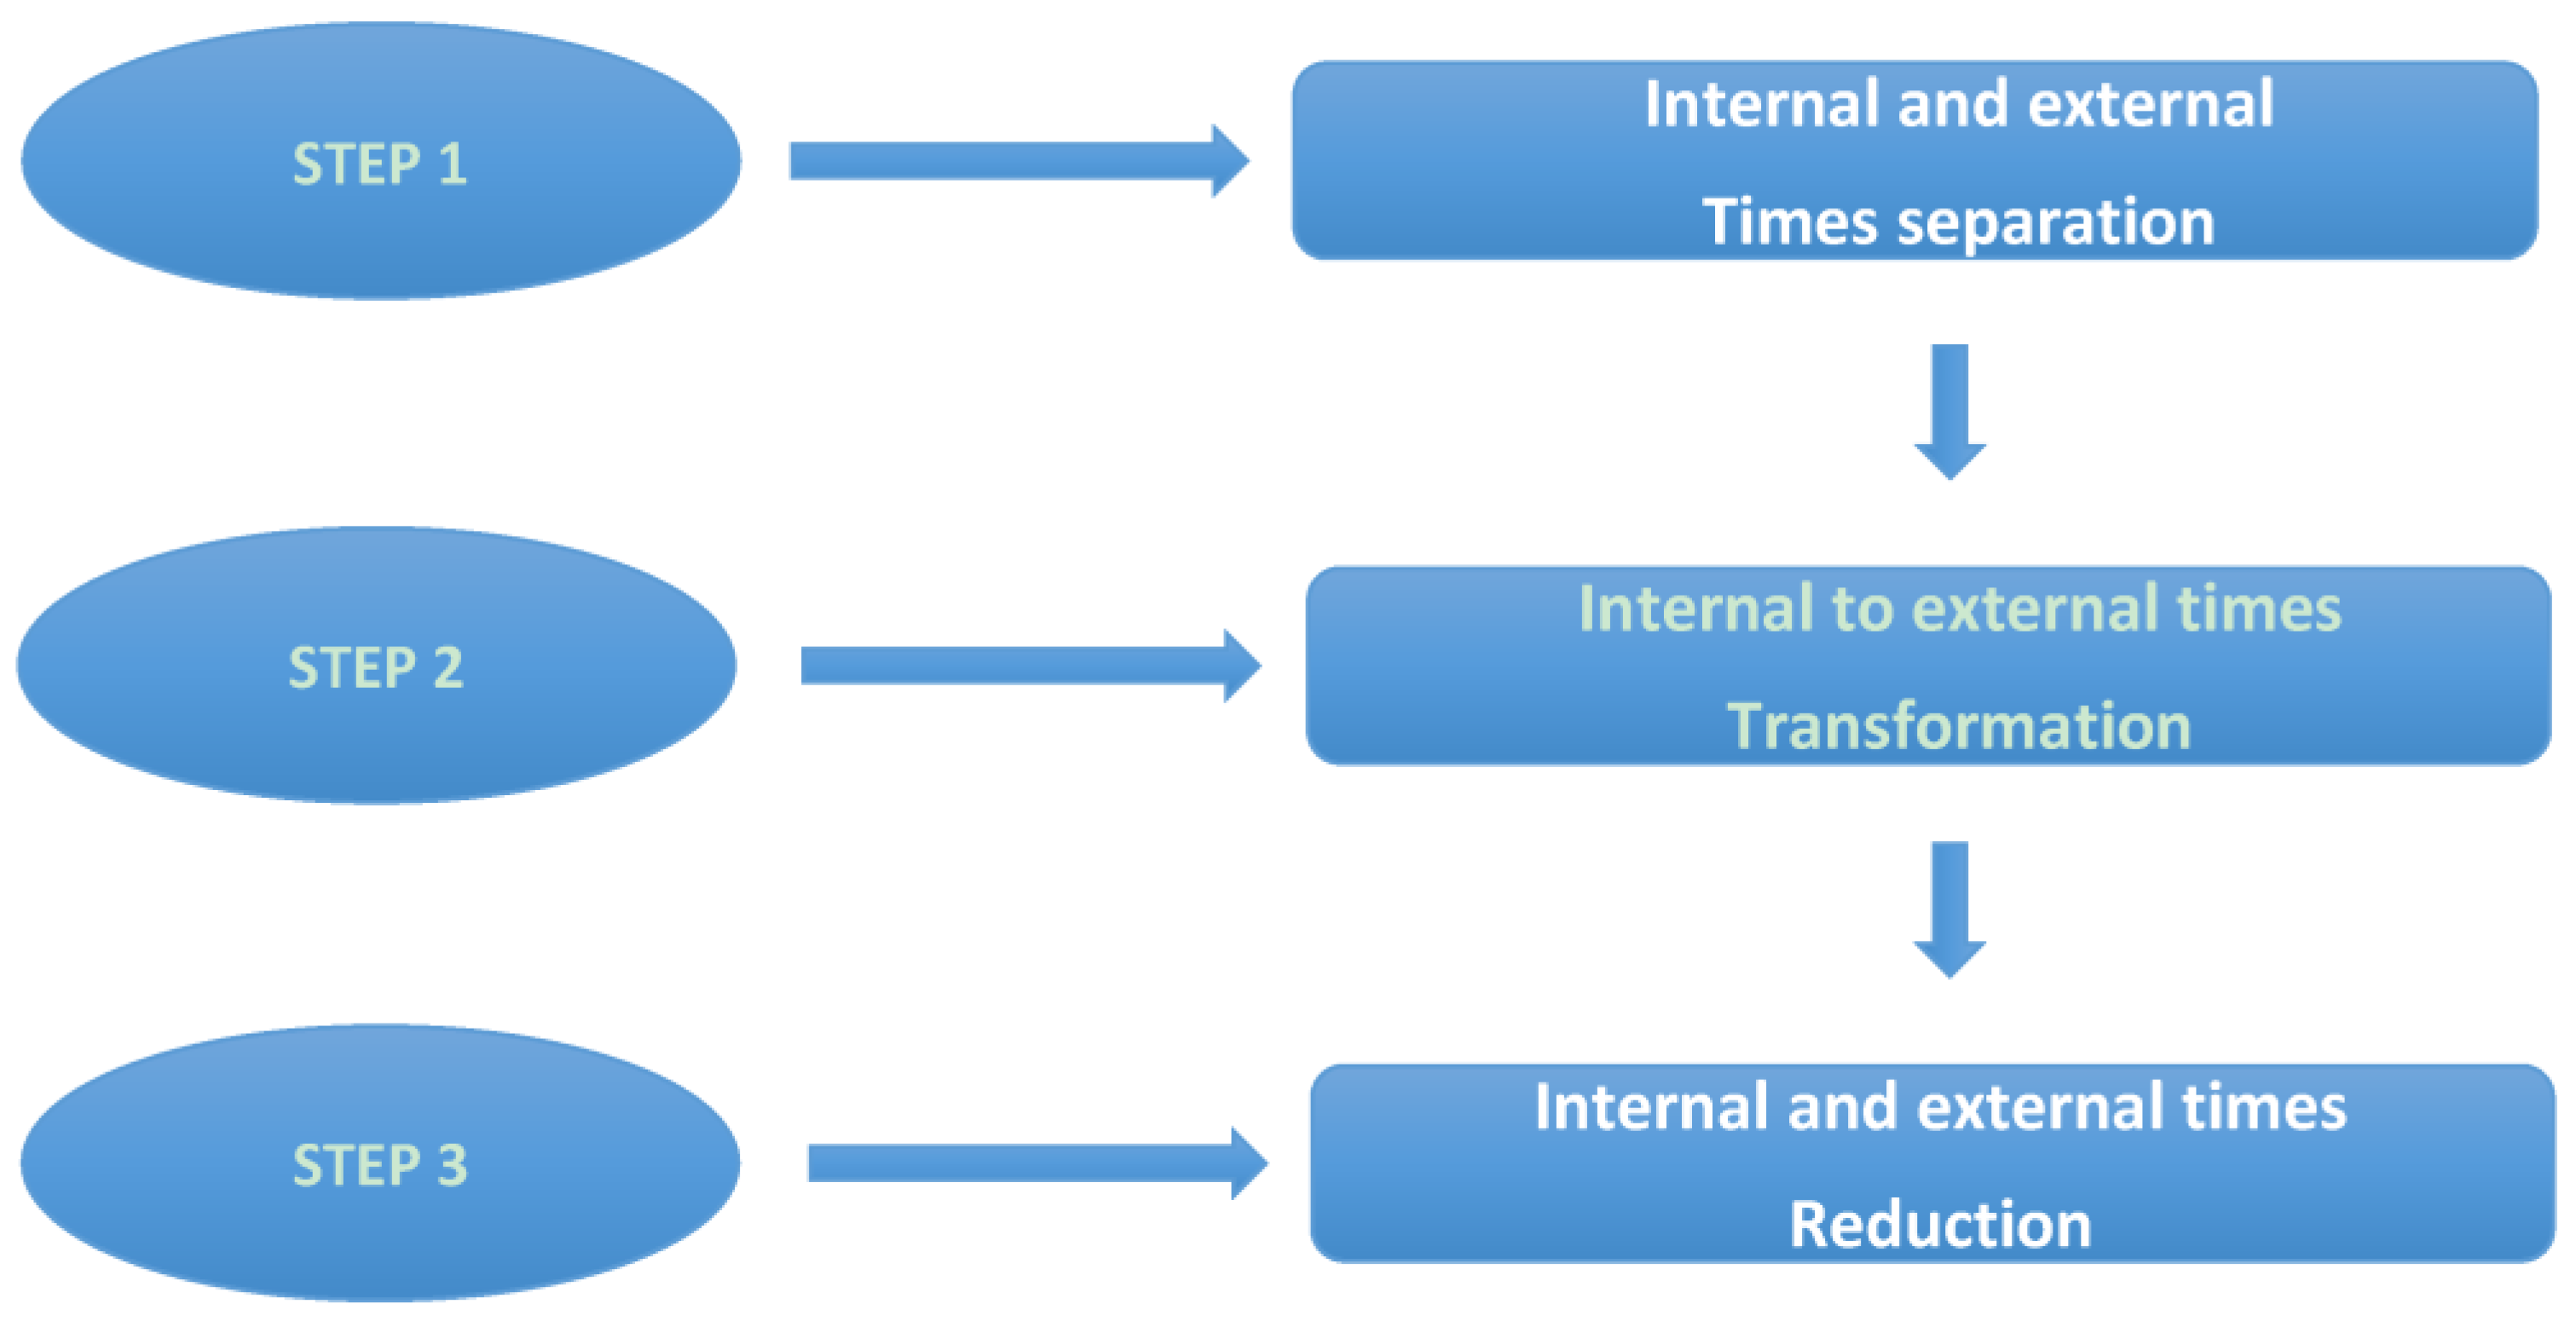
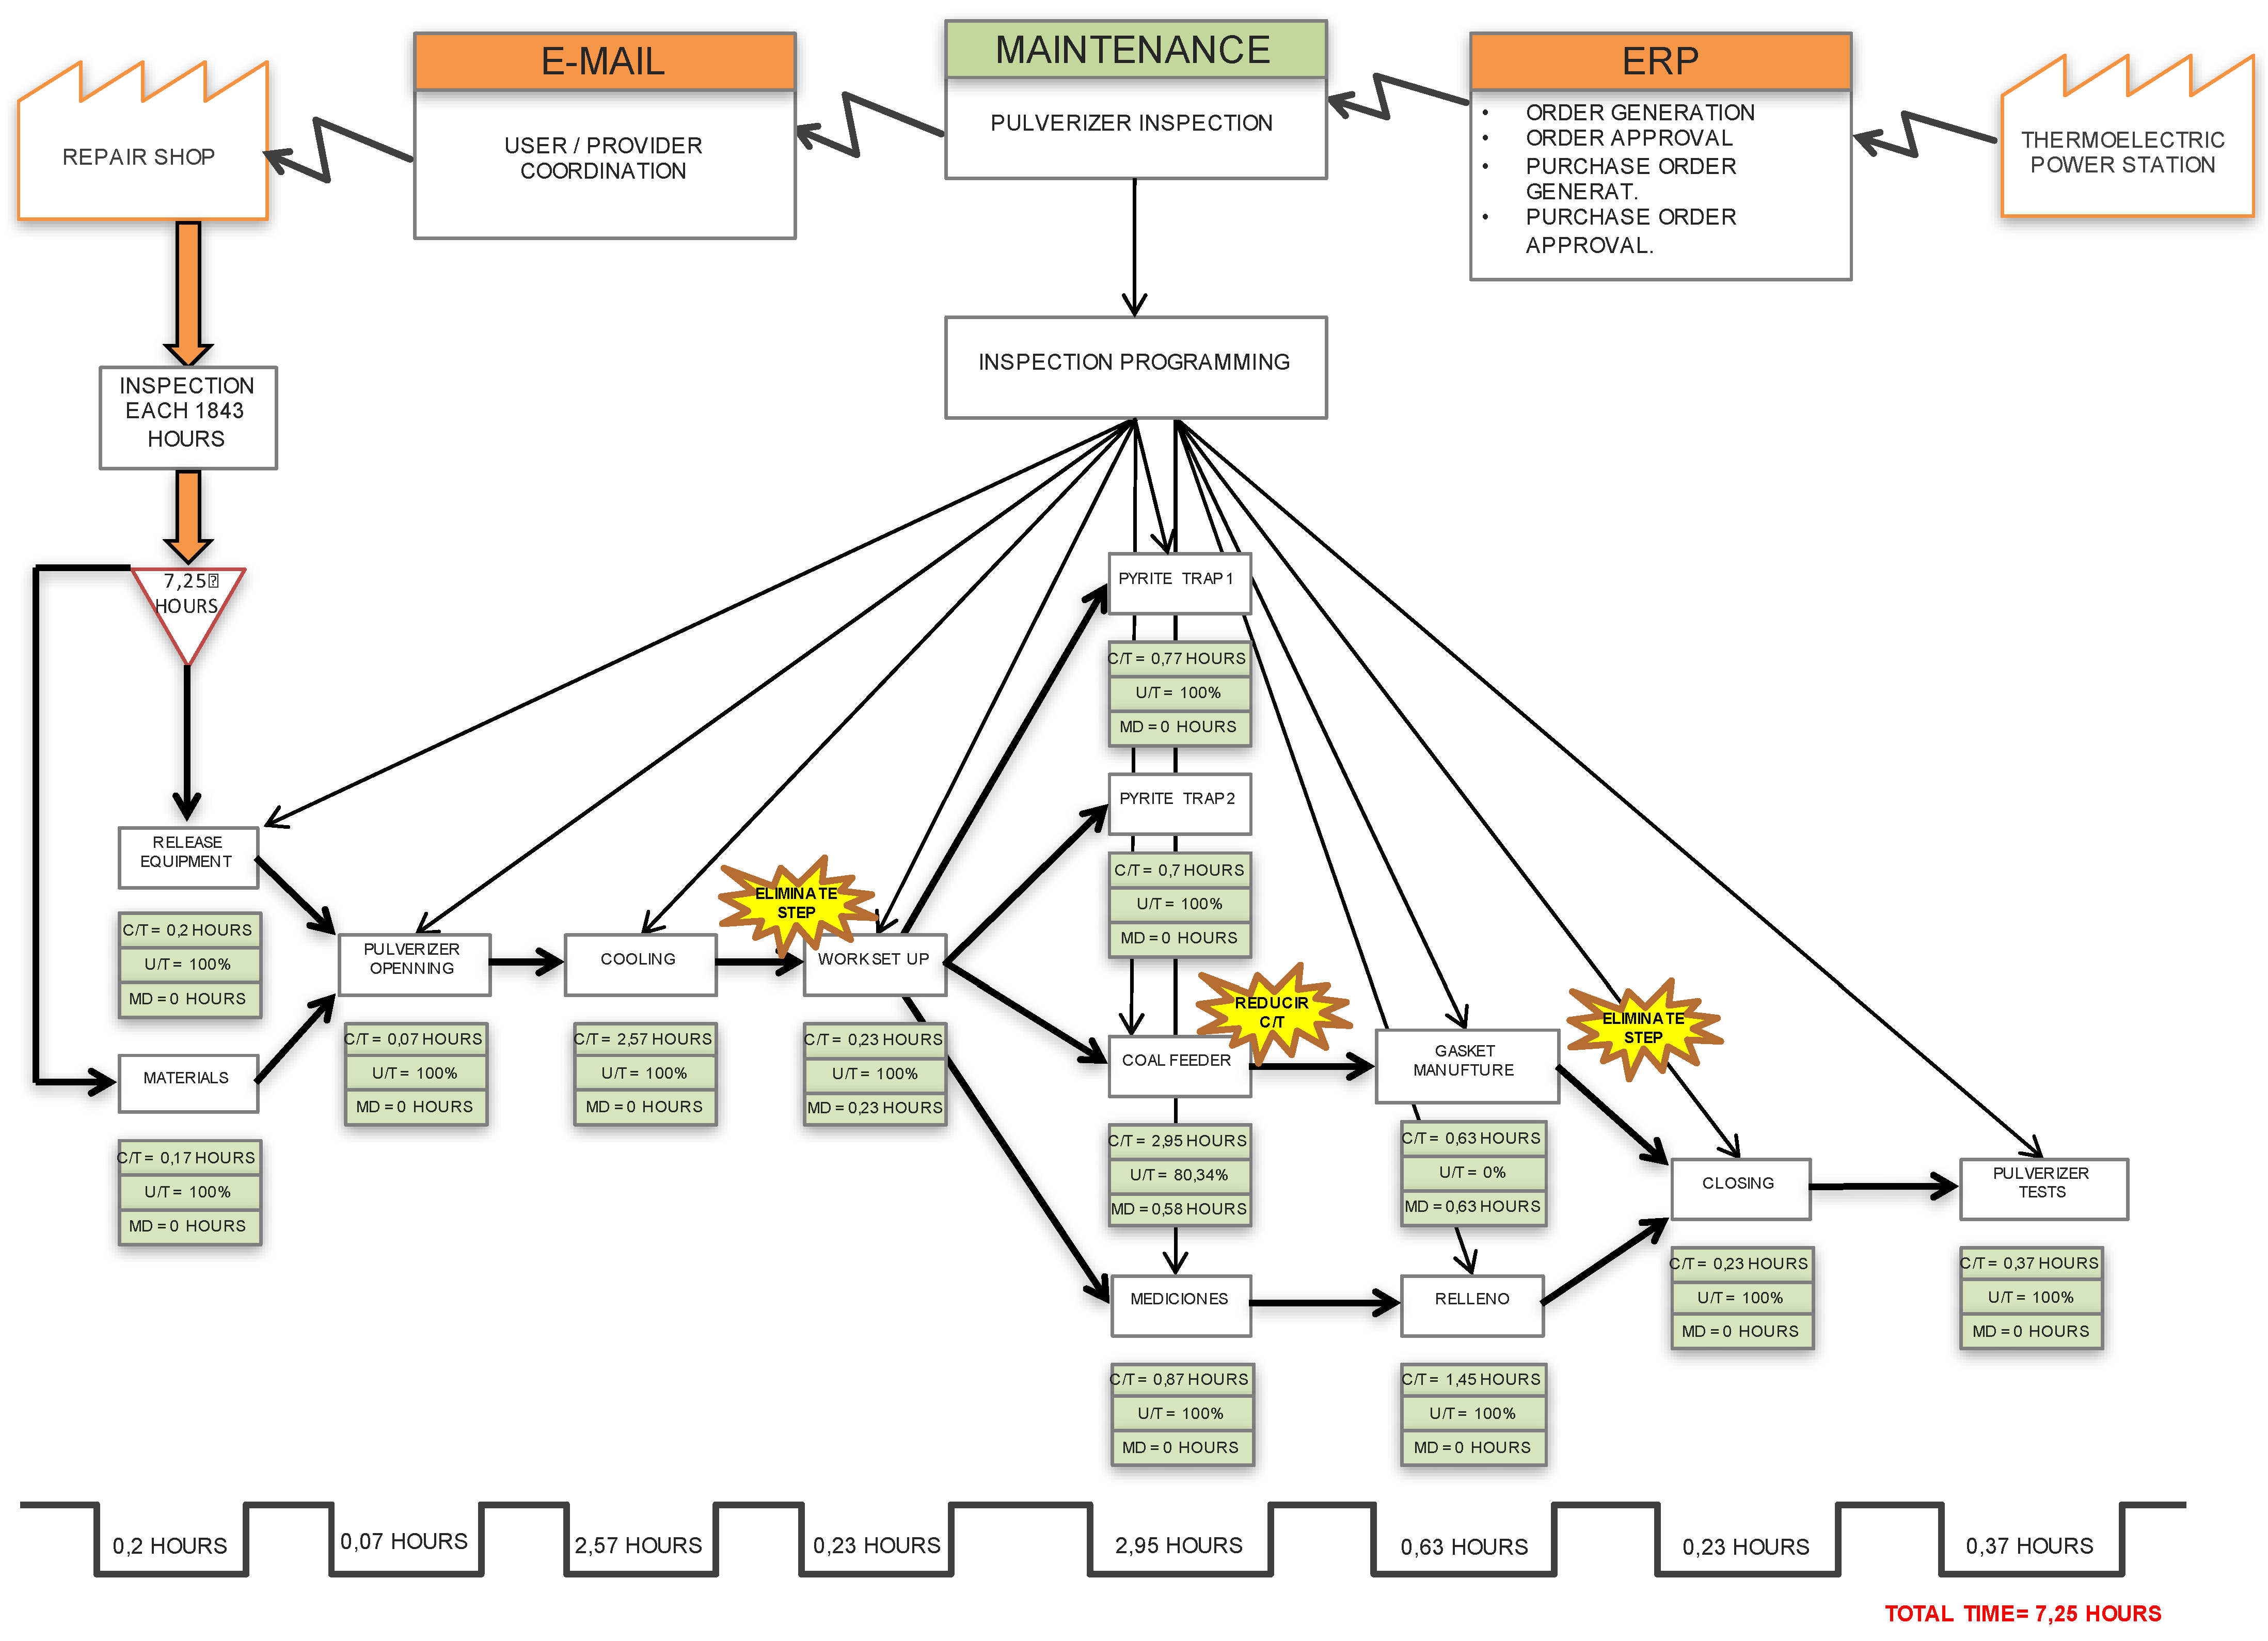
Figure 7 shows the steps followed to apply the SMED methodology.
The first step of the SMED method, and the most important, is to distinguish between internal and external set-ups, activities and times. Internal set-ups correspond to those operations that are performed only when machines are down, leading to production time losses. External set-ups correspond to operations that could be performed with the machine in operation, i.e., without penalizing production times. The second step of the method consists into the transformation of the internal times into external ones. The third step aims to reduce the total setup time. Indeed, minimization is achieved not only transforming internal times into external ones, but also rationalizing setup activities in terms of reducing the maintenance time, impacting positively in the total available time even more.
The application of this technique was performed in the process of inspection of Coal Sprayers of the thermoelectric plant. This was intended to reduce the time lost in the execution of the activities due to inspections and the replacement of certain of equipment components.
For the development of this project, the following steps were followed: measurement of the times of each activity during the interventions, study of the current conditions of the interventions, interview with mechanical supervisors and photographic record of the activities.
In order to apply this method, all the general operations performed on the pulverizers must be identified.
Table 6 shows the operations performed on the sprayers.
Initially, in the current state, all operations performed on the pulverizers are considered internal, since all were performed while the equipment was stopped. Subsequently, operations that could be transformed into external operations were identified, these are:
Transfer of Tools to the Work Sector.
Transfer of Parts and Components to the Work Sector.
Installation of Electrical Plates for Plugs and Lighting to the working area.
Analyzing the results obtained previously, it is possible to conclude the following: 35.45% of the total intervention time is required for pulverizer cooling. It is the one that requires the longer time during the inspection process. At the moment, it was not possible to reduce this time. Considerable time is invested both in preparing tools and in finding those that are not in the corresponding inspection place, and that time varies between each inspection. 26.21% of the total time is wasted in cleaning the coal feeder. Preparation of gaskets requires in average 8.69% of the total time. Considerable time was wasted (and may vary) in treating pinched pins.
After the analysis, it was recommended to convert the following internal tasks into external ones. All tools, materials and spare parts to be used must be transferred to the equipment sector before it is taken out of service. Make available on the shop floor the appropriate gaskets for the coal feeder and pyrite traps. The same with a set of bolts for the carbon feeder gate and pyrite trap. For the reduction of the times of both the internal and external tasks, the following actions were implemented: Have a set of bolts for the coal feeder available on the shop floor. Make available to the maintainers a set of bolts for each gate of the pyrite trap. Search or development of a tool to clean the coal feeder. Training of mechanical labour in aspects related to the SMED method.
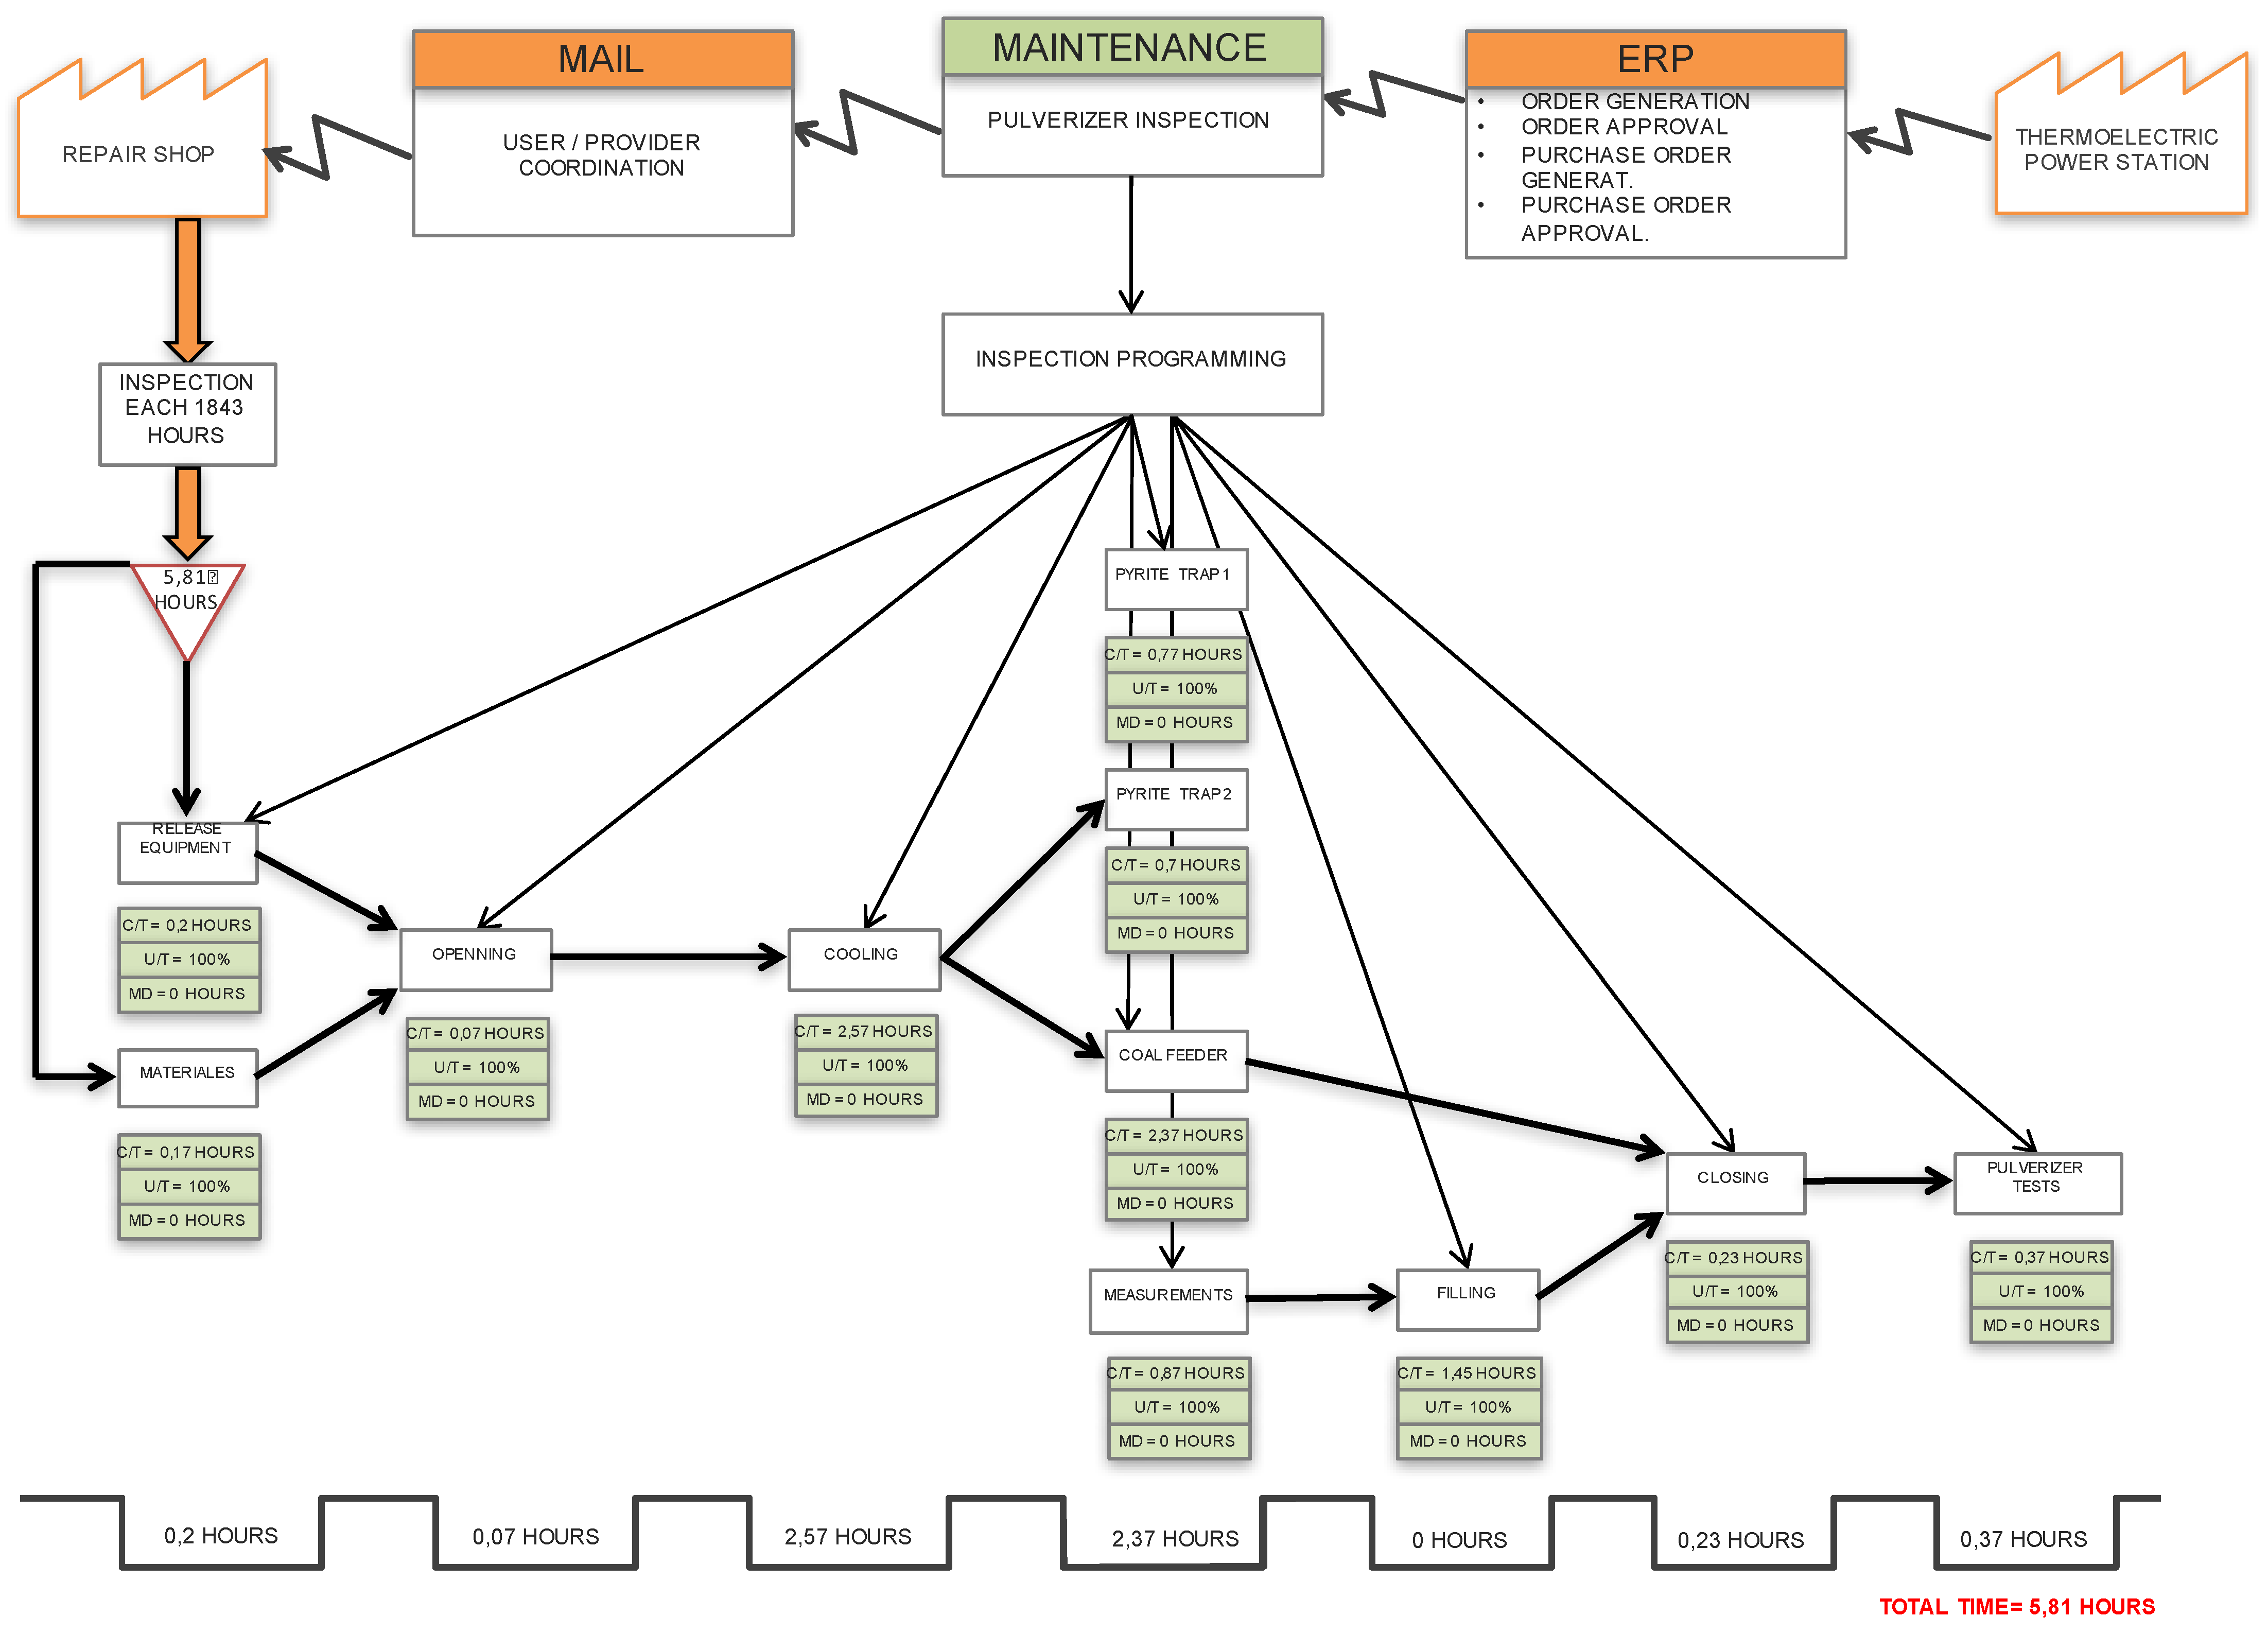
In order to support the analysis mentioned above, the Value Stream Mapping technique was used (
Figure 8). These maps specified the current status of interventions in the pulverizers and the state to be implemented, following the modifications already discussed.
Figure 9 shows the value stream map of the current state, while
Figure 10 specifies the projected situation for the pulverizer interventions.
Table 7 shows the times involved if the actual state. According to this proposed situation, savings of 1.44 h of maintenance per intervention are possible, which means that the execution of these activities could last 5.81 h (25% reduction in time).
Projecting the results and reductions obtained in the implementation of the SMED method, as we can see in
Table 8, an improvement of 0.078% in the availability. Although this does not appear to be a significant figure, in the following paragraphs we will show its great relevance, since it directly affects the costs involved in stopping a sprayer. To begin the evaluation, the following definitions must be kept in mind.
Loss of generation [MW/h]: This is the loss that occurs when a pulverizers stops. In this case, stopping a sprayer implies a drop of the plant at 40 [MW/h].
Average Marginal Cost [USD/MW]: the cost of producing an additional Mega Watt. This cost is defined by a state regulatory agency. During the period of analysis, it corresponded to USD 151 dollars per Mega Watt.
Cost of inefficiency (Cinef) [USD/h]: This is the cost of stopping a pulverizer an hour. This cost is calculated with the following formula:
Expected annual downtime (Unavailability) [hours]: It is the time that a pulverizer is estimated to be out of service during one year, i.e., is the unavailability of the equipment, and is calculated as follows:
Annual level of value destruction (AVD) [USD]: This is what it is lost annually by having an out-of-service pulverizer. It is calculated as follows:
Global Cost (CG) ([USD]: The cost of the maintenance process is calculated as follows:
where
Fa is the actualization factor and corresponds to:
For the power station considered in these case studies, an interest rate of 12%, a horizon of 1 year, a marginal cost of 151 [USD/MW], a zero variable cost and an inspection every 1843 h was estimated.
Table 9 shows a table with the original situation and the modified situation, with all its variables, and with the overall cost calculation. After application of the SMED methodology, and considering eight sprayers, it was possible to reduce the overall cost by USD 287,088 in one year.


