Article

On the Feasibility of Gap Detection of Power Transformer Partial Discharge UHF Signals: Gap Propagation Characteristics of Electromagnetic Waves

1
School of Electrical Engineering, Wuhan University, Wuhan 430072, China
2
Shandong Electric Power Research Institute, State Grid Shandong Electric Power Company, Jinan 250002, China
*
Author to whom correspondence should be addressed.
Energies 2017, 10(10), 1531; https://doi.org/10.3390/en10101531
Submission received: 24 August 2017 / Revised: 28 September 2017 / Accepted: 29 September 2017 / Published: 2 October 2017
(This article belongs to the Section F: Electrical Engineering)

Abstract

:
This study analyzed the transformer electromagnetic gap propagation characteristics. The influence of gap size is also analyzed, and the results experimentally verified. The obtained results indicated that the gap propagation characteristics of electromagnetic wave signals radiated by the partial discharge (PD) source in different directions are substantially different. The intensity of the electromagnetic wave in the gap reaches a maximum at a gap height of 1 cm; and inside the gap, the intensity of the electromagnetic wave depicted an increasing trend at the tail area of the gap. Finally, from the obtained results, some suggestions on where to install sensors in practical systems for ultra high frequency (UHF) PD signal detection in the transformer gap are provided. The obtained results confirmed the feasibility of using this approach. These results can be seen as a benchmark and a challenge for further research in this field.

1. Introduction

Power transformers are expensive devices that play an important role in power systems. As an effective means of insulation degradation detection, the ultra high frequency (UHF) method has been extensively used in the detection of partial discharge (PD) in transformers [1,2].
Currently, UHF antenna sensors are primarily inserted into transformers via handholes [2] and oil drain valves [3] or placed outside by the addition of a dielectric window [4,5,6]. Built-in antenna sensors can effectively shield the sensor from the electromagnetic interference in the surrounding environment, but two problems exist: (1) the built-in antenna sensors will change the internal structure of the transformer, which may damage the uniform distribution of the internal electromagnetic field; (2) for transformers in operation, electric power companies are always unwilling to allow retrofitting. The method of adding a dielectric window can only occur when the transformer is being manufactured or during an overhaul. Accordingly, this dielectric window method cannot be used for the PD detection of transformers in operation.
In China, power transformers (except for barrel type transformers produced by companies such as ABB and Siemens [7]) commonly comprise a top lid and a tank or a tank and a pedestal. The top lid and tank or the tank and pedestal are sealed by an insulating gasket through bolts, forming a non-ferromagnetic material connection gap that surrounds the transformer (Figure 1). Therefore, when PD defects exist in transformer, the electromagnetic wave radiated by the PD source will leak out through the joint gap, which provides the feasibility for the PD detection of transformer by detecting the leakage of electromagnetic signals through the gap.
Scholars both in China and abroad have studied the gap detection of transformer PD electromagnetic waves. Reference [8] proposed the PD detection method by detecting electromagnetic wave leakage, and the propagation characteristics of the electromagnetic wave through a gap of 46 cm × 2 cm × 1 cm (width × height × depth) are simulated and analyzed. Reference [9,10] proved the feasibility of detecting the PD electromagnetic wave signals of transformers through a gap with an equiangular spiral antenna. Reference [11] showed the successful use of gap detection in the field and reference [12] showed the use in laboratory, as shown in Figure 2.
Reference [13] investigated the propagation characteristics of electromagnetic waves through a gap length of 1.5 cm and a gap height of 0.1 cm (0.3, 0.5, 0.8, and 1 cm) by simulation and verified that a high gap leads to a strong electromagnetic wave passing through. Moreover, Reference [13] affirmed that when the height is greater than a certain value, the intensity of the electromagnetic radiation by gap tends to be stable. However, Reference [13] does not take the gap depth into consideration. In the real transformer gap, along with reflection loss and transmission loss, both diffraction and reflection occur, leading to unstable change of energy distribution. Reference [14] validated that the transformer tank has a serious attenuation effect on the electromagnetic wave propagating through the gap and other parts. Reference [7] analyzed the propagation characteristics of 0- to 2-GHz electromagnetic waves in a flange gap by using plate waveguide theory and magnetic field attenuation theory of electromagnetic wave gap propagation.
Although the method of detecting PD electromagnetic signals through the transformer gap has been successfully used in China, the electromagnetic gap propagation characteristics and the influence of gap size have not been studied. This research aims to further improve the efficiency of gap detection of PD UHF signals. The propagation characteristics of the electromagnetic wave radiated by the PD source in different directions and the influence of the gap height and depth on the propagation characteristics are simulated and analyzed by the finite-difference time-domain technique and then experimentally verified. Finally, suggestions on where to install sensors for UHF signal detection in the transformer gaps in practical systems are provided, which generates a solid foundation for future research.

2. Propagation Characteristics of Electromagnetic Waves in Gaps

The propagation process of PD electromagnetic wave through the transformer gap results in edge diffraction of the electromagnetic wave at the gap entrance and at the gap exit. In addition, given that the size of the transformer gap is similar to the wavelength of electromagnetic wave radiated by the PD source, the diffraction of the electromagnetic wave will occur during the propagation through the transformer gap.

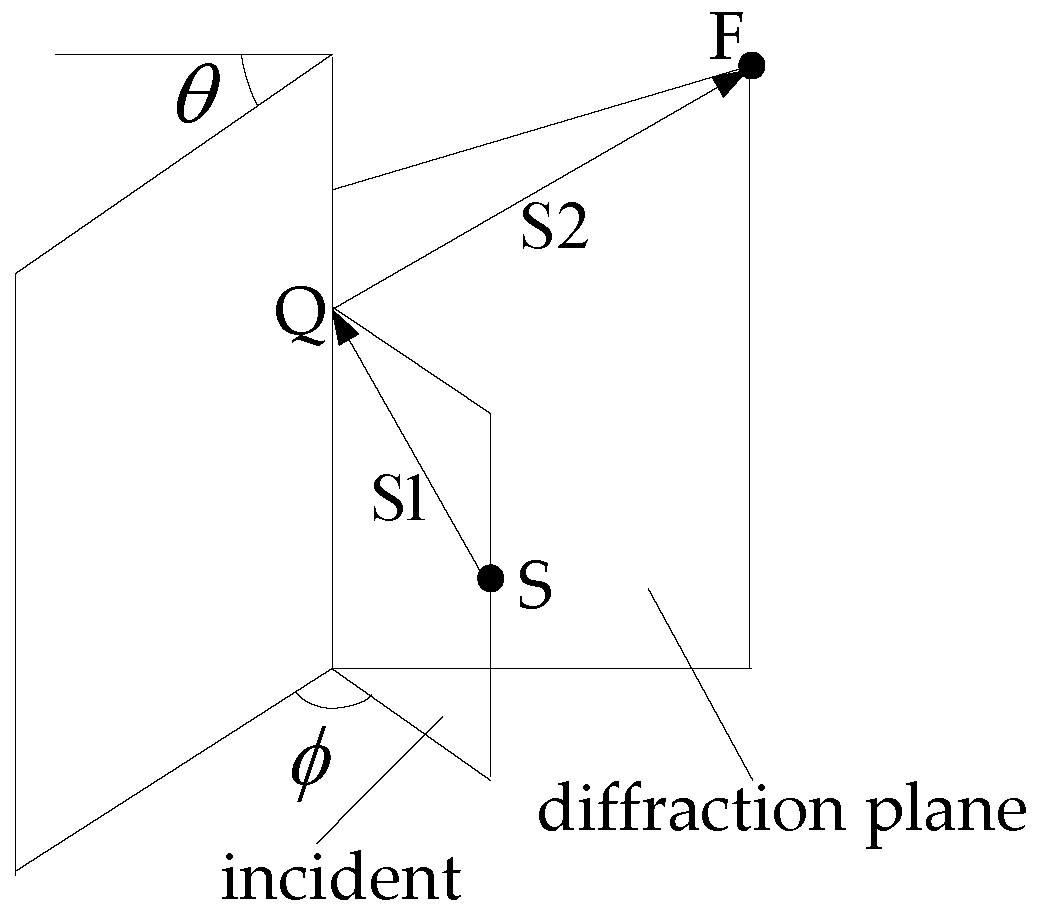
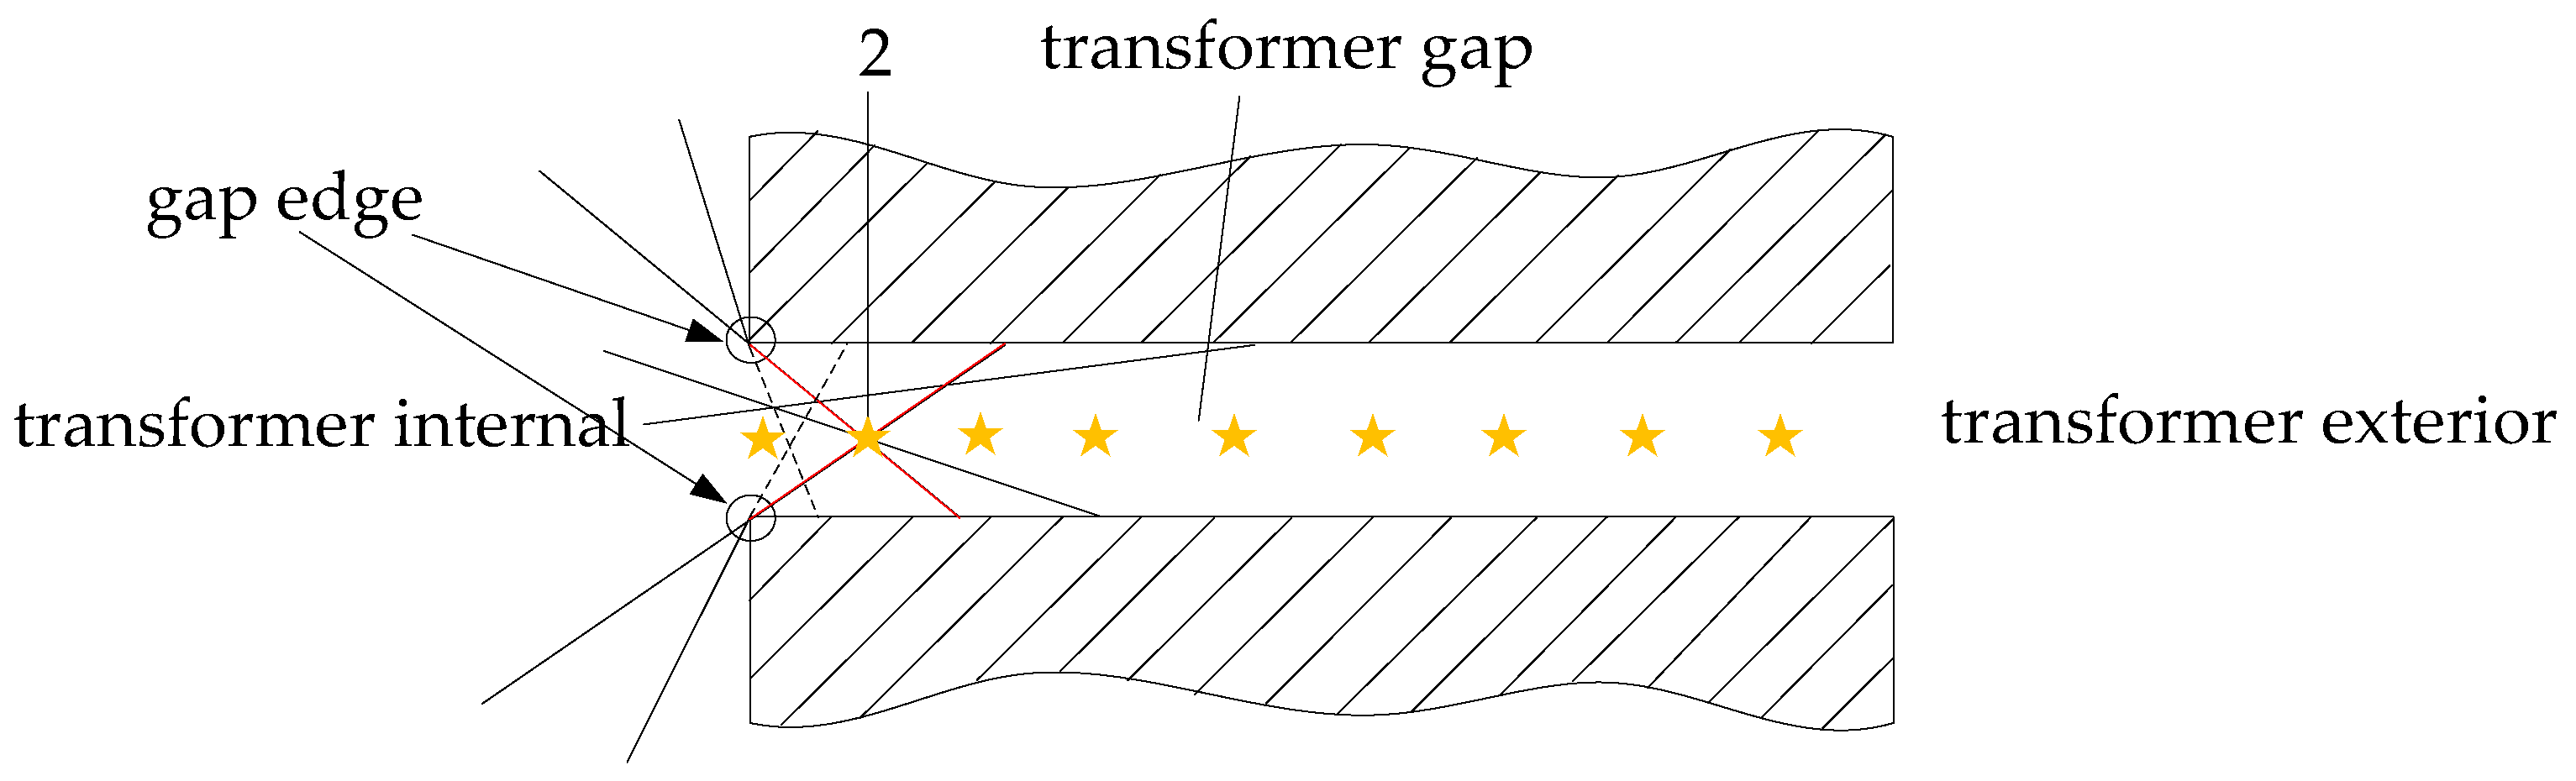
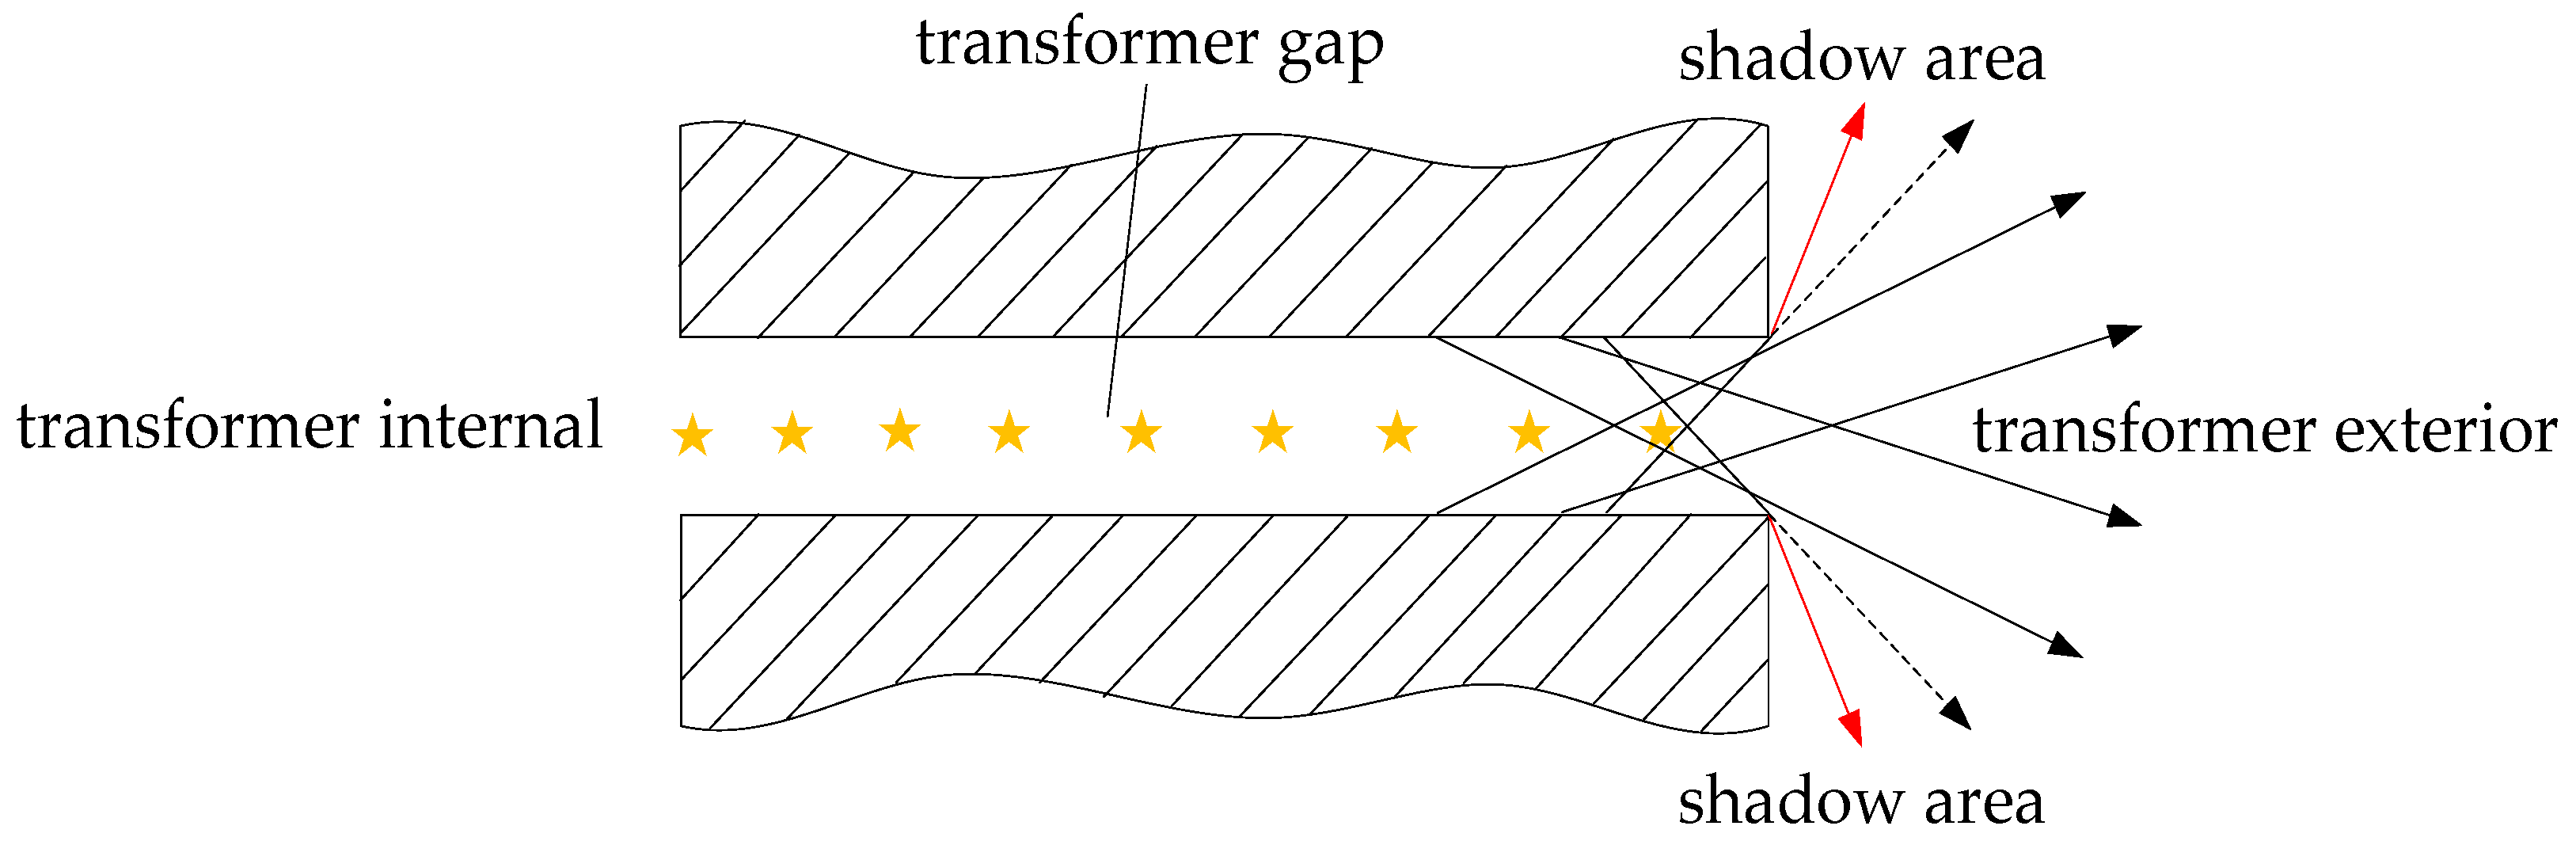
2.1. Edge Diffraction

In the propagation process of electromagnetic waves, edge diffraction will occur because of the presence of the gap edge and as a result, the electromagnetic wave signals will no longer follow geometric optics theory which is only used to study incidence, reflection and diffraction of electromagnetic waves [15]. The electromagnetic wave will deviate away from the original propagation path and diffract to the geometric shadow area. Figure 3 shows a schematic diagram of straight edge diffraction geometry.
Here S is the source point, Q is the edge diffraction point, F is the field point, S1 is the distance between the source point and the diffraction point, and S2 is the distance between the diffraction point and the field point, ϕ is incidence angle, θ is wedge angle. At the diffraction point Q, the initial value of the diffraction field Ed(Q) can be expressed as follows:
E d ( Q )   =   D E i ( Q ) ,
where D is the dyadic diffraction coefficient matrix and the order of matrix D is different in different coordinate systems.
The field value of field point F can be obtained from Equation (1) [16]:
E d ( F )   =   E i ( Q ) A d ( S 2 ) e jk s d ,
where A d ( S 2 ) is the diffusion factor, which indicates the amplitude change of the field along diffraction ray. When the incident wave is a plane wave which can be used to roughly analyze spherical wave in the far field zone:
A d ( S 2 )   =   1 S 2 ,
where S2 is the distance between the diffraction point and the field point.

2.2. Kirchhoff Diffraction Theory

When the electromagnetic wave passes through a gap or aperture, diffraction will occur, thereby changing the direction of the electromagnetic wave propagation. Kirchhoff’s theory is the basis of studying electromagnetic diffraction.
The Kirchhoff equation is employed to represent the scalar field in the enclosed region with its edge value. On the assumption of passive closed region V, and the scalar field generated by the current and the magnetic flux source at observation point P(r) is ψ, and then the scalar field ψ satisfies the Helmholtz equation:
2 Ψ ( r ) + k 2 Ψ ( r )   =   0
Through Green’s second theorem:
ψ ( r ) = e jkR 4 Π R [ Ψ ( r ) + jk ( 1 + j 1 kR ) R R Ψ ( r ) ] ge n dS
If the center of the infinite large screen has a small hole, then volume V′ is the right side of the screen space, and the boundary conditions are as follows: small hole surface—S3, the right side of the screen surrounded by the infinite space hemisphere—S4. Point r′ is a point on S4:
ψ ( r ) = f ( θ , φ ) e jk r r ,
ψ ( r ) r = e n g ψ ( r ) = ( jk 1 r ) ψ ( r ) ,
Equations (6) and (7) are integrated into Equation (5), and the calculation is follows:
[ ψ ( r ) + jk ( 1 j 1 k r ) R R ψ ( r ) ] e   0 ,
Therefore, the field at any point r in region V′ is generated only by the sub-wave source on S3. The integral in Equation (5) only need to be performed on S3:
ψ ( r ) = S 0 e jkR 4 π R [ ψ ( r ) + jk ( 1 + j 1 kR ) R R ψ ( r ) ] e n d S ,
Considering the far-field diffraction (Fraunhofer diffraction), if the observation point on the right side of the screen is far away, then Equation (9) can be simplified to the following form [17]:
ψ ( r ) = e jkr 4 π r S 0 e jkg r [ e n ψ ( r ) + jk e n ψ ( r ) ] d S ,

2.3. Propagation of Electromagnetic Waves in Transformer

When electromagnetic waves radiated by a PD source propagate from the transformer internal area to the transformer gap, edge diffraction occurs at the edge of gap. The edge diffraction will cause electromagnetic wave to diverge from the original propagation path and converge, and the electric field strength of the convergence point will be strengthened. Figure 4 is a schematic diagram of the electromagnetic wave incidence in the transformer gap, where the dashed line is the original propagation path of the electromagnetic wave, and the red line is one of the actual propagation paths after diffraction, and point 2 is the convergence point.
In the process of electromagnetic wave propagation inside the gap, given the blocking effect of the gap wall, the electromagnetic wave will reflect on the inner surface of the gap. The reflection process increases the signal intensity in the gap, and the number of reflections increases with the increase of the incident angle. In addition, given the existence of reflection loss and transmission loss, the electromagnetic wave intensity will gradually decrease during the propagation process. Without considering the leakage of electric field, the attenuation degree SE of the electromagnetic wave that propagates through gap is as follows [7]:
SE   =   27.3 c b   +   20 lg ( 1 + k ) 2 4 k , dB ,
where b is the gap height, c is the gap depth, and k is the relative wave impedance of the gap.
Because of the absence of gap constraints, when an electromagnetic wave propagates from a transformer gap to the external free space, the electromagnetic wave reflection process ends. Most of the electromagnetic waves will continue to propagate in the free space along the original propagation path, thereby suddenly decreasing the electric field intensity. Diffraction and edge diffraction at the edge of the gap exit, lead to electromagnetic wave divergence from the original propagation path to the shadow area, thereby resulting in a further decrease in signal strength. Figure 5 is a schematic diagram of the electromagnetic wave in the transformer gap exit, where the dashed line is the original propagation path of electromagnetic wave, and the red line is one of the actual propagation paths after diffraction and edge diffraction.

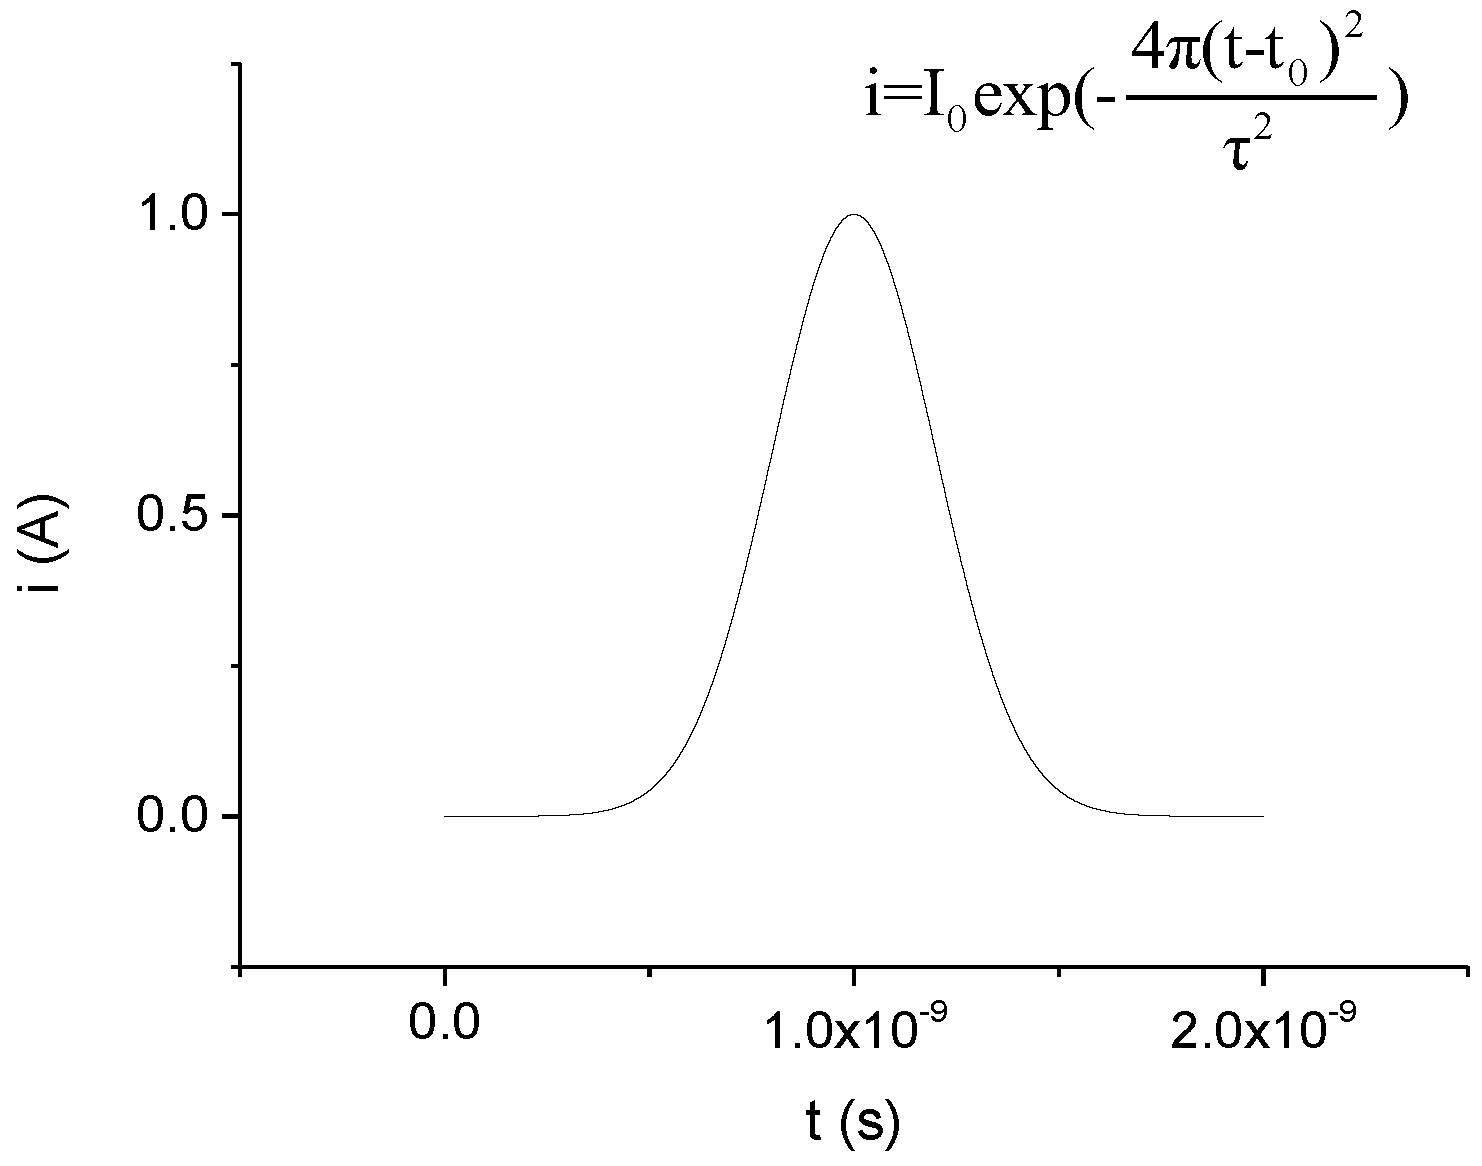
3. Simulation Experiment

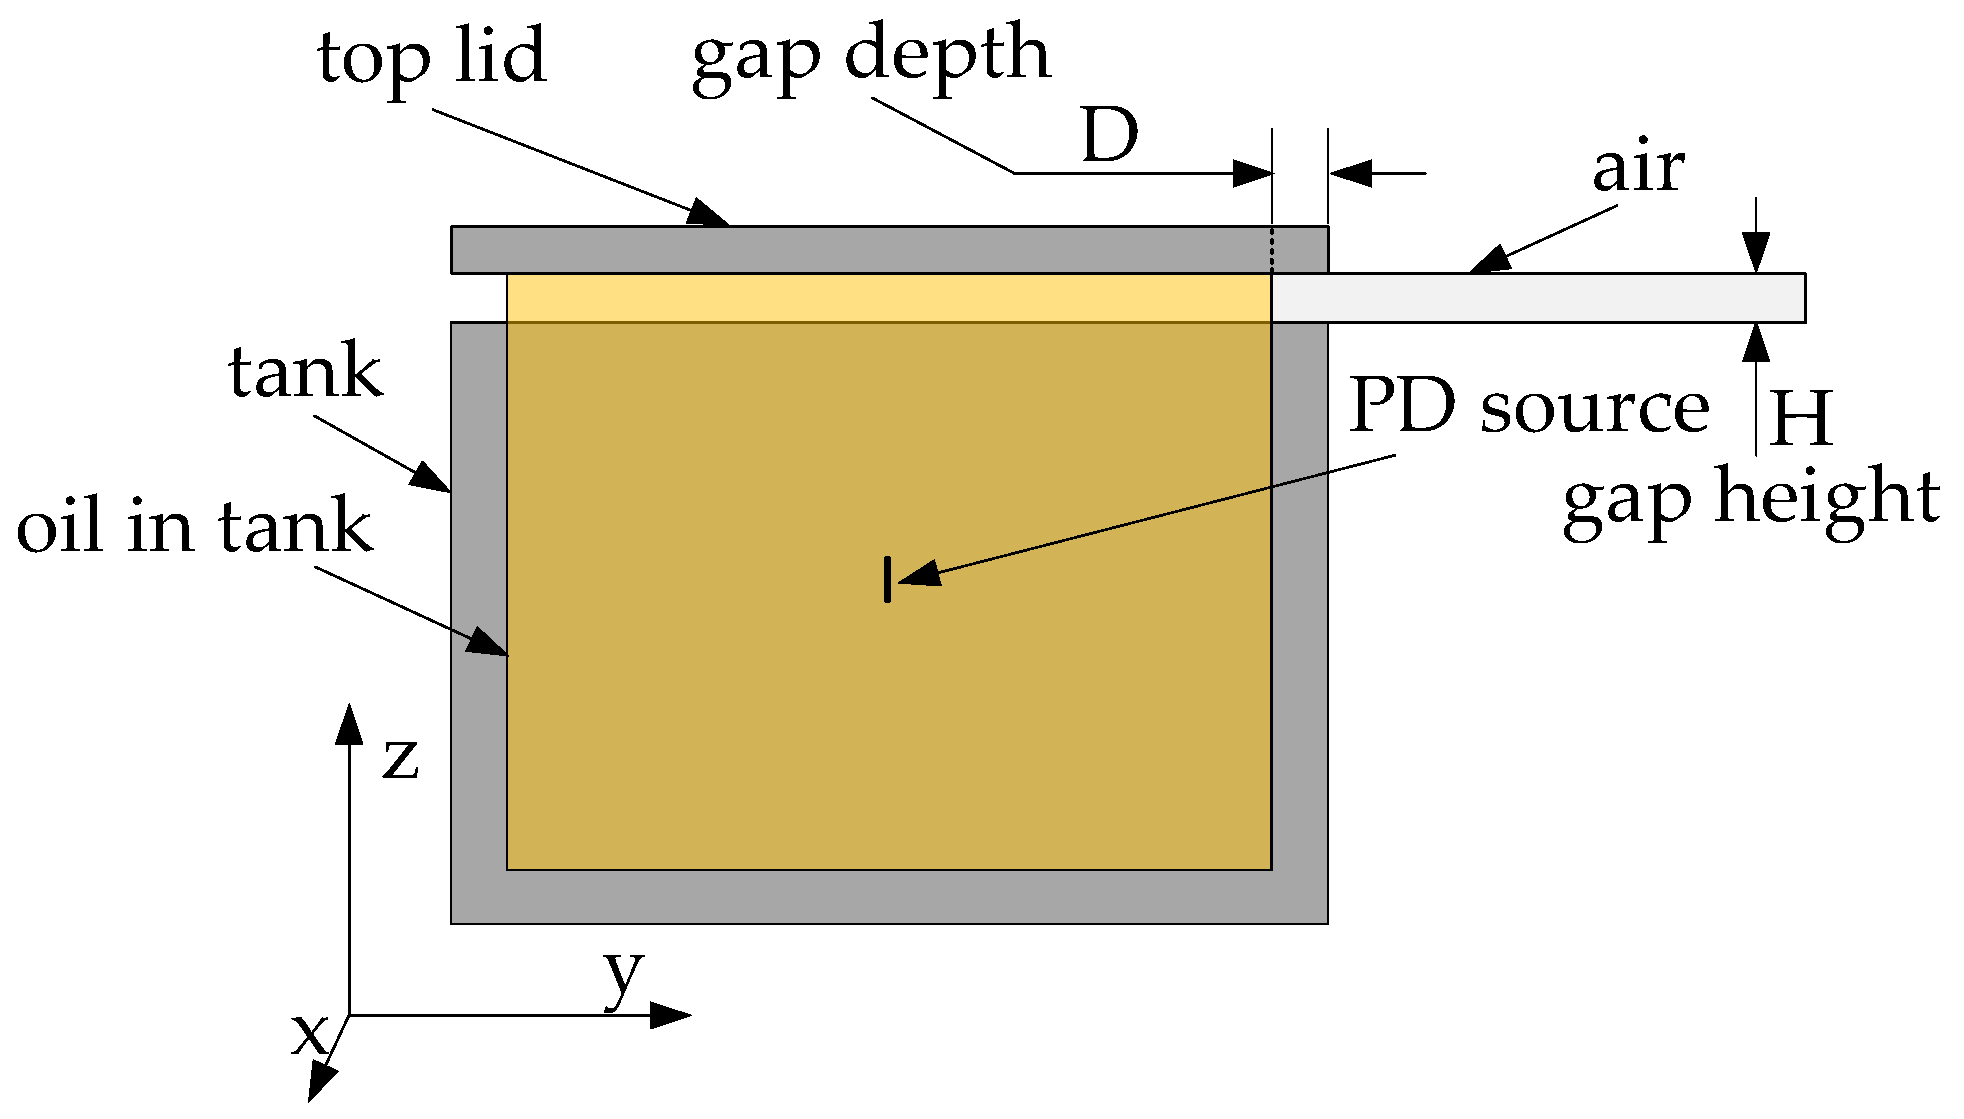
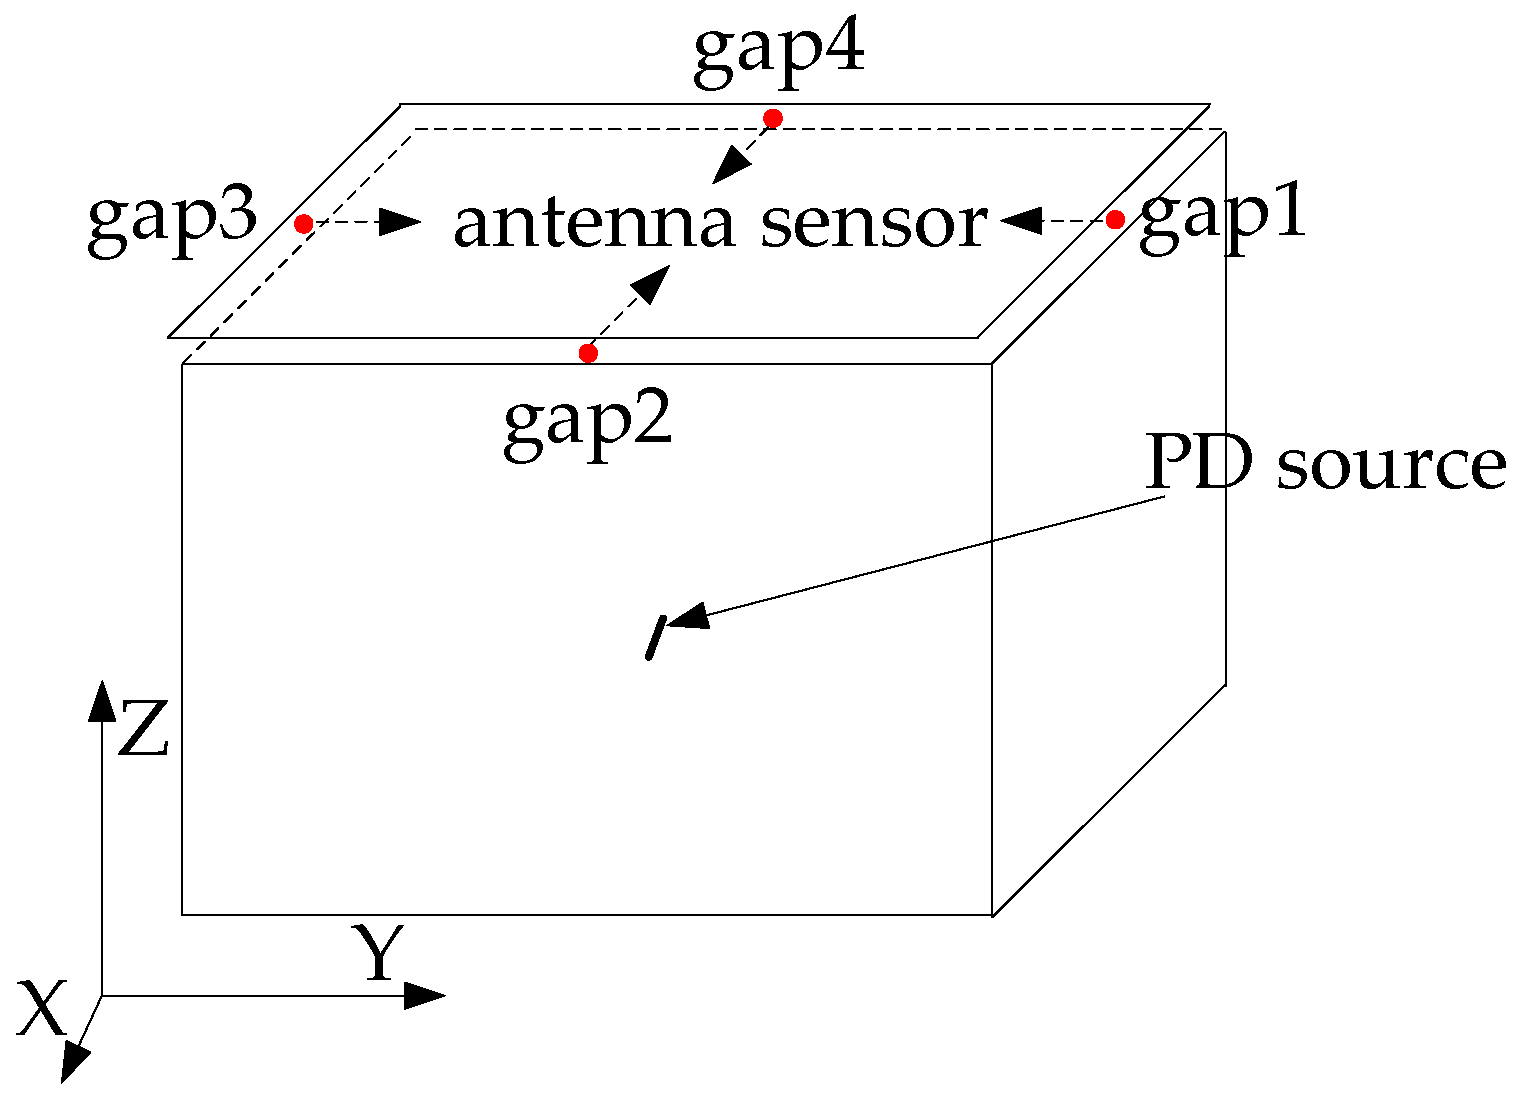
3.1. Simulation Model

Depending on the voltage level, product type, and manufacturer, the height and depth of gap between the top lid and tank or between the tank and pedestal have a few differences. However, an approximate size range exists, the gap height is approximately 1–4 cm, and the gap depth is approximately 2–18 cm. In the present study, a simulation model with a size of 1100 mm × 1100 mm × 1080 mm is constructed based on the actual characteristics of the gap size of the transformer and the computing power of the computer (Figure 6).
The values of H and D will vary with the difference of experimental items in the subsequent sections of this paper. Accordingly, the specific values of the two are not directly provided in Figure 6.
Figure 7 shows the layout of the detection points, where detection point Nos. 1–4 are located in the gap, and the distance between the adjacent detection points is Δ d which is different depending on the research section. Detection point Nos. 5–7 are located inside the transformer for better understanding the whole propagation process of electromagnetic waves from the transformer internal to transformer exterior, and the distance between the adjacent detection points is 70.7 mm, α   =   45 ° . Detection point Nos. 8–12 are located outside the transformer, and the distance between the adjacent detection points is 30 mm.
The PD source is simulated by Gaussian pulses [18] loaded on the monopole antenna, which is 525, 500, and 500 mm from the bottom, the left, and the front inner walls of the oil tank, respectively, where the pulse peak I 0 is 1 A, and the pulse width τ is 1 ns, shown in 1 ns (Figure 8). The current source is in series with a 50 Ω resistance and the peak voltage which is on the load is 50 V in fact. Although the value of Gaussian pulse is bigger than the real PD source, leading to a bigger value of detected signal by the point sensor, this can more clearly exhibit the gap distribution characteristics of electromagnetic wave and has little effect on the accuracy of propagation characteristics of electromagnetic wave. Figure 9 depicts the radiation pattern of the monopole antenna.

3.2. Analysis of Simulation Results

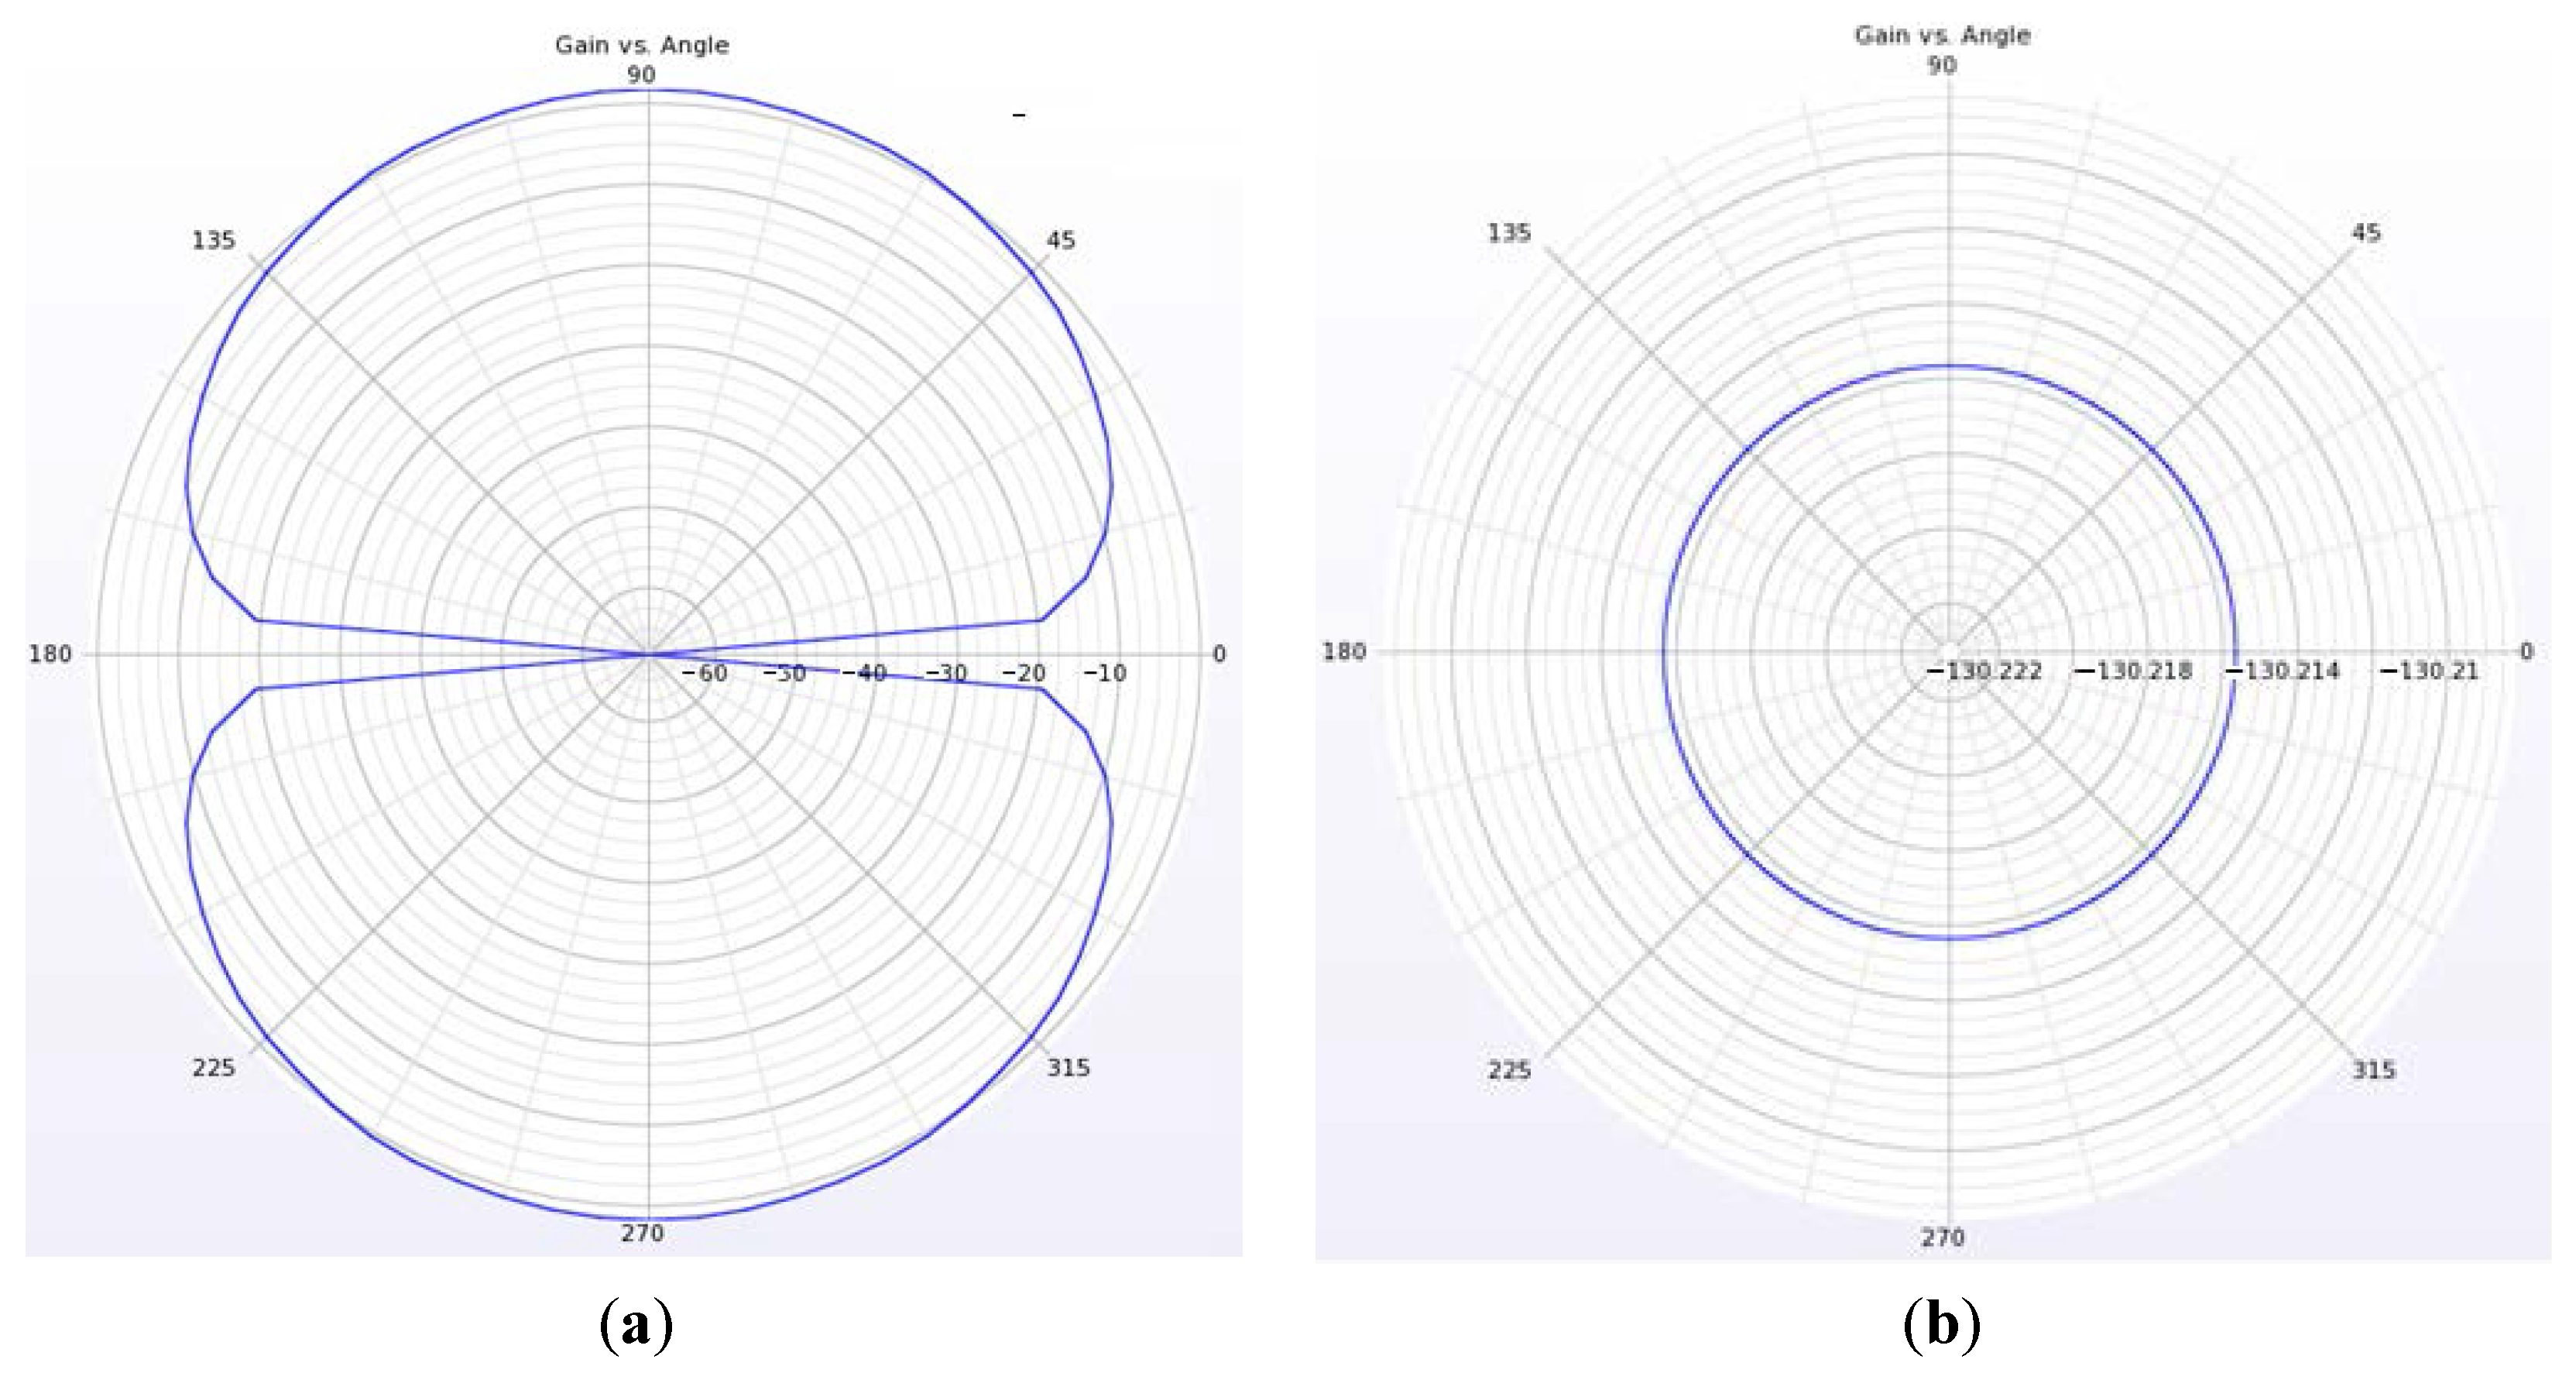
3.2.1. Propagation Characteristics in the Transformer Gap of the Electromagnetic Waves Radiated by the PD Source in Different Directions

Figure 9 illustrates that the intensity of the electromagnetic wave radiated by the monopole antenna in its vertical plane is greater than that in the parallel direction. Therefore, when the PD source (antenna) is oriented in different directions, the PD source will produce low-intensity electromagnetic wave signals in a specific direction. Accordingly, the propagation characteristics in transformer gaps of the electromagnetic signals radiated by PD source in different directions can be studied by adjusting the PD source direction.
From the reasonable range of transformer gap height and depth, a 3 cm high and 5 cm deep gap is selected as the starting research object, where Δ d is 15 mm. The signal source is adjusted to the X-, Y-, and Z-axis positive directions separately, of which the directions are the physical direction of antenna. Figure 10 exhibits the experimental results.
Figure 10 exhibits the results of the simulation, where E nergy = 1 K i = 1 N u i 2 R throughout, K is sampling number, N is the number of sampling point, ui is the sampling value, and R is 50 Ω. The X-axis of Figure 10 is the detection point shown in Figure 7. The intensity of the electromagnetic wave radiated by PD source in the different directions is significantly different. The intensity of the electromagnetic wave radiated by the PD source, which is in the Y- and Z-axis positive directions, is considerably larger than that of X-axis positive direction. Moreover, given the presence of reflection and transmission losses, the intensity of the electromagnetic wave gradually decreases with the increase of propagation distance inside the gap. In the propagation process of the electromagnetic wave from the gap to the transformer exterior, the intensity of the electromagnetic wave radiated by the PD source which is in the Y- and Z-axis positive directions, suddenly decreased. In addition, given the quantity of electromagnetic wave radiated by the PD source in X-axis positive direction itself into the gap is little, the change of the electromagnetic wave intensity is not evident in the process from the transformer gap to the transformer exterior. In the transformer exterior, the intensity of the electromagnetic wave emitted by the PD source in all directions decreases gradually with the increase of propagation distance.
From the preceding analysis, the intensity of the electromagnetic wave inside the gap is significantly greater than the transformer exterior; therefore, inserting the antenna sensor into the transformer gap will considerably improve the detection sensitivity. In addition, given the very large difference of the electromagnetic wave gap propagation characteristics of different direction PD sources, each of the four gaps of transformer is required to set an antenna sensor to achieve full range and the high-sensitivity detection of the electromagnetic wave.
For example, as shown in Figure 11, each gap of the transformer has an antenna sensor. For the convenience of explanation, the sizes of four gaps are assumed to be the same. When the PD source is located in the center of the transformer, if the PD source is in the X-axis direction, the antenna sensors in gaps 2 and 4 will have a high detection sensitivity due to the high intensity of the electromagnetic waves; if the PD source is in the Y-axis, the antenna sensors in gaps 1 and 3 will have a high detection sensitivity; and if the PD source is in the Z-axis, the antenna sensors in gaps 1, 2, 3, and 4 will have the same detection sensitivity. Therefore, regardless of the PD source directions, when each gap of the transformer has an antenna sensor invariably, at least two antenna sensors have a high-sensitivity. When the source is off the center of transformer, one of the two antenna sensors with high detection sensitivity will possess higher detection sensitivity because the distance between the PD source and the antenna sensor is no longer the same.

3.2.2. Influence of Gap Height on Gap Propagation Characteristics of the PD Electromagnetic Waves

The detection point layout scheme and gap depth D remain unchanged. The PD source is oriented in Z-axis positive direction. The gap height H is adjusted to 4, 3, 2, and 1 cm separately. Out of the reasonable range of the transformer gap height, 0.75, 0.5, and 0.3 cm gap heights are added to broaden the scope of research. The influence of gap height on the gap propagation characteristics of electromagnetic wave is studied by detecting the amplitude and cumulative energy of the electric field. Figure 12 depicts the experimental results.
Figure 12 illustrates that, inside the gap, the intensity of electromagnetic wave shows an increasing trend firstly and then descending with the decrease of gap height. When the gap height is 1 cm, the intensity of the electromagnetic wave reaches the maximum. In the transformer exterior, the amplitude of electric field gradually diminishes with the decrease of gap height. Moreover, the variation law of cumulative energy is affected by the accumulated energy inside the gap. The tendency of signal intensity to be inversely proportional to the gap height in the vicinity of the gap exit does not exist; however, with the increase in the transmission distance, this trend is gradually reflected. The appearance of the maximum intensity of electromagnetic wave inside the gap with the decrease of gap height can be attributed to the following: diffraction at the gap entrance and reflection inside the gap will lead to an increase in the electromagnetic wave intensity. However, as the height of transformer gap decreases, the number of electromagnetic waves which enter the gap gradually decreases, thereby weakening the intensity of electromagnetic wave. When the reinforcement effect of the diffraction and reflection is equivalent to the weakening effect caused by the decrease of gap height, the intensity of the electromagnetic wave inside the gap will reach the maximum. Moreover, with further reduction of the gap height, the weakening effect caused by the decrease of gap height is gradually larger than that of the diffraction at the gap entrance and reflection, the signal intensity inside the gap gradually decreased.

3.2.3. Influence of Gap Depth on Gap Propagation Characteristics of the PD Electromagnetic Waves

The analysis results in the previous section corroborate that the intensity of electromagnetic waves in the gap is maximized when the gap height H is 1 cm. Therefore, in this section, maintaining H to be 1 cm and the PD source is in positive direction of Z-axis. Depth D of the transformer was adjusted to 18, 16, 14, 12, 10, 8, 6, 4, and 2 cm separately, studying the influence of gap depth on the gap propagation characteristics of the PD electromagnetic wave, where the corresponding Δ d is separately to be 5.4, 4.8, 4.2, 3.6, 3.0, 2.4, 1.8, 1.2 cm. Figure 13 exhibits the experimental results.
Figure 13 illustrates that, inside the gap, the intensity of the electromagnetic waves shows a gradually increasing trend with the decrease of gap depth D. The intensity of electromagnetic wave has an increasing trend at the tail of gap, and the increasing trend is substantially evident with the increase of the gap depth. Therefore, the antenna sensor should be placed in the entrance or the tail area of transformer gap, and the middle and back sections of the gap should be avoided as much as possible to improve the PD detection sensitivity. In addition, the change of gap depth has a slight effect on the intensity of the electromagnetic wave in transformer exterior.

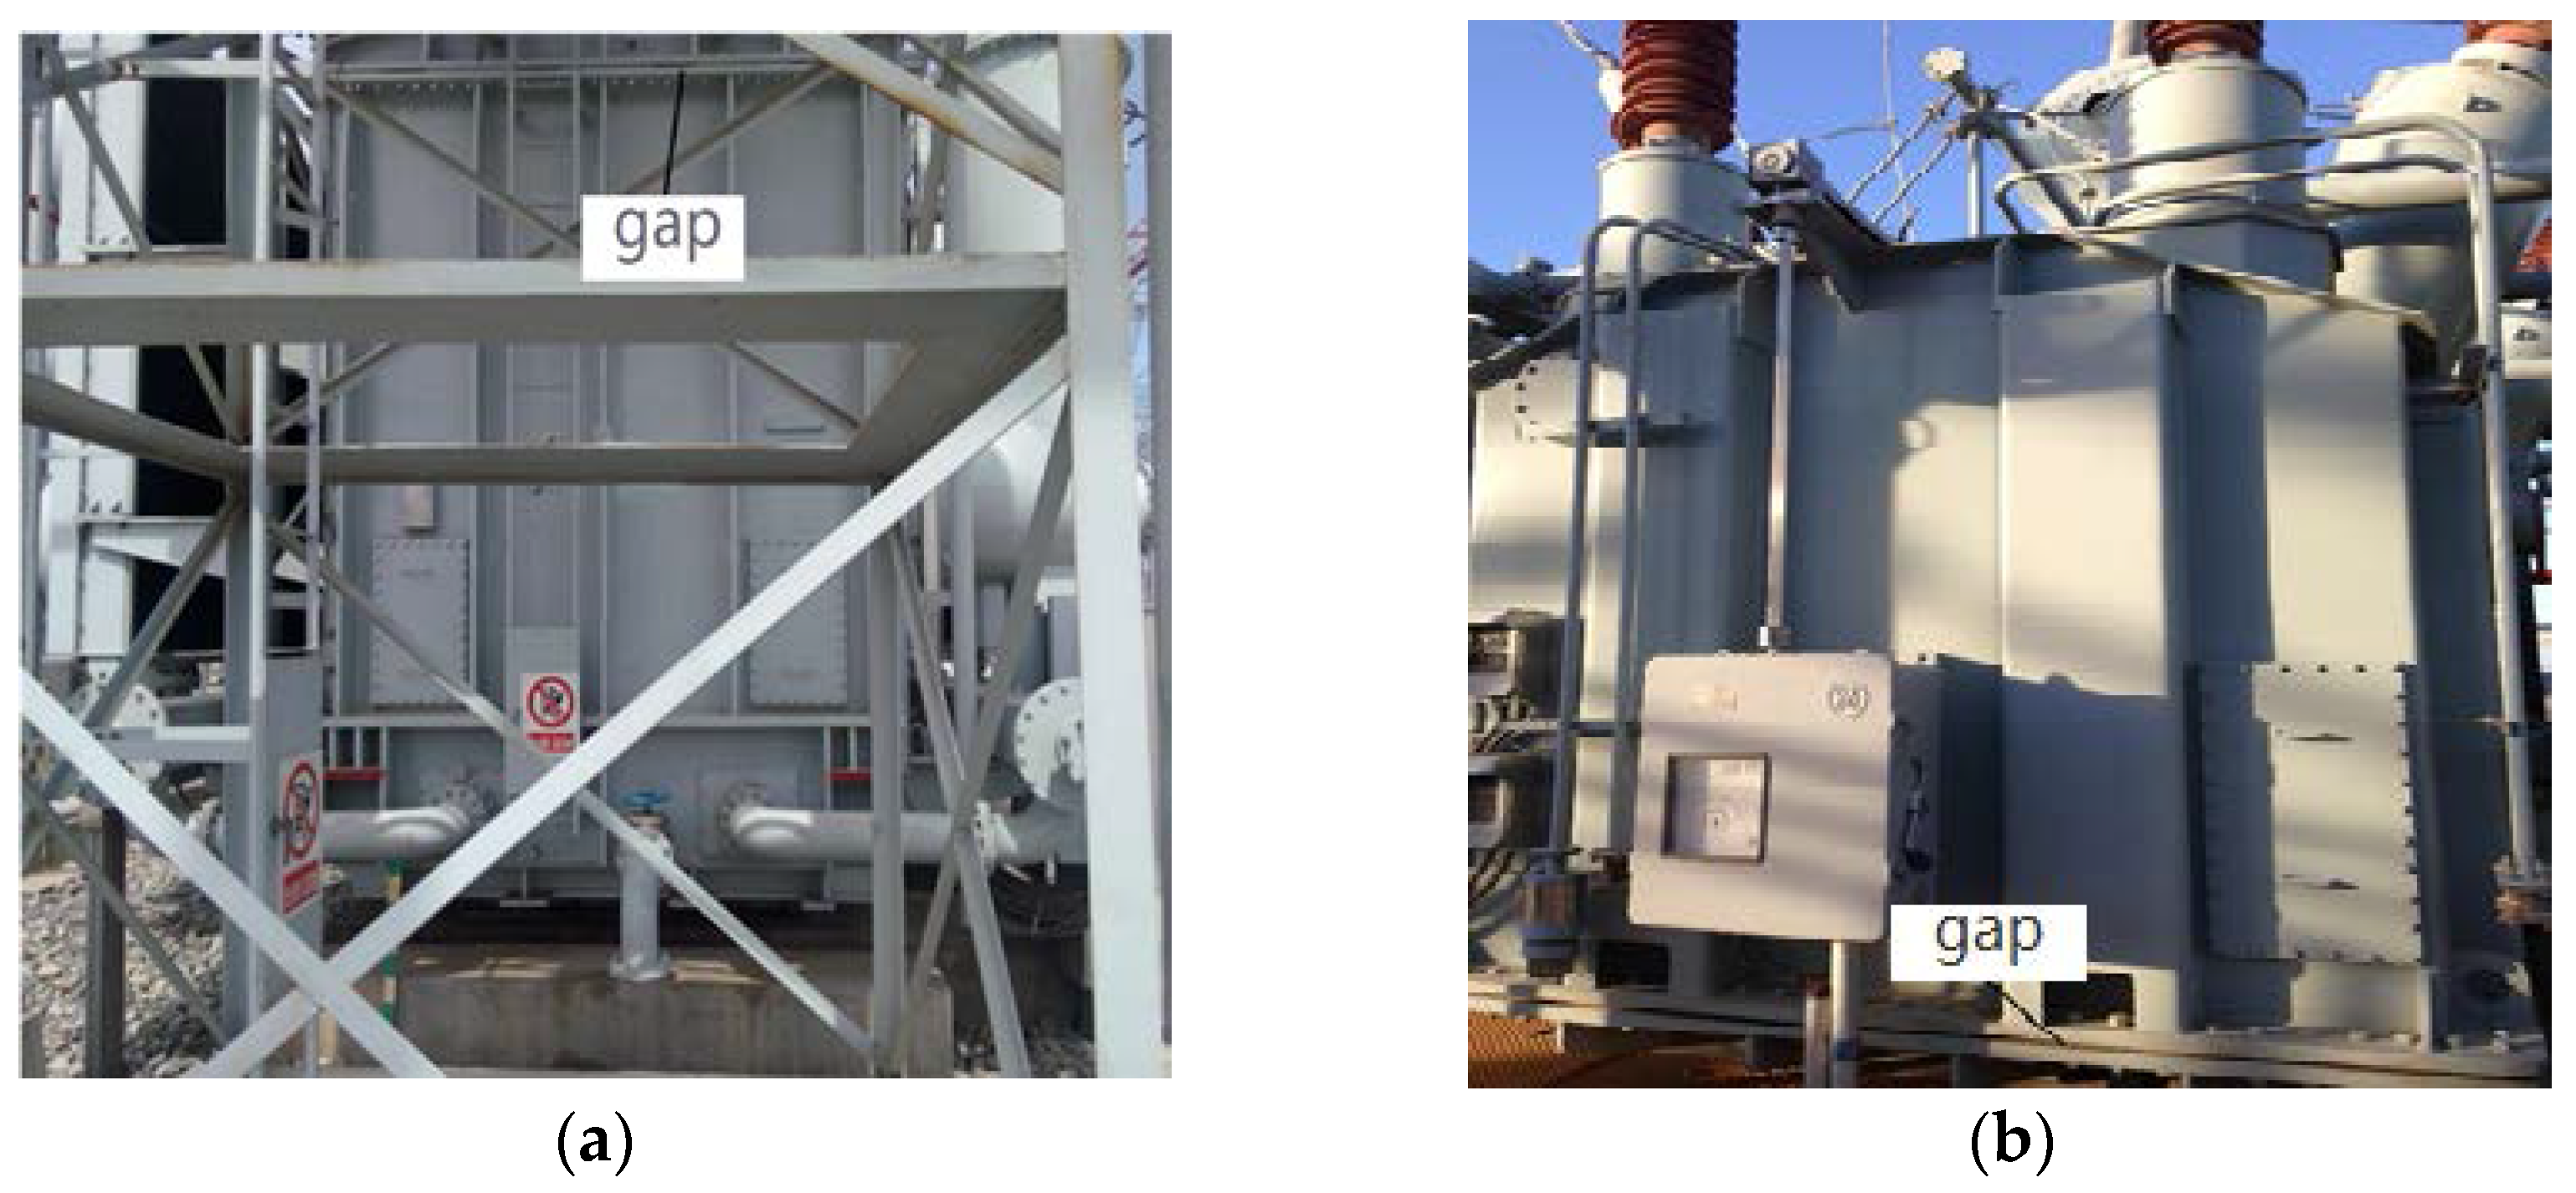
4. Comparison with Experiment

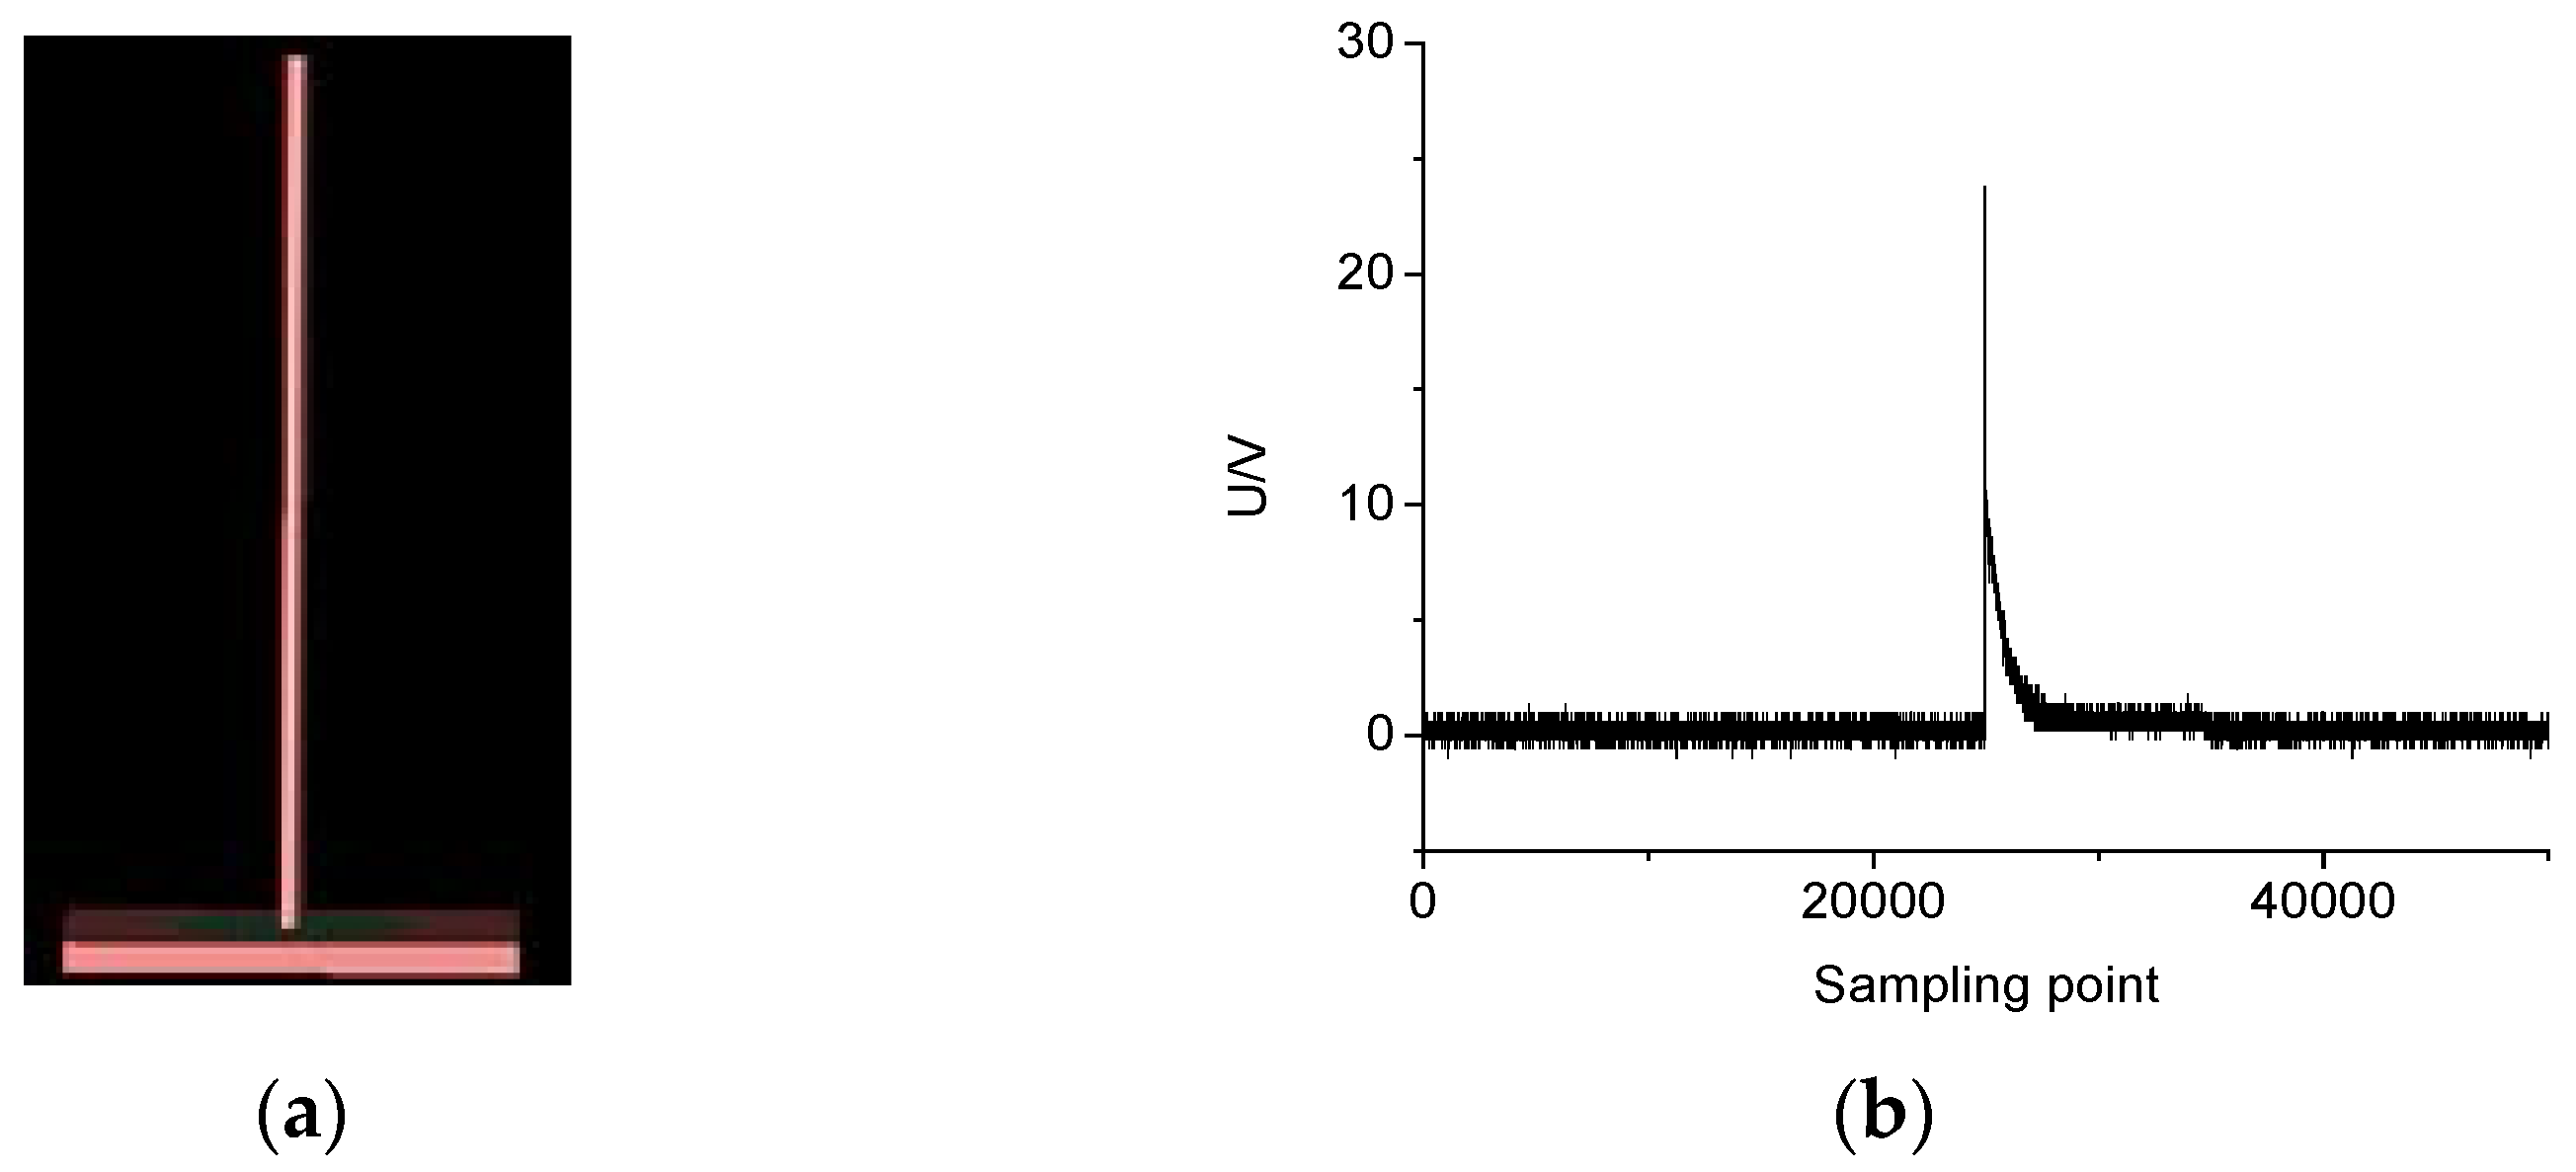
4.1. Experimental Scheme

Based on the gap of a 10-kV oil-immersed transformer, the depth of gap is adjusted by different lengths of copper, and the height of the gap is adjusted by bolts. The antenna sensor for transmitting and receiving electromagnetic wave signal is a monopole antenna (Figure 14a). And for the antenna, the radiation conductor line is 6 cm long; the square ground is 1 cm wide.
From the radiation pattern of the monopole antenna, it’s easy to know that the radiation pattern of the PD source in the experiment is consistent with that of simulation experiment. That is, the capability to radiate electromagnetic wave in the vertical plane is robust. Therefore, the monopole antenna which radiates the electromagnetic wave, can be used to simulate the X-, Y-, Z-axis PD sources by changing its direction. Figure 15 shows the time-frequency domain results of the signal received by the antenna sensor in air environment without transformer tank.
With the comparison of the contents of simulation experiment and the combination of the operability of experiment, the following three parts are designed.
(1)
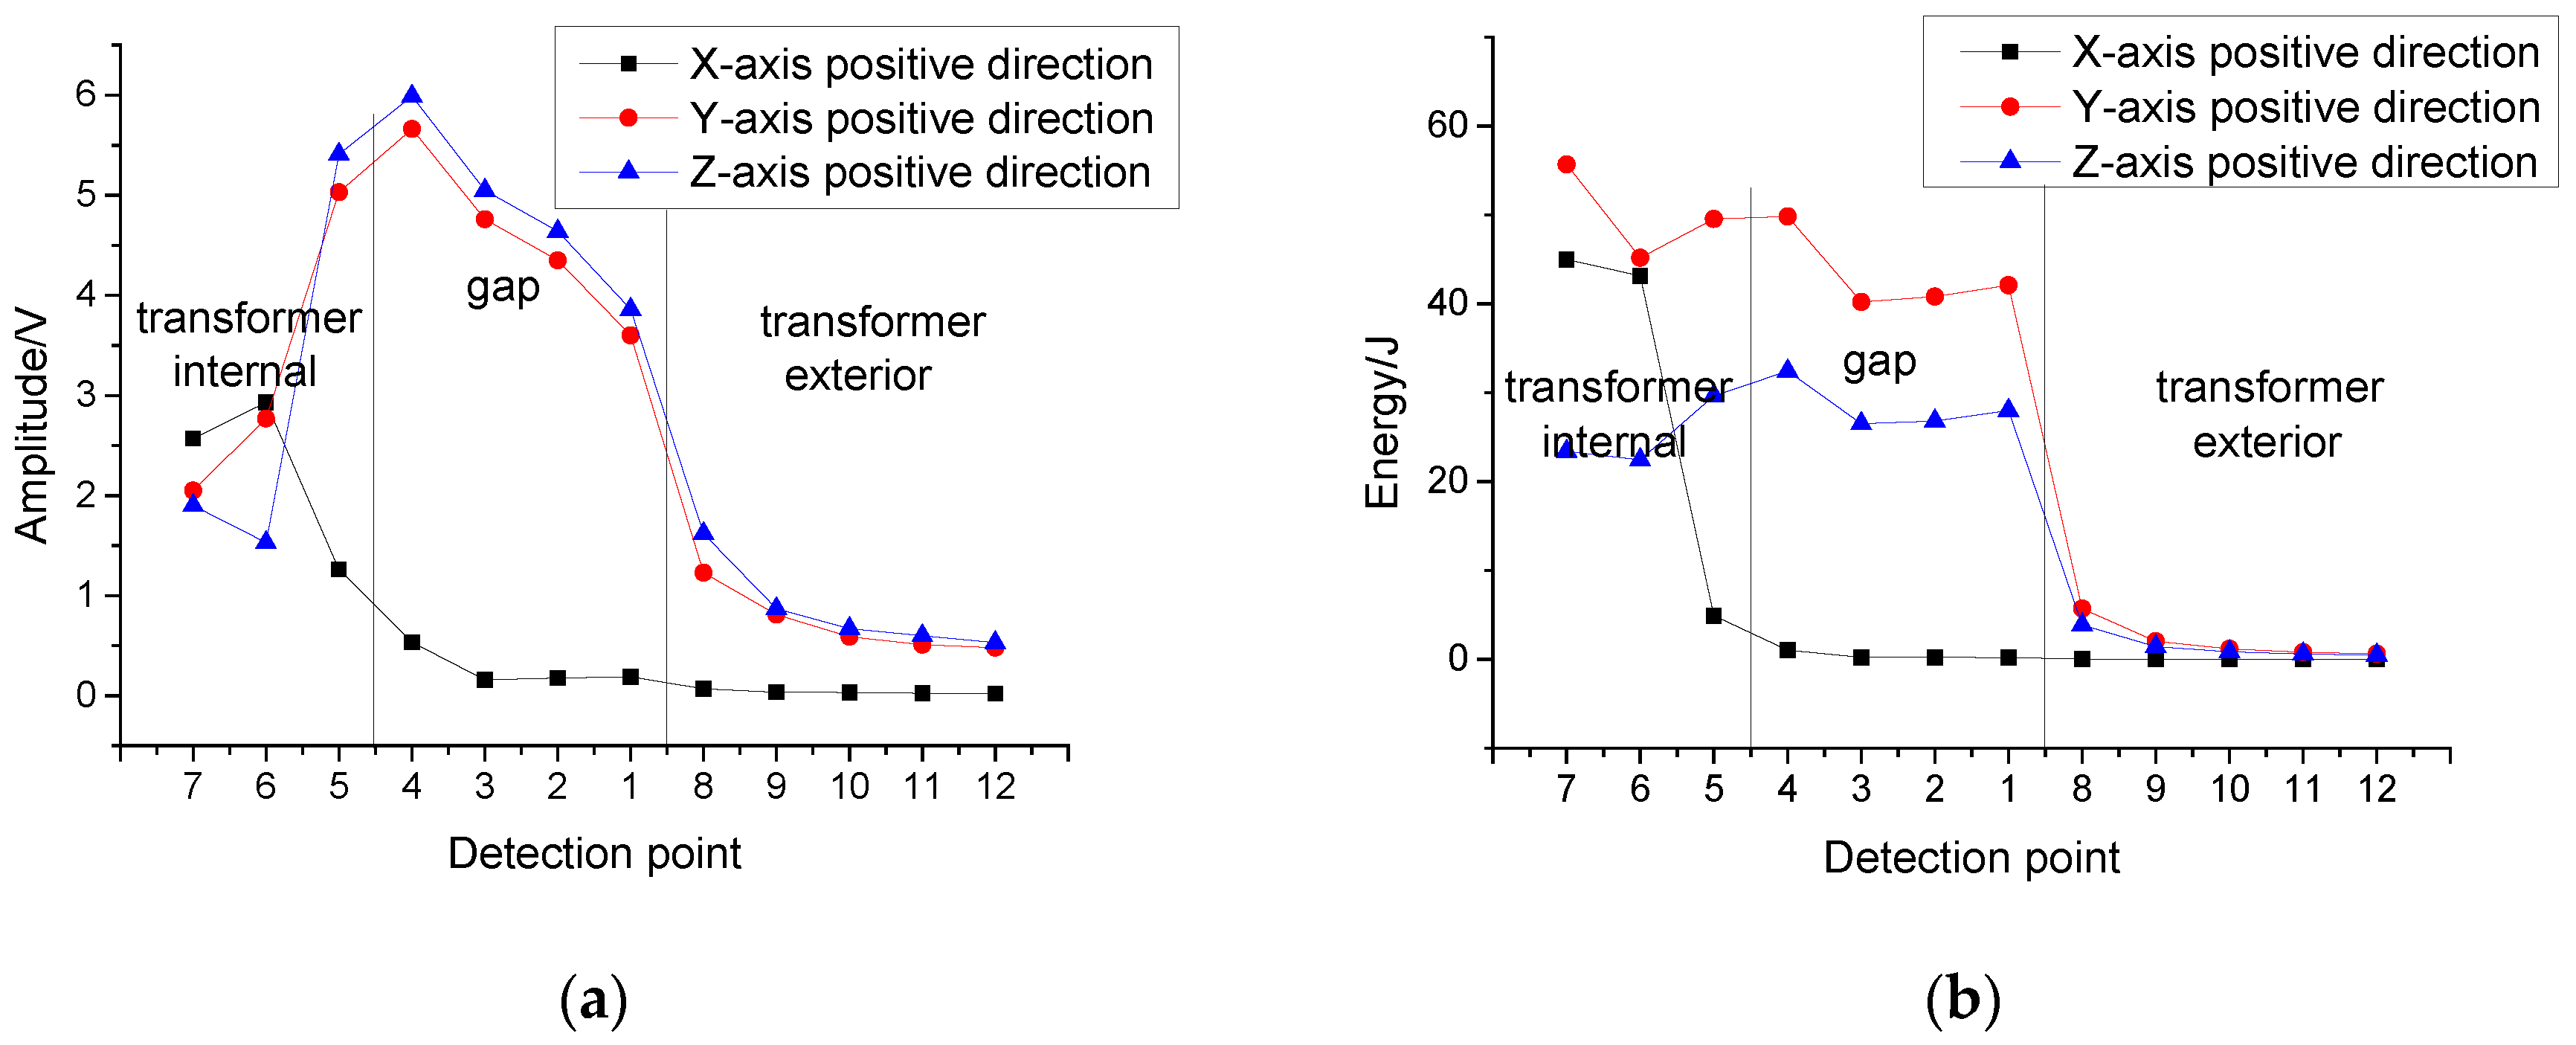
When the transformer gap is 3 cm high and 5 cm deep, the PD source is adjusted to X-, Y-, and Z-axis positive directions separately (refer to the coordinate system in the simulation experiment) to study the transformer gap propagation characteristics of electromagnetic signals radiated by PD source in different directions.
(2)
When the transformer gap is 5 cm deep and the PD source is oriented in Z-axis positive direction (refer to the coordinate system in the simulation experiment), the gap height is set to be 4, 3, and 2 cm separately to study the influence of gap height on the gap propagation characteristics of the electromagnetic wave.
(3)
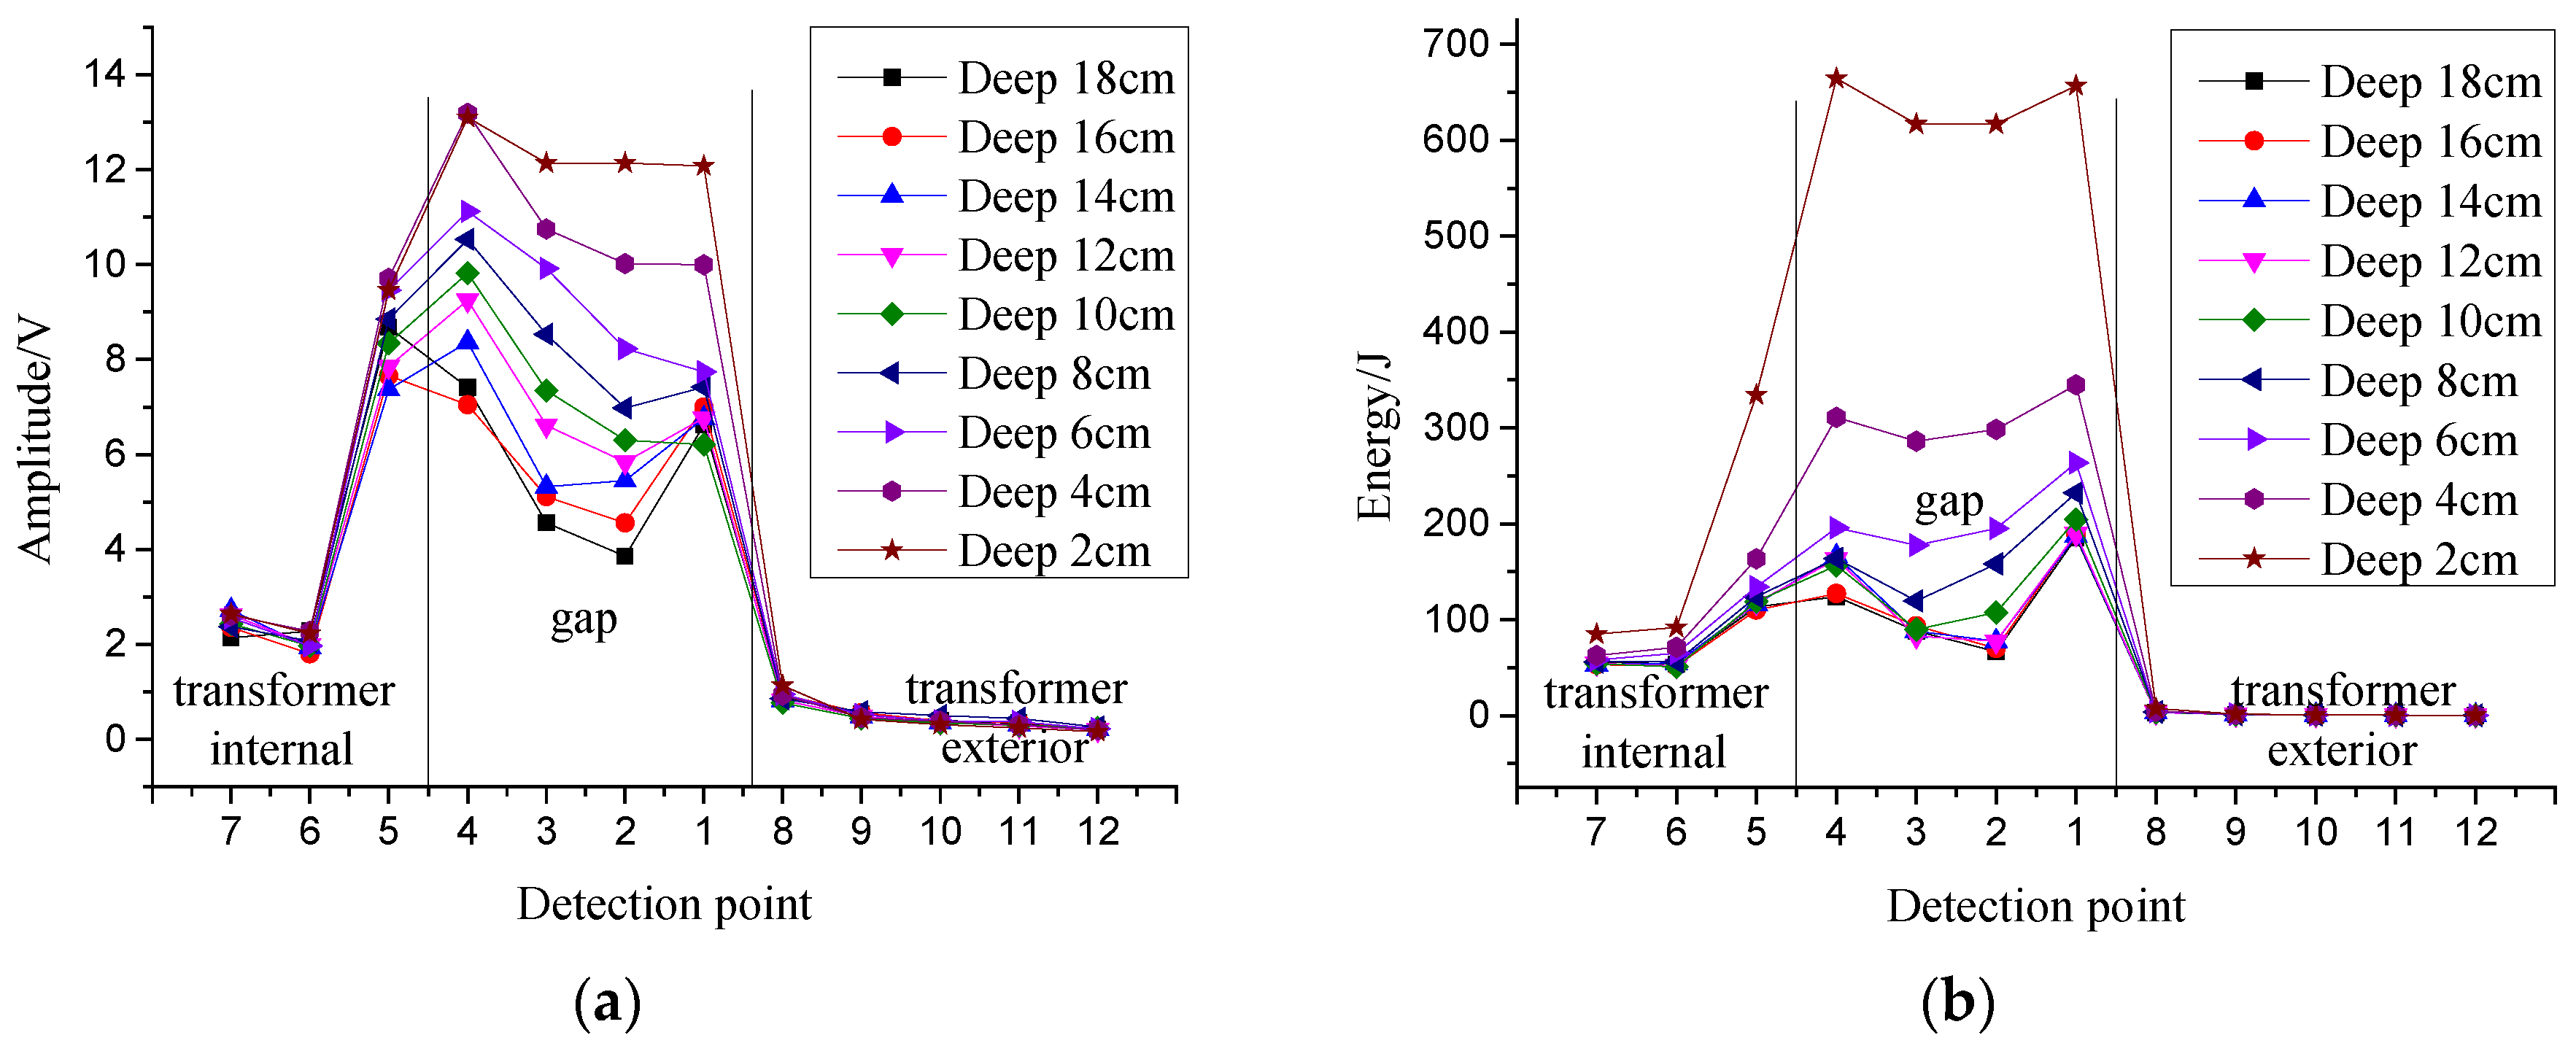
When the transformer gap is 2 cm high and the PD source is oriented in Z-axis positive direction (refer to the coordinate system in the simulation experiment), the gap depth is set to be 18, 14, 10, and 6 cm separately to study the influence of gap depth on the gap propagation characteristics of electromagnetic wave.

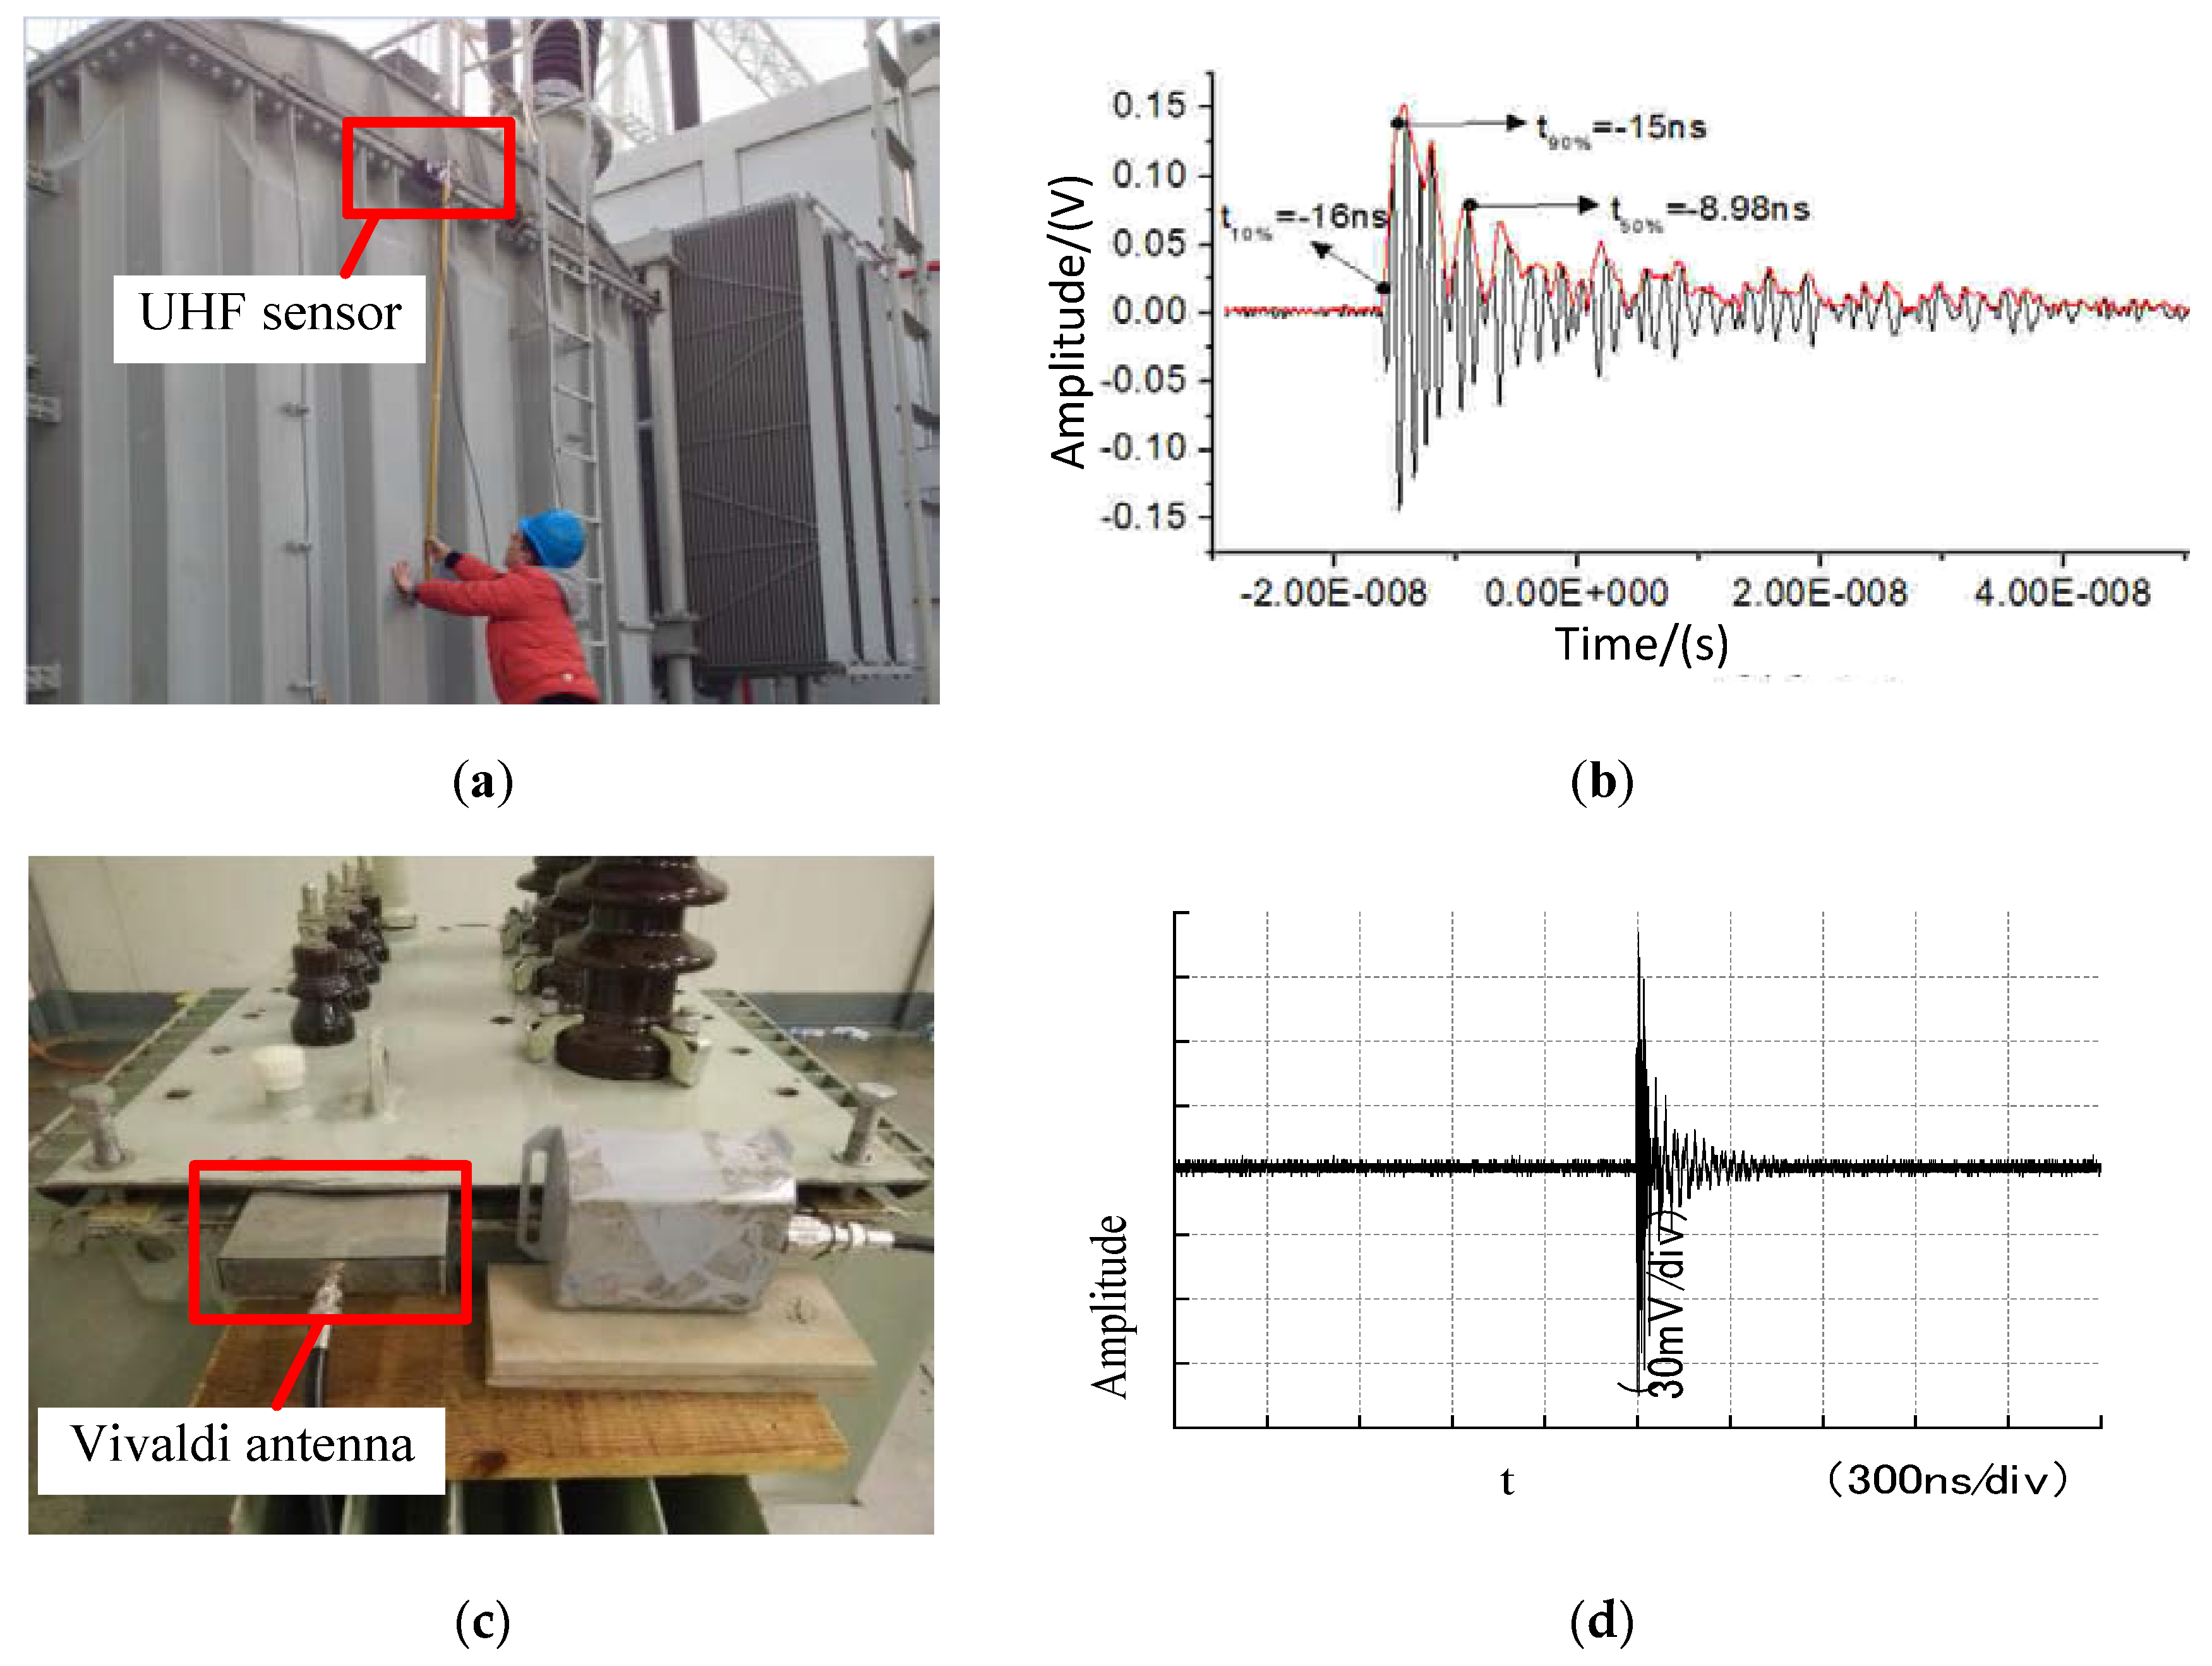
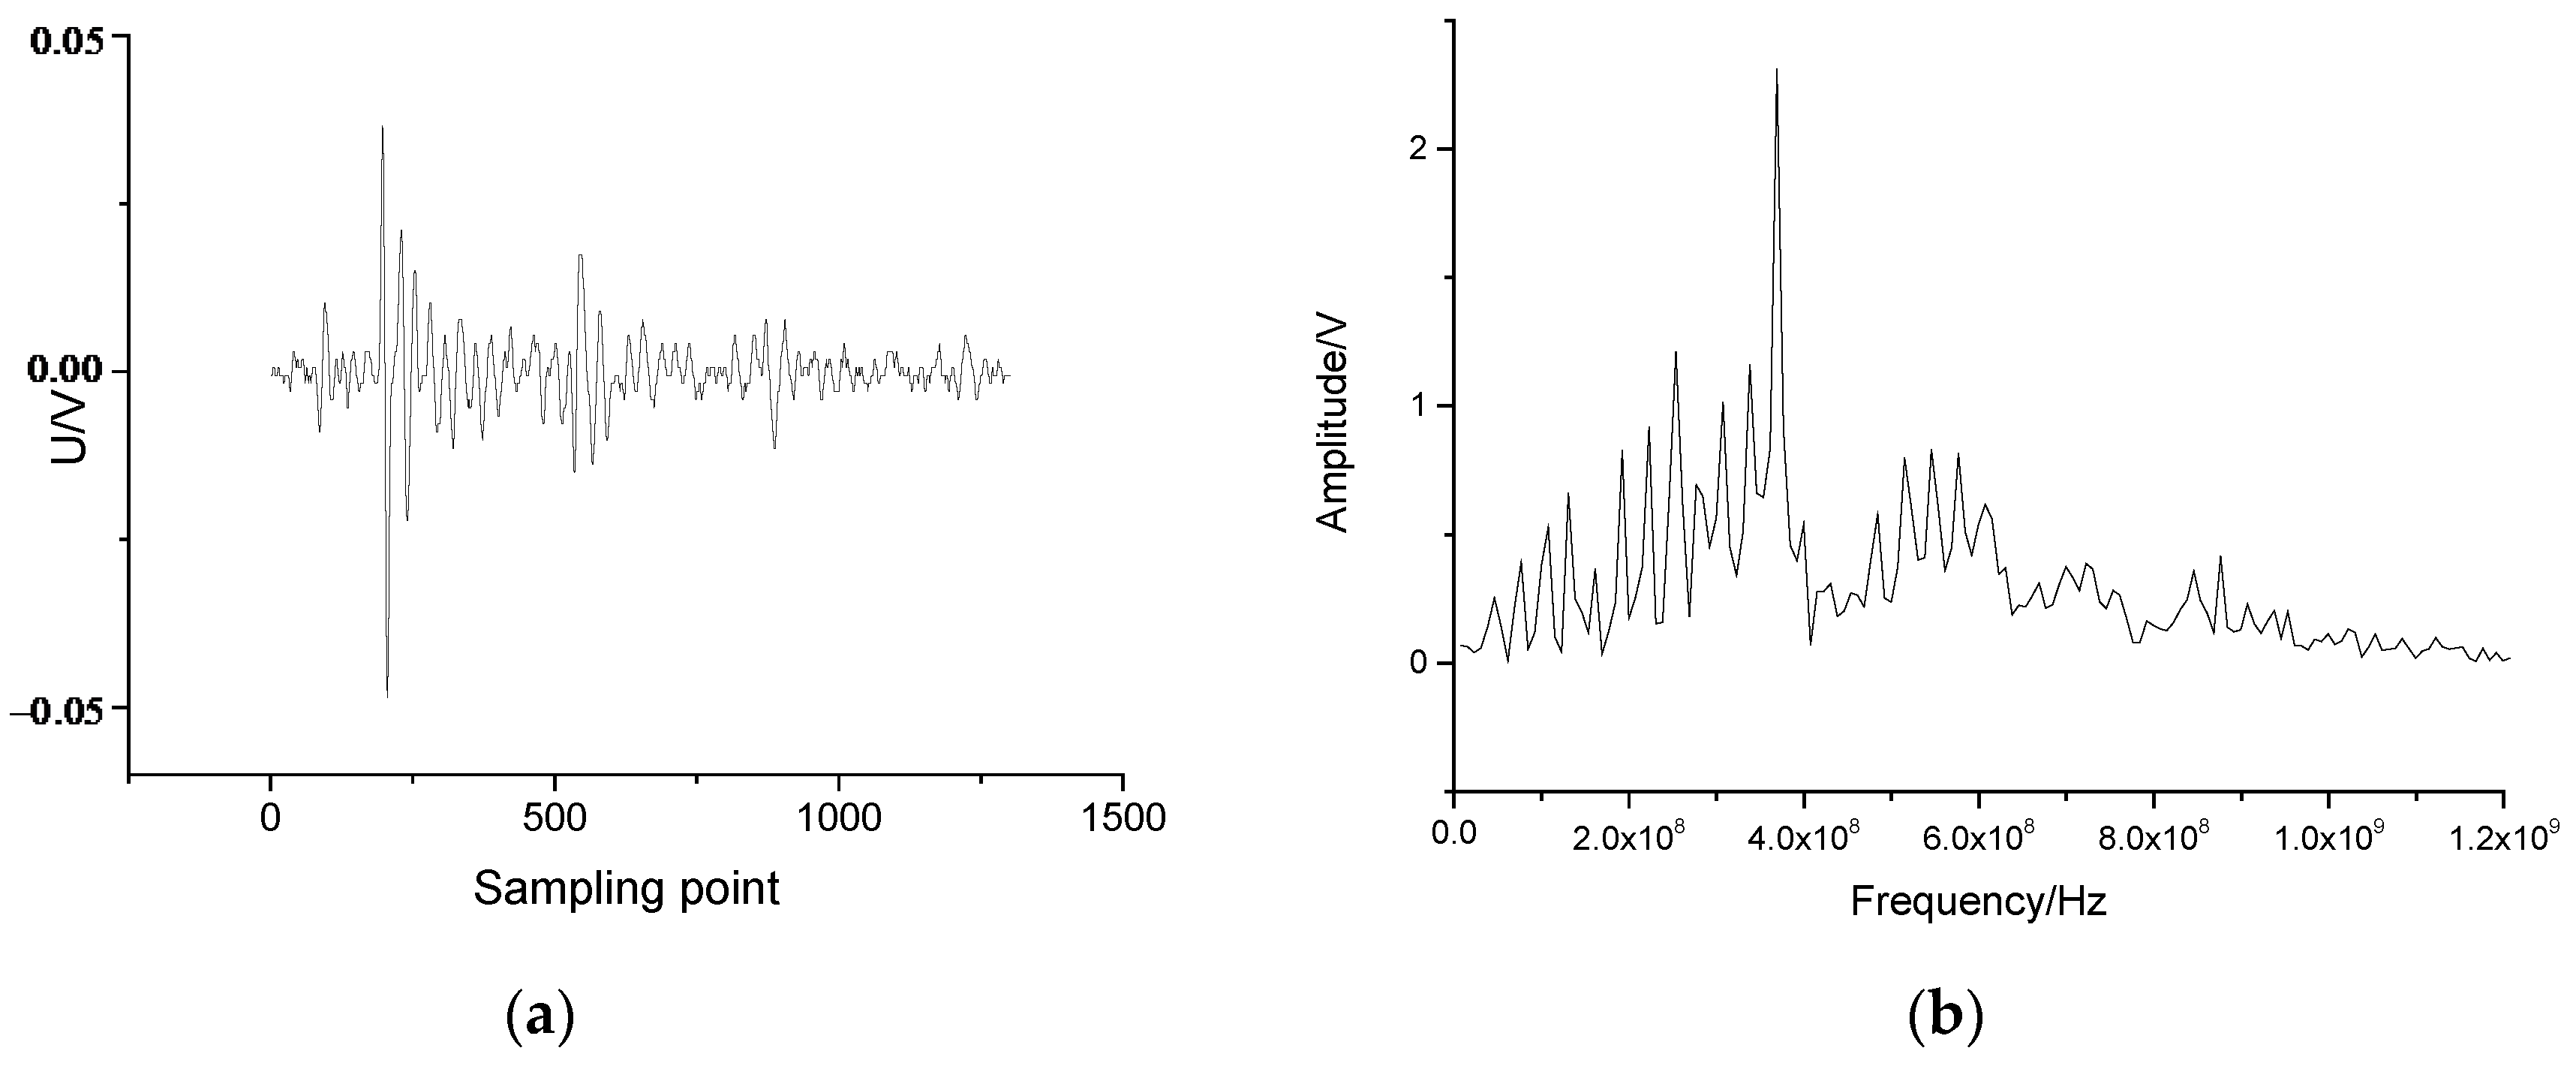
4.2. Analysis of Experimental Results
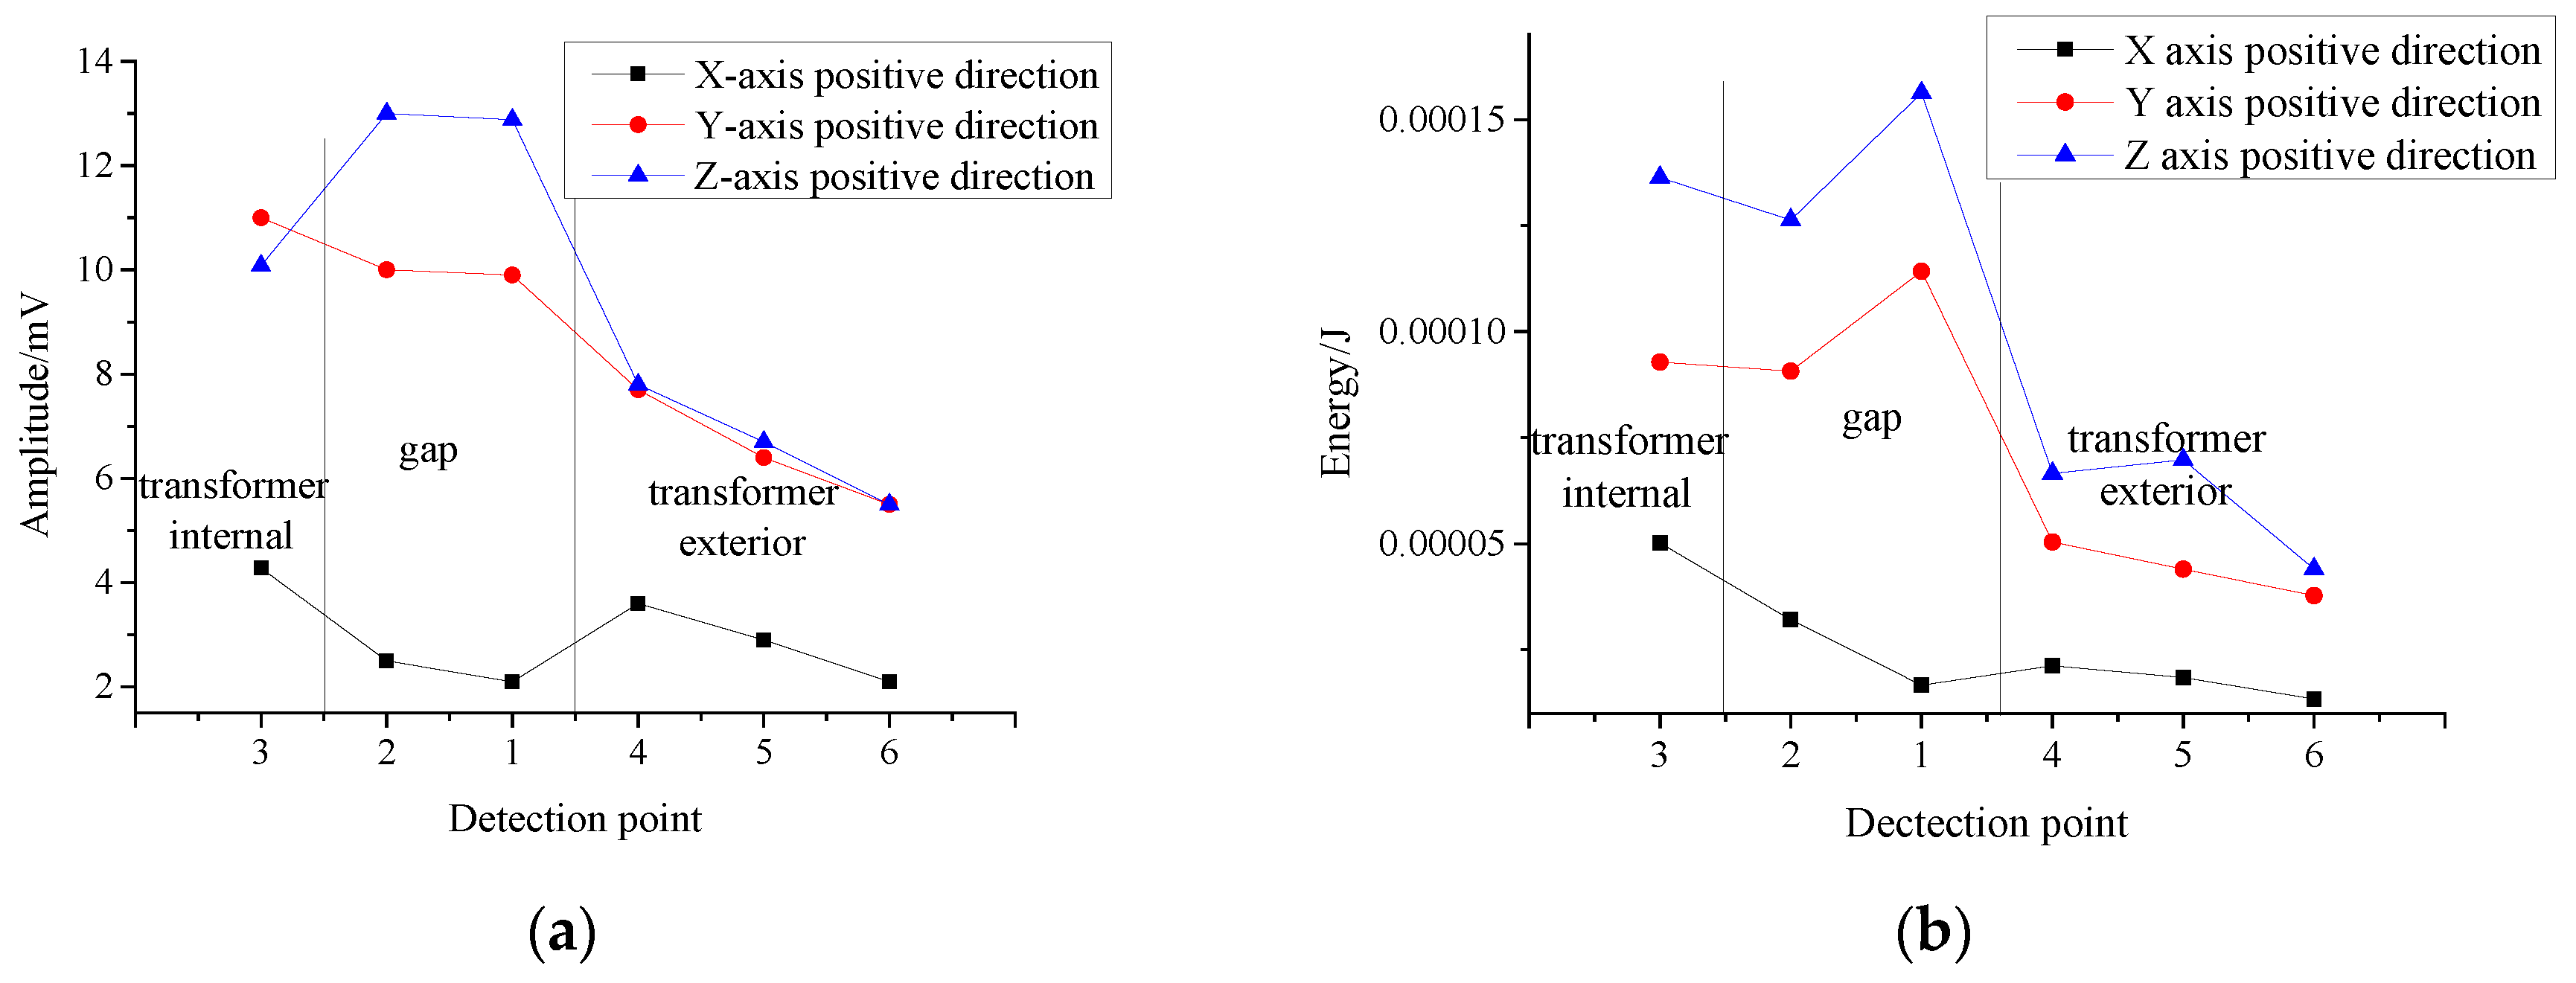
(1)
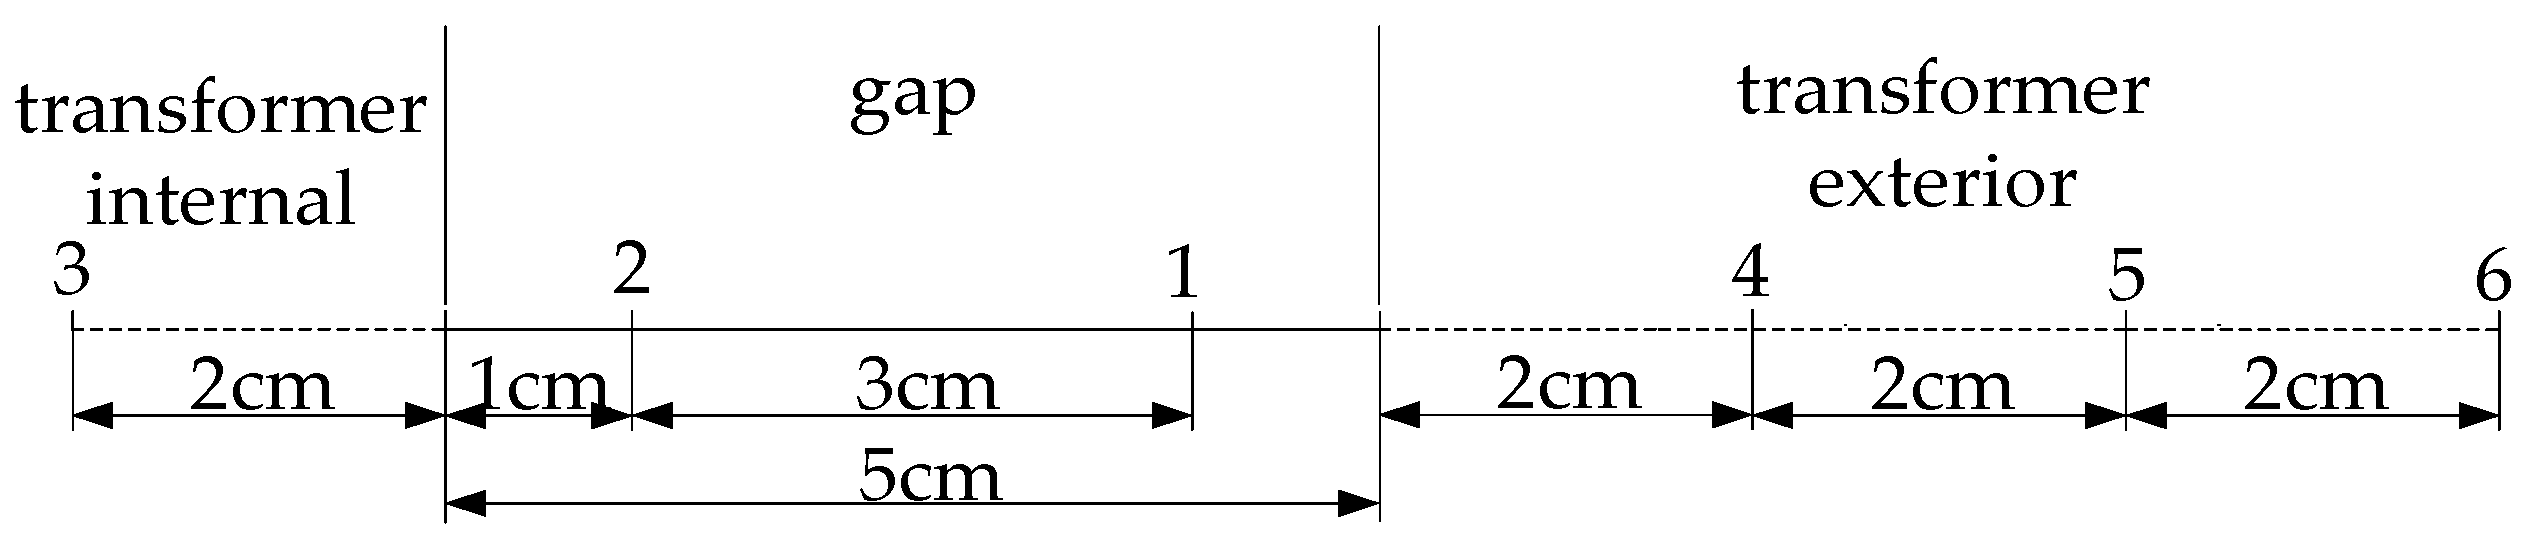
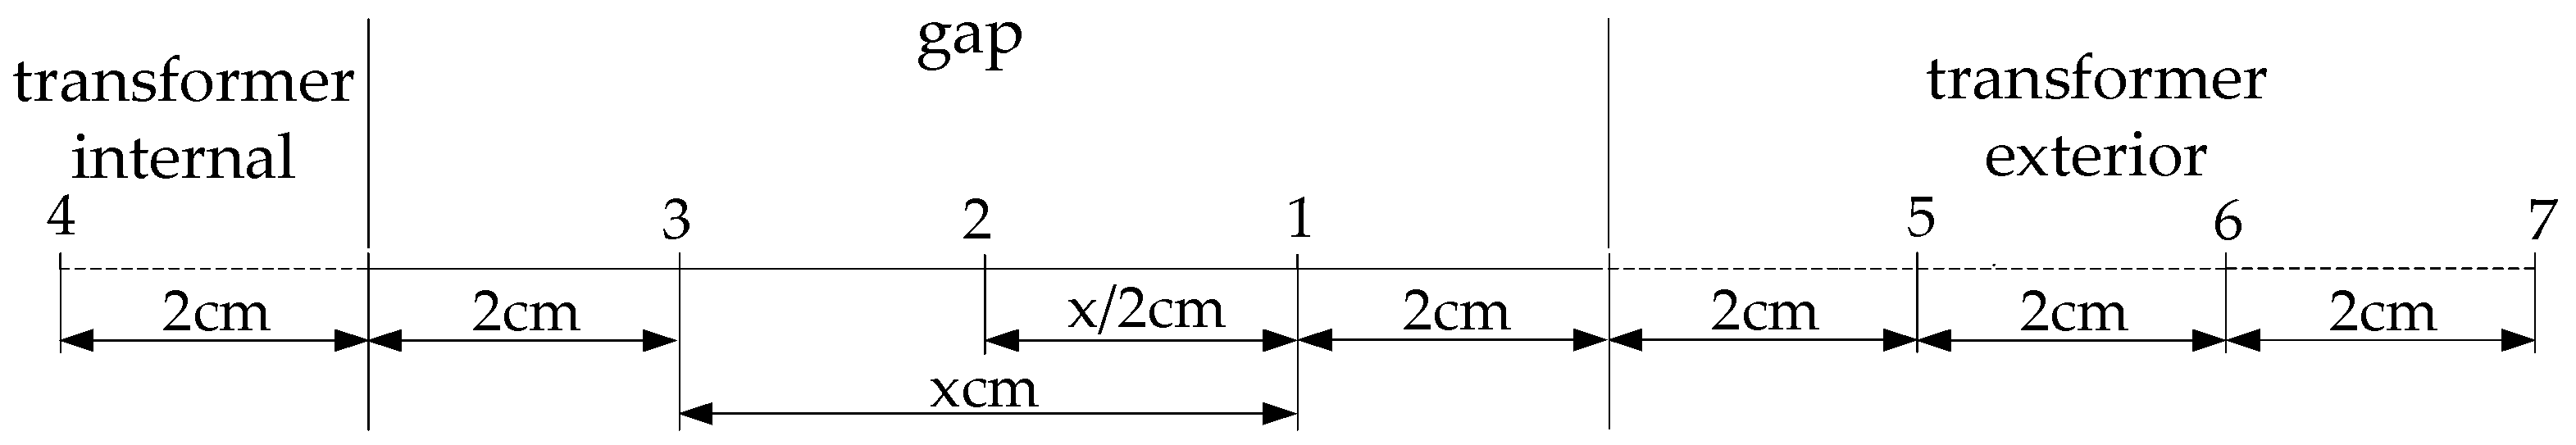
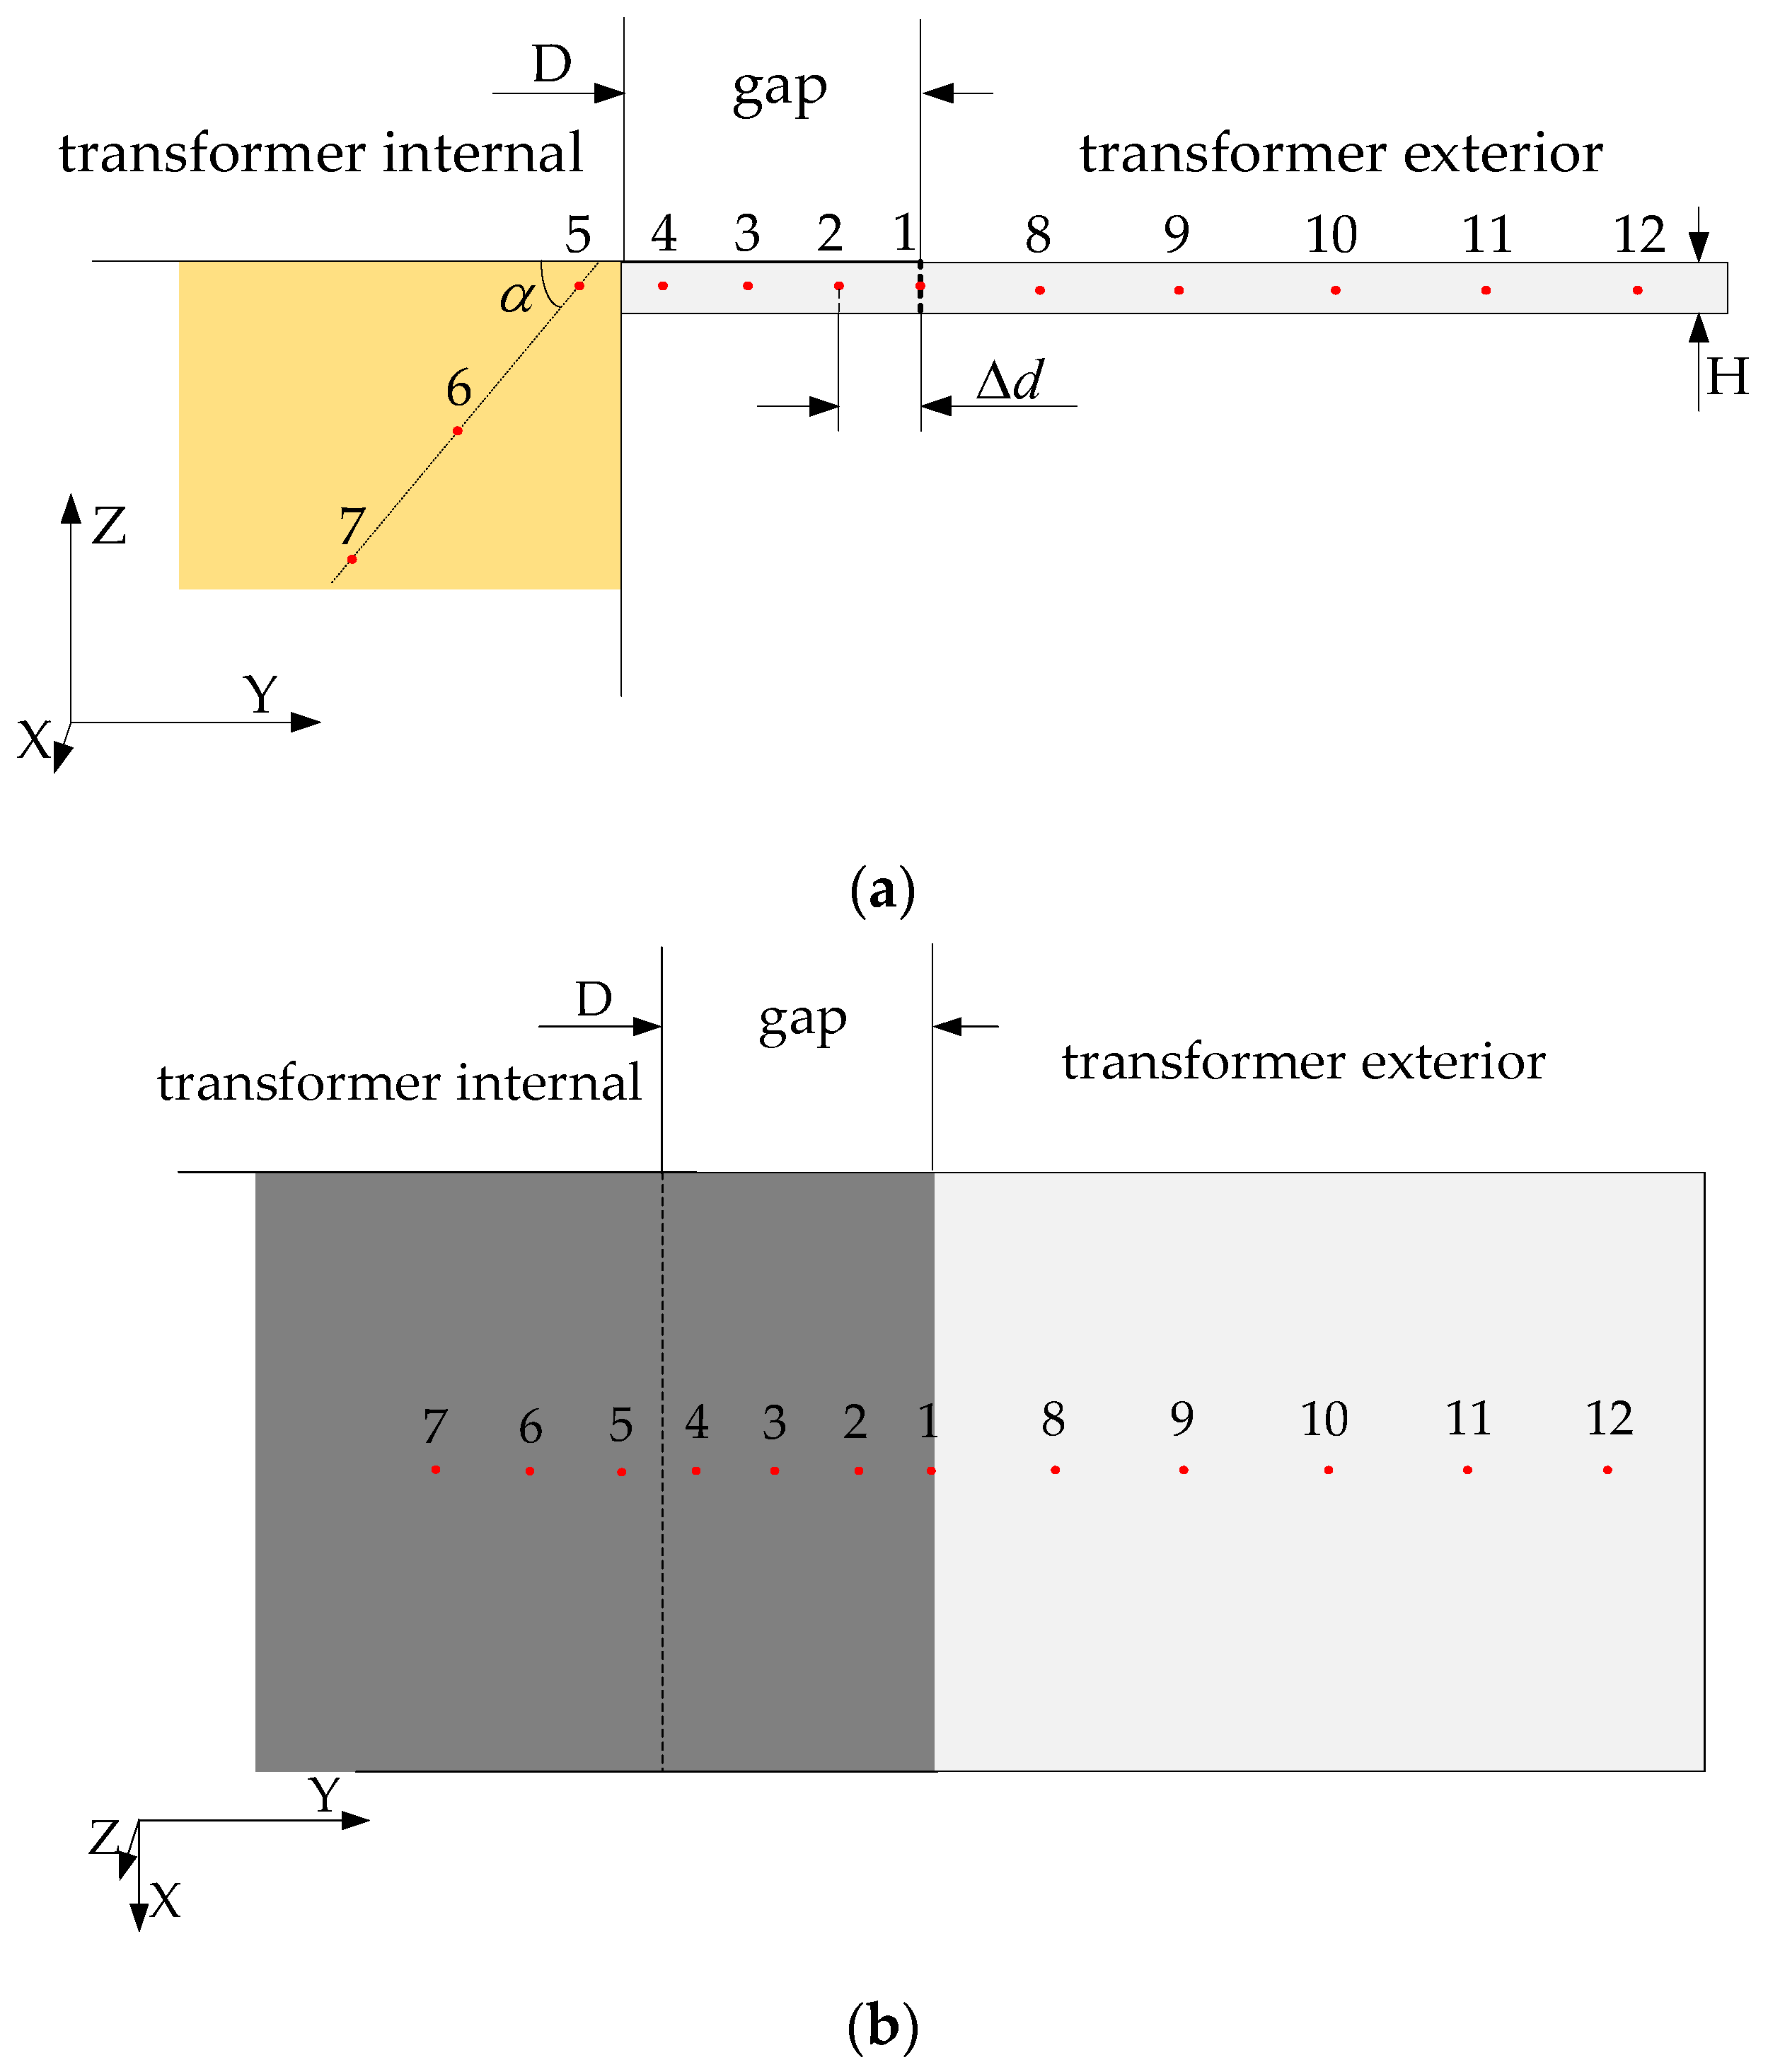
When the transformer gap is 3 cm high and 5 cm deep, Figure 16 shows the layout of detection points in the experiment, where detection point Nos. 1–2 are located in the gap and the distance between the adjacent detection points is 2 cm. Detection point No. 3 is located in the transformer internal, and the distance from the tank wall is 2 cm. Detection point Nos. 4–6 are located in the transformer exterior, and the distance between adjacent detection points is 2 cm.
The signal source is adjusted to X-, Y-, and Z-axis positive directions separately. The electromagnetic wave signal is obtained according to the detection point layout in Figure 16. Figure 17 exhibits the experimental results.
Figure 17 illustrates that, inside the gap, the intensity of the electromagnetic wave radiated by PD source in different directions is significantly different. The intensity of the electromagnetic wave radiated by the PD source, which is in Y- and Z-axis positive directions, is considerably larger than that of X-axis positive direction. In the propagation process of electromagnetic wave from gap to transformer exterior, the intensity of electromagnetic wave radiated by PD source in Y- and Z-axis positive directions, suddenly decreased. And the intensity change of the electromagnetic wave radiated by the PD source in X-axis positive direction is not evident. Therefore, in the gap detection of transformer PD electromagnetic wave signal, inserting the antenna sensor into the transformer gap will considerably improve the detection sensitivity. Each of the four gaps of transformer is required to be set with an antenna sensor to achieve full range and a high-sensitivity detection of the electromagnetic wave. This conclusion is consistent with that of the simulation results shown in Figure 10.
(2)
When the transformer gap is 5 cm deep and the PD source is oriented in Z-axis positive direction, the gap heights are 4, 3, and 2 cm separately. In addition, the electromagnetic wave signal is obtained according to the detection point layout in Figure 16. Figure 18 shows the experimental results.
Figure 18 depicts that, inside the gap, the intensity of electromagnetic wave shows an increasing trend with the decrease of gap height. In the transformer exterior, the amplitude of electric field gradually diminishes with the decrease of gap height. Moreover, the variation law of the cumulative energy is affected by the accumulated energy inside the gap. Owning to the limitation of the monopole antenna size, the propagation characteristics of the electromagnetic wave in the smaller height gaps cannot be experimentally verified. However, the conclusion drawn in the experiment is consistent with that of the simulation results shown in Figure 12.
(3)
On the basis of ensuring the operability of the experiment, the gap height is set to be 2 cm, the partial discharge source is oriented in Z-axis positive direction, the gap depths are 18, 14, 10, and 6 cm separately, and the electromagnetic wave signals are obtained according to the detection point layout in Figure 19. Figure 20 depicts the experimental results.
Figure 20 illustrates that the propagation characteristics of electromagnetic waves in different depth gaps in the experiment are slightly different from the propagation characteristics of the electromagnetic wave in simulation experiment shown in Figure 13. In consideration of the existence of experimental errors, the following conclusions can still be drawn from the experimental results. Inside the gap, the intensity of the electromagnetic wave shows a gradually increasing trend with the decrease of gap depth. In addition, the intensity of electromagnetic wave has an increasing trend at the tail of gap.

5. Conclusions

This study analyzed the gap propagation characteristics of electromagnetic wave radiated by the PD source in different directions and the influence of gap size, which were then experimentally verified. The following conclusions are obtained:
(1)
The intensity of the PD electromagnetic wave inside the gap is significantly greater than that in the transformer exterior. Therefore, in the gap detection of transformer PD electromagnetic wave signals, inserting the antenna sensor into transformer gap will considerably improve the detection sensitivity.
(2)
Inside the gap, the difference of electromagnetic wave intensity radiated by PD source in different directions is significantly large. Therefore, each of the four gaps of transformer is required to be set with an antenna sensor to achieve full range and a high-sensitivity detection of the electromagnetic wave.
(3)
The gap height will affect the propagation of electromagnetic wave in the transformer gap. In the reasonable range of the gap height of the transformer, the intensity of the electromagnetic wave shows an increasing trend inside the gap with the decrease of gap height.
(4)
Inside the gap, the intensity of the electromagnetic wave shows a gradually increasing trend with the decrease of gap depth. Moreover, the intensity of electromagnetic wave has an increasing trend at the tail of gap. The antenna sensor should be placed in the entrance or the tail area of transformer gap and try to avoid the middle and back sections of transformer gap as much as possible.

Acknowledgments

The authors gratefully acknowledge the support of the National High-Tech Research and Development Plan of China (Grant No. 2015AA050204).

Author Contributions

Xiaoxing Zhang conceived and designed the experiments; Guozhi Zhang, Yalong Li, Jian Zhang performed the experiments; Xiaoxing Zhang, Guozhi Zhang and Rui Huang analyzed the data; Xiaoxing Zhang and Guozhi Zhang wrote the paper.

Conflicts of Interest

The authors declare no conflict of interest.

References

  1. Siegel, M.; Beltle, M.; Tenbohlen, S.; Coenen, S. Application of UHF sensors for PD measurement at power transformers. IEEE Trans. Dielectr. Electr. Insul. 2017, 24, 331–339. [Google Scholar] [CrossRef]
  2. Chen, J. Detection and location of partial discharge in power transformers based on dielectric windows and UHF sensors. Power Syst. Technol. 2014, 38, 1676–1680. [Google Scholar]
  3. Jung, J.R.; Hwang, K.R.; Kim, Y.M.; Lyu, E.T.; Yang, H.J. Sensitivity verification and application of UHF sensor for partial discharge measurement in high voltage power transformer. In Proceedings of the IEEE International Conference on Condition Monitoring and Diagnosis, Bali, Indonesia, 23–27 September 2012. [Google Scholar]
  4. Judd, M.D.; Farish, O.; Pearson, J.S.; Hampton, B.F. Dielectric windows for UHF partial discharge detection. IEEE Trans. Dielectr. Electr. Insul. 2001, 8, 953–958. [Google Scholar] [CrossRef]
  5. Judd, M.D.; Yang, L.; Hunter, I.B. Partial discharge monitoring of power transformers using UHF sensors. Part I: Sensors and signal interpretation. IEEE Electr. Insul. Mag. 2005, 21, 5–14. [Google Scholar] [CrossRef]
  6. Ishak, A.M.; Ishak, M.T.; Jusoh, M.T.; Dardin, S.S.; Judd, M.D. Design and optimization of UHF partial discharge sensors using FDTD modeling. IEEE Sens. J. 2017, 17, 127–133. [Google Scholar] [CrossRef]
  7. Ouyang, X.D.; Ke, C.J.; Yang, X. Theoretical analysis of impact to detection sensitity for installation mode of UHF sensors in transformer PD Test. Transformer 2014, 5, 55–58. [Google Scholar]
  8. Yang, L.; Judd, M.D.; Costa, G. Simulating propagation of UHF signals for PD monitoring in transformers using the finite difference time domain technique. In Proceedings of the 17th Annual Meeting of the IEEE Lasers and Electro-Optics Society, Boulder, CO, USA, 20 October 2004. [Google Scholar]
  9. Wang, S.; Zhao, X.H.; Fang, X.M.; Li, Y.M.; Li, Y.M. UHF signal external detection of partial discharge in transformer. High Volt. Eng. 2007, 33, 88–91. [Google Scholar]
  10. Li, J.; Si, W.; Yang, J.; Yuan, P.; Li, Y. Propagation characteristic of partial discharge ultra high frequency signals outside transformer. J. Xi’an Jiaotong Univ. 2008, 6, 718–722. [Google Scholar]
  11. Zheng, S.S. Location of Partial Discharges in Transformer Windings by Using UHF Method. Ph.D. Thesis, North China Electric Power University, Beijing, China, 2015. [Google Scholar]
  12. Zhang, J.; Zhang, X.; Xiao, S. Antipodal vivaldi antenna to detect UHF signals that leaked out of the joint of a transformer. Int. J. Antennas Propag. 2017, 7, 1–13. [Google Scholar] [CrossRef]
  13. Xu, B.; Wang, J.; Li, Y.M. Emulational study on propagation of UHF signal emitted by PD in transformers. High Volt. Appar. 2007, 43, 244–247. [Google Scholar]
  14. Putro, W.A.; Nishigouchi, K.; Khayam, U.; Kozako, M.; Hikita, M.; Urano, K.; Min, C. Sensitivity verification and determination of the best location of external UHF sensors for PD measurement in GIS. In Proceedings of the 2012 IEEE International Conference on Condition Monitoring and Diagnosis, Bali, Indonesia, 23–27 September 2012. [Google Scholar]
  15. Wang, M. Geometrical Diffraction Theory; Northwest Telecommunication Engineering Institute Press: Xi’an, China, 1985. [Google Scholar]
  16. Wang, N. Modern Uniform Geometrical Theory of Diffraction; Xidian University Press: Xi’an, China, 2011; pp. 64–69. [Google Scholar]
  17. Ersoy, O.K. Diffraction, Fourier Optics and Imaging; China Machine Press: Beijing, China, 2015; pp. 35–47. [Google Scholar]
  18. Boggs, S.A.; Stone, G.C. Fundamental limitations in the measurement of corona and partial discharge. IEEE Trans. Electr. Insul. 1982, EI-17, 143–150. [Google Scholar] [CrossRef]
Figure 1. Schematic of transformer gap: (a) Gap of top lid and tank and (b) Gap of tank and pedestal.
Energies 10 01531 g001
Figure 2. Gap detection of PD UHF signal in the field and in the laboratory: (a) Sensors installed in the gap of the high voltage reactor in the field; (b) Signals by UHF sensor installed in the gap of the high voltage reactor in the field; (c) Vivaldi antenna placed in the gap of transformer in the laboratory; (d) Signals by the Vivaldi antenna placed in the gap of transformer in the laboratory.
Energies 10 01531 g002
Figure 3. Schematic diagram of straight edge diffraction geometry.
Energies 10 01531 g003
Figure 4. Schematic diagram of incidence of electromagnetic wave in transformer gap entrance.
Energies 10 01531 g004
Figure 5. Schematic diagram of electromagnetic wave in transformer gap exit.
Energies 10 01531 g005
Figure 6. Simulation model.
Energies 10 01531 g006
Figure 7. Layout of the detection point: (a) X-axis positive view; (b) Z-axis positive view.
Energies 10 01531 g007
Figure 8. Gaussian pulse.
Energies 10 01531 g008
Figure 9. Radiation pattern of monopole antenna: (a) Radiation pattern ( ϕ   =   0 ° ); (b) Radiation pattern ( θ   =   0 ° ).
Energies 10 01531 g009
Figure 10. Distributions of electromagnetic signals radiated by PD source in different directions: (a) Amplitude distribution; (b) Energy distribution.
Energies 10 01531 g010
Figure 11. Each gap of the transformer has an antenna sensor.
Energies 10 01531 g011
Figure 12. Distributions of PD electromagnetic signals in different height gaps: (a) Amplitude distribution; (b) Cumulative energy distribution.
Energies 10 01531 g012
Figure 13. Distributions of PD electromagnetic signals in different depth gaps: (a) Amplitude distribution; (b) Cumulative energy distribution.
Energies 10 01531 g013
Figure 14. Antenna sensor and pulse source: (a) Antenna sensor; (b) Pulse source.
Energies 10 01531 g014
Figure 15. Time-frequency signals received by Antenna sensor in air environment without transformer tank: (a) Signal in time domain; (b) Signal in frequency domain.
Energies 10 01531 g015
Figure 16. Layout of the detection point of experiment (transformer gap is high 3 cm and deep 5 cm).
Energies 10 01531 g016
Figure 17. Distributions of electromagnetic signals radiated by PD source in different directions in experiment: (a) Amplitude distribution; (b) Cumulative energy distribution.
Energies 10 01531 g017
Figure 18. Distributions of PD electromagnetic signals in different height gaps in experiment: (a) Amplitude distribution; (b) Cumulative energy distribution.
Energies 10 01531 g018
Figure 19. Layout of the detection point of experiment (transformer gap is (x + 4) cm high and 5 cm deep).
Energies 10 01531 g019
Figure 20. Distributions of PD electromagnetic signals in different depth gaps in experiment: (a) Amplitude distribution; (b) Cumulative energy distribution.
Energies 10 01531 g020

