Determining Coalbed Methane Production and Composition from Individual Stacked Coal Seams in a Multi-Zone Completed Gas Well

 and
and 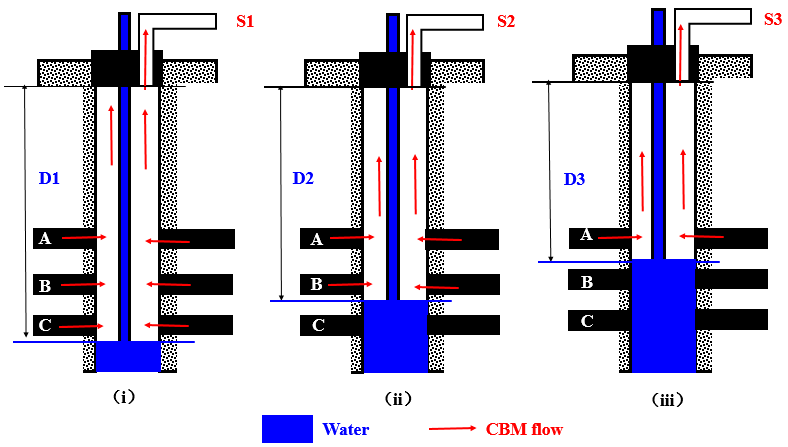
Abstract
:1. Introduction
2. Theory, Method, and Field Test
2.1. Theory
2.2. Method
2.3. Field Tests
3. Test Results
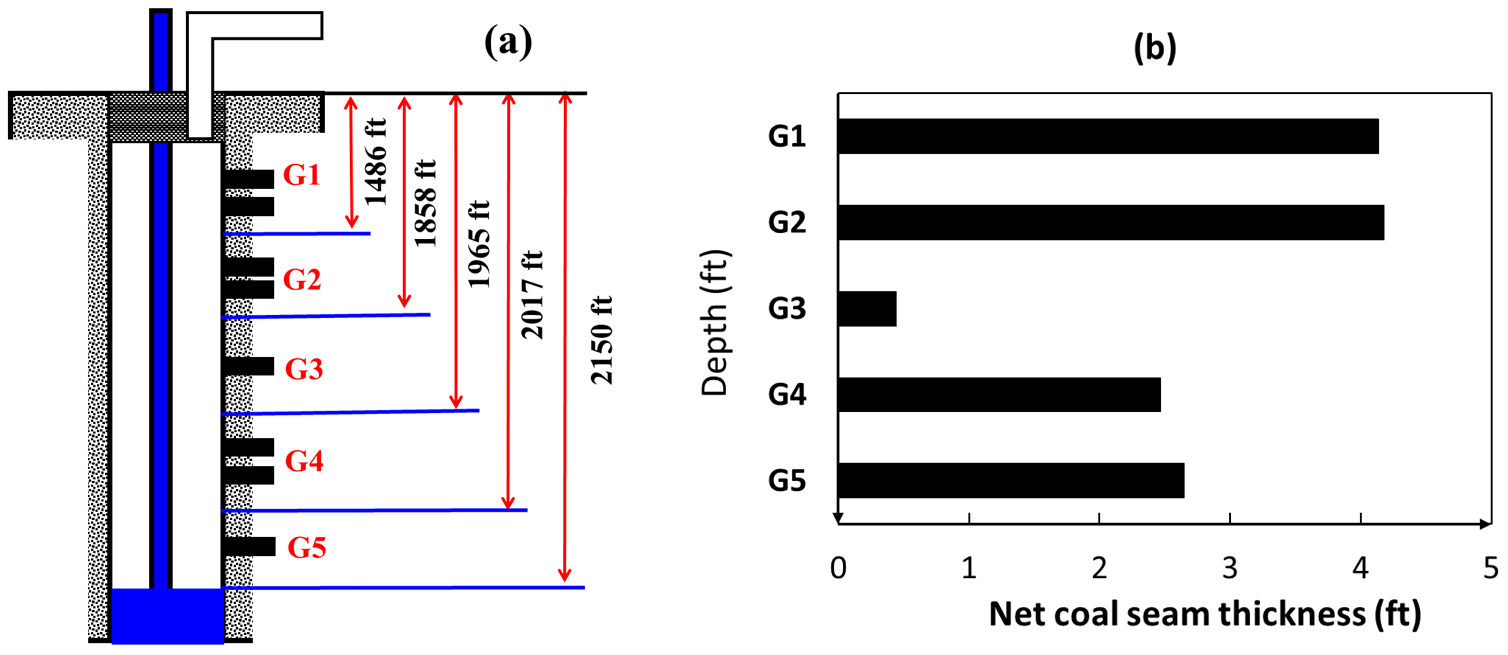
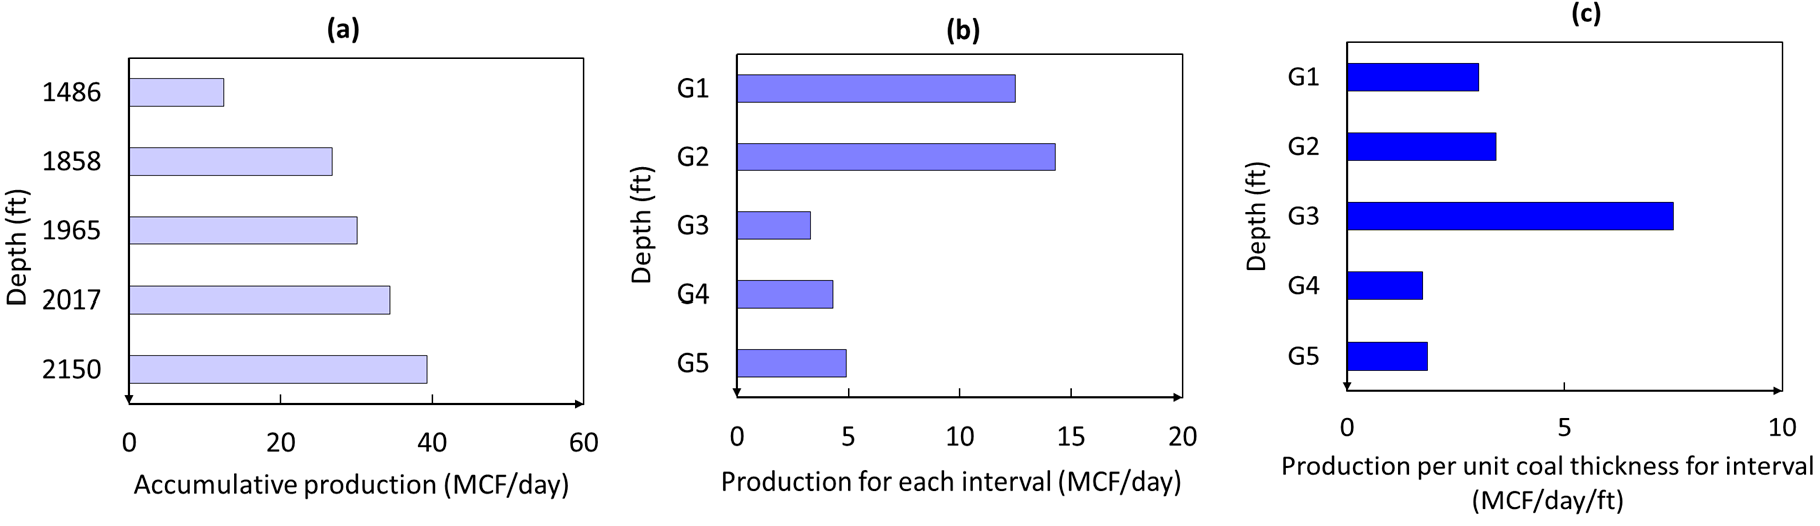
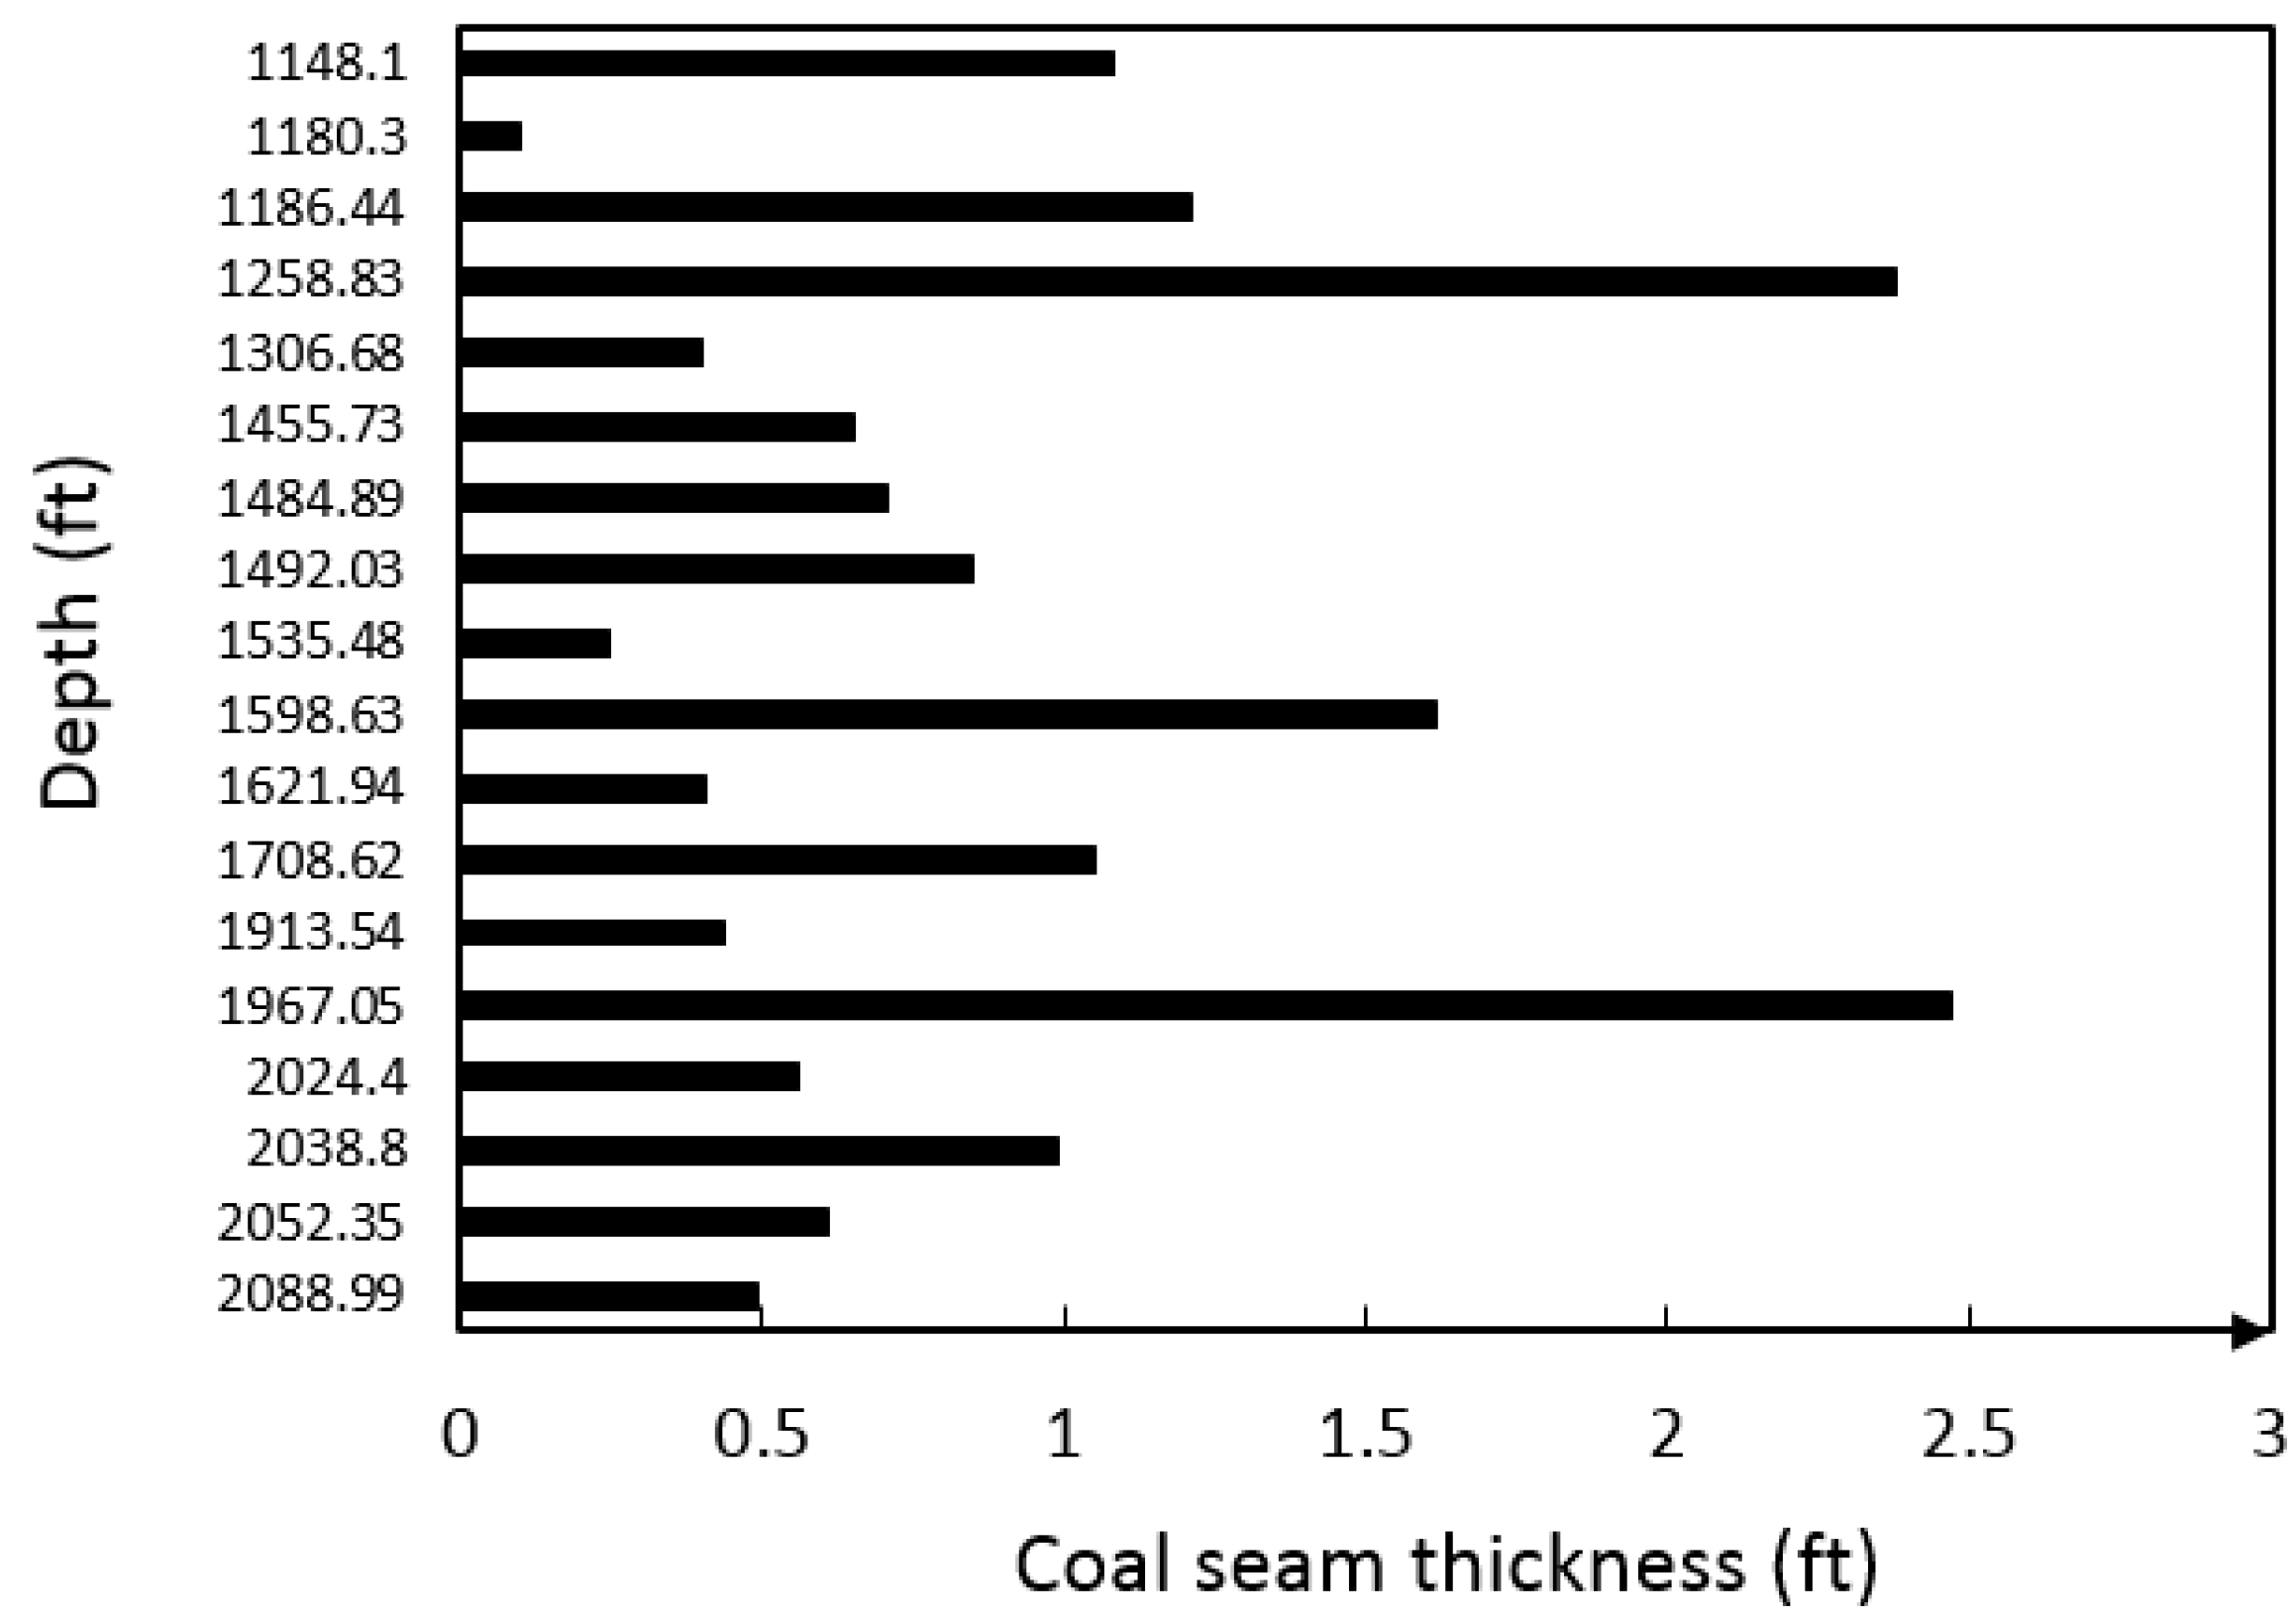
3.1. Covered Coal Seams and Production Behavior
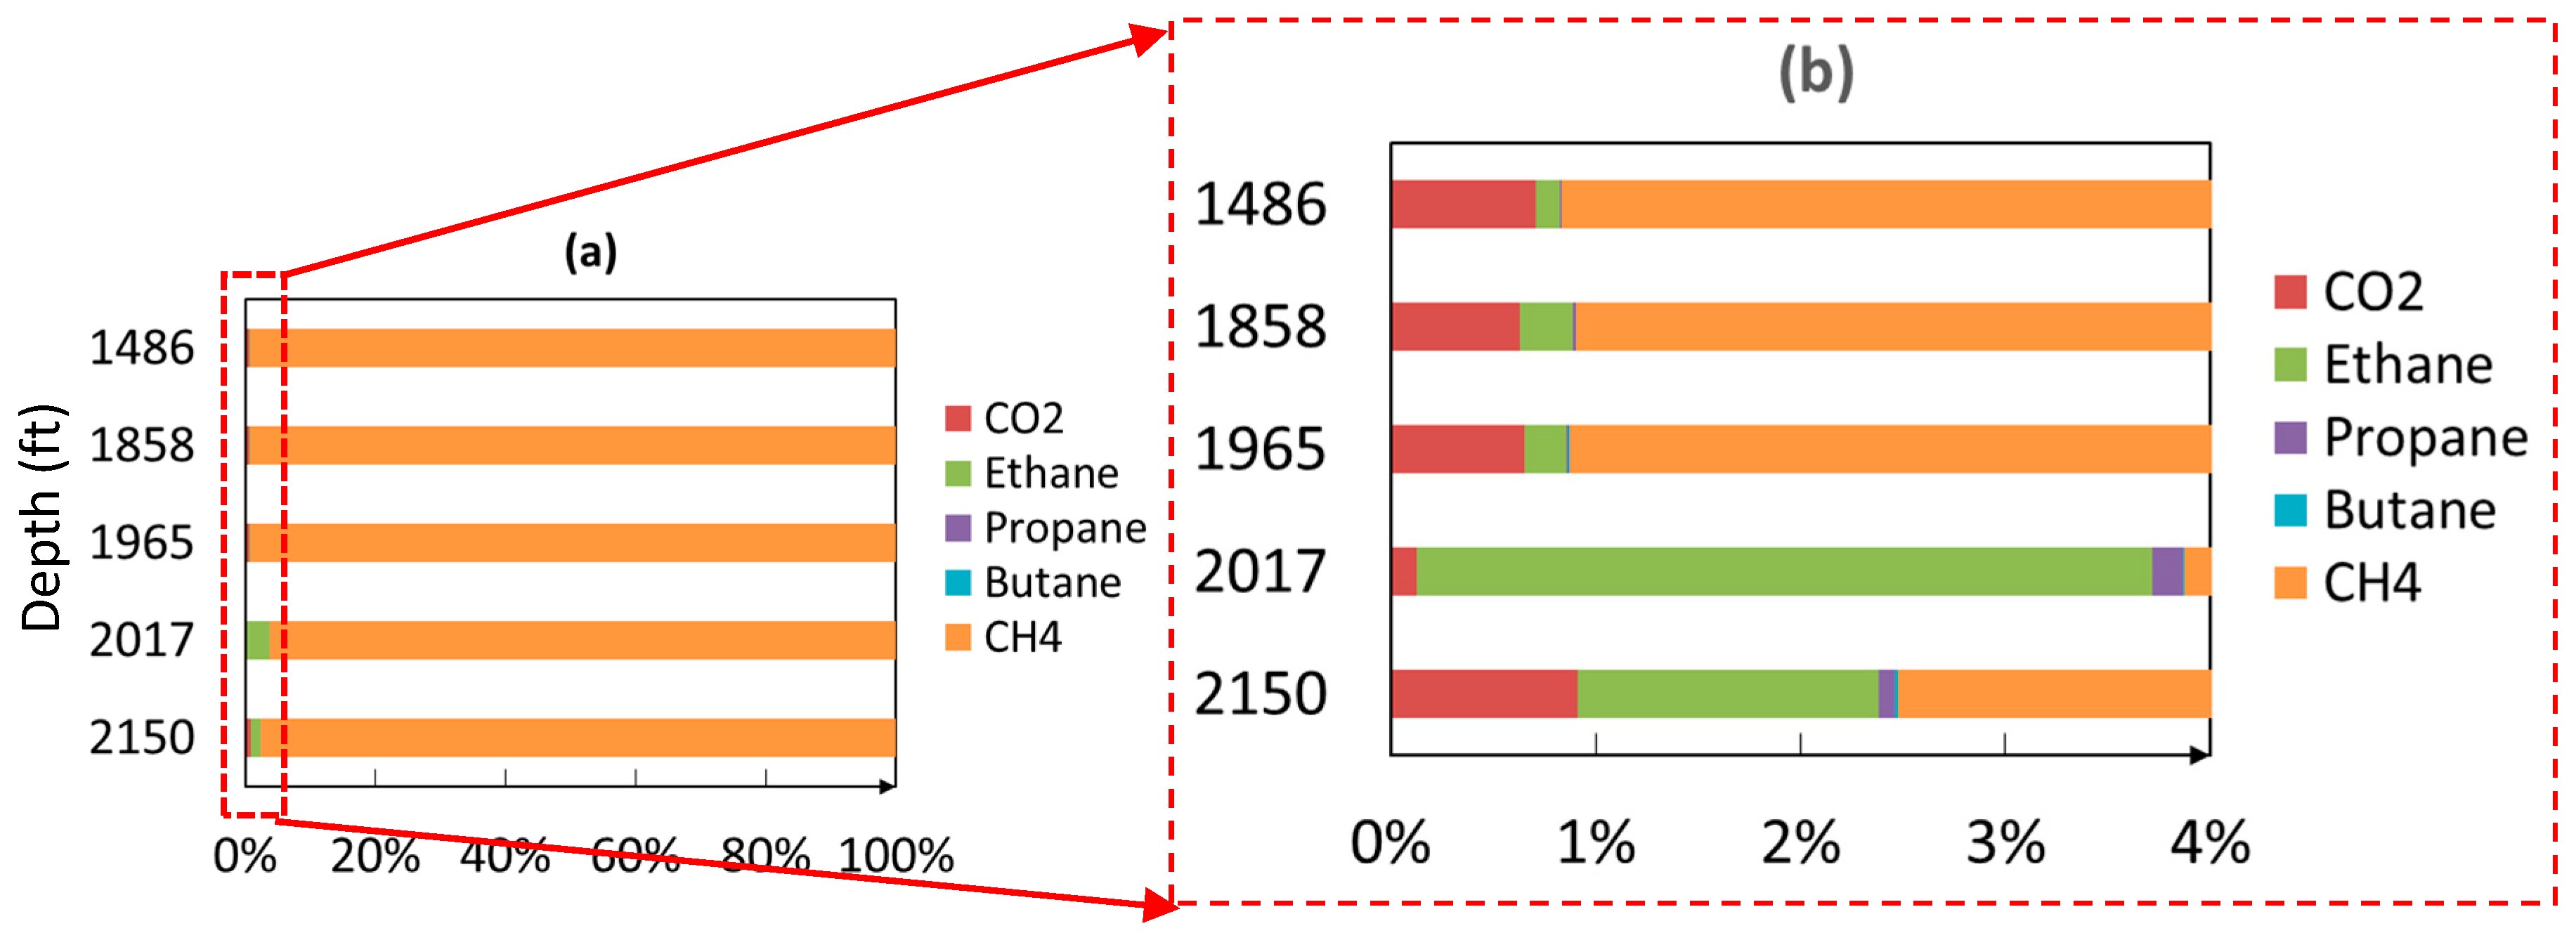
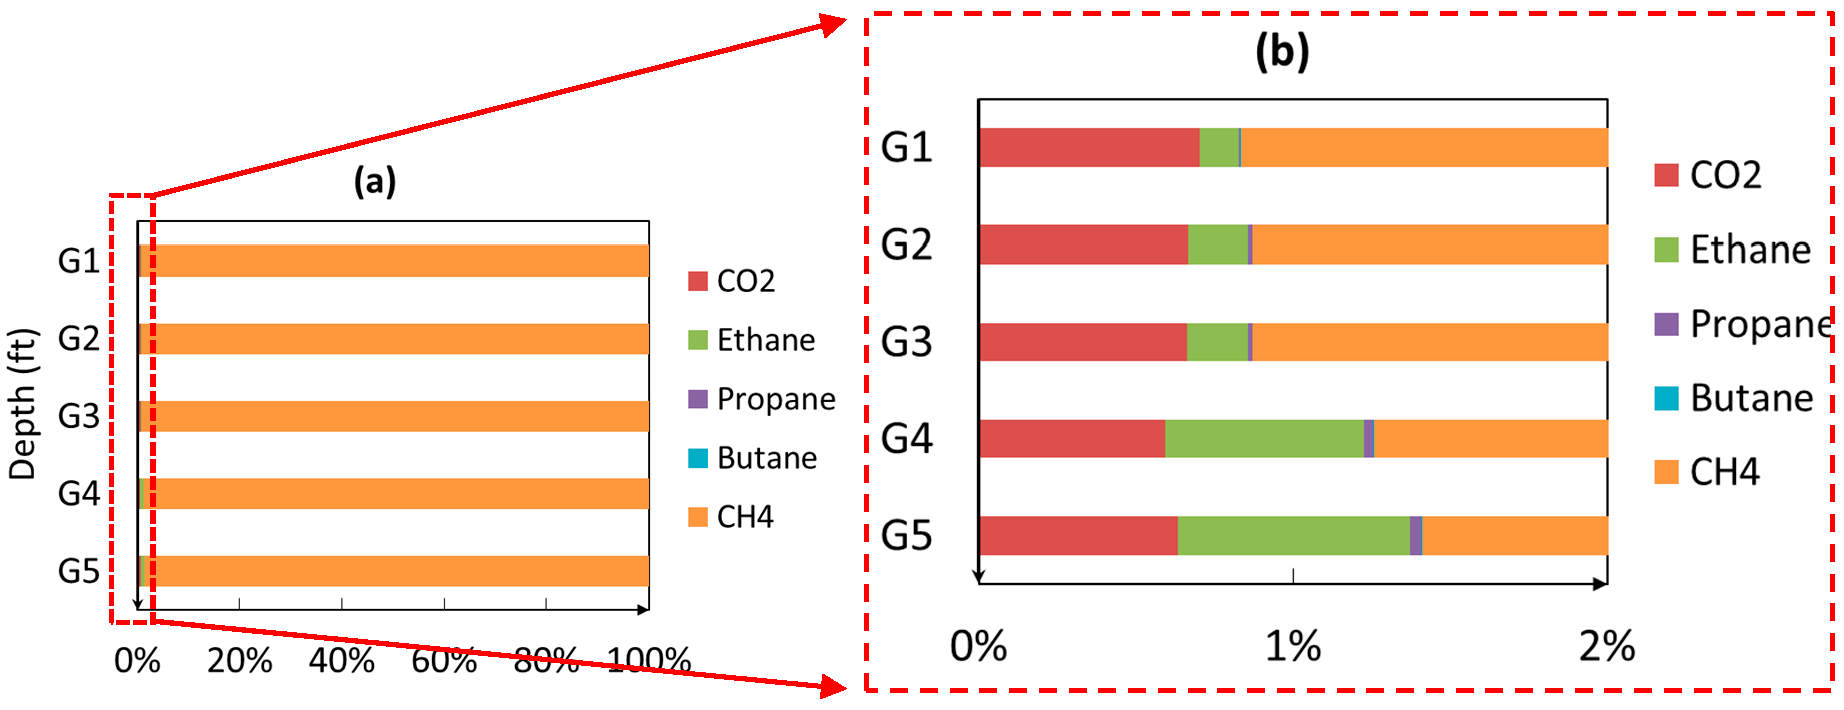
3.2. CBM Composition in Each Tested Group
4. Discussion and Outlook
Supplementary Materials
Acknowledgments
Author Contributions
Conflicts of Interest
References
- Nolde, J.E.; Spears, D. A preliminary assessment of in place coalbed methane resources in the Virginia portion of the central Appalachian Basin. Int. J. Coal Geol. 1998, 38, 115–136. [Google Scholar] [CrossRef]
- Kelafant, J.R.; Boyer, C.M.; Zuber, M.D. Production Potential and Strategies for Coalbed Methane in the Central Appalachian Basin. In Proceedings of the SPE Eastern Regional Meeting; Society of Petroleum Engineers: Charleston, West Virginia, USA, 1988. [Google Scholar]
- Zuber, M.D. Production characteristics and reservoir analysis of coalbed methane reservoirs. Int. J. Coal Geol. 1998, 38, 27–45. [Google Scholar] [CrossRef]
- Rodvelt, G.D.; Moyers, W.L.; Malamisura, R.; Hagy, C.; Greer, S. Case History: Recompletions in a Virginia Coalbed Methane Field Yields Additional Gas. In Proceedings of the SPE Eastern Regional Meeting; Society of Petroleum Engineers: Charleston, West Virginia, USA, 2009. [Google Scholar]
- Holditch, S.A.; Ely, J.W.; Semmelbeck, M.E.; Carter, R.H.; Hinkel, J.; Jeffrey, R.G., Jr. Enhanced recovery of coalbed methane through hydraulic fracturing. In Proceedings of the SPE Annual Technical Conference and Exhibition; Society of Petroleum Engineers: Charleston, West Virginia, USA, 1988. [Google Scholar]
- Rogers, R.E.; Ramurthy, K.; Rodvelt, G.; Mullen, M. Coalbed Methane: Principles and Practice (3rd Edition); Oktibbeha Publishing, LLC: Starkville, MS, USA, 2011. [Google Scholar]
- Seidle, J. Fundamentals of Coalbed Methane Reservoir Engineering; PennWell Books: Tulsa, OK, USA, 2011. [Google Scholar]
- Palmer, I.; Mansoori, J. How permeability depends on stress and pore pressure in coalbeds: A new model. In Proceedings of the SPE Annual Technical Conference and Exhibition; Society of Petroleum Engineers: Colorado Denver, CO, USA, 1996. [Google Scholar]
- Pashin, J.C. Variable gas saturation in coalbed methane reservoirs of the Black Warrior Basin: Implications for exploration and production. Int. J. Coal Geol. 2010, 82, 135–146. [Google Scholar] [CrossRef]
- Arri, L.E.; Yee, D.; Morgan, W.D.; Jeansonne, M.W. Modeling coalbed methane production with binary gas sorption. In Proceedings of the SPE Rocky Mountain Regional Meeting; Society of Petroleum Engineers: Casper, WY, USA, 1992. [Google Scholar]
- Clarkson, C.R.; Bustin, R.M.; Seidle, J.P. Production-data analysis of single-phase (gas) coalbed-methane wells. SPE Res. Eval. Eng. 2007, 10, 312–331. [Google Scholar] [CrossRef]
- Ripepi, N.S. Carbon Dioxide Storage in Coal Seams with Enhanced Coalbed Methane Recovery: Geologic Evaluation, Capacity Assessment and Field Validation of the Central Appalachian Basin. Ph.D. Thesis, Virginia Tech, Blacksburg, VA, USA, 2009. [Google Scholar]
- White, C.M.; Smith, D.H.; Jones, K.L.; Goodman, A.L.; Jikich, S.A.; LaCount, R.B.; Schroeder, K.T. Sequestration of carbon dioxide in coal with enhanced coalbed methane recovery a review. Energy Fuels 2005, 19, 659–724. [Google Scholar] [CrossRef]
- Gilliland, E.S.; Ripepi, N.; Conrad, M.; Miller, M.J.; Karmis, M. Selection of monitoring techniques for a carbon storage and enhanced coalbed methane recovery pilot test in the Central Appalachian Basin. Int. J. Coal Geol. 2013, 118, 105–112. [Google Scholar] [CrossRef]
- Grimm, R.P.; Eriksson, K.A.; Ripepi, N.; Eble, C.; Greb, S.F. Seal evaluation and confinement screening criteria for beneficial carbon dioxide storage with enhanced coal bed methane recovery in the Pocahontas Basin, Virginia. Int. J. Coal Geol. 2012, 90, 110–125. [Google Scholar] [CrossRef]
- Louk, K.; Ripepi, N.; Luxbacher, K.; Gilliland, E.; Tang, X.; Keles, C.; Michael, K. Monitoring CO 2 storage and enhanced gas recovery in unconventional shale reservoirs: Results from the Morgan County, Tennessee injection test. J. Nat. Gas Sci. Eng. 2017, 45, 11–25. [Google Scholar] [CrossRef]
- Ripepi, N.; Gilliland, E.; Michael, K. Central Appalachian Basin Unconventional (Coal/Organic Shale) Reservoir Small Scale CO2 Injection Test, Presentation. Available online: https://netl.doe.gov/research/proj?k=FE0006827&show=ppp (accessed on 28 September 2017).
- Gardes, R. Multi Seam Coal Bed/Methane Dewatering and Depressurizing Production System. U.S. Patent No. 6,923,275, 2 August 2005. [Google Scholar]
- McKee, C.R.; Bumb, A.C. Flow-testing coalbed methane production wells in the presence of water and gas. SPE Form. Eval. 1987, 2, 599–608. [Google Scholar] [CrossRef]
- Bang, J.; Mjaaland, S.; Solstad, A.; Hendriks, P.; Jensen, L.K. Acoustic gas kick detection with wellhead sonar. In Proceedings of the SPE Annual Technical Conference and Exhibition; Society of Petroleum Engineers: New Orleans, LA, USA, 1994. [Google Scholar]
- Schubert, J.J.; Wright, J.C. Early kick detection through liquid level monitoring in the wellbore. In Proceedings of the IADC/SPE Drilling Conference; Society of Petroleum Engineers: Dallas, TX, USA, 1998. [Google Scholar]
- Sarhosis, V.; Jaya, A.A.; Thomas, H.R. Economic modelling for coal bed methane production and electricity generation from deep virgin coal seams. Energy 2016, 107, 580–594. [Google Scholar] [CrossRef]


© 2017 by the authors. Licensee MDPI, Basel, Switzerland. This article is an open access article distributed under the terms and conditions of the Creative Commons Attribution (CC BY) license (http://creativecommons.org/licenses/by/4.0/).
Share and Cite
Ripepi, N.; Louk, K.; Amante, J.; Schlosser, C.; Tang, X.; Gilliland, E. Determining Coalbed Methane Production and Composition from Individual Stacked Coal Seams in a Multi-Zone Completed Gas Well. Energies 2017, 10, 1533. https://doi.org/10.3390/en10101533
Ripepi N, Louk K, Amante J, Schlosser C, Tang X, Gilliland E. Determining Coalbed Methane Production and Composition from Individual Stacked Coal Seams in a Multi-Zone Completed Gas Well. Energies. 2017; 10(10):1533. https://doi.org/10.3390/en10101533
Chicago/Turabian StyleRipepi, Nino, Kyle Louk, Joseph Amante, Charlies Schlosser, Xu Tang, and Ellen Gilliland. 2017. "Determining Coalbed Methane Production and Composition from Individual Stacked Coal Seams in a Multi-Zone Completed Gas Well" Energies 10, no. 10: 1533. https://doi.org/10.3390/en10101533
APA StyleRipepi, N., Louk, K., Amante, J., Schlosser, C., Tang, X., & Gilliland, E. (2017). Determining Coalbed Methane Production and Composition from Individual Stacked Coal Seams in a Multi-Zone Completed Gas Well. Energies, 10(10), 1533. https://doi.org/10.3390/en10101533