Article

Heating Performance Characteristics of High-Voltage PTC Heater for an Electric Vehicle

School of Mechanical Engineering, Yeungnam University, 280 Daehak-ro, Gyeongsan-si, Gyeongbuk 712-749, Korea
*
Author to whom correspondence should be addressed.
Energies 2017, 10(10), 1494; https://doi.org/10.3390/en10101494
Submission received: 31 August 2017 / Revised: 22 September 2017 / Accepted: 25 September 2017 / Published: 26 September 2017
(This article belongs to the Special Issue Thermal Energy Storage and Thermal Management (TESM2017))

Abstract

:
High-voltage positive temperature coefficient (PTC) heaters have a high heating capacity and are fast acting; thus, they function as the actual main heating equipment in electric cars, and considerable research is devoted to improving their heating performance and efficiency. We evaluated the heating performance of a high-voltage PTC heater for an electric car by building a closed-loop-type test system including an air channel, environment chamber, DC power supply, and data acquisition system, and designed an initial prototype with general characteristics. Using this test system, we analyzed the heating performance characteristics of the heater as a function of changes in the blower airflow, ambient temperature, and battery voltage. We changed the geometrical variables of the heater and conducted an analysis to improve the heating performance and output density of the initial prototype. Based on the heating performance of the initial prototype and its geometrical variables, we designed an improved prototype and compared its heating performance and output density with that of the initial prototype. As a result, we achieved a heating capacity of 5.52 kW, a pressure drop of 48.2 Pa, and an efficiency of 98%, whereas the output density was 3.45 kW/kg, which is a 24% improvement over the initial prototype.

1. Introduction

Carbon dioxide emission regulations due to global warming and the depletion of fossil fuels are causing a paradigm shift in the automotive industry from conventional internal combustion engine cars to eco-friendly vehicles such as electric cars. Considering the circumstances, electric cars in particular are considered as an optimal model for eco-friendly vehicles due to their high energy efficiency compared to cars powered by a conventional internal combustion engine and the fact that they emit almost no greenhouse gasses such as carbon dioxide [1,2,3,4]. However, unlike cars with conventional engines, the energy efficiency of electric cars is such that the small amount of waste heat produced by their power engines is insufficient for heating purposes. Thus, they require additional equipment as their main source of heating [5]. A considerable amount of research is being conducted on the main heating equipment for heating electric cars such as heat pumps and combustion heaters, but high-voltage positive temperature coefficient (PTC) heaters, capable of achieving the required heating capacity, efficiency, and reliability, are considered the most realistic alternative [6,7,8,9].
Automotive PTC heaters have been studied as auxiliary heating equipment to improve the efficiency of internal combustion engines and to supplement heat sources by reducing the radiant heat, and these PTC heaters have a heating performance below 1 kW [10,11,12]. However, as they became the main heating equipment in electric cars and their degree of importance was elevated, the need for PTC heaters with a heating capacity of 5 kW or more has arisen, and recently their voltage has increased to over 330 V as the voltage specifications of electric car batteries have increased. In the field of electric cars, where the distance that can be driven on a single charge is important, some studies have attempted to improve the efficiency of high-voltage PTC heaters, whereas others focused on reducing the size and weight of the high-voltage heaters by integrating their control centers [13,14,15].
Research on the heating performance of high-voltage PTC heaters for electric cars has mainly taken place under standard conditions with an air volume of 300 kg/h and an ambient temperature of 0 °C, but in the actual heating, ventilating, and air conditioning (HVAC) system of a car, the heater operates under a variety of conditions. Therefore, evaluations must take place under multiple conditions including changes in the inflow ambient temperature and airflow. In addition, it is necessary to study the weight as one of the important performance indicators of a high-voltage PTC heater for an electric car by considering the improvement in the driving distance on a single charge.
In this research, we constructed a system for testing the heating performance of a high-voltage PTC heater for electric cars, and designed a base model with the standard characteristics of high-voltage PTC heaters for electric cars. We investigated the heating performance of the base model under a variety of operating conditions including extreme conditions and created an improved design for a high-voltage PTC heater based on the results of the heating experiments with the base model and the results of the thermal flow analysis. The heating performance and output density of the improved heater were compared to those of the base model and their characteristics were analyzed.

2. Experiment Equipment and Methods

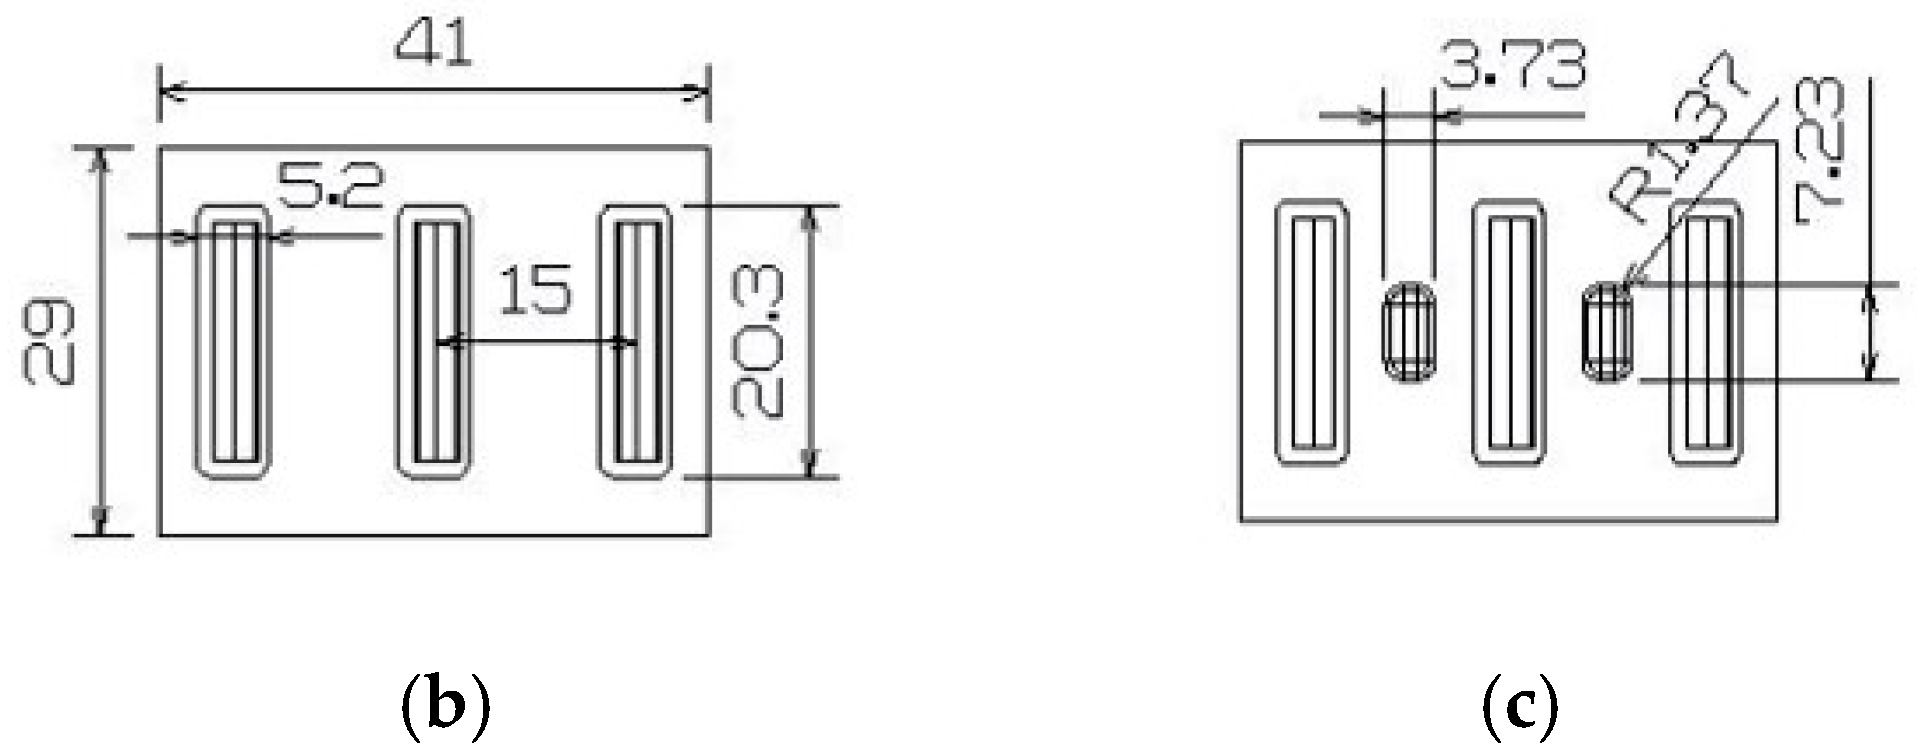
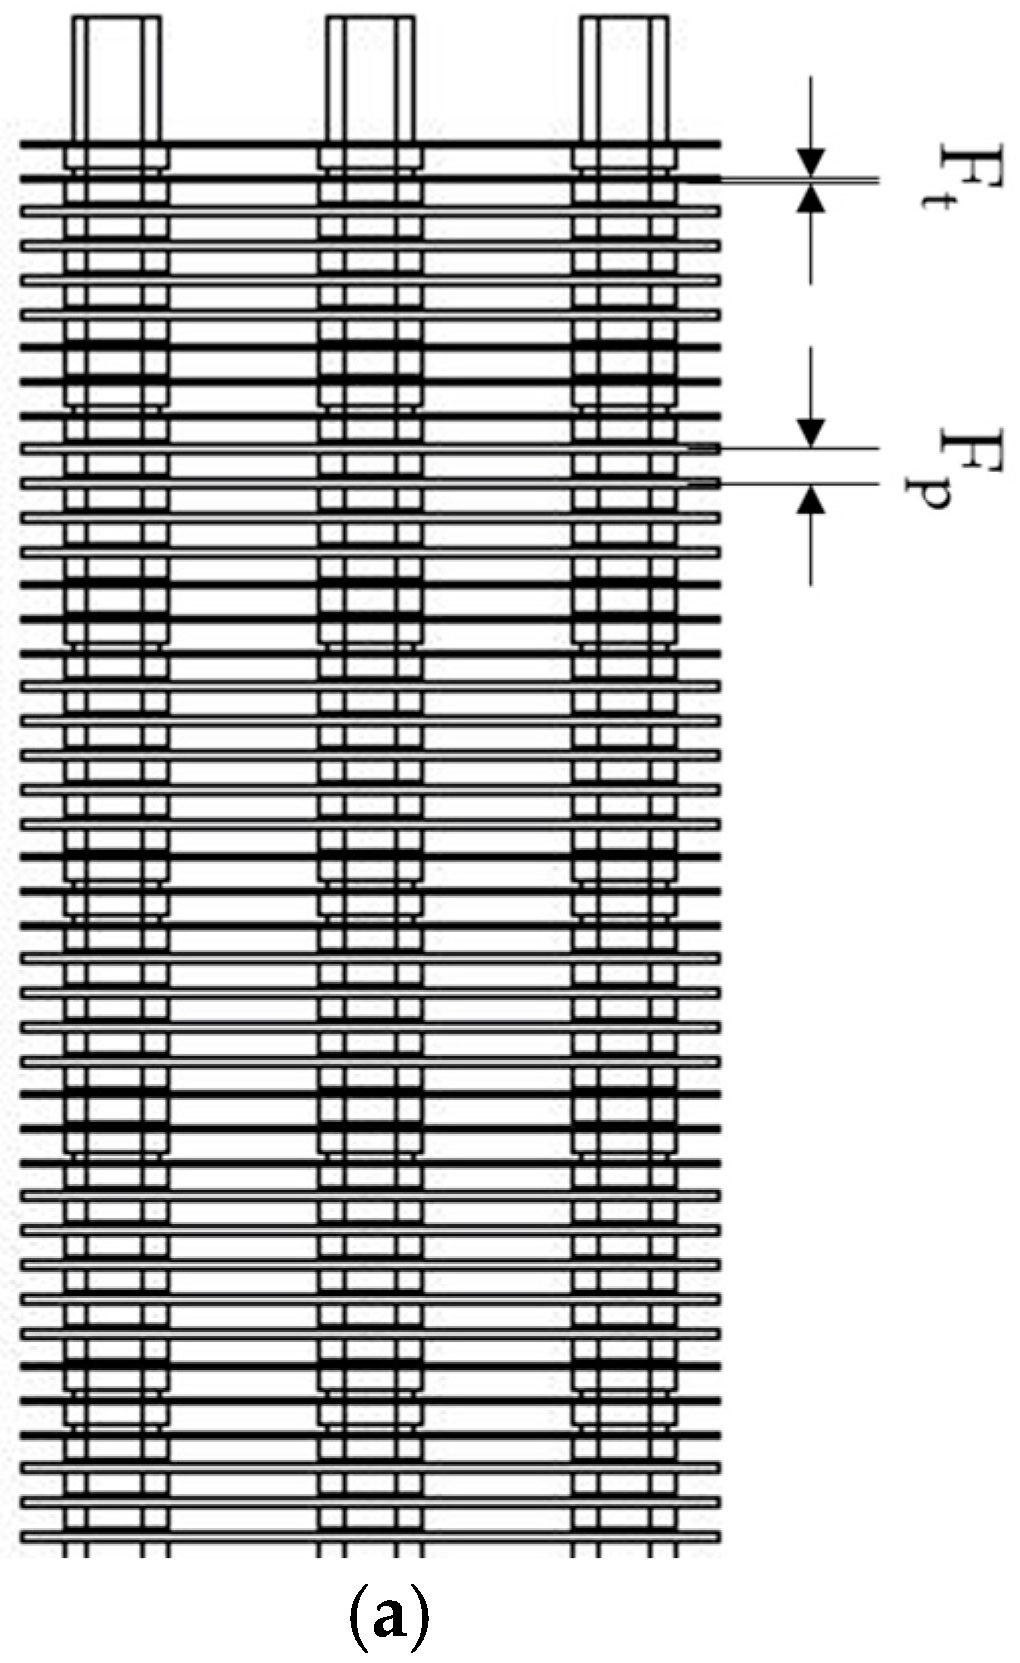
2.1. Heater Design Improvement

The high-voltage PTC heaters for electric cars used in this research is the controller integrated PTC heater with reduced weight and suitable for installation in the HVAC system of a car, as shown in Figure 1a. They are classified as Heater A and Heater B, where Heater A was designed based on the general properties of high-voltage PTC heaters used in existing electric cars. The total thermal resistance in a PTC heater, which determines its thermal transfer performance, can be divided into the internal thermal resistance of the heat rods of the PTC heater, the thermal resistance of the contact between the fins and the heat rods, and the thermal resistance of the airside. The airside thermal resistance is the most dominant factor among all of these, and Heater B used a design in which the structure of the radiation fins (fin shape, fin pitch, and fin thickness) was improved to reduce the thermal resistance of the airside. Heater A and Heater B were built with four modularized heat cores, with each heat core being composed of three heat rods and a radiation fin. Table 1 provides the detailed specifications of the PTC heaters used in the experiments. The entire size of the heater is determined by the heat cores, controller, and external housing. The size of the heater module is determined by excluding the controller and external housing from the entire size. The radiation fin of Heater A is a plate fin shape as shown in Figure 1b, and was designed to be bent on both ends and have a fixed 2.0 mm fin pitch. The fin thickness was designed to be 0.4 mm, and the heat transfer area is 501.1 mm2. As shown in Figure 1c, Heater B uses emboss-shaped radiation fins to ensure connection between the heat rods and the radiation fins during the construction process while at the same time allowing the use of the conventional plate fin process. Emboss-shaped radiation fins induce the formation of turbulence in the spaces between fins and disrupt laminar flow on the radiation fin surfaces to improve heat transfer performance while at the same time increasing the heat transfer area. The fin pitch was changed to 1.6 mm to increase the heat transfer area of the radiation fins, and the fin thickness was changed to 0.3 mm to reduce the pressure drop. The weight of the heater can be reduced by approximately 13% through this reduction in the fin thickness.

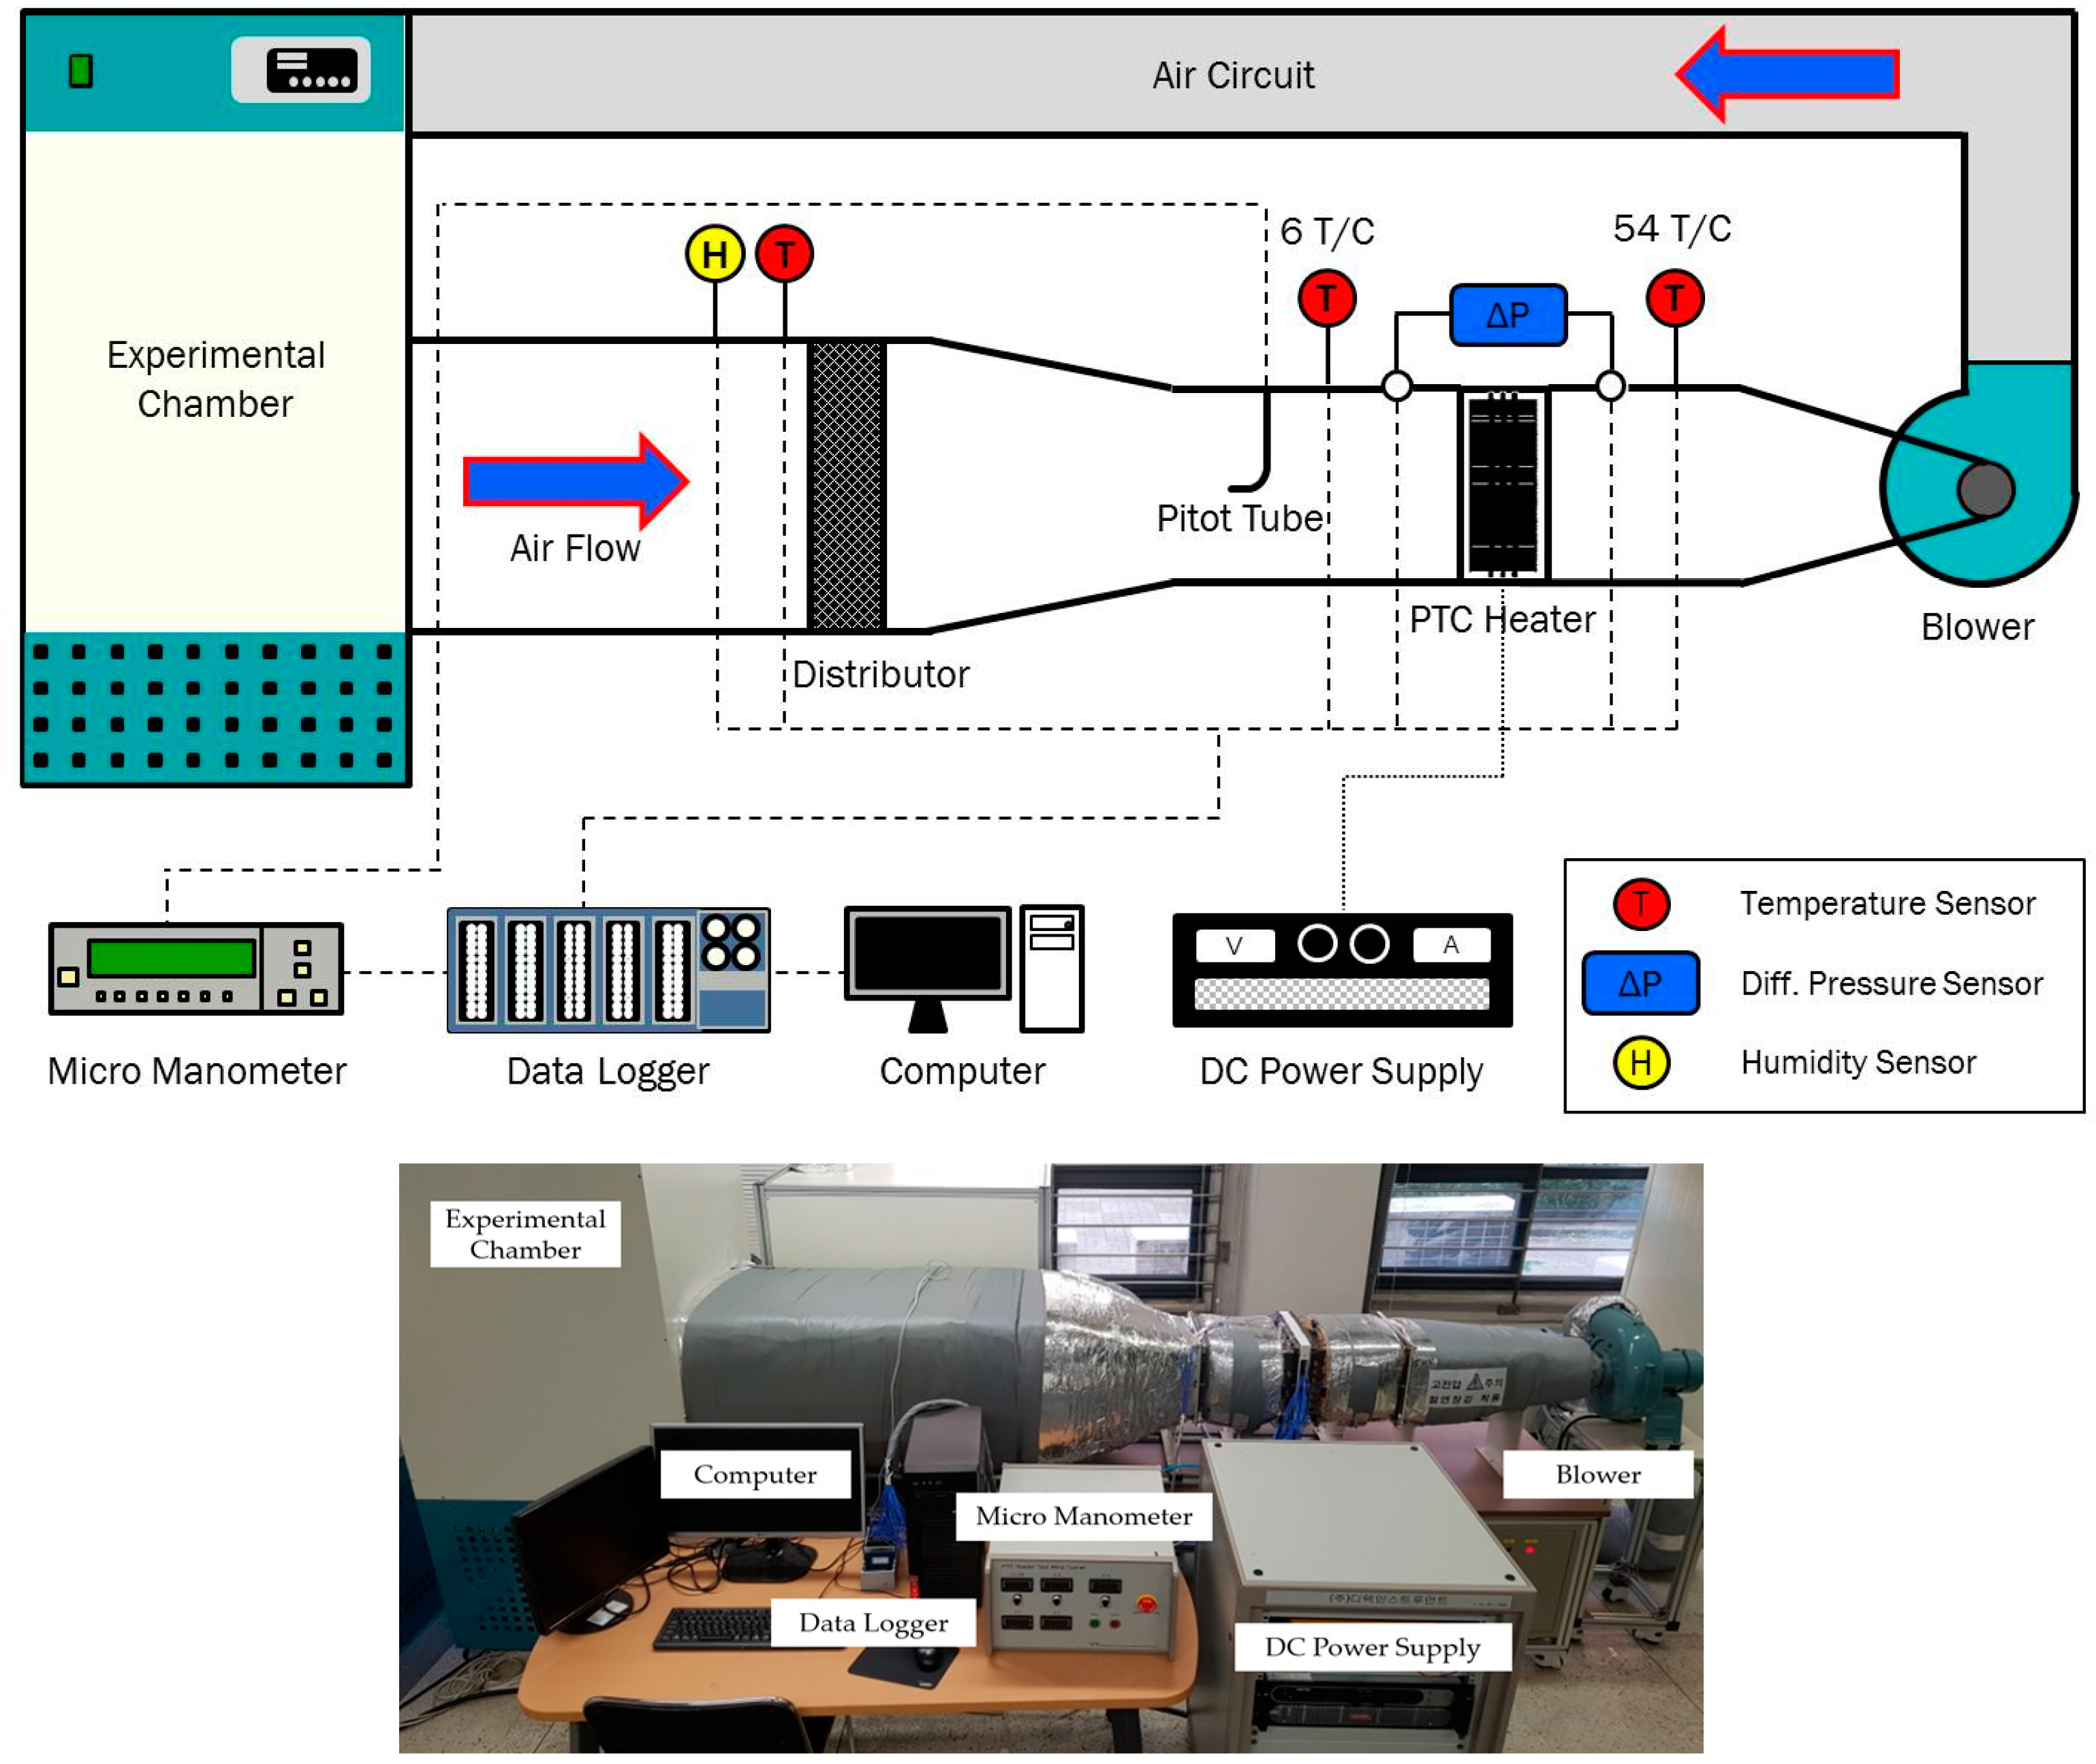
2.2. Experimental Equipment Setup

The experimental high-voltage PTC heater equipment, which was designed according to ASHRAE standards such as 37, 41.2, 51, contained as its main components an air channel system, environment chamber, DC power supply, and data acquisition system (DAQ). The equipment was designed to replicate the operating conditions and to gather data of the heating system in electric cars, as shown in Figure 2 [16]. We measured the heating performance of the heater by installing temperature, humidity, and pressure sensors. Table 2 lists the specifications of all the experimental equipment. The air channel system and the environment chamber are connected to each other to create a closed loop. The environment chamber creates a section where the flow is stagnant to minimize the temperature deviation in the experimental part of the PTC heater. A suction type was applied to construct an air channel system, and a honeycomb-shaped distributor was installed to minimize maldistribution of the flow. The air speed deviation within the air channel is ±1.0% at 1.5 m/s, and the turbulence coefficient is ±1.0% at 1.5 m/s. The blower, which simulates the airflow conditions in the HVAC system of an electric car uses a centrifugal fan with a maximum volumetric flow of 5 m3/min and is controlled by 3700 W, 220 V inverters. The airflow was measured by a micro-manometer connected to a Pitot tube installed in the internal center of the air channel, and it was calculated according to the CIPM-81/91 regulations of the CIPM (International Committee for Weights and Measures) [17]. The air pressure sensor for measuring the airflow had a measurement range of 600–1100 mb with a precision of ±0.25% at full scale (FS), and the temperature/humidity sensor had a temperature precision of ±0.25% at 0–50 °C, and a humidity measurement range of 0–100% with a precision of ±1.5% at 5–95% relative humidity. The temperature of the inlet flow and outlet flow passing through the PTC heater test section was measured with a K-type thermocouple with an error of ±0.1%. The front of this test section is fitted with six (array of 2 × 3) thermocouple meshes, whereas the rear contains 54 (array of 9 × 6) thermocouple meshes. The rear thermocouple mesh takes into account the radiant heat of the heat dissipation section, and it is located over 30 mm away from the heater surface at the output side of the heat dissipation section. The pressure drop was measured by recording the difference in pressure values measured at the four holes in the front and back of the heater test section. These holes were connected to the pressure sensors via tubes, and the pressure was measured as the average of the four holes. The measurement range of the pressure sensor was 0–124.42 Pa, and its accuracy was ±0.14% at full scale (FS). The power supply of the PTC heater is a 500 V/30 A high-voltage DC power supply, and it is measured and controlled using a computer via GPIB communication. A measurement program was created such that all of the data obtained as results in the experiments could be saved in the computer via a data logger and confirmed in real time.

2.3. Experiment Conditions and Methods

The experiments to assess the heating performance according to the operating conditions of the PTC heater can broadly be divided into three categories. We performed experiments on the changes in airflow according to the HVAC inflow conditions, with the changes in the temperature reflecting the operating conditions according to changes in the winter temperature, and changes in the rated voltage of the battery according to the model of electric car. The detailed conditions are provided in Table 3 [18]. When the PTC heater is started up, an inrush current higher than the normal operating current flows; hence, it is important to ensure electrical stability. The current that was measured in this experiment was considered stable if the measurement was below ±0.05 A. During normal operation, it was considered satisfactory if the mean temperature difference between the data of the previous minute and the next minute was less than ±0.1 °C and the mean pressure and flow changes were within ±5%. Generally, it took 30 to 40 min to arrive at the normal operating state. Once this state was reached, data were gathered at 1-s intervals for more than 10 min and the average values were calculated and used as the result data.
We selected the heating capacity, pressure drop, efficiency, and gravimetric heating density as the indicators by which to evaluate the heating performance of the PTC heater. The heating capacity is a value by which we can judge whether the interior of the car can be sufficiently heated under the given operating conditions, and the pressure drop is a measure of power loss in the internal blower of the HVAC system. We calculated the heating performance by measuring the flow into the PTC heater and used the mean temperature difference measured at the thermocouple meshes at the front and back of the PTC heater to perform the calculation in Equation (1). The efficiency is the ratio of the power required by the PTC heater and its heating capacity, and it is an indicator that shows the extent to which the heater can demonstrate effective performance in terms of heating the car. The efficiency is calculated by Equation (2). Weight is an important indicator when considering the limited internal size and limits of the HVAC system as well as the travel distance with one charge. Thus, we used the gravimetric power density, which is the quotient of the heating capacity divided by the weight as shown in Equation (3) [19].
Q h = m ˙ a C p , a ( T o T i )
η = m ˙ a C p , a ( T o T i ) V I
ρ gp = m ˙ a C p , a ( T o T i ) W

3. Heating Performance Results

3.1. Performance Results According to Operating Conditions

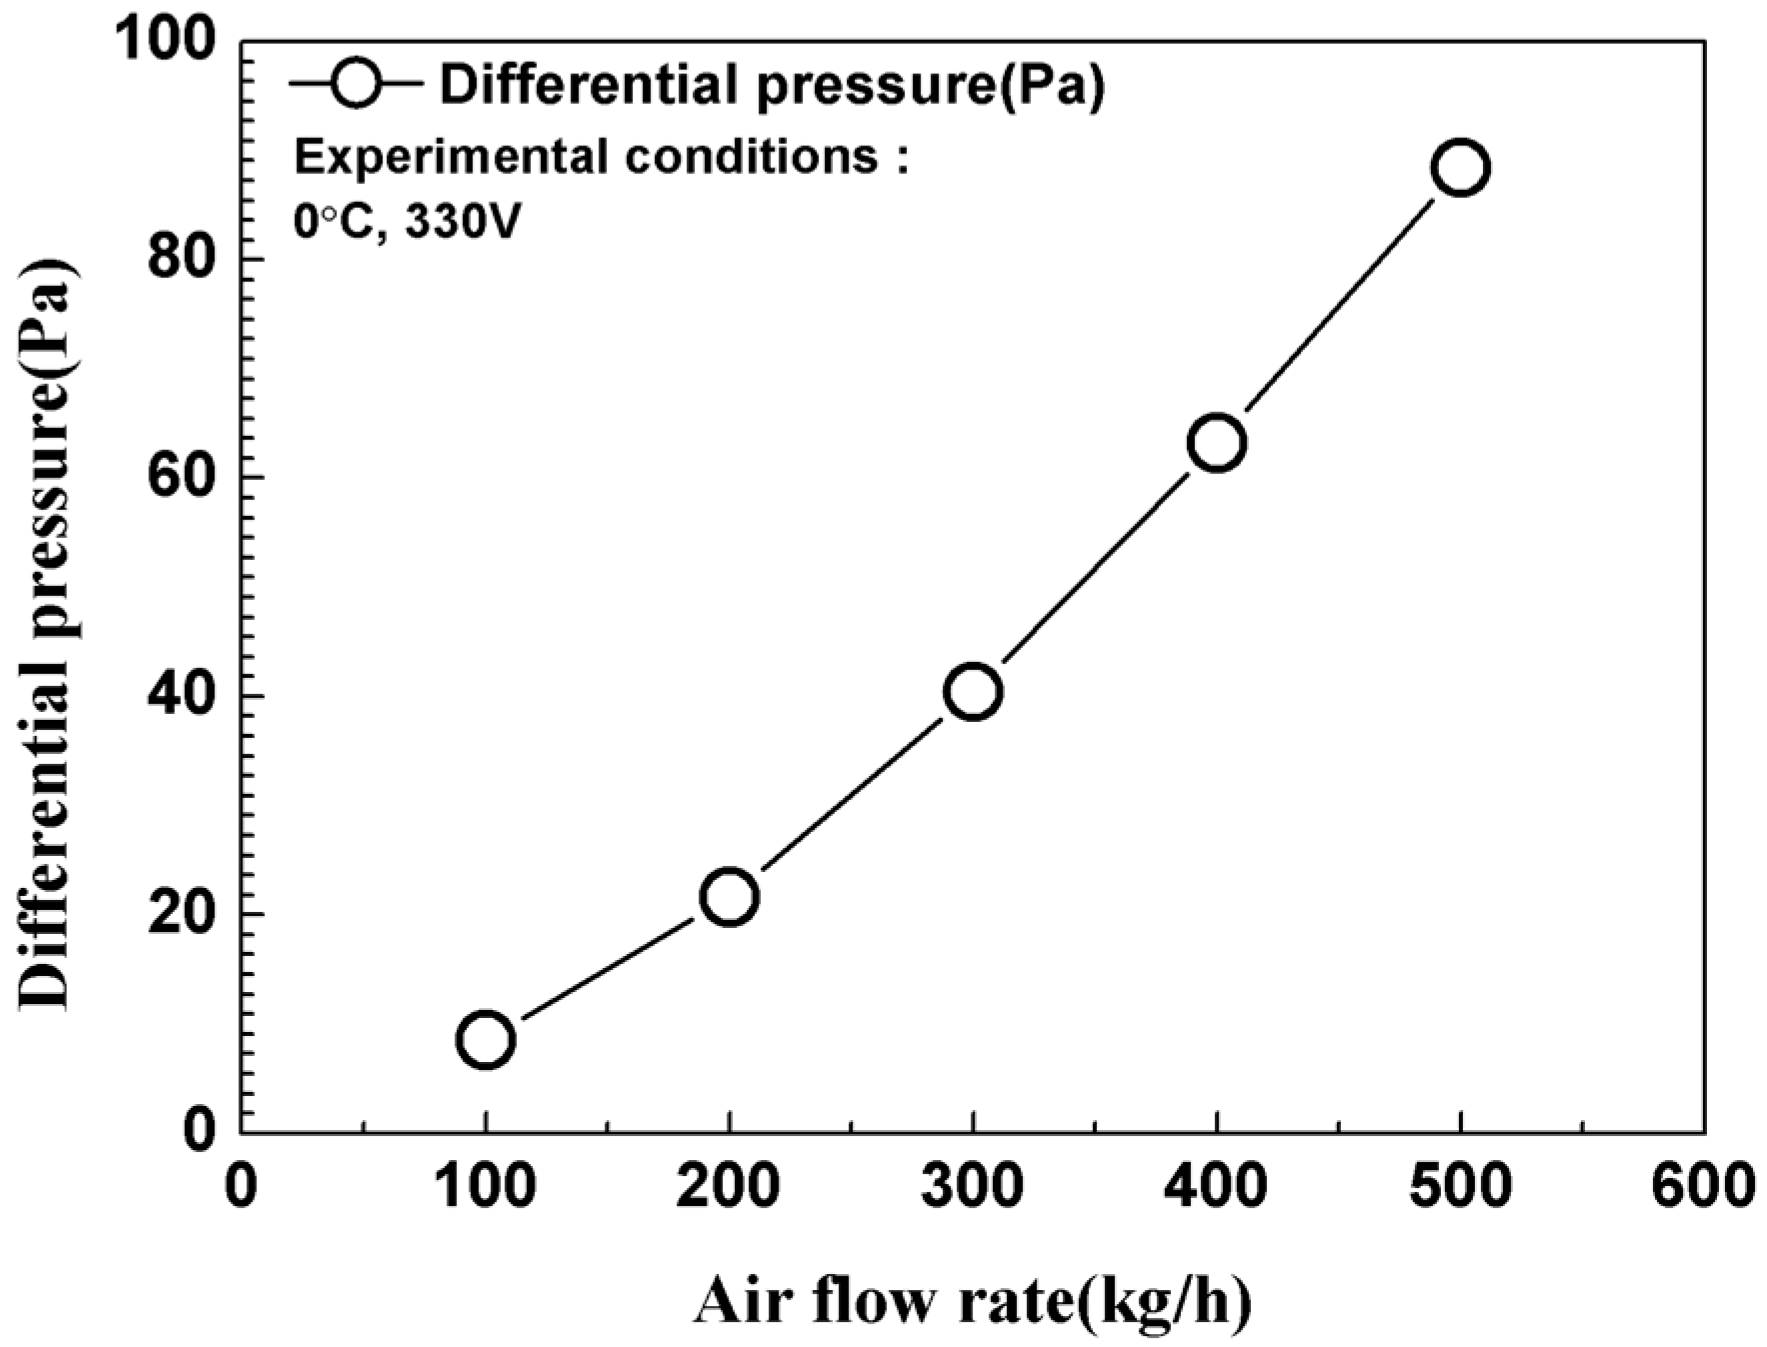
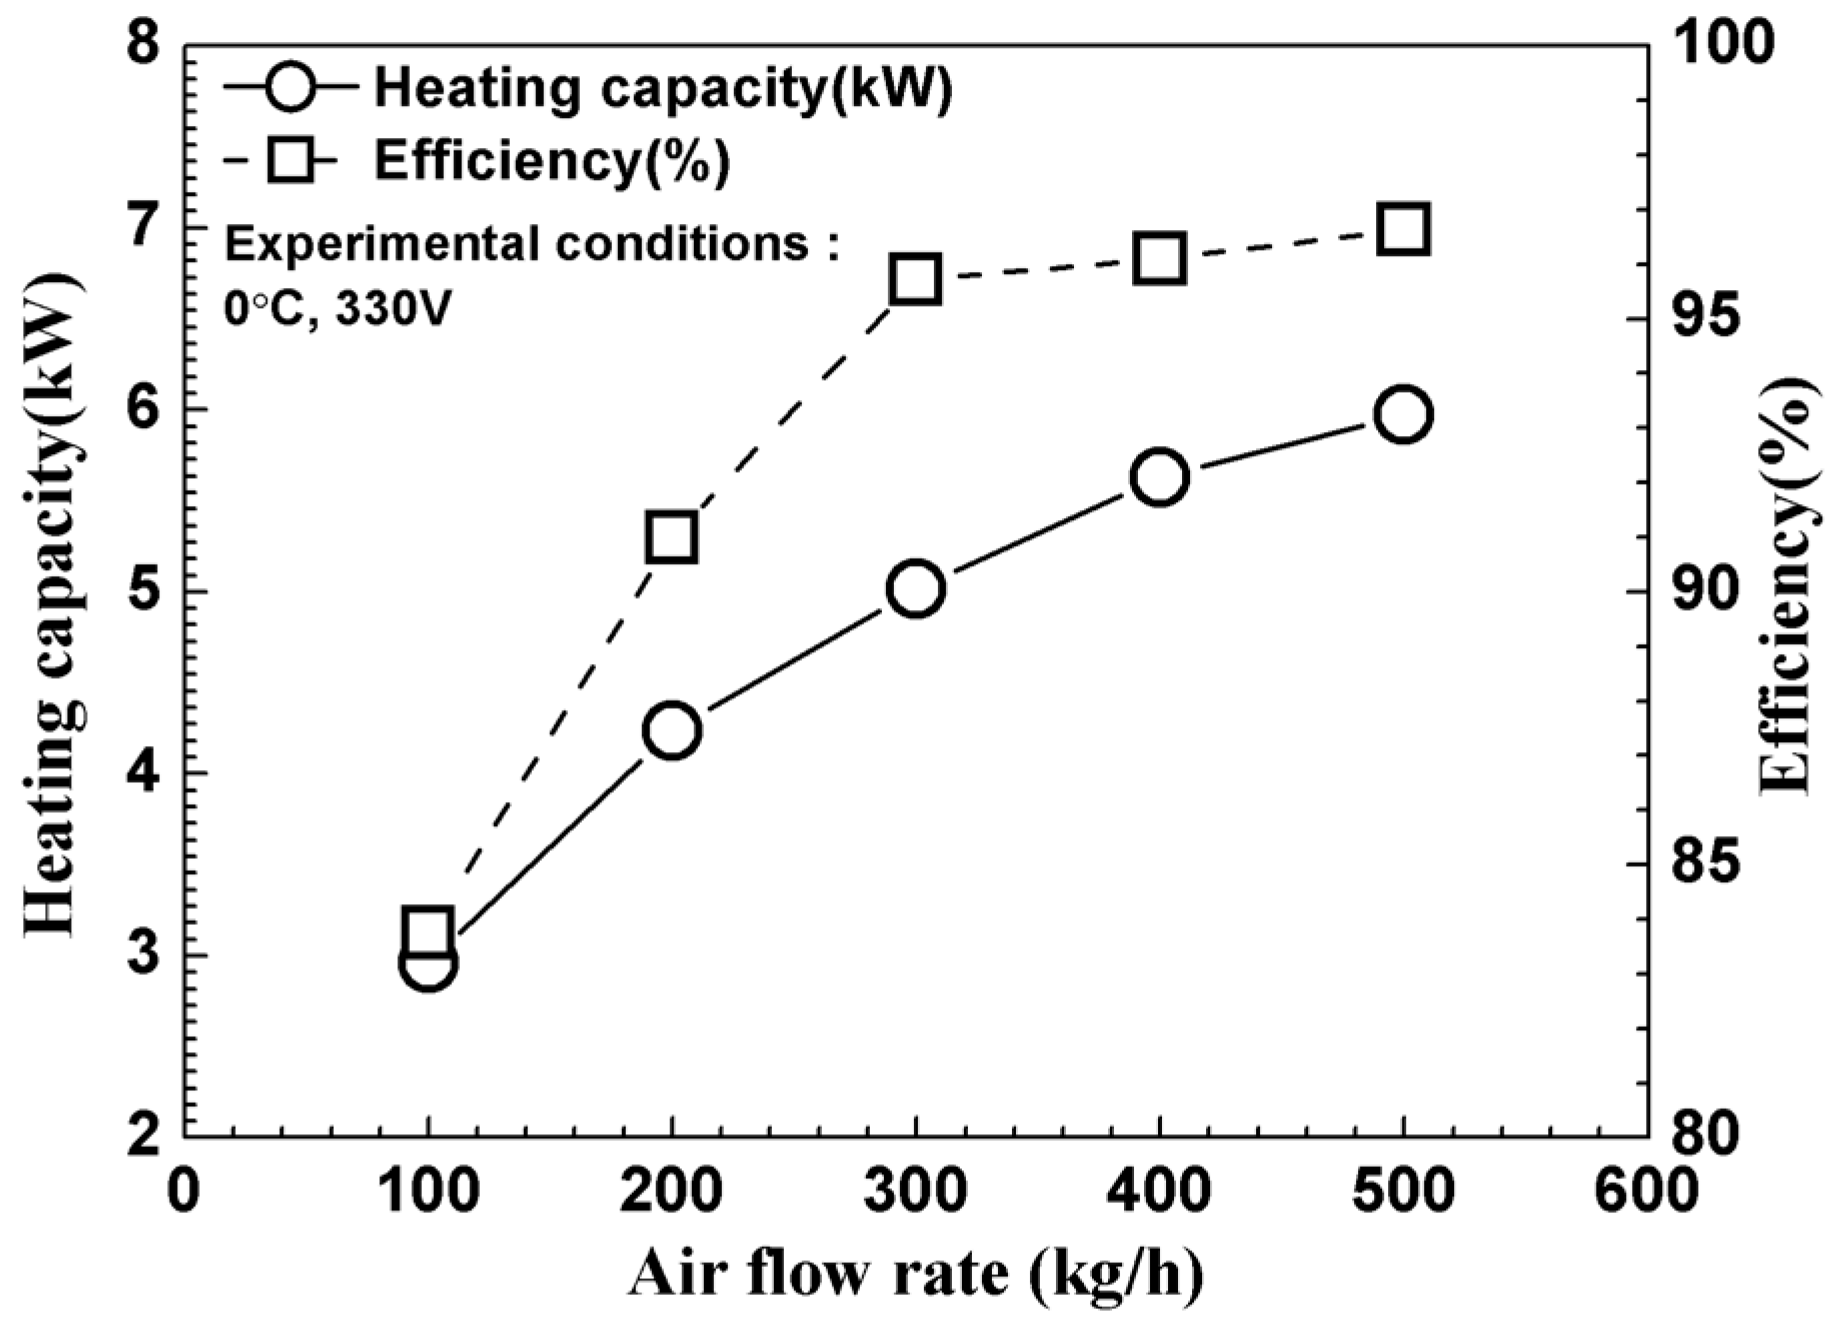
3.1.1. Effect of the Airflow Rate

Experiments were conducted at 0 °C and 330 V to assess the heating performance of the high-voltage PTC heater by changing the airflow rate from 100 kg/h to 500 kg/h in 100 kg/h increments. The heating capacity and efficiency results are shown in Figure 3. When the airflow rate increased from 100 kg/h to 200 kg/h, the heating capacity increased by 1.27 kW, and from 400 kg/h to 500 kg/h, it increased by 0.35 kW. As expected, the heating capacity tended to increase as the airflow rate increased, but as the airflow rate became higher, the increase occurred at a lower rate. We attributed this result to the shorter time air remains around the radiation fins at high airflow rates, thereby reducing the total amount of heating per unit of time. The efficiency was the lowest under extreme conditions of 100 kg/h at 83.8%, and was the highest for 500 kg/h at 96.6%. When the airflow increased from 100 kg/h to 200 kg/h, we recorded the largest rate of increase in the efficiency, and at a high airflow of over 300 kg/h, the increase in heating efficiency was slight. The pressure drop results of the PTC heater are shown in Figure 4, and showed an increasing trend as the airflow rate increased. As expected, the increase in the rate of pressure drops tended to become larger as the airflow increased from 100 kg/h to 500 kg/h.

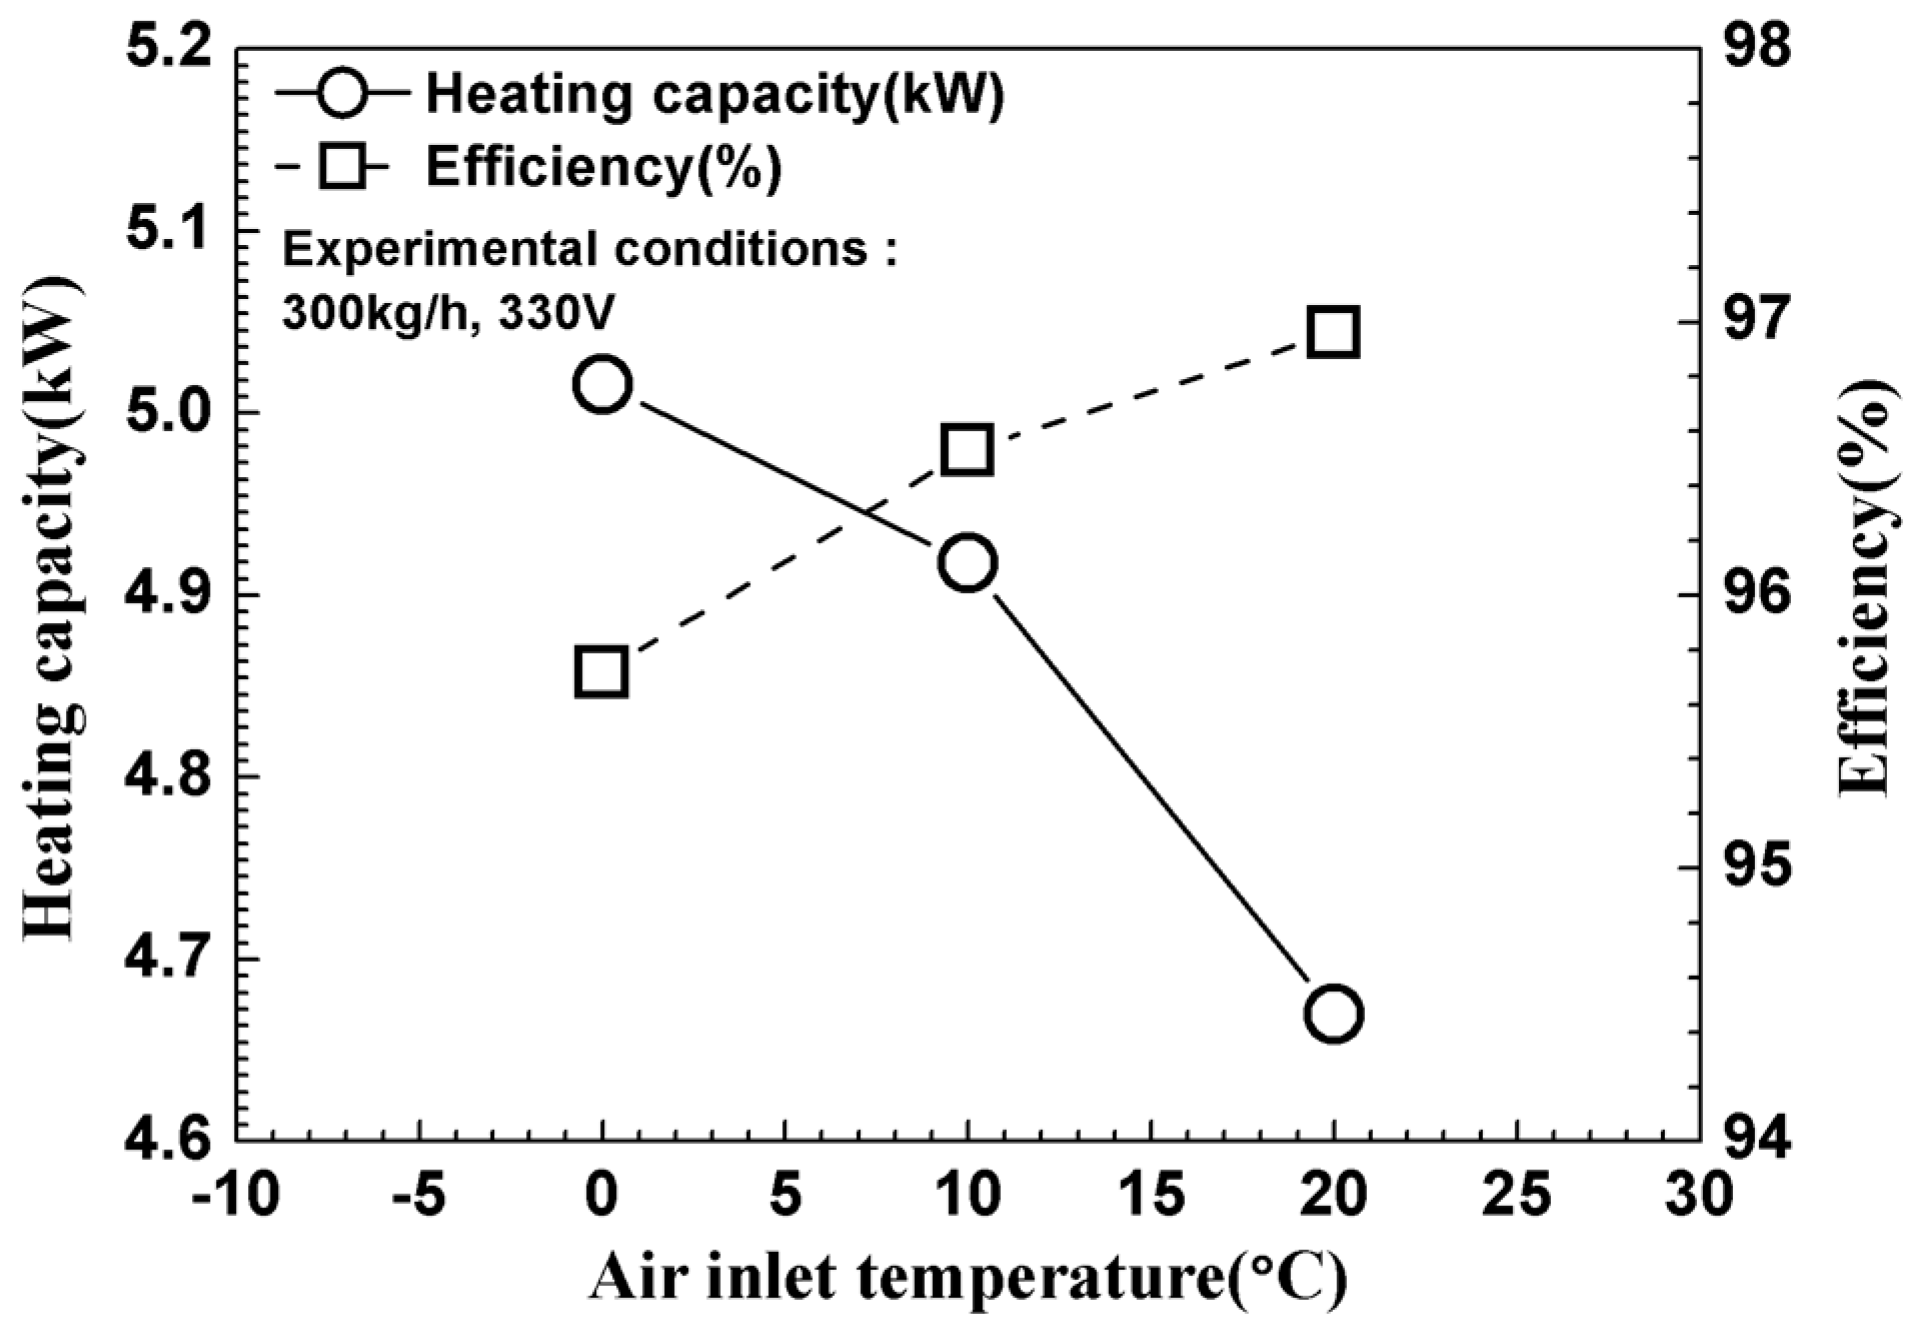
3.1.2. Effect of the Air Inlet Temperature

Experiments on the heating performance of the PTC heater were conducted at 300 kg/h and 300 V by changing the air inlet temperature from 0 °C to 20 °C. The heating capacity and efficiency results are shown in Figure 5. The heating capacity showed a tendency to decrease as the air inlet temperature increased, and as the temperature increased from 0 °C to 20 °C, the heating capacity decreased by 0.35 kW. This effect is understood as being caused by the reduction in convection heat transfer due to the reduction in temperature difference on the airside. On the other hand, the efficiency of the PTC heater showed a tendency to increase as the temperature increased, and this is considered to be the consequence of a reduction in the overall thermal resistance of the heater due to an increase in the air inlet temperature, which decreased the required power.

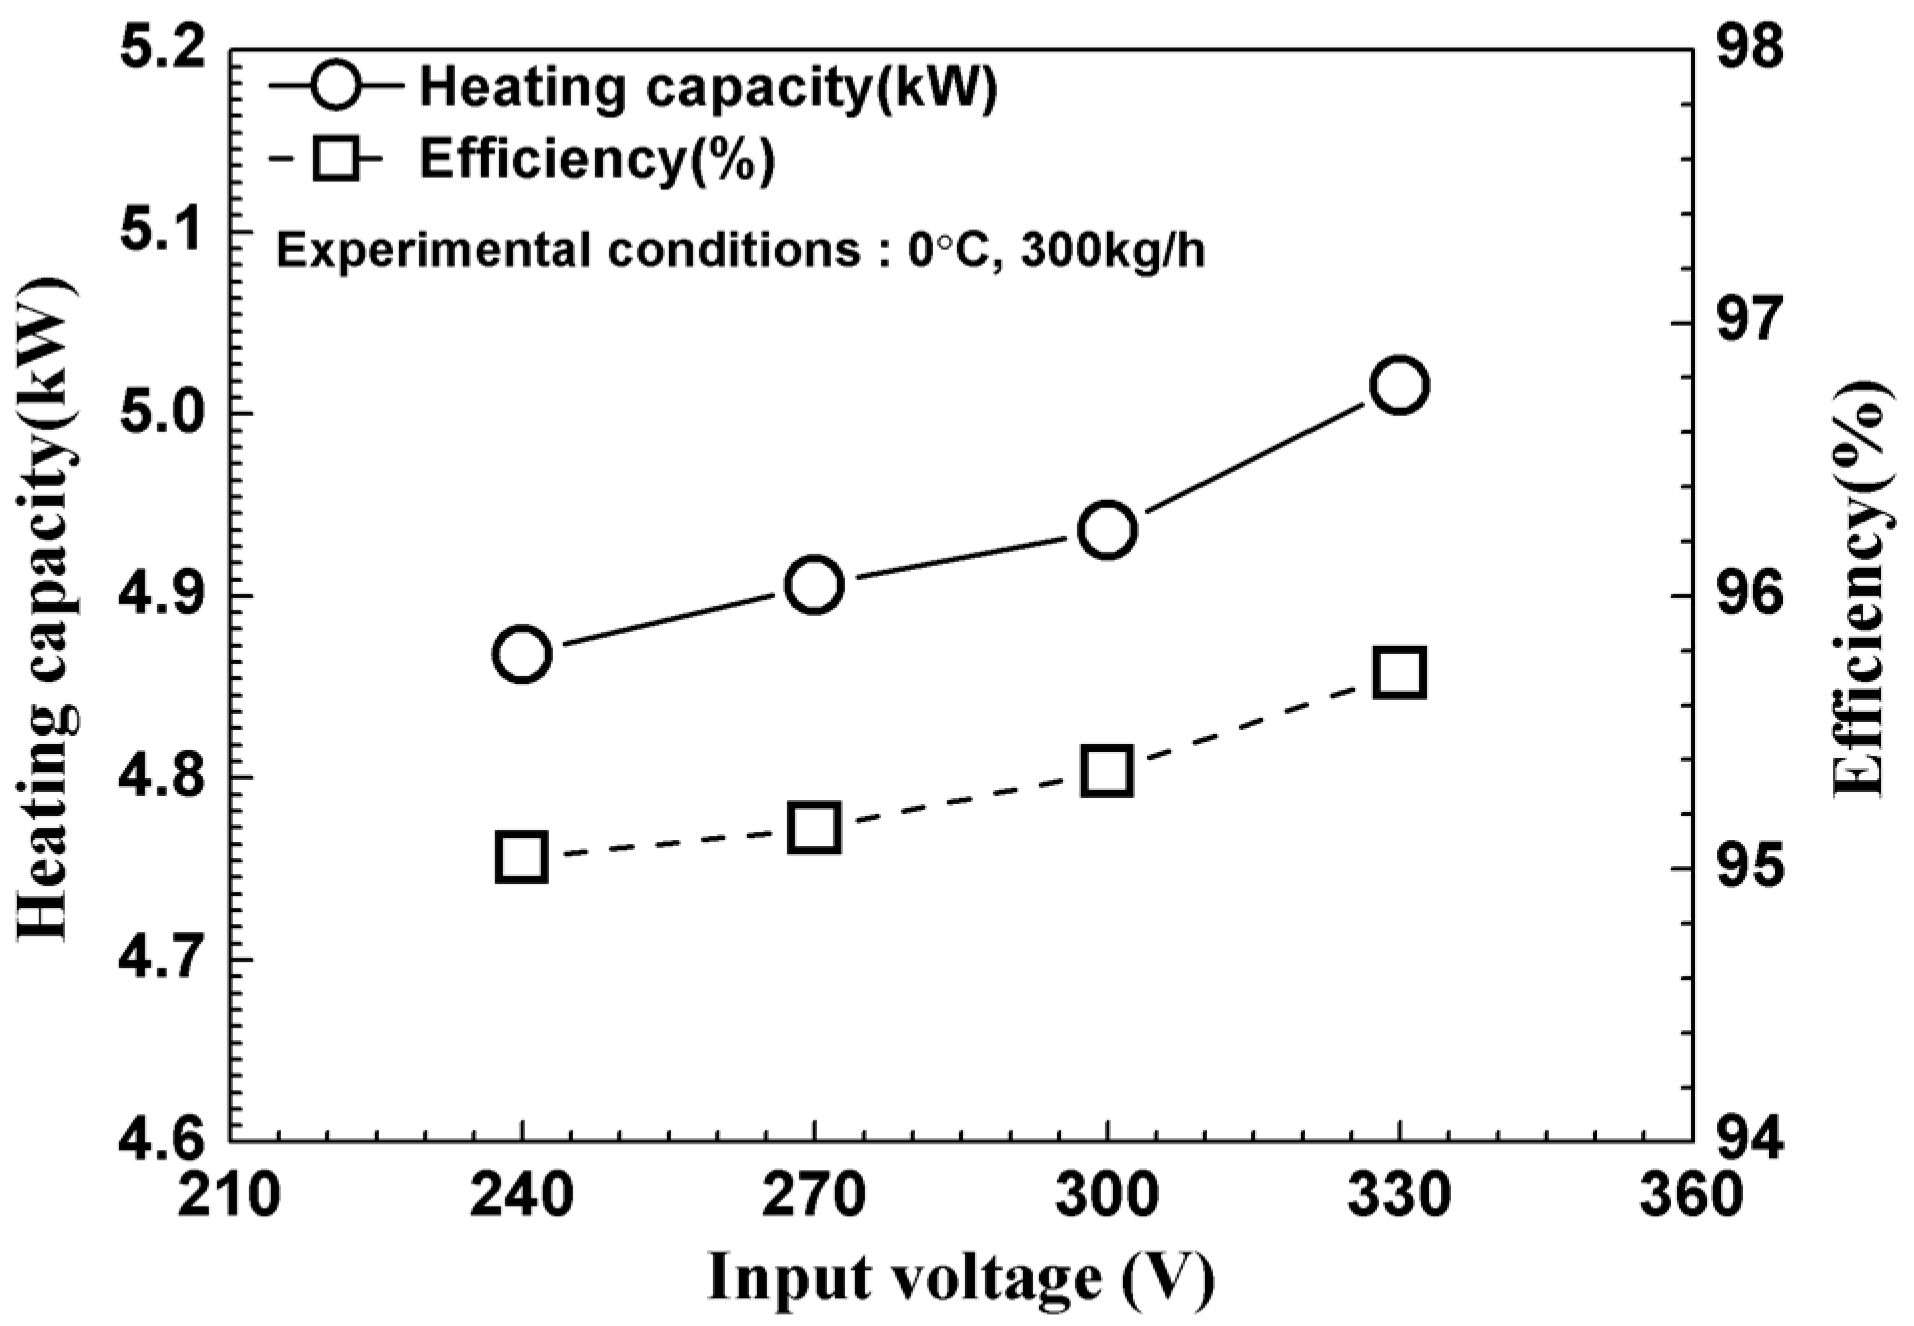
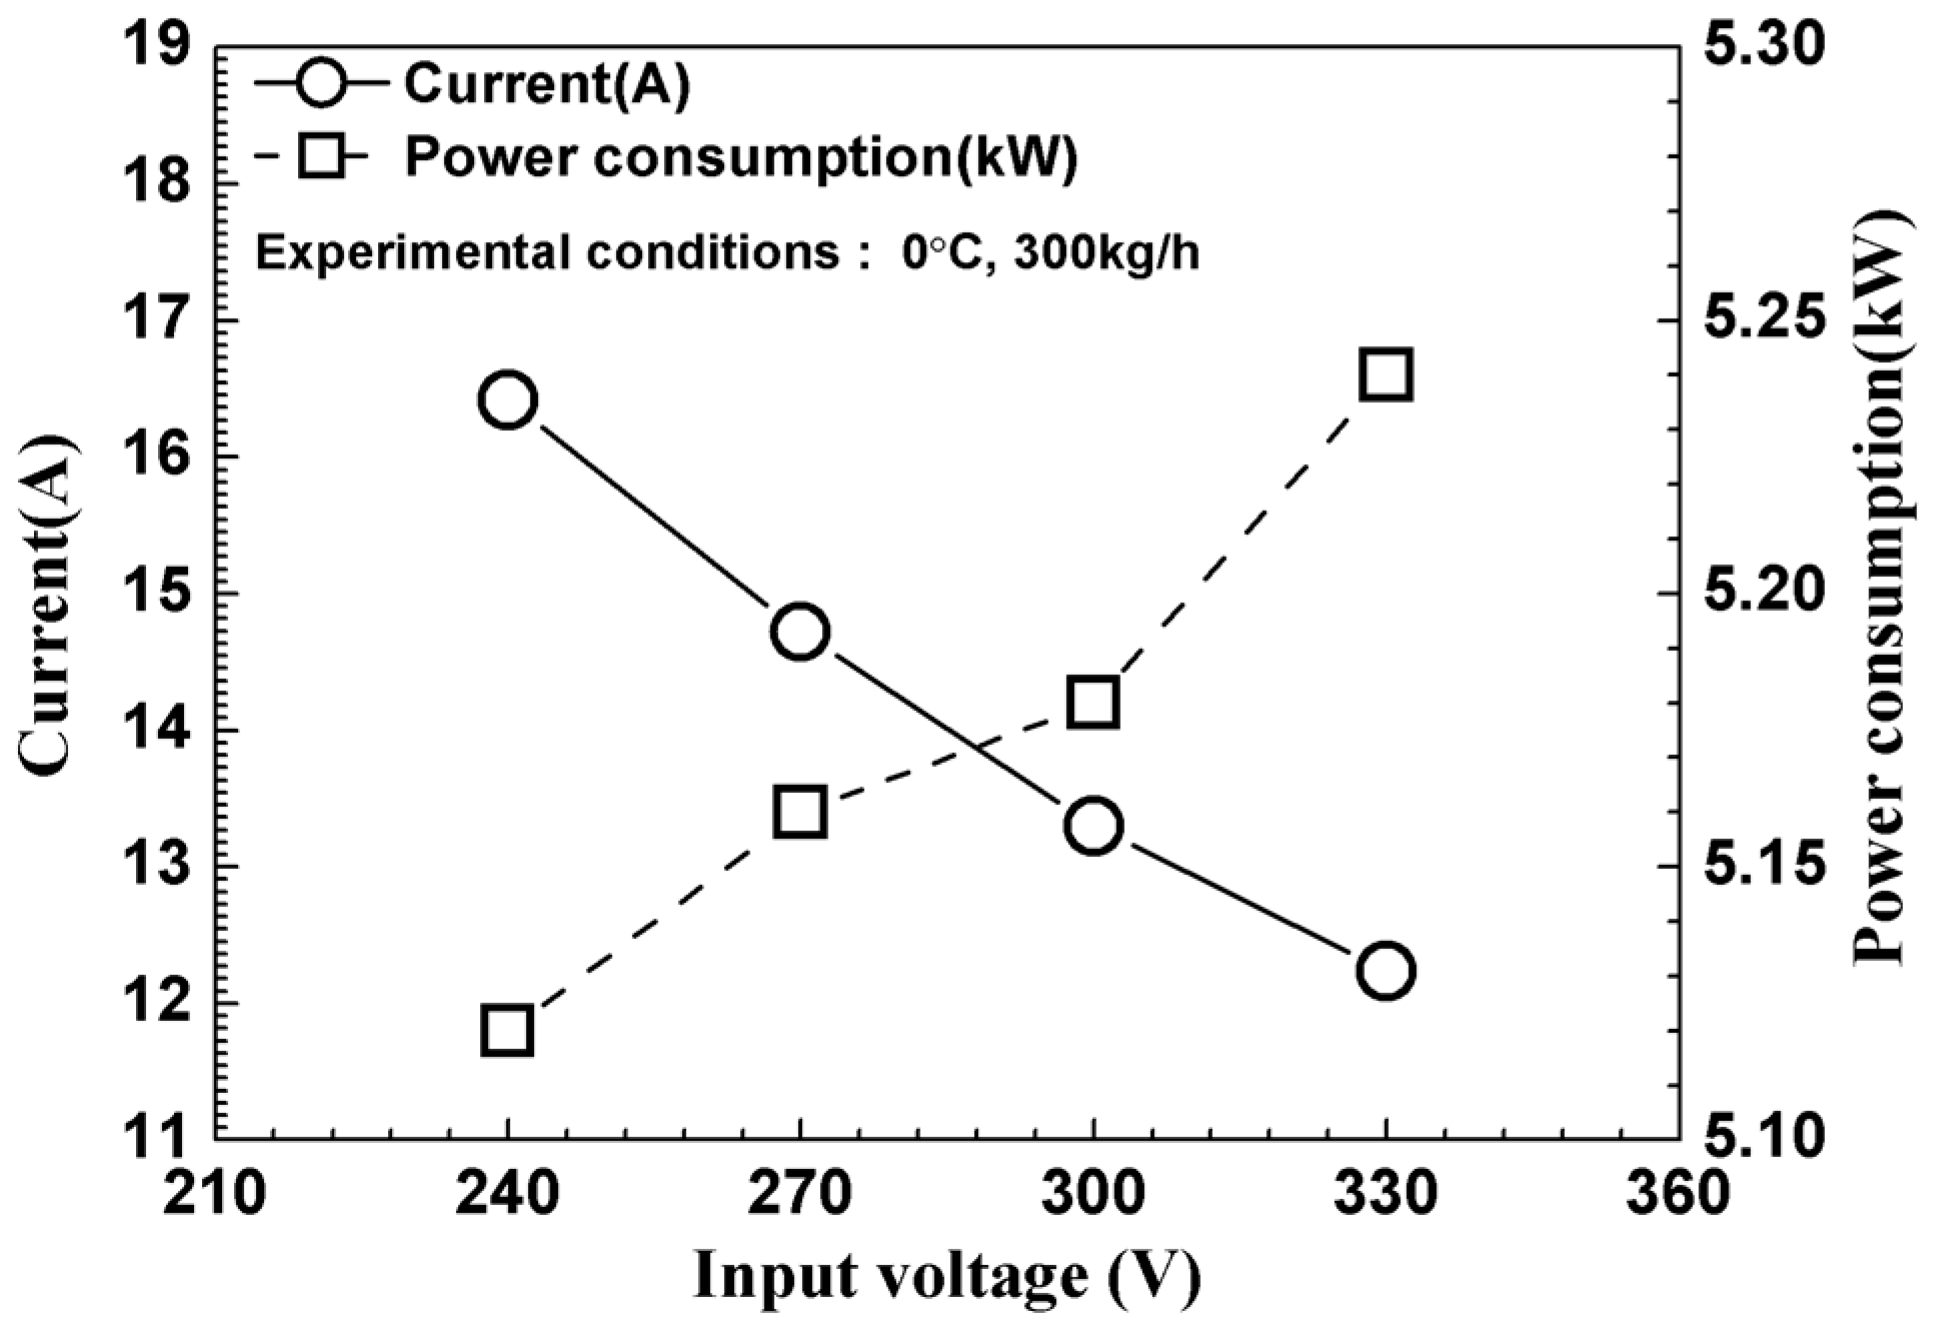
3.1.3. Effect of the Input Voltage

We conducted experiments at 0 °C and 300 kg/h to assess the heating performance of the PTC heater by changing the input voltage from 240 V to 330 V in 30 V increments. The heating capacity and efficiency results are shown in Figure 6. The heating capacity showed a tendency to increase slightly as the input voltage increased. Moreover, it can be seen that, as the input voltage changed, the efficiency of the PTC heater was at the level of 95–96% in all voltage ranges. Figure 7 shows that the current decreased markedly as the input voltage increased, and it can be seen that the power required by the PTC heater increased slightly.

3.2. Analysis of Shape Parameters

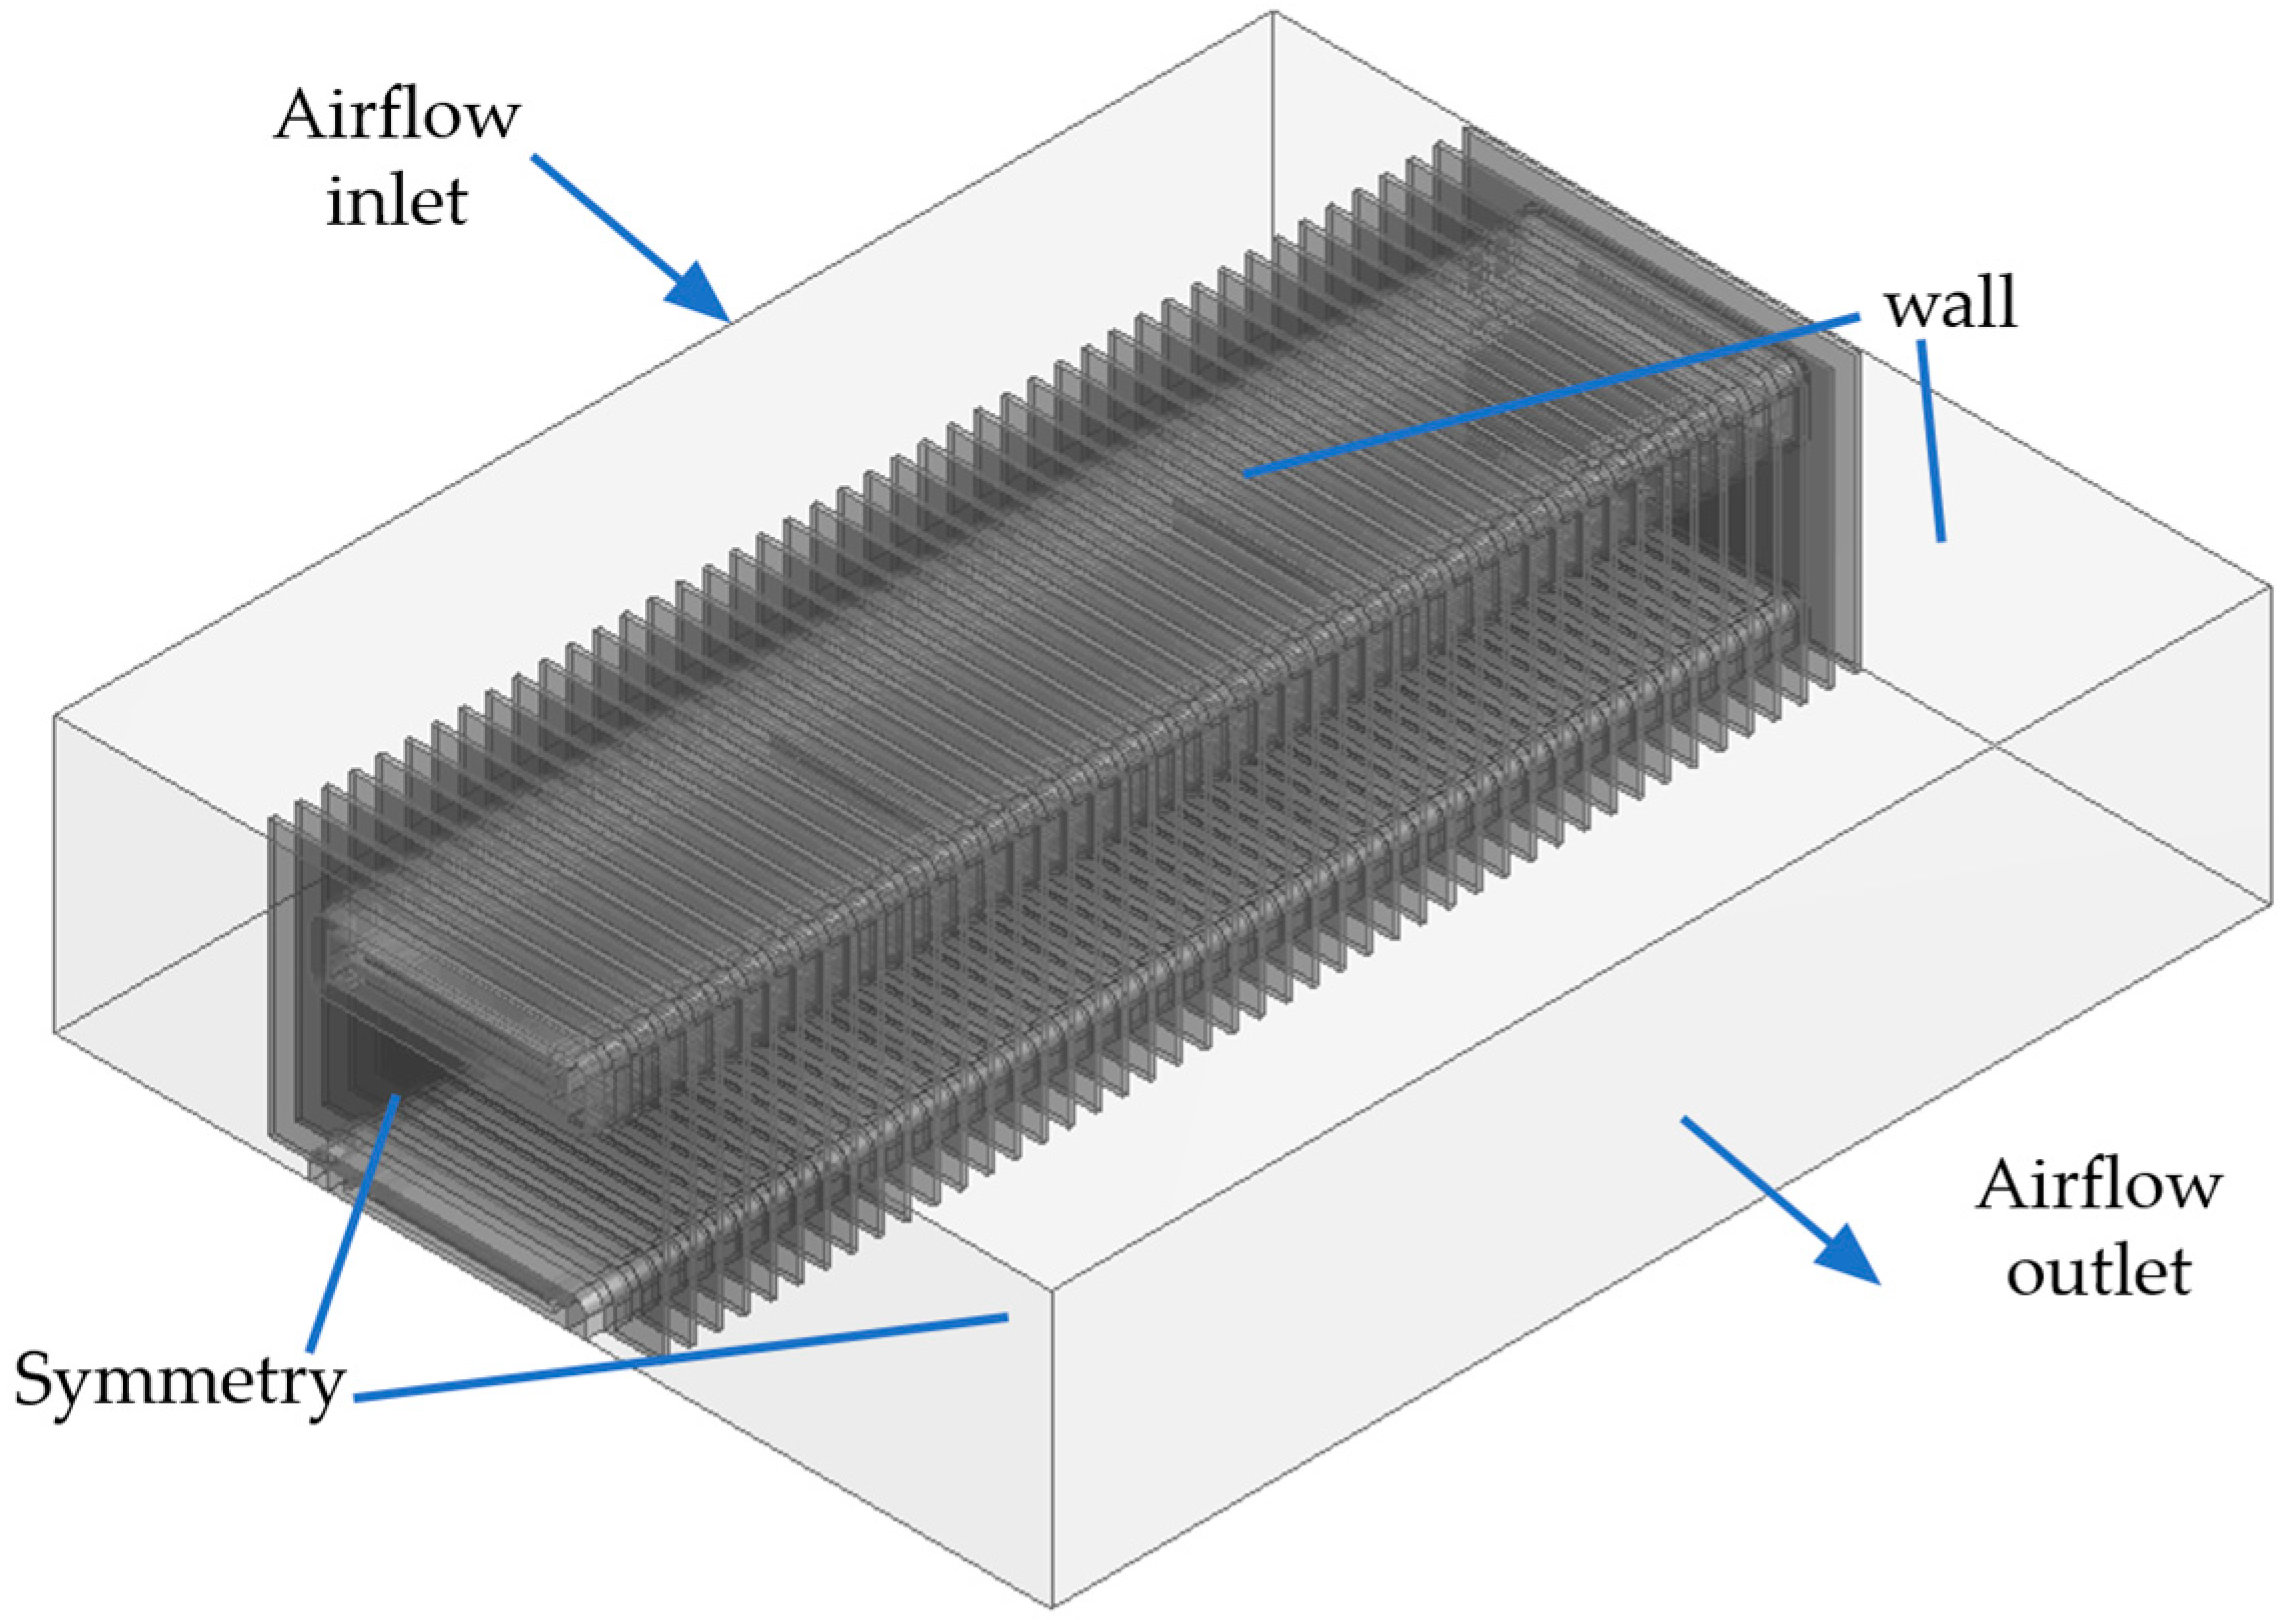
3.2.1. Physical Model

In order to reduce the weight and improve the heat transfer efficiency of the heater, we analyzed the various shape parameters, and we selected four types of physical models within the range in which the existing plate fin construction process can be used. We conducted the modeling of Case 1 based on the design of the initial prototype Heater A, and for Case 2 and Case 3, we reduced the fin pitch and fin thickness by 0.4 mm and 0.1 mm, respectively. In Case 4, we changed the fin shape from a plate type to an embossed type. More details are provided in Figure 8 and Table 4. The high-voltage PTC heater comprised a PTC thermistor, guide, terminal, insulator, heat bar and fins as its main components, and we ignored design allowances for construction such as tight fits. We simplified the chamfers and fillets, which do not markedly affect the thermal flow, and we appropriately modified the micro-gaps, which make it difficult to create a grid. In addition, as indicated in Table 5, we used different material properties for the high-voltage PTC heater components.

3.2.2. Mathematical Background

For the analysis in this research, we used the commercial program Ansys fluent (ver. 17, ANSYS Inc., Canonsburg, PA, USA) to perform thermal flow analysis, and we used mass conservation, momentum conservation, and energy conservation as the governing equations [20]. This study adopted the Realizable κ-ε model with the aim of obtaining accurate data for airflows involving fin layers.
t ( ρ k ) + x j ( ρ κ u j ) = x j [ ( μ + μ t σ κ ) k x j ] + G k + G b ρ ε Y M + S k
t ( ρ ε ) + x j ( ρ ε u j ) = x j [ ( μ + μ t σ ε ) ε x j ] + ρ C 1 S ε ρ C 2 ε 2 k + v ε + C 1 ε ε k C 3 ε G b + S ε
where
C 1 = max [ 0.43 , η η + 5 ]
η = S k ε
S = 2 S i j S i j
In solid regions, the energy transport equation is as follows.
t ( ρ h ) + ( v ρ h ) = ( k T ) + S h

3.2.3. Boundary Condition

In this study, we performed the analysis under incompressible, normal, and turbulent conditions, and we ignored both the contact thermal resistance, which occurs between the PTC heat rods, and the thermal gradient of the PTC thermistor. Further, we used the SIMPLE algorithm and the Reynolds-Averaged Navier-Stokes (RANS) equation [21,22]. The directionality and uniformity of the inlet flow was ensured by setting the upstream region to half the actual air channel length. A backdraft due to the slipstream was prevented by setting the downstream region equal to the length of the actual air channel [23]. Considering the external physical characteristics and number of grids of the analysis model, 1/16th of the full model of the high-voltage PTC heater, in other words, 1/4 of the heat core, was used as an appropriate analysis region. Figure 9 shows the detailed analysis region and boundary conditions. The airflow through the inlet and the air temperature were set at 300 kg/h and 0 °C, which are the standard operating conditions of a PTC heater. The external and structural characteristics of the analysis model were taken into consideration when defining the wall and symmetry boundary conditions, respectively. The temperature of the PTC thermistor was assumed to be 160 °C, and this was set based on the temperature limit specified in the design standard for the PTC heater element.

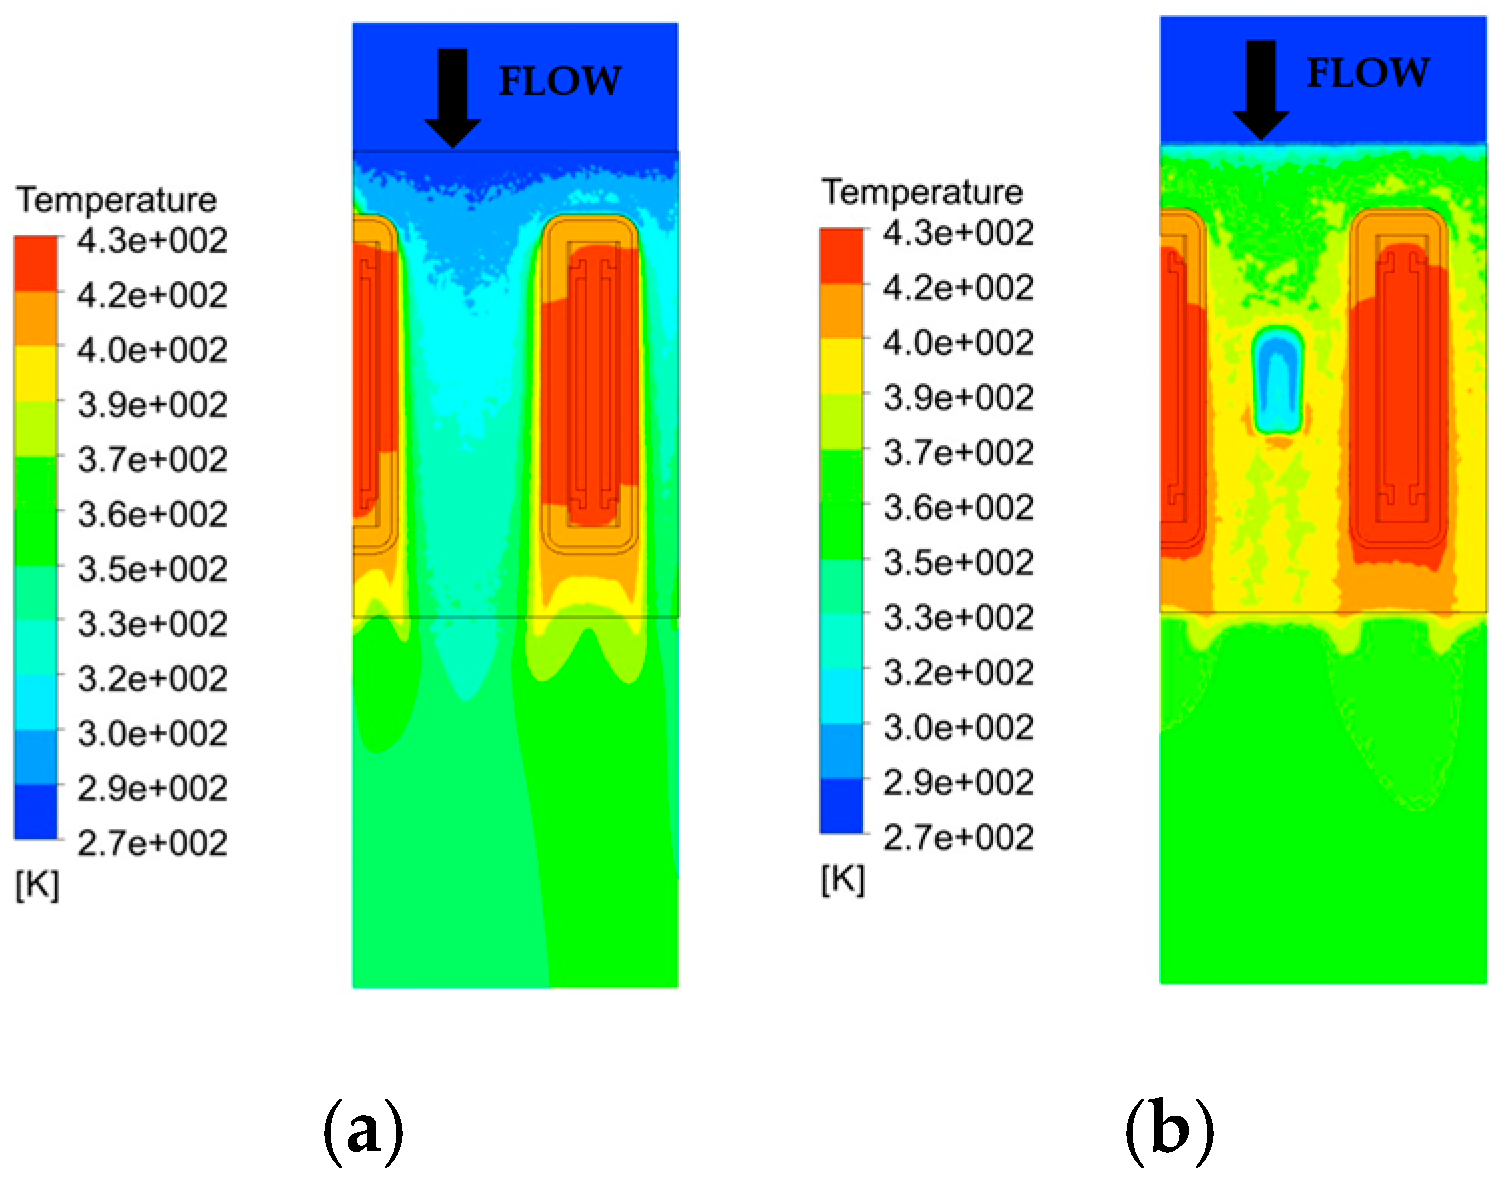
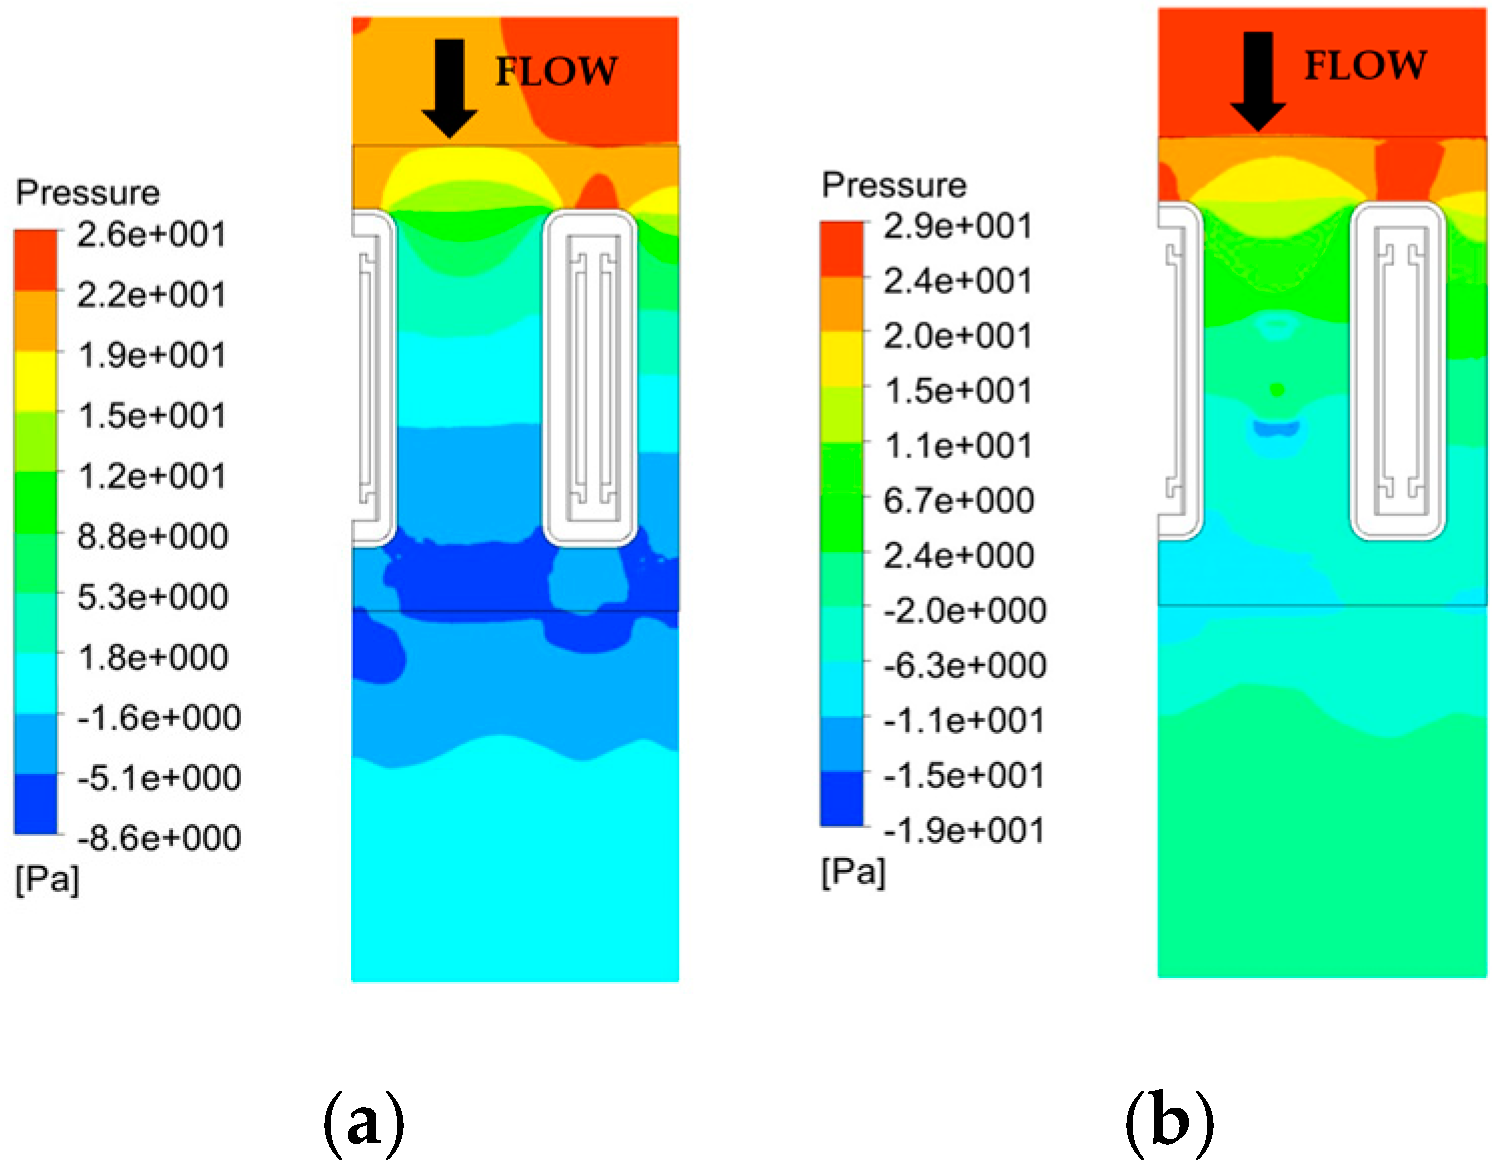
3.2.4. Analysis Results and Discussion

To ensure the reliability of the analysis grid, approximately 20 million grids were used, and if the remainder value fell below 10−6, it was considered to be convergent. The PTC heater and airside temperature distribution are shown in Figure 10, and in Figure 10b, it can be seen that the thermal conduction in the PTC heat rod cross section increases due to the low thermal resistance of the insulator, and the airside convection thermal transfer increases more due to the embossed shape. The airside pressure distribution is shown in Figure 11, and in Figure 11b it passes the free flow space between heat rods and the pressure drop becomes large. In particular, the pressure drop increases to a greater extent at the part where the flow enters and encounters the embossed shape.
The analysis results in Table 6 were obtained by assuming the PTC thermistor to have reached the limit temperature of 160 °C. A comparison of these results to those in the previous experiment with similar shape conditions revealed that the heating performance was somewhat high, but the tendency was the same. The reason for this is that the micro-gaps between each part were not considered [15]. When the fin pitch was reduced by 0.4 mm (Case 2), the heating capacity increased by approximately 7.1%, and when the fin thickness was reduced by 0.1 mm (Case 3), the heating capacity was reduced by approximately 5.1%. When the fin shape was embossed (Case 4), the heating performance increased by approximately 4.8%. On the other hand, in terms of pressure drop, the embossed shape showed the maximum, but this value was in the allowed pressure drop range for an HVAC system.

3.3. Evaluation of Improved Model

Based on the previous experiments and analysis results for Heater A (base model), we evaluated the heating performance of Heater B (enhanced model) and compared this to Heater A as shown in Table 7. The evaluation results showed that the airside temperature difference of the improved prototype increased by 6.1 °C compared to the initial prototype, and the heating capacity increased by approximately 10%. We attribute these findings to the changes in the fin shape and the increase in the thermal transfer area due to the change in the fin pitch. Furthermore, it can be seen that, in the case of the embossed fin shape, the inflow between fins was horizontally blocked, and because of this, the flow direction was curved, which increased the flow resistance and therefore increased the pressure drop. However, this is within the allowed pressure drop range in which there is almost no effect on the HVAC system, and this experimental value is similar to that of the previous analysis [24]. Compared to Heater A, the input current of Heater B increased by 1.2 A, and because of this, the power consumption increased by 0.39 kW. However, when we consider the efficiency of the heater, the heating capacity increased by 2.3% compared to Heater A; hence, it can be seen that changing the shape of the embossed radiation fins is advantageous for the heating capacity. In addition, the calculation of the gravimetric power density showed that it increased by 3.45 kW/kg or by approximately 24% in the case of Heater B, which translates into an improvement in terms of the distance an electric car can be driven on a single charge.

4. Conclusions

In this study, we constructed an experimental high-voltage PTC heater for electric cars and analyzed its heating performance according to the airflow of the blower, the ambient temperature, and battery voltage. We modified the shape variables of the heater and performed an analysis with the aim of improving the heating performance and power density of conventional heaters. Based on the experimental and analysis results, we presented a high-voltage PTC heater design with improved radiation fins, and we compared its properties with those of the conventional model. The results showed that the proposed model achieved a heating capacity of 5.52 kW, a pressure drop of 48.2 Pa, an efficiency of 98%, as well as a power density of 3.45 kW/kg, indicating an overall improvement of approximately 24% over the conventional model.
We expect the results of this study to contribute to the optimization of high-voltage PTC heater designs for electric cars and the production of testing equipment for heating performance. In the future, we plan to conduct experiments to assess the heater performance by varying the shapes of heater components to develop a correlation formula between the thermal transfer and pressure drop created by a combination of heater design factors and dimensionless numbers.

Acknowledgments

This work was conducted as a part of the Energy Technology Development project sponsored by the Ministry of Trade, Industry and Energy and was supported by the 2017 Yeungnam University Research Grant. This research was also supported by Basic Science Research Program through the National Research Foundation of Korea (NRF) funded by the Ministry of Education (NRF-2017R1D1A3B03028482). The additional support received from the Donga High Tech company is greatly appreciated.

Author Contributions

Sung Chul Kim and Myeong Hyeon Park organized the overall evaluation and analyzed the results. Both authors also reviewed the manuscript.

Conflicts of Interest

The authors declare no conflict of interest.

Abbreviation

Nomenclatures
C p Specific heat (J/kg·K)
FFin
I Current (A)
m ˙ Mass flow rate (kg/s)
T Temperature (°C)
V Input voltage (V)
W PTC heater weight (kg)
η Energy efficiency (%)
ρ Density (kW/kg)
Subscripts
aAir
gpGravimetric power
iInlet
oOutlet
pPitch
tThickness

References

  1. Li, S.; Wang, S.; Ma, Z.; Jiang, S.; Zhang, T. Using an Air Cycle Heat Pump System with a Turbocharger to Supply Heating for Full Electric Vehicles. Int. J. Refrig. 2017, 77, 11–19. [Google Scholar] [CrossRef]
  2. Kwon, C.K.; Kim, M.S.; Choi, Y.G.; Kim, M.S. Performance Evaluation of a Vapor Injection Heat Pump System of Electric Vehicles. Int. J. Refrig. 2017, 74, 138–150. [Google Scholar] [CrossRef]
  3. Kambly, K.R.; Bradley, T.H. Estimating the HVAC Energy Consumption of Plug-in Electric Vehicles. J. Power Sources 2014, 259, 117–124. [Google Scholar] [CrossRef]
  4. Zahraei, M.S.; Kouzami, A.Z.; Kutter, S.; Baker, B. Intergrated Thermal and Energy Management of Plug-in Hybrid Electric Vehicles. J. Power Sources 2012, 216, 237–248. [Google Scholar] [CrossRef]
  5. Zhang, G.; Zou, H.; Qin, F.; Xue, Q.; Tian, C. Investigation on an Improved Heat Pump AC System with the View of Return Air Utilization and Anti-fogging for Electric Vehicles. Appl. Therm. Eng. 2017, 115, 726–735. [Google Scholar] [CrossRef]
  6. Zhang, G.; Qin, F.; Zou, H.; Tian, C. Experimental Study on a Dual-parallel-evaporator Heat Pump System for Thermal Management of Electric Vehicles. Energy Procedia 2017, 105, 2390–2395. [Google Scholar] [CrossRef]
  7. Zhang, X.; Xue, Q.; Zou, H.; Liu, J.; Tian, C.; Zhang, X. Influence of Heat Exchanger Tube Layout on Performance of Heat Pump System for Electric Cars. Energy Procedia 2017, 105, 5085–5090. [Google Scholar] [CrossRef]
  8. Cho, C.P.; Kim, G.C.; Pyo, Y.D.; Lee, W.H. The development of an energy-efficient heating system for electric vehicles. In Proceedings of the IEEE Transportation Electrification Conference and Expo, Asia-Pacific (ITEC), Busan, Korea, 1–4 June 2016; pp. 883–885. [Google Scholar]
  9. Kim, K.Y.; Kim, S.C.; Kim, M.S. Experimental Studies on the Heating Performance of the PTC Heater and Heat Pump Combined System in Fuel Cells and Electric Vehicles. Int. J. Automot. Technol. 2012, 13, 971–977. [Google Scholar] [CrossRef]
  10. Musat, R.; Helerea, E. Characteristics of the PTC Heater Used in Automotive HVAC Systems. IFIP Adv. Inf. Commun. Technol. 2010, 314, 461–468. [Google Scholar]
  11. Shin, Y.H.; Lim, D.H.; Kim, D.G.; Ahn, S.K.; Kim, K.Y.; Kim, S.C. Development of a PTC Elements and a Heater as Supplementary Heating for Internal Combustion Engine. In Proceedings of the Fall Conference KSME 2013, Jeongseon, Korea, 18–20 December 2013; pp. 3400–3403. [Google Scholar]
  12. Gu, J.S.; Oh, K.H.; Jeong, S.H.; Wang, Y.H. A Study on Applying Hybrid PTC Heater to vehicle for Heating Performance Improvement. In Proceedings of the Spring Conference KSAE 2016, Jeju, Korea, 19–21 May 2016; pp. 762–767. [Google Scholar]
  13. Lim, D.H.; Shin, Y.H.; Sim, S.K.; Song, J.W.; Ahn, S.K.; Kim, S.C. The Flow Analysis and Heating Performance Evaluation of PTC Heater for Electric Vehicles. In Proceedings of the Fall Conference KSAE 2016, Jeju, Korea, 19–21 May 2016; pp. 1234–1236. [Google Scholar]
  14. Shin, Y.H.; Ahn, S.K.; Kim, S.C. Performance Characteristics of PTC Elements for an Electric Vehicle Heating System. Energies 2016, 9, 813. [Google Scholar] [CrossRef]
  15. Shin, Y.H.; Sim, S.K.; Kim, S.C. Performance Characteristics of a Modularized and Integrated PTC Heating System for an Electric Vehicle. Energies 2016, 9, 18. [Google Scholar] [CrossRef]
  16. American Society of Heating; Refrigerating and Air-Conditioning Engineers, Inc. 2009 ASHRAE Handbook—Fundamentals (SI Edition); ASHRAE: Atlanta, GA, USA, 2009; Chapter 13–15. [Google Scholar]
  17. Picard, A.; Davis, R.S.; Glaser, M.; Fujii, K. Revised Formula for the Density of Moist Air (CIPM-2007). Metrologia 2008, 45, 149–155. [Google Scholar] [CrossRef]
  18. Marra, F.; Yang, G.Y.; Træholt, C.; Larsen, E.; Rasmussen, C.N.; You, S. Demand Profile Study of Battery Electric Vehicle under Different Charging Options. In Proceedings of the 2012 IEEE Power & Energy Society General Meeting, San Diego, CA, USA, 22–26 July 2012. [Google Scholar] [CrossRef]
  19. Paladini, V.; Donateo, T.; Risi, A.D.; Laforgia, D. Super-capacitors Fuel-cell Hybrid Electric Vehicle Optimization and Control Strategy Development. Energy Convers. Manag. 2007, 48, 3001–3008. [Google Scholar] [CrossRef]
  20. FLUENT Inc. Fluent 6.3 User’s Guide; Centerra Resource Park 10 Cavendish Court Lebanon: Hanover, NH, USA, 2006. [Google Scholar]
  21. Welty, R.J.; Wicks, C.E.; Wilson, R.E. Fundamentals of Momentum, Heat and Mass Transfer, 3rd ed.; John Wiley and Sons: New York, NY, USA, 1984. [Google Scholar]
  22. Versteeg, H.K.; Malalasekera, W. An Introduction to Computational Fluid Dynamics: Finite Volume Method; Longman Scientific and Technical: Essex, UK, 1995. [Google Scholar]
  23. Boris, D.; Anica, T.; Kristain, L. Numerical Investigation of Heat Transfer Enhancement in a Fin and Tube Heat Exchanger Using Vortex Generators. Int. J. Heat Mass Transf. 2014, 78, 662–669. [Google Scholar]
  24. Kim, Y.C.; Sung, N.S.; Jin, K.S.; Cho, H.T. Consideration of High Voltage PTC Heater. In Proceedings of the Spring Conference KSAE 2016, Jeju, Korea, 19–21 May 2016; pp. 560–564. [Google Scholar]
Figure 1. High voltage PTC heater and radiation fin. (a) High-voltage PTC heater Design; (b) Heater A: plate fin type; (c) Heater B: emboss fin type.
Energies 10 01494 g001
Figure 2. Schematic diagram and photo of the PTC heater experimental apparatus.
Energies 10 01494 g002
Figure 3. Variation of heating capacity and efficiency.
Energies 10 01494 g003
Figure 4. Variation of differential pressure.
Energies 10 01494 g004
Figure 5. Variation of heating capacity and efficiency.
Energies 10 01494 g005
Figure 6. Variation of heating capacity and efficiency.
Energies 10 01494 g006
Figure 7. Variation of current and power consumption.
Energies 10 01494 g007
Figure 8. Physical model of high-voltage PTC heater. (a) Schematic view of PTC heat core; (b) Plate fin; (c) Emboss fin.
Energies 10 01494 g008aEnergies 10 01494 g008b
Figure 9. Computational domain.
Energies 10 01494 g009
Figure 10. Temperature distribution of PTC heater. (a) Case 1; (b) Case 4.
Energies 10 01494 g010
Figure 11. Pressure drop of PTC heater. (a) Case 1; (b) Case 4.
Energies 10 01494 g011
Table 1. Specification of PTC Heater A and B.
ParameterHeater A (Base Model)Heater B (Enhanced Model)
Heater total size (mm3)200 (W) × 210 (H) × 28 (D)
Heater module size (mm3)182 (W) × 186 (H) × 28 (D)
Weight (kg)1.81.6
Input voltage (V)330
Fin typePlateEmboss
Fin pitch (mm)2.01.6
Fin thickness (mm)0.40.3
Heat transfer area (mm3)501.1507.6
Table 2. Specification of PTC heater experimental apparatus.
ComponentSpecification
Thermocouple (K-type)±0.1% (−60–200 °C), inlet 6 points, outlet 54 points
Diff. pressure gauge (Setra)±0.14% (0–0.5″ W.C.)
Pressure gauge (Setra)±0.25% (600–1100 mbar/hPa)
Pitot tube (Samdukeng)Φ3.2 × 150 mm
Thermo-hygrometer (Kimo)±0.25% (0–50 °C), 5–95% RH, ±1.5% RH (where 15 °C ≤ T ≤ 25 °C)
Data acquisition system (NI)60 channels, 9–30 V @ 15 W
Blower (Dongkun)Turbo fan, max volume flow rate: 5 m3/min
Table 3. PTC heater experimental conditions.
Experimental ConditionsParameter
Mass flow rate (kg/h)100, 200, 300 *, 400, 500
Temperature (°C)0 *, 10, 20
Voltage (V)240, 270, 300, 330 *
* 300 kg/h, 0 °C, 330 V are the standard conditions for high-voltage PTC heater experiments.
Table 4. Specification of physical model.
CaseCase 1Case 2Case 3Case 4
Fin typePlatePlatePlateEmboss
Fin pitch (mm)2.01.62.02.0
Fin thickness (mm)0.40.40.30.4
Table 5. Thermal properties of respective parts.
PartDensity (kg/m3)Specific Heat (J/kg·°C)Thermal Conductivity (W/m·°C)
PTC thermistor389077936
Guide120010500.23
Terminal8470380116
Insulator16008402
Heat bar2700900218
Fin2680880138
Table 6. Analysis results of high voltage PTC Heater.
DescriptionCase 1Case 2Case 3Case 4
Temperature difference (°C)76.181.572.279.8
Heating capacity (kW)6.376.836.056.68
Pressure drop (Pa)35.239.029.848.7
Table 7. Comparison of heating performance between PTC heaters A and B.
ParameterHeater A (Base Model)Heater B (Enhanced Model)
Input current (A)15.917.1
Power consumption (kW)5.245.63
Temperature difference (°C)60.166.2
Heating capacity (kW)5.025.52
Pressure drop (Pa)40.448.2
Energy efficiency (%)95.798.0
Gravimetric power density (kW/kg)2.793.45

