
Multi-Objective Aerodynamic and Structural Optimization of Horizontal-Axis Wind Turbine Blades


Abstract
:1. Introduction
2. Modeling of the Blade
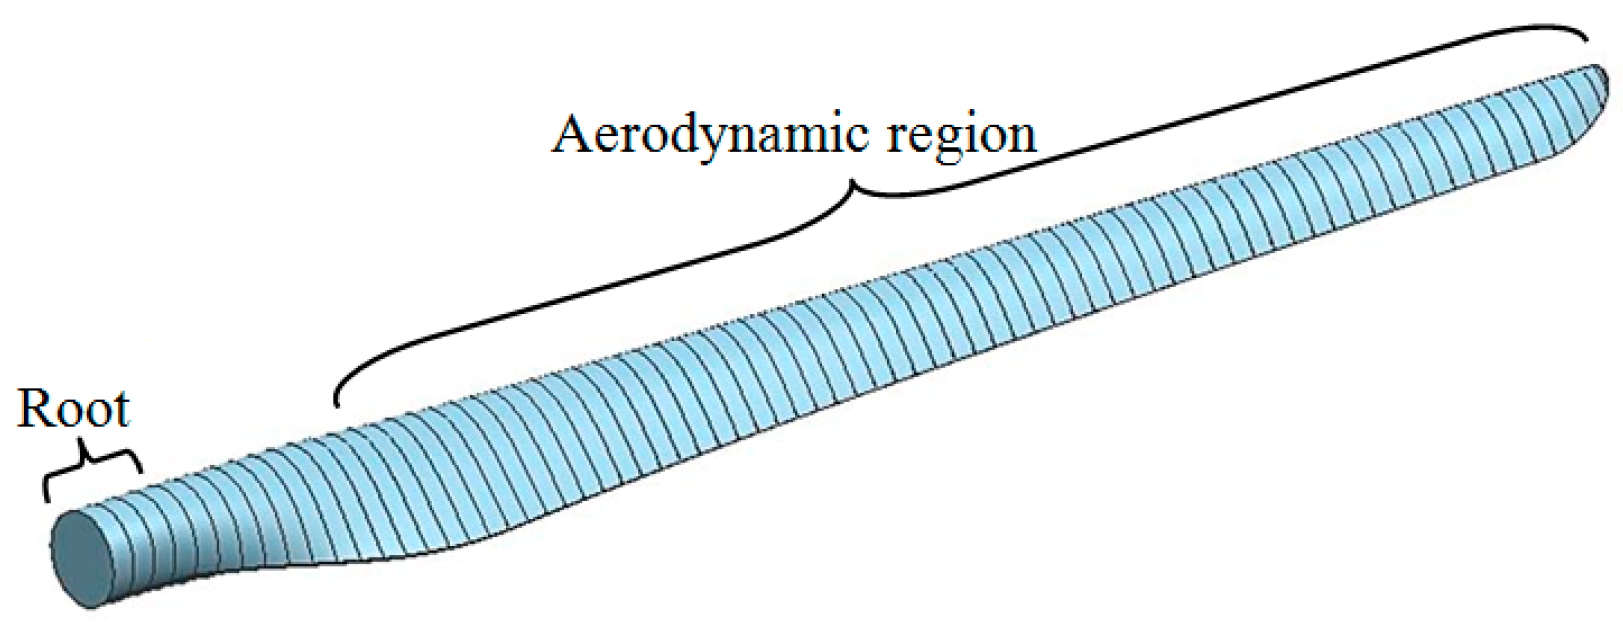
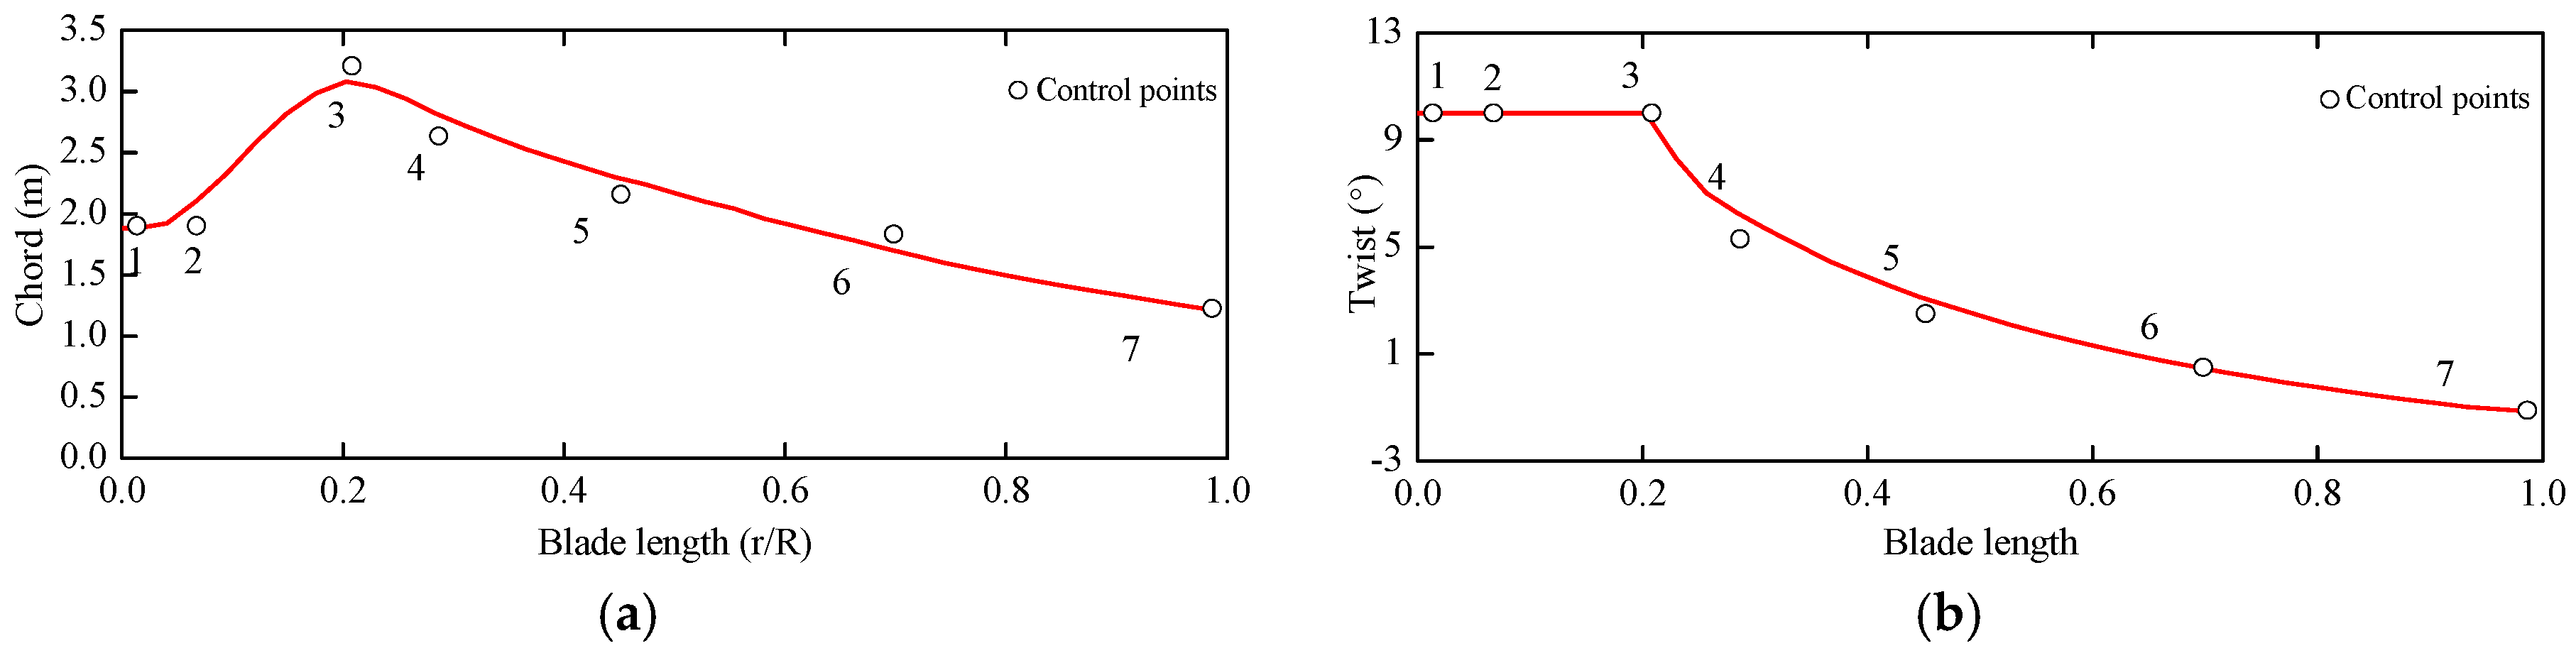
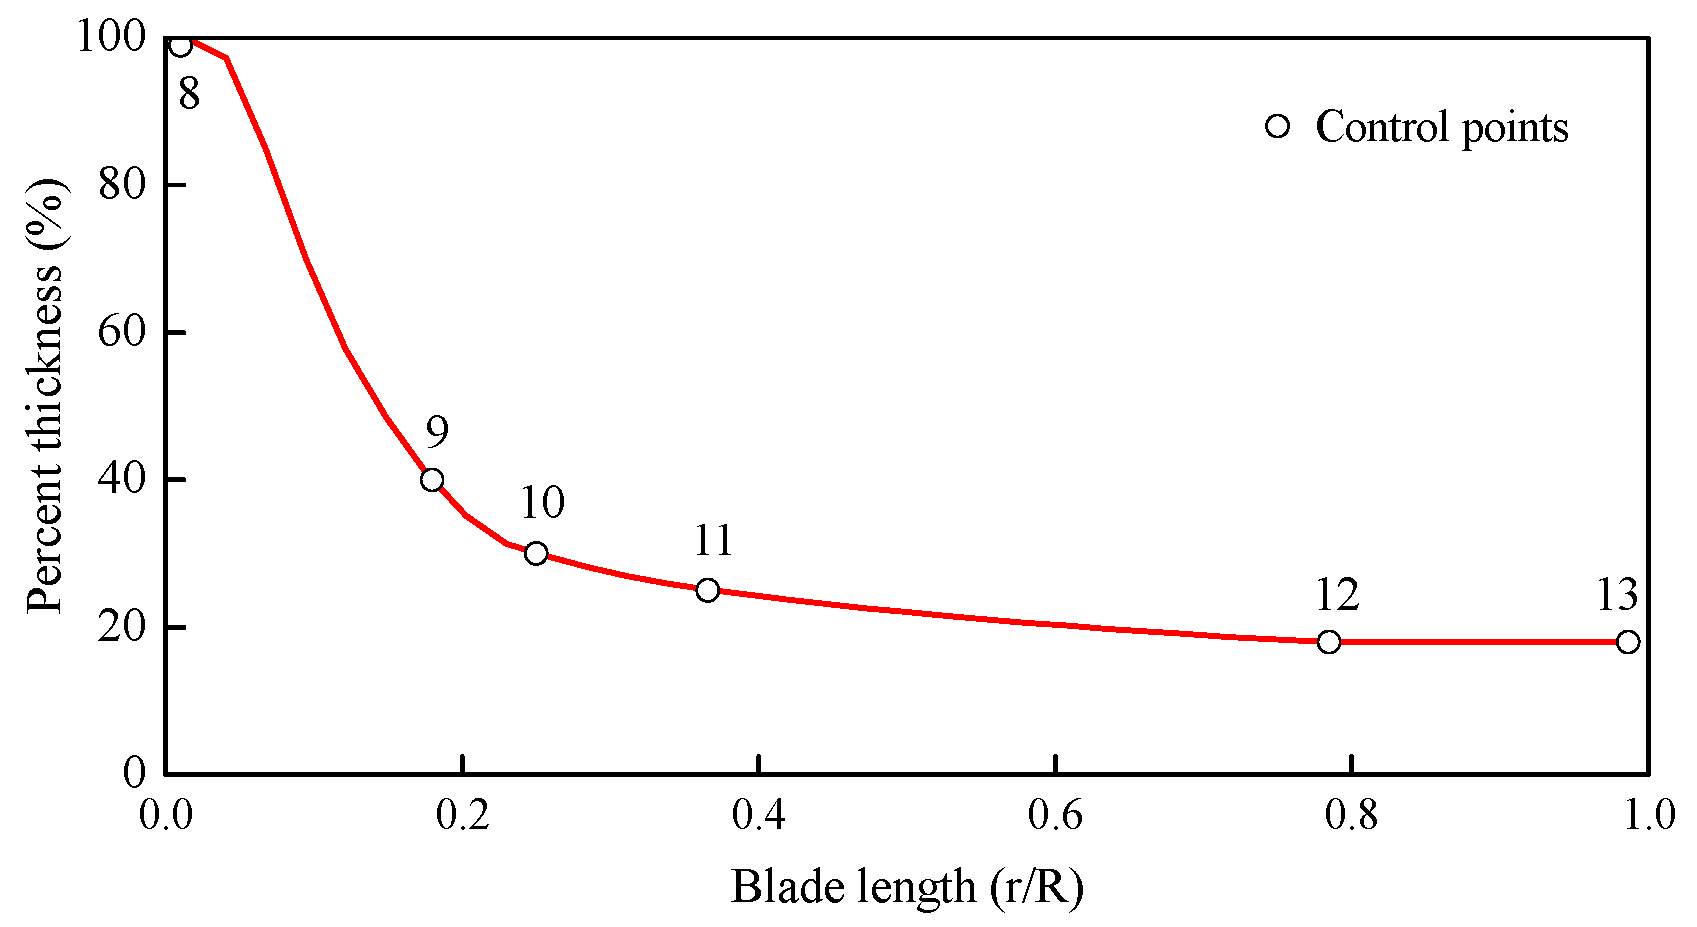
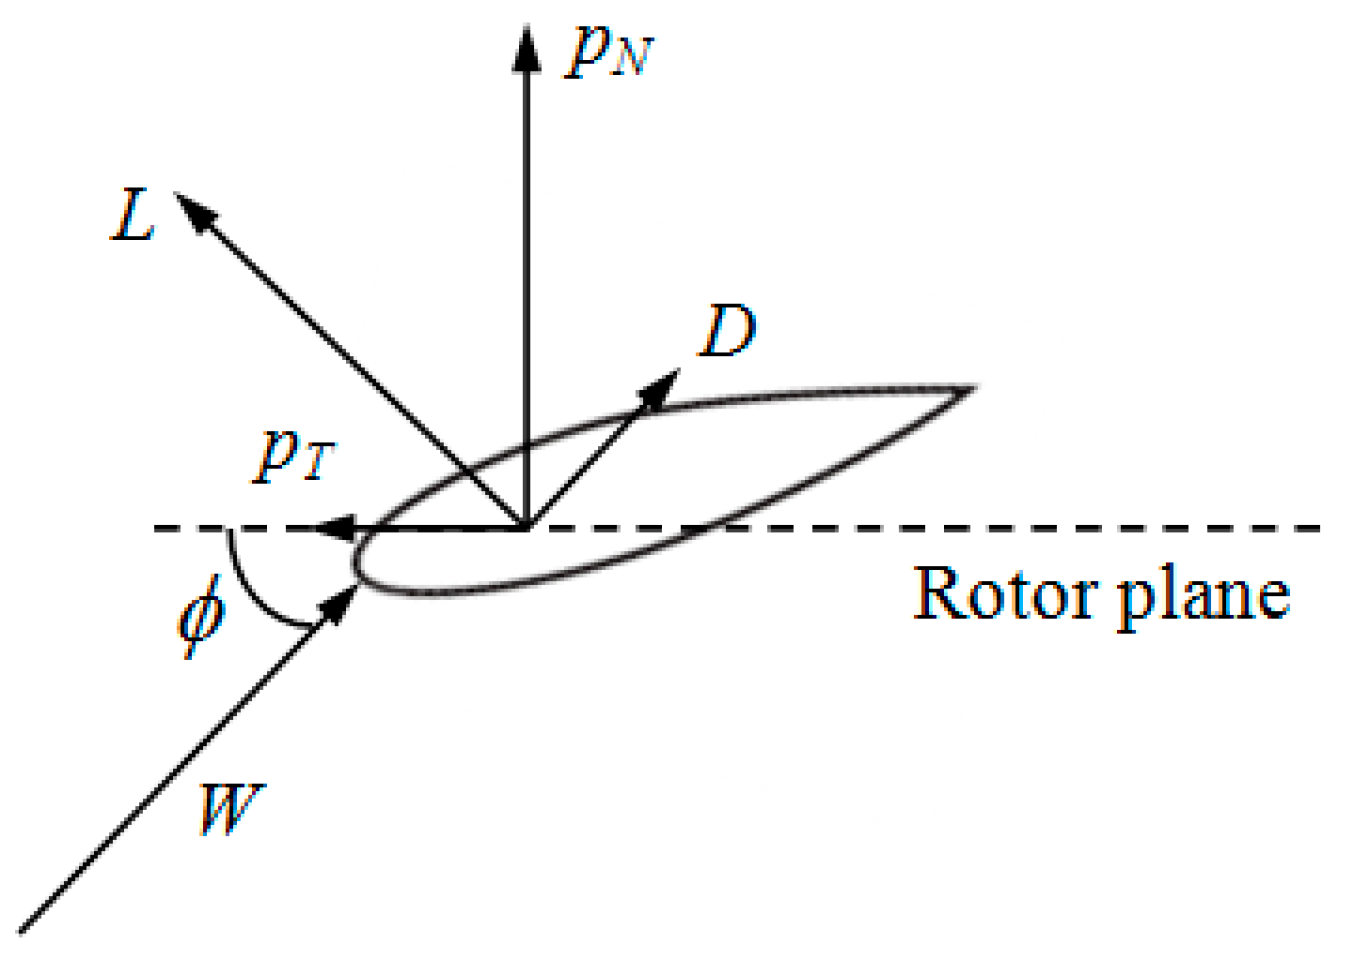
2.1. Geometry Shape and Aerodynamic Loads
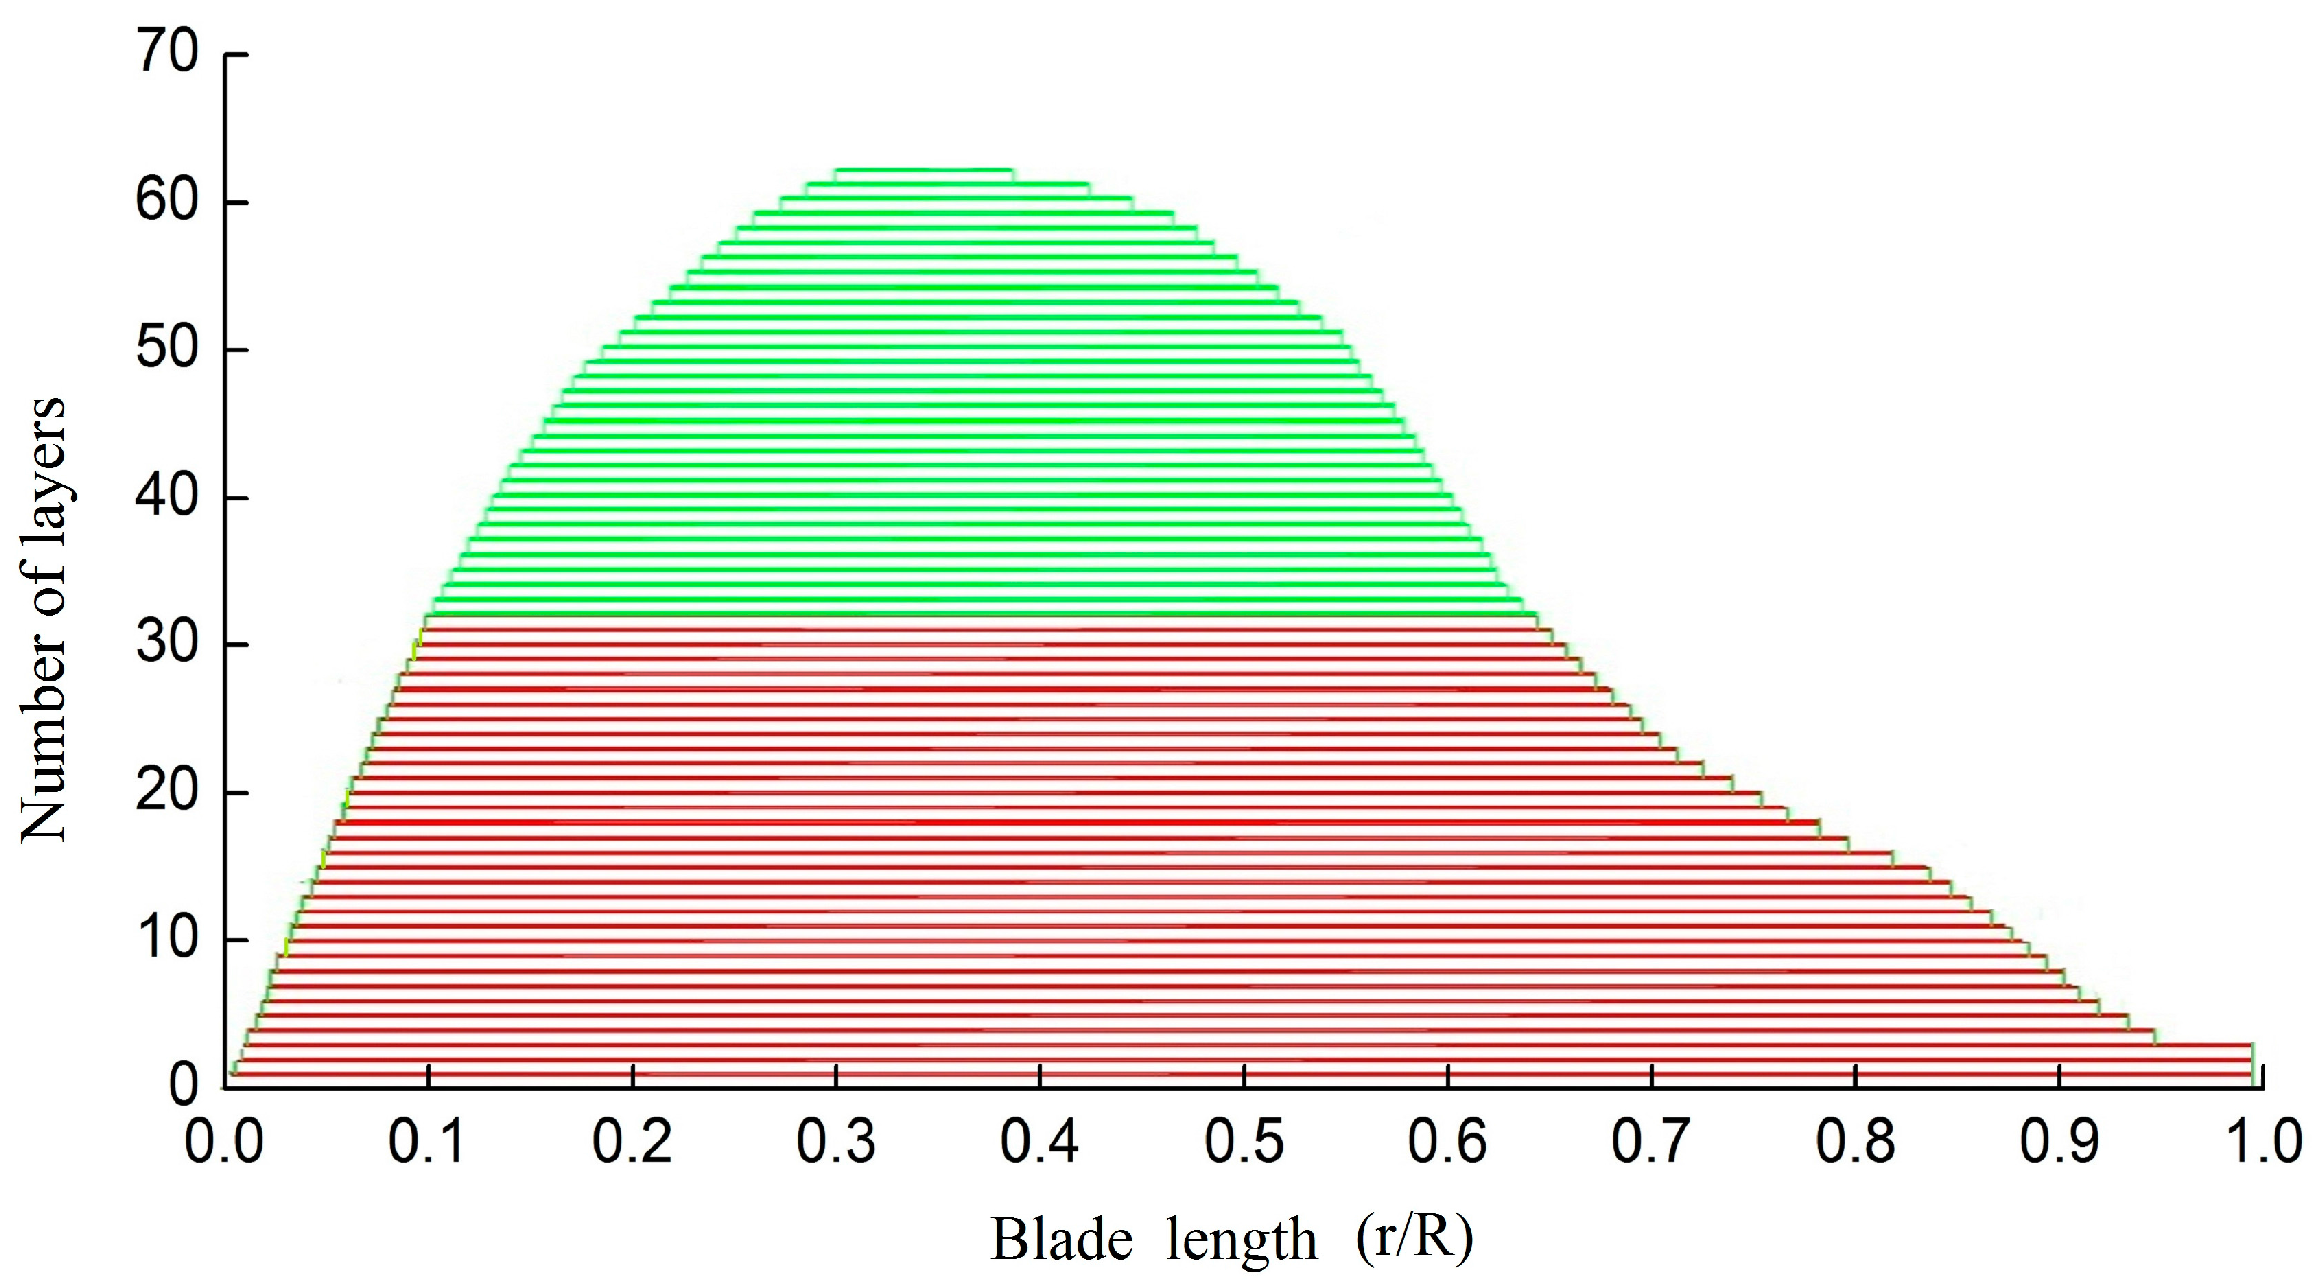
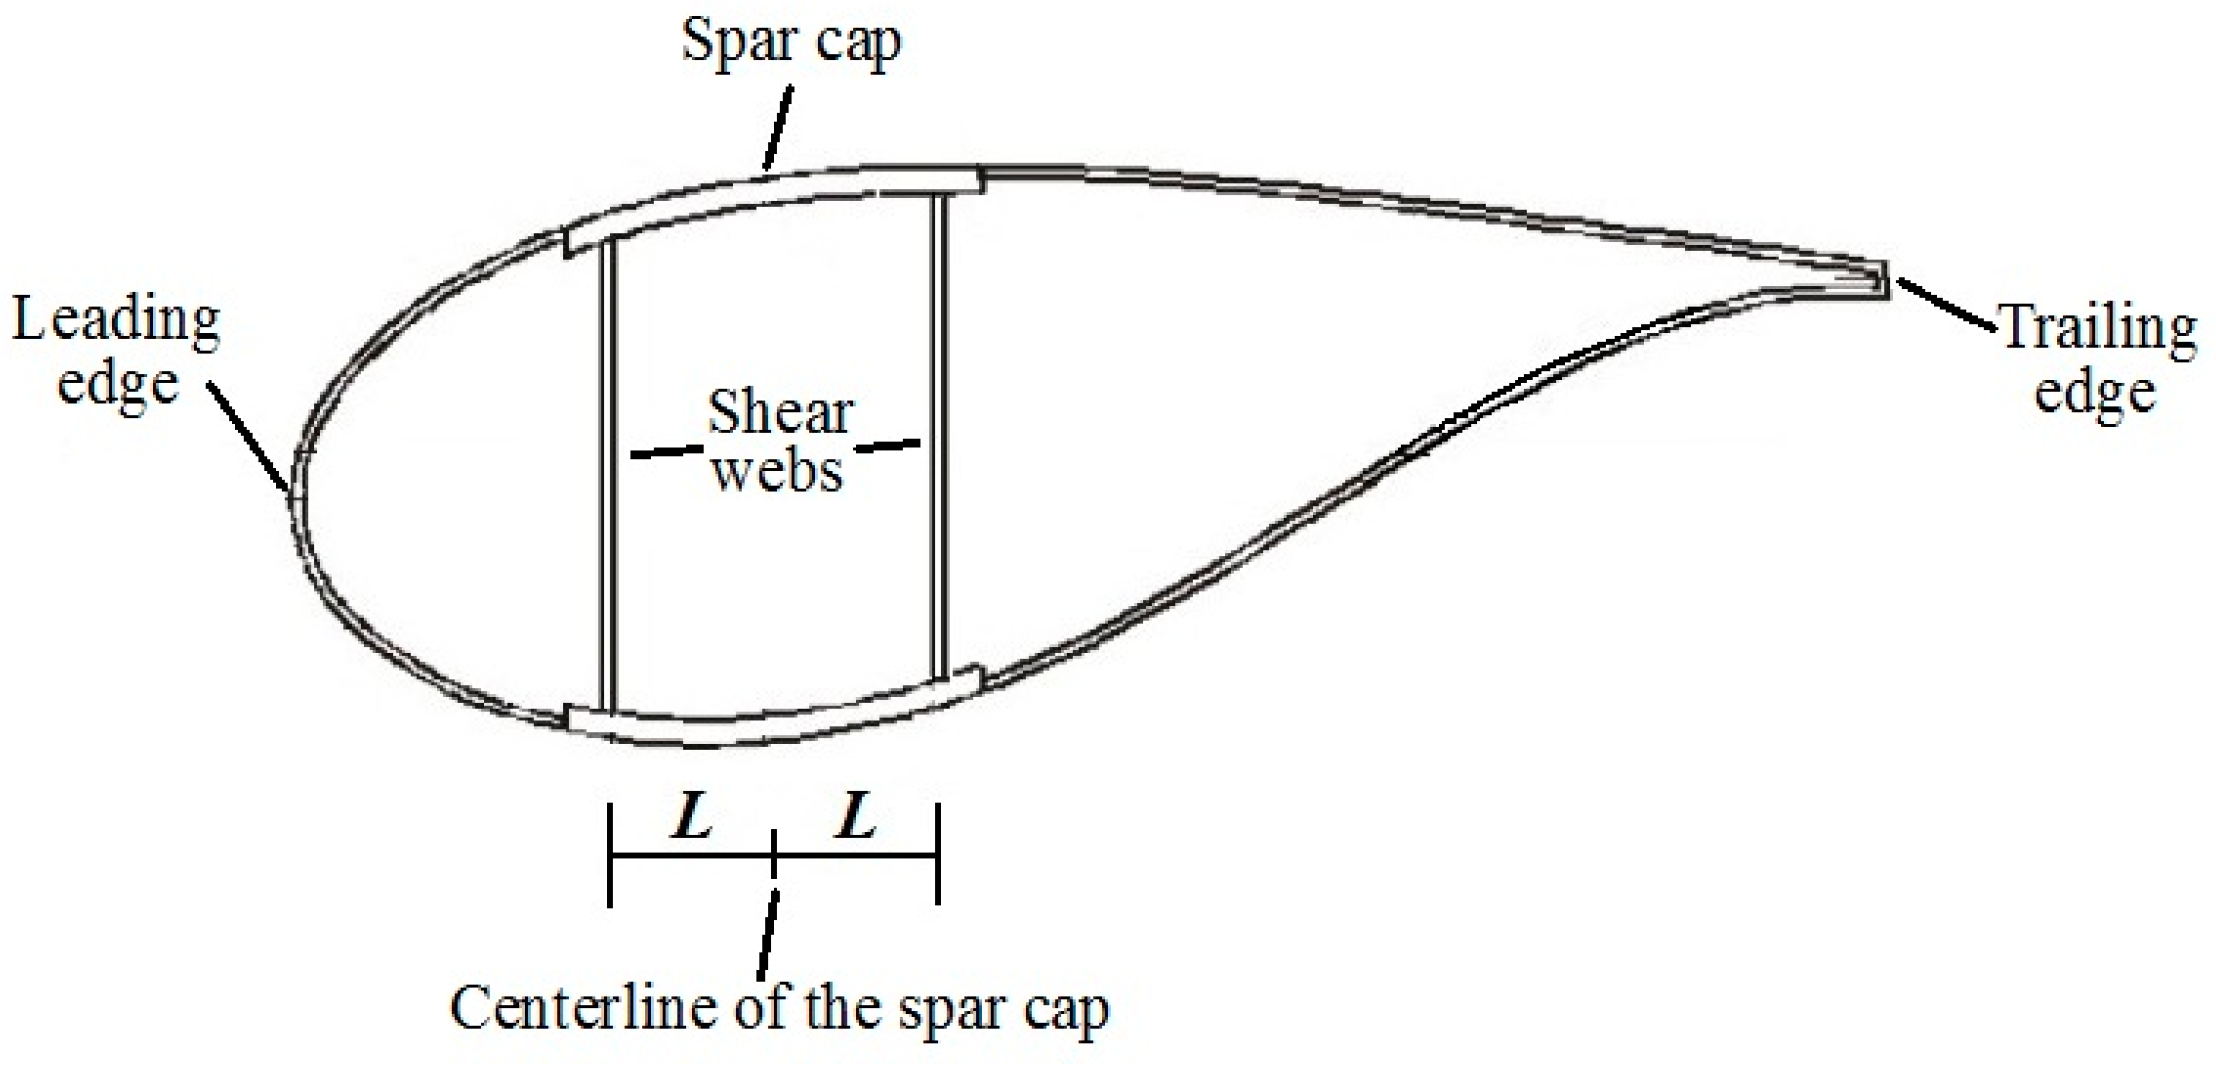
2.2. Structural form and Finite Element Method Model of the Blade
3. Optimization Model
3.1. Design Variables
3.2. Objective Functions
3.3. Constraints
4. Description of the Optimization Procedure
5. Application of the Procedure
5.1. Case Study
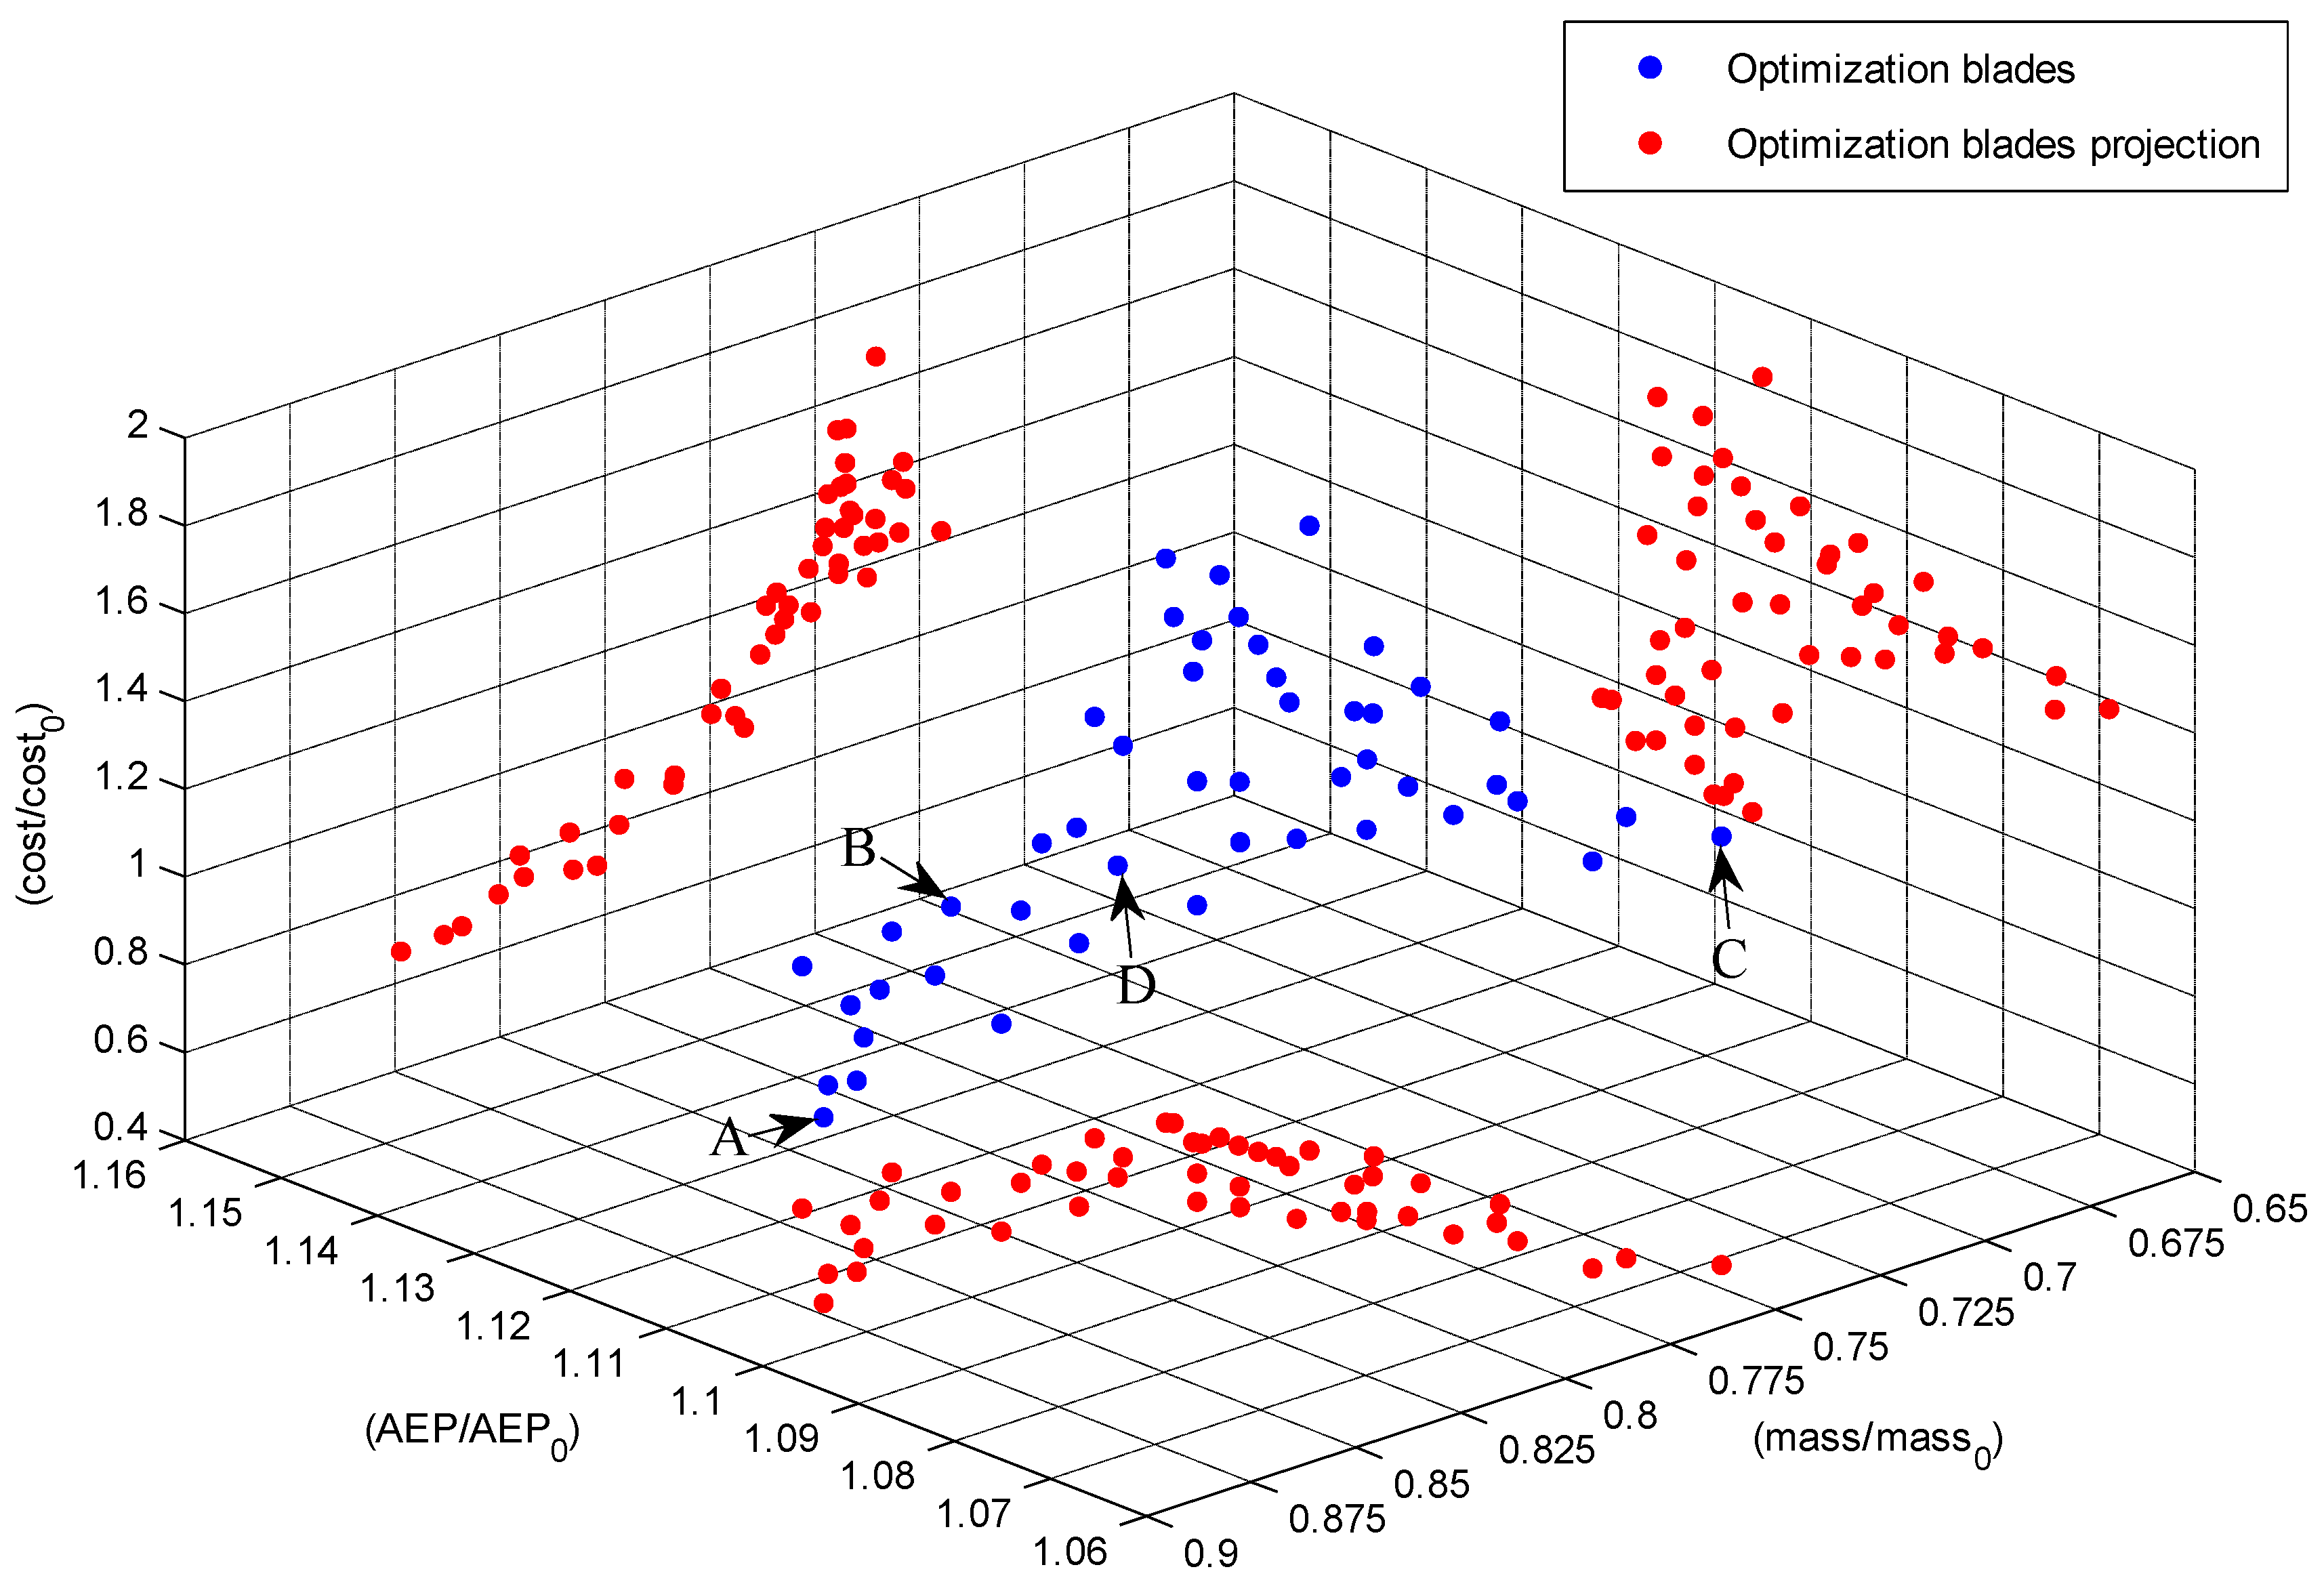
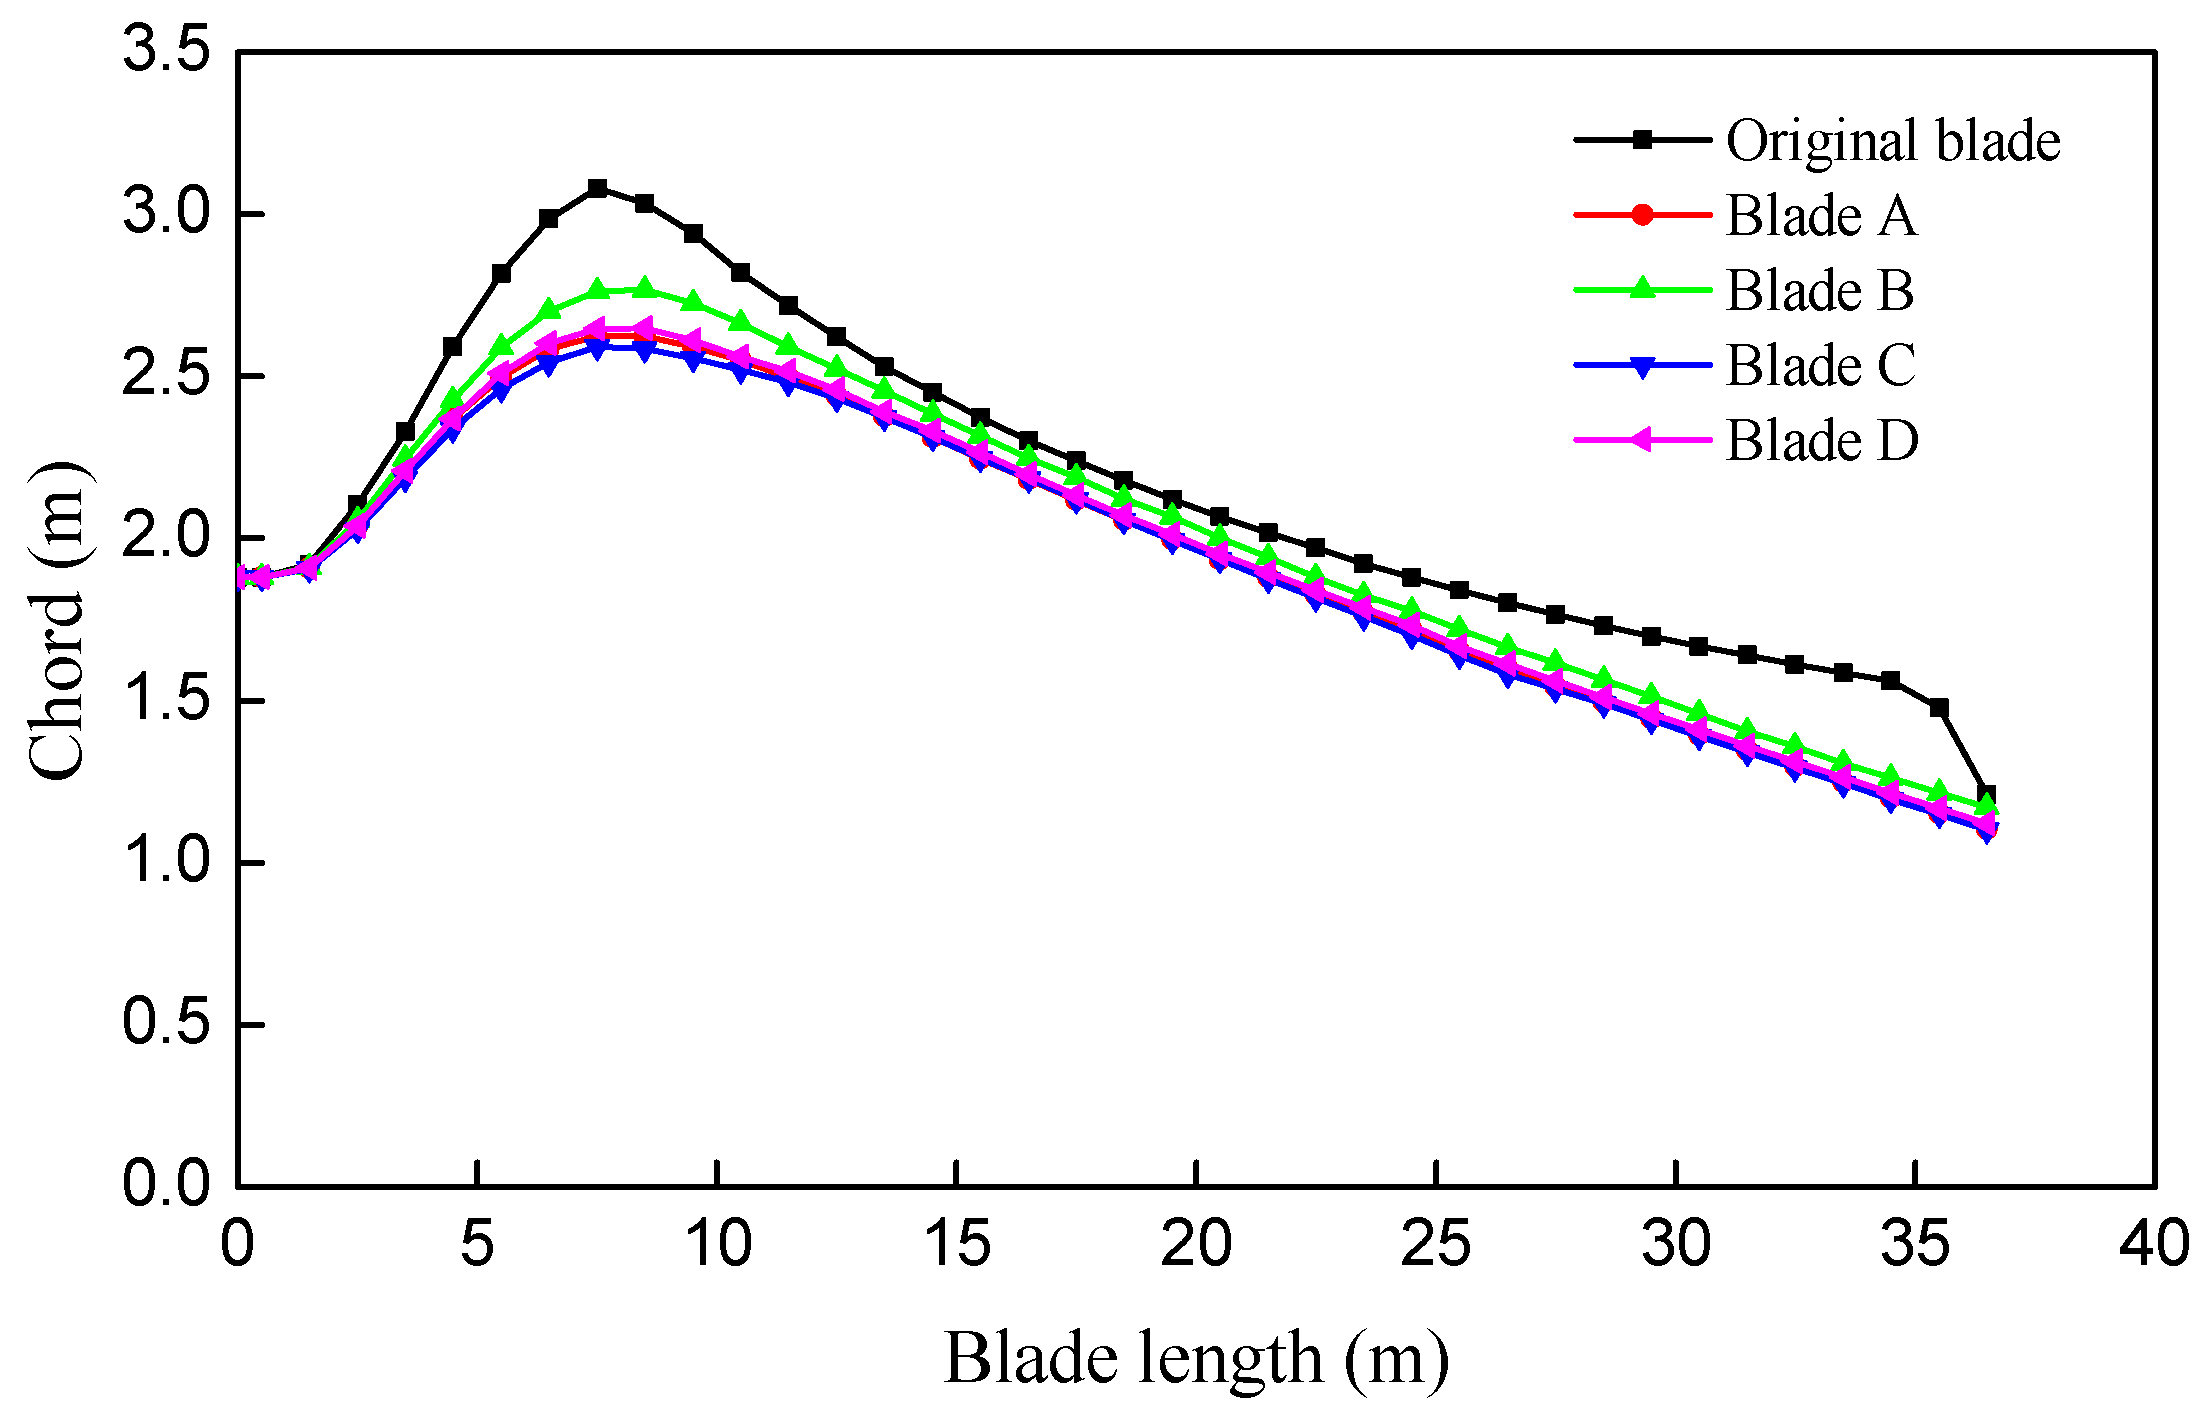
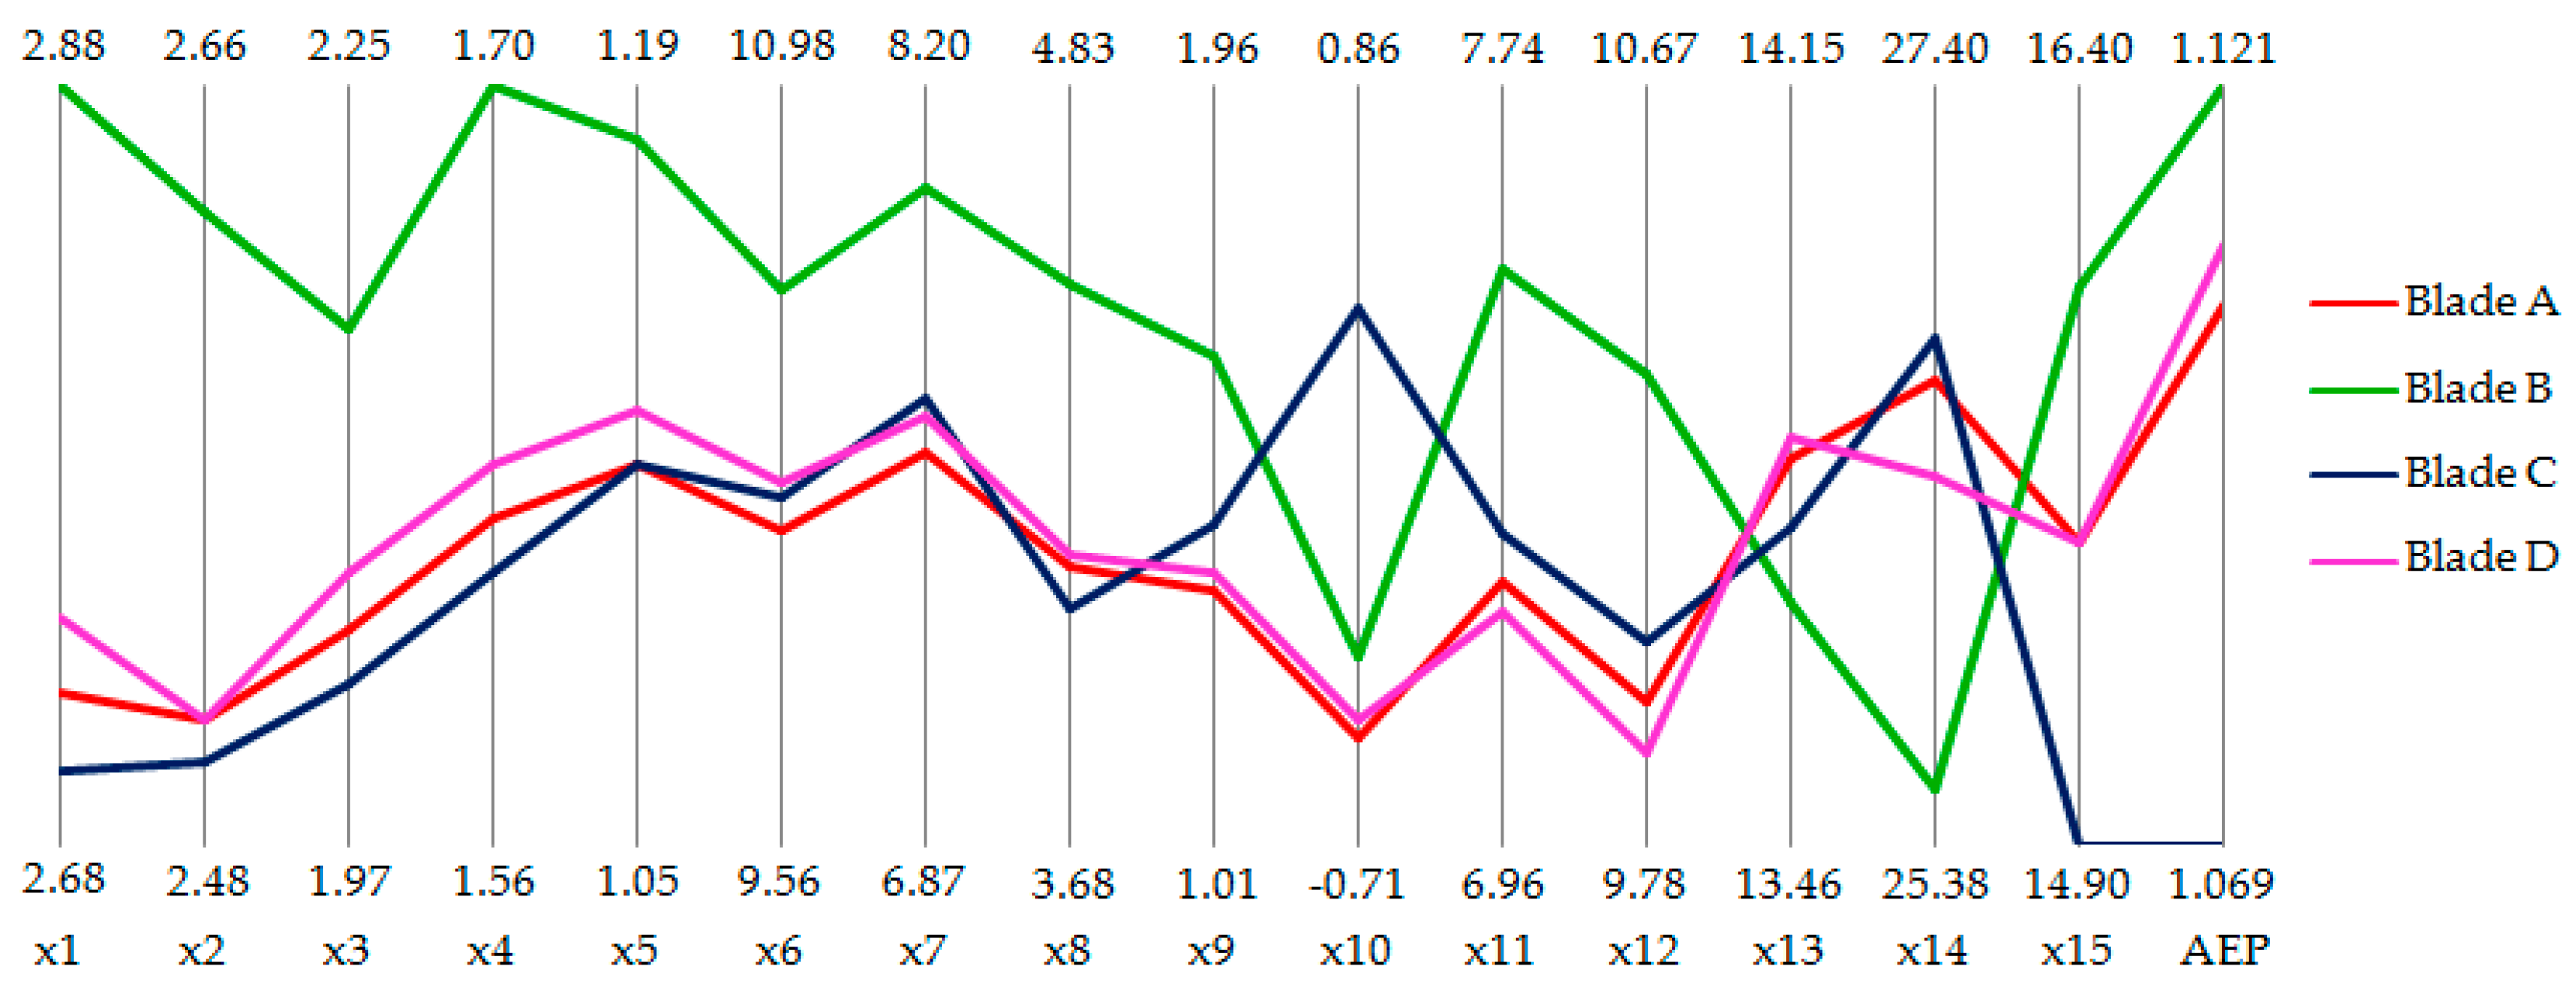
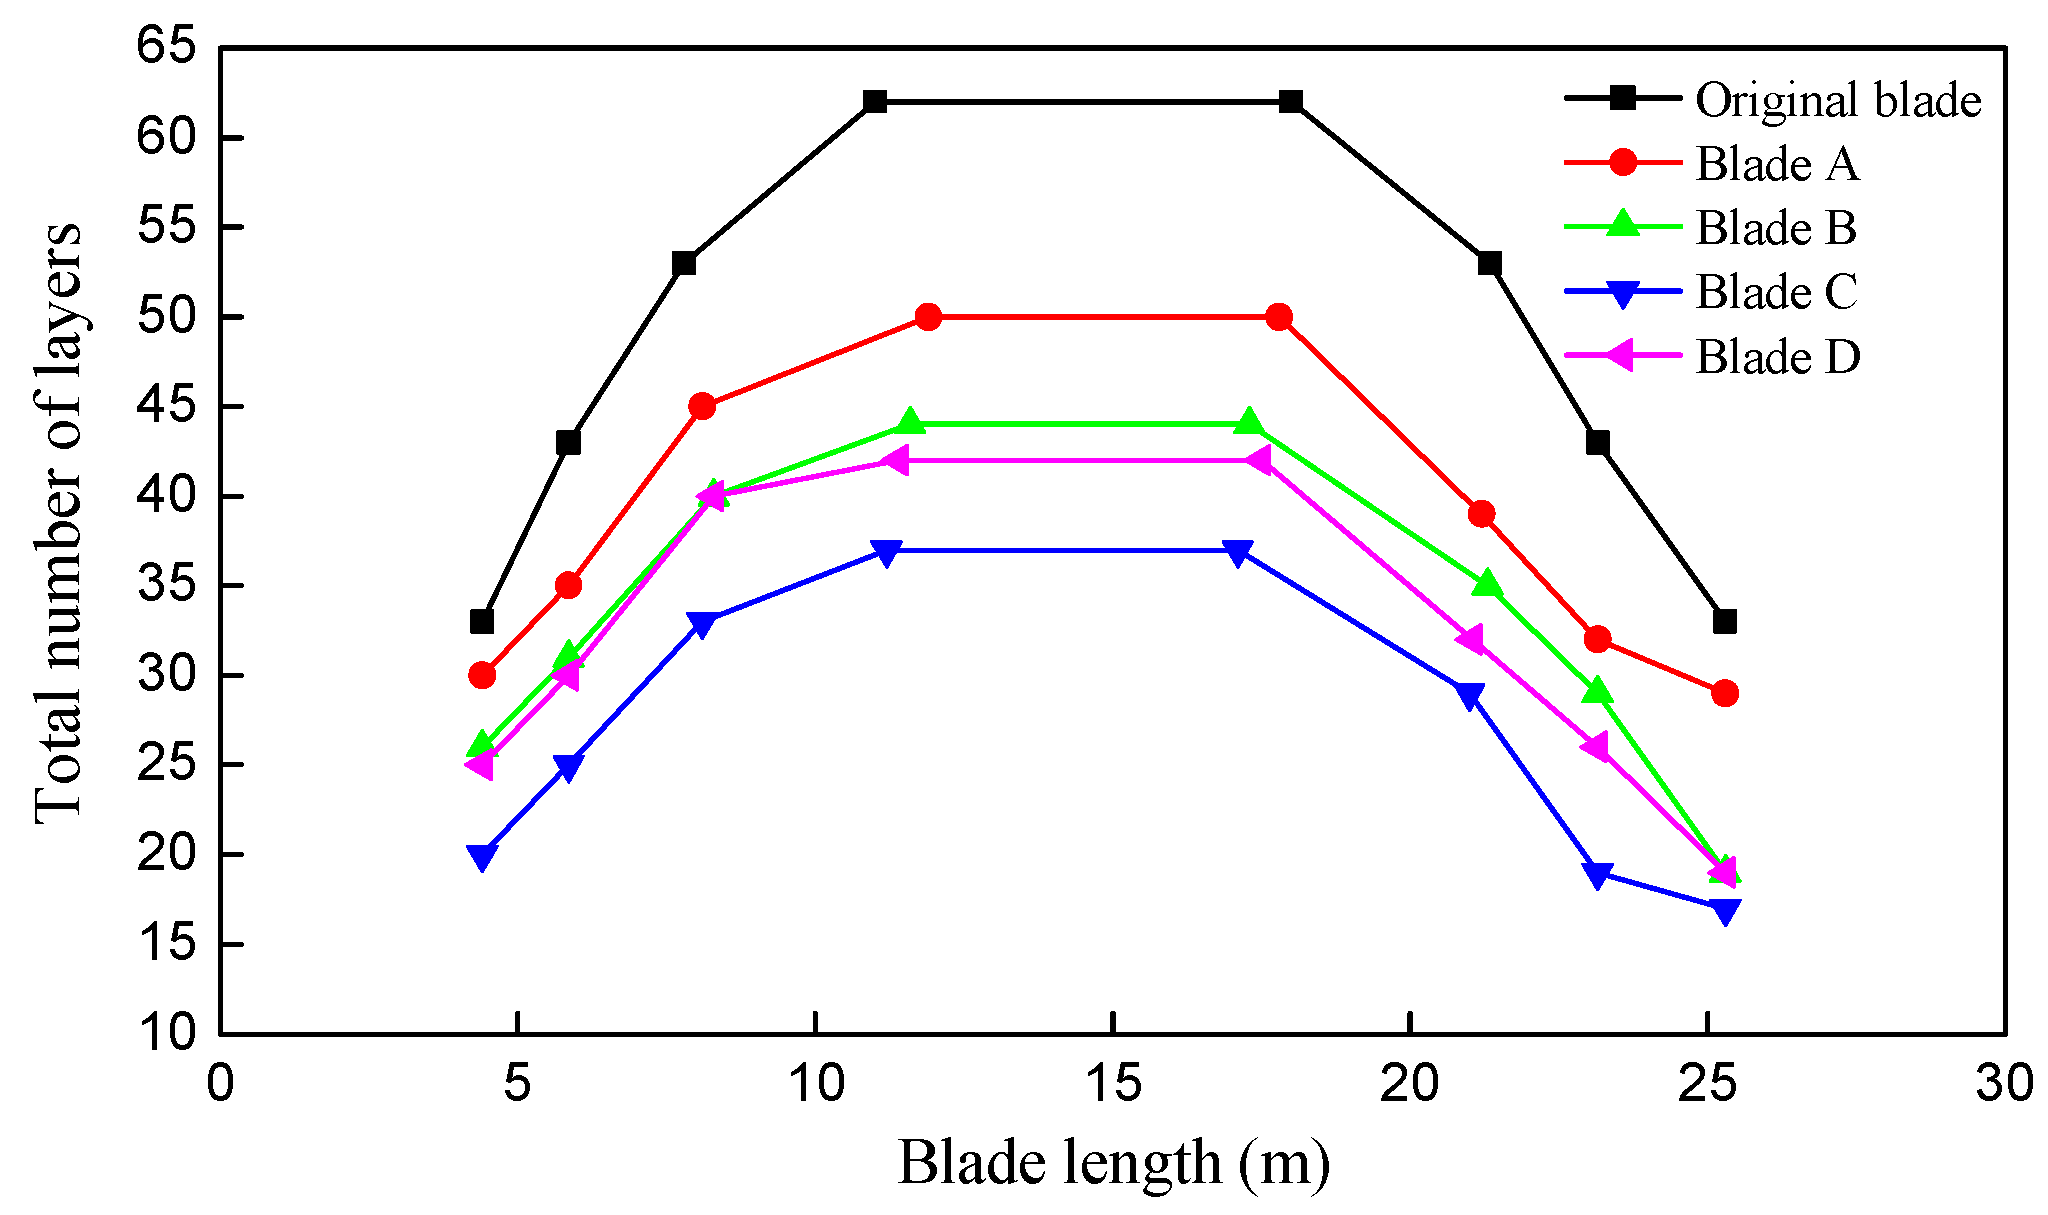
5.2. Results and Discussion
6. Conclusions and Future Work
Author Contributions
Conflicts of Interest
References
- Grujicic, M.; Arakere, G.; Subramanian, E.; Sellappan, V.; Vallejo, A.; Ozen, M. Structural-response analysis, fatigue-life prediction, and material selection for 1 MW horizontal-axis wind-turbine blades. J. Mater. Eng. Perform. 2010, 19, 790–801. [Google Scholar] [CrossRef]
- Wang, T.G.; Wang, L.; Zhong, W.; Xu, B.F.; Chen, L. Large-scale wind turbine blade design and aerodynamic analysis. Chin. Sci. Bull. 2012, 57, 466–472. [Google Scholar] [CrossRef]
- Ashuri, T.; Zaaijer, M.B.; Martins, J.R.R.A.; van Bussel, G.J.W.; van Kuik, G.A.M. Multidisciplinary design optimization of offshore wind turbines for minimum levelized cost of energy. Renew. Energy 2014, 68, 893–905. [Google Scholar] [CrossRef]
- Tchakoua, P.; Wamkeue, R.; Ouhrouche, M.; Slaoui-Hasnaoui, F.; Tameghe, T.A.; Ekemb, G. Wind turbine condition monitoring: State-of-the-art review, new trends, and future challenges. Energies 2014, 7, 2595–2630. [Google Scholar]
- Yurdusev, M.A.; Ata, R.; Çetin, N.S. Assessment of optimum tip speed ratio in wind turbines using artificial neural networks. Energy 2006, 31, 2153–2161. [Google Scholar] [CrossRef]
- Maki, K.; Sbragio, R.; Vlahopoulos, N. System design of a wind turbine using a multi-level optimization approach. Renew. Energy 2012, 43, 101–110. [Google Scholar] [CrossRef]
- Yang, Z.; Yin, M.; Xu, Y.; Zhang, Z.Y.; Zou, Y.; Dong, Z.Y. A multi-point method considering the maximum power point tracking dynamic process for aerodynamic optimization of variable-speed wind turbine blades. Energies 2016, 9, 425. [Google Scholar] [CrossRef]
- Veers, P.S.; Ashwill, T.D.; Sutherland, H.J.; Laird, D.L.; Lobitz, D.L.; Griffin, D.A.; Mandell, J.F.; Musial, W.D.; Jackson, K.; Zuteck, M.; et al. Trends in the design, manufacture and evaluation of wind turbine blades. Wind Energy 2003, 6, 245–259. [Google Scholar] [CrossRef]
- Hu, W.; Han, I.; Park, S.C.; Choi, D.H. Multi-objective structural optimization of a HAWT composite blade based on ultimate limit state analysis. J. Mech. Sci. Technol. 2012, 26, 129–135. [Google Scholar] [CrossRef]
- Locke, J.; Valencia, U.; Ishikawa, K. Design studies for twist-coupled wind turbine blades. In Proceedings of the ASME 2003 Wind Energy Symposium, Reno, NV, USA, 6–9 January 2003; American Society of Mechanical Engineers: New York, NY, USA, 2003; pp. 324–331. [Google Scholar]
- Jackson, K.J.; Zuteck, M.D.; van Dam, C.P.; Standish, K.J.; Berry, D. Innovative design approaches for large wind turbine blades. Wind Energy 2005, 8, 141–171. [Google Scholar] [CrossRef]
- Roczek, A. Optimization of Material Layup for Wind Turbine Blade Trailing Edge Panels. Master’s Thesis, Technical University of Denmark (DTU), Lyngby, Denmark, September 2009. [Google Scholar]
- Zhu, J.; Cai, X.; Pan, P.; Gu, R. Multi-objective structural optimization design of horizontal-axis wind turbine blades using the non-dominated sorting genetic algorithm II and finite element method. Energies 2014, 7, 988–1002. [Google Scholar] [CrossRef]
- Grujicic, M.; Arakere, G.; Pandurangan, B.; Sellappan, V.; Vallejo, A.; Ozen, M. Multidisciplinary design optimization for glass-fiber epoxy-matrix composite 5 MW horizontal-axis wind-turbine blades. J. Mater. Eng. Perform. 2010, 19, 1116–1127. [Google Scholar] [CrossRef]
- Bottasso, C.L.; Campagnolo, F.; Croce, A. Multi-disciplinary constrained optimization of wind turbines. Multibody Syst. Dyn. 2012, 27, 21–53. [Google Scholar] [CrossRef]
- Benini, E.; Toffolo, A. Optimal design of horizontal-axis wind turbines using blade-element theory and evolutionary computation. J. Sol. Energy Eng. 2002, 124, 357–363. [Google Scholar] [CrossRef]
- Wang, L.; Wang, T.G.; Luo, Y. Improved non-dominated sorting genetic algorithm (NSGA)-II in multi-objective optimization studies of wind turbine blades. Appl. Math. Mech. 2011, 32, 739–748. [Google Scholar] [CrossRef]
- Fischer, G.R.; Kipouros, T.; Savill, A.M. Multi-objective optimisation of horizontal axis wind turbine structure and energy production using aerofoil and blade properties as design variables. Renew. Energy 2014, 62, 506–515. [Google Scholar] [CrossRef]
- Zhu, J.; Cai, X.; Gu, R.R. Aerodynamic and Structural Integrated Optimization Design of Horizontal-Axis Wind Turbine Blades. Energies 2016, 9, 66. [Google Scholar] [CrossRef]
- Spera, D.A. Wind Turbine Technology; American Society of Mechanical Engineers: New York, NY, USA, 1994. [Google Scholar]
- Gasch, R.; Twele, J. Wind Power Plants: Fundamentals, Design, Construction and Operation; Springer: Heidelberg, Germany, 2011. [Google Scholar]
- Hansen, M.O. Aerodynamics of Wind Turbines; Routledge: New York, NY, USA, 2015. [Google Scholar]
- Lee, Y.J.; Jhan, Y.T.; Chung, C.H. Fluid–structure interaction of FRP wind turbine blades under aerodynamic effect. Compos. B Eng. 2012, 43, 2180–2191. [Google Scholar] [CrossRef]
- Buckney, N.; Pirrera, A.; Green, S.D.; Weaver, P.M. Structural efficiency of a wind turbine blade. Thin Walled Struct. 2013, 67, 144–154. [Google Scholar] [CrossRef]
- Rotor Blades of Wind Turbine; JB/T10194-2000; China Standards: Beijing, China, 2000. (In Chinese)
- Burton, T.; Jenkins, N.; Sharpe, D.; Bossanyi, E. Wind Energy Handbook; John Wiley & Sons: Chichester, UK, 2011. [Google Scholar]
- Maalawia, K.Y.; Negmb, H.M. Optimal frequency design of wind turbine blades. J. Wind Eng. Ind. Aerodyn. 2002, 90, 961–986. [Google Scholar] [CrossRef]
- Lund, E. Buckling topology optimization of laminated multi-material composite shell structures. Compos. Struct. 2009, 91, 158–167. [Google Scholar] [CrossRef]
- Deb, K.; Pratap, A.; Agarwal, S.; Meyarivan, T. A fast and elitist multiobjective genetic algorithm: NSGA-II. IEEE Trans. Evol. Comput. 2002, 6, 182–197. [Google Scholar] [CrossRef]
- Serrano, V.; Alvarado, M.; Coello, C.A. Optimization to manage supply chain disruptions using the NSGA-II. In Theoretical Advances and Applications of Fuzzy Logic and Soft Computing; Springer: Berlin/Heidelberg, Germany, 2007; pp. 476–485. [Google Scholar]
- Palanikumar, K.; Latha, B.; Senthilkumar, V.S.; Karthikeyan, R. Multiple performance optimization in machining of GFRP composites by a PCD tool using non-dominated sorting genetic algorithm (NSGA-II). Met. Mater. Int. 2009, 15, 249–258. [Google Scholar] [CrossRef]


| Material | E1 (GPa) | E2 (GPa) | G12 (GPa) | v12 | (kg/m3) | Cost (m−3) |
|---|---|---|---|---|---|---|
| GFRP | 42.19 | 12.53 | 3.52 | 0.24 | 1910 | 1 |
| CFRP | 130.00 | 10.30 | 7.17 | 0.28 | 1540 | 10 |
| Location (m) | Airfoil | Chord (m) | Twist (°) | Percent Thickness (%) |
|---|---|---|---|---|
| 0–1.0 | Circle | 1.88 | 10.00 | 100 |
| 6.8 | DU400EU | 3.02 | 10.00 | 40 |
| 9.3 | DU300EU | 2.98 | 7.30 | 30 |
| 13.7 | DU91_W2_250 | 2.51 | 4.35 | 25 |
| 29.8 | NACA_64_618 | 1.68 | −0.33 | 18 |
| 36.5 | NACA_64_618 | 1.21 | −1.13 | 18 |
| Parameter | Value | Unit |
|---|---|---|
| Rotor diameter | 77 | m |
| Number of blades | 3 | - |
| Hub diameter | 3 | m |
| Hub height | 75 | m |
| Rated wind speed | 12 | m/s |
| Rated rotational speed | 19 | rpm |
| Rated power | 1500 | kW |
| Cut-in wind speed | 4 | m/s |
| Cut-out wind speed | 25 | m/s |
| Air density | 1.225 | kg/m3 |
| Parameter | Min | Max | Unit |
|---|---|---|---|
| x1–x5 | 1.0 | 3.3 | m |
| x6–x10 | −2.0 | 12.0 | ° |
| x11–x14 | 6.0 | 30.0 | m |
| x15 | 10 | 25 | rpm |
| x16–x22 | 0 | 65 | - |
| x23–x29 | 0 | 45 | - |
| x30–x33 | 7.0 | 22.0 | m |
| x34 | 0.50 | 0.70 | m |
| x35 | 0.13 | 0.25 | m |
| εdG | - | 0.0050 | - |
| εdC | - | 0.0032 | - |
| dd | - | 5.5 | m |
| λ1 | 1.2 | - | - |
| Fblade-1 | ≤3Frotor − 0.3 or ≥3Frotor + 0.3 | Hz | |
| Parameter | Original Blade | Blade A | Blade B | Blade C | Blade D | Unit |
|---|---|---|---|---|---|---|
| x1 | 3.08 | 2.72 | 2.88 | 2.70 | 2.74 | m |
| x2 | 2.88 | 2.51 | 2.63 | 2.50 | 2.51 | m |
| x3 | 2.30 | 2.05 | 2.16 | 2.03 | 2.07 | m |
| x4 | 1.82 | 1.62 | 1.70 | 1.61 | 1.63 | m |
| x5 | 1.21 | 1.12 | 1.18 | 1.12 | 1.13 | m |
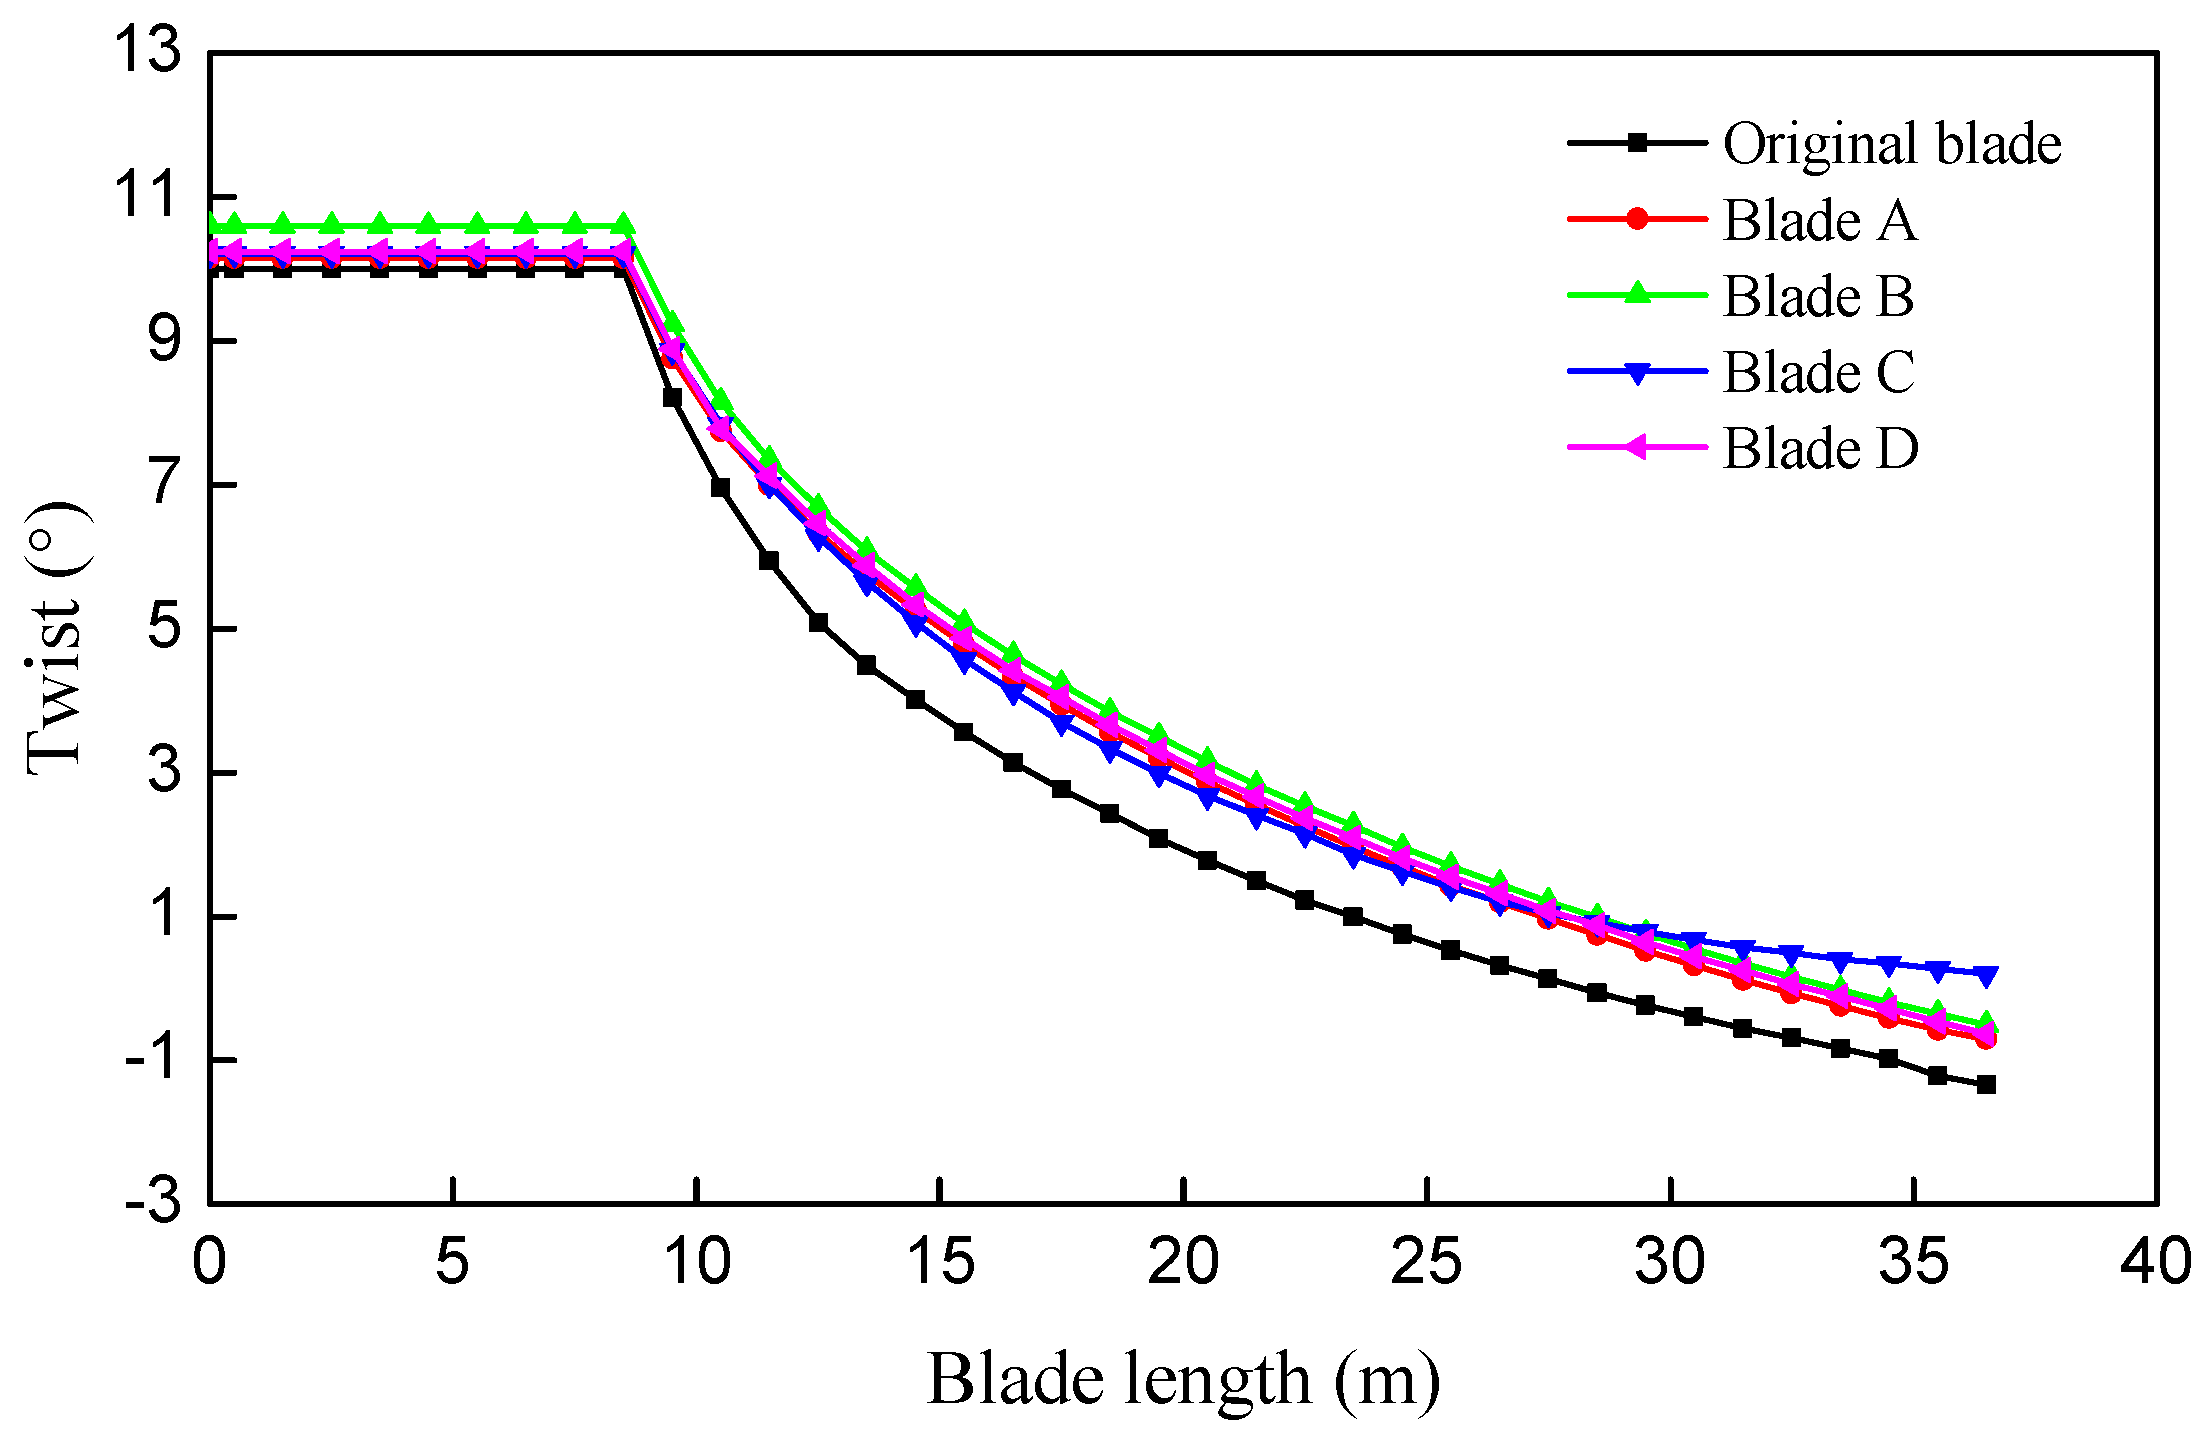
| x6 | 10.00 | 10.15 | 10.60 | 10.21 | 10.24 | ° |
| x7 | 6.64 | 7.56 | 8.02 | 7.65 | 7.62 | ° |
| x8 | 3.14 | 4.10 | 4.53 | 4.04 | 4.12 | ° |
| x9 | 0.43 | 1.33 | 1.62 | 1.41 | 1.35 | ° |
| x10 | −1.13 | −0.49 | −0.32 | 0.40 | −0.45 | ° |
| x11 | 6.75 | 7.23 | 7.55 | 7.28 | 7.20 | m |
| x12 | 9.50 | 9.95 | 10.33 | 10.20 | 9.89 | m |
| x13 | 14.20 | 13.81 | 13.68 | 13.75 | 13.83 | m |
| x14 | 28.95 | 26.62 | 25.53 | 26.73 | 26.36 | m |
| x15 | 19.0 | 15.5 | 16.0 | 14.9 | 15.5 | rpm |
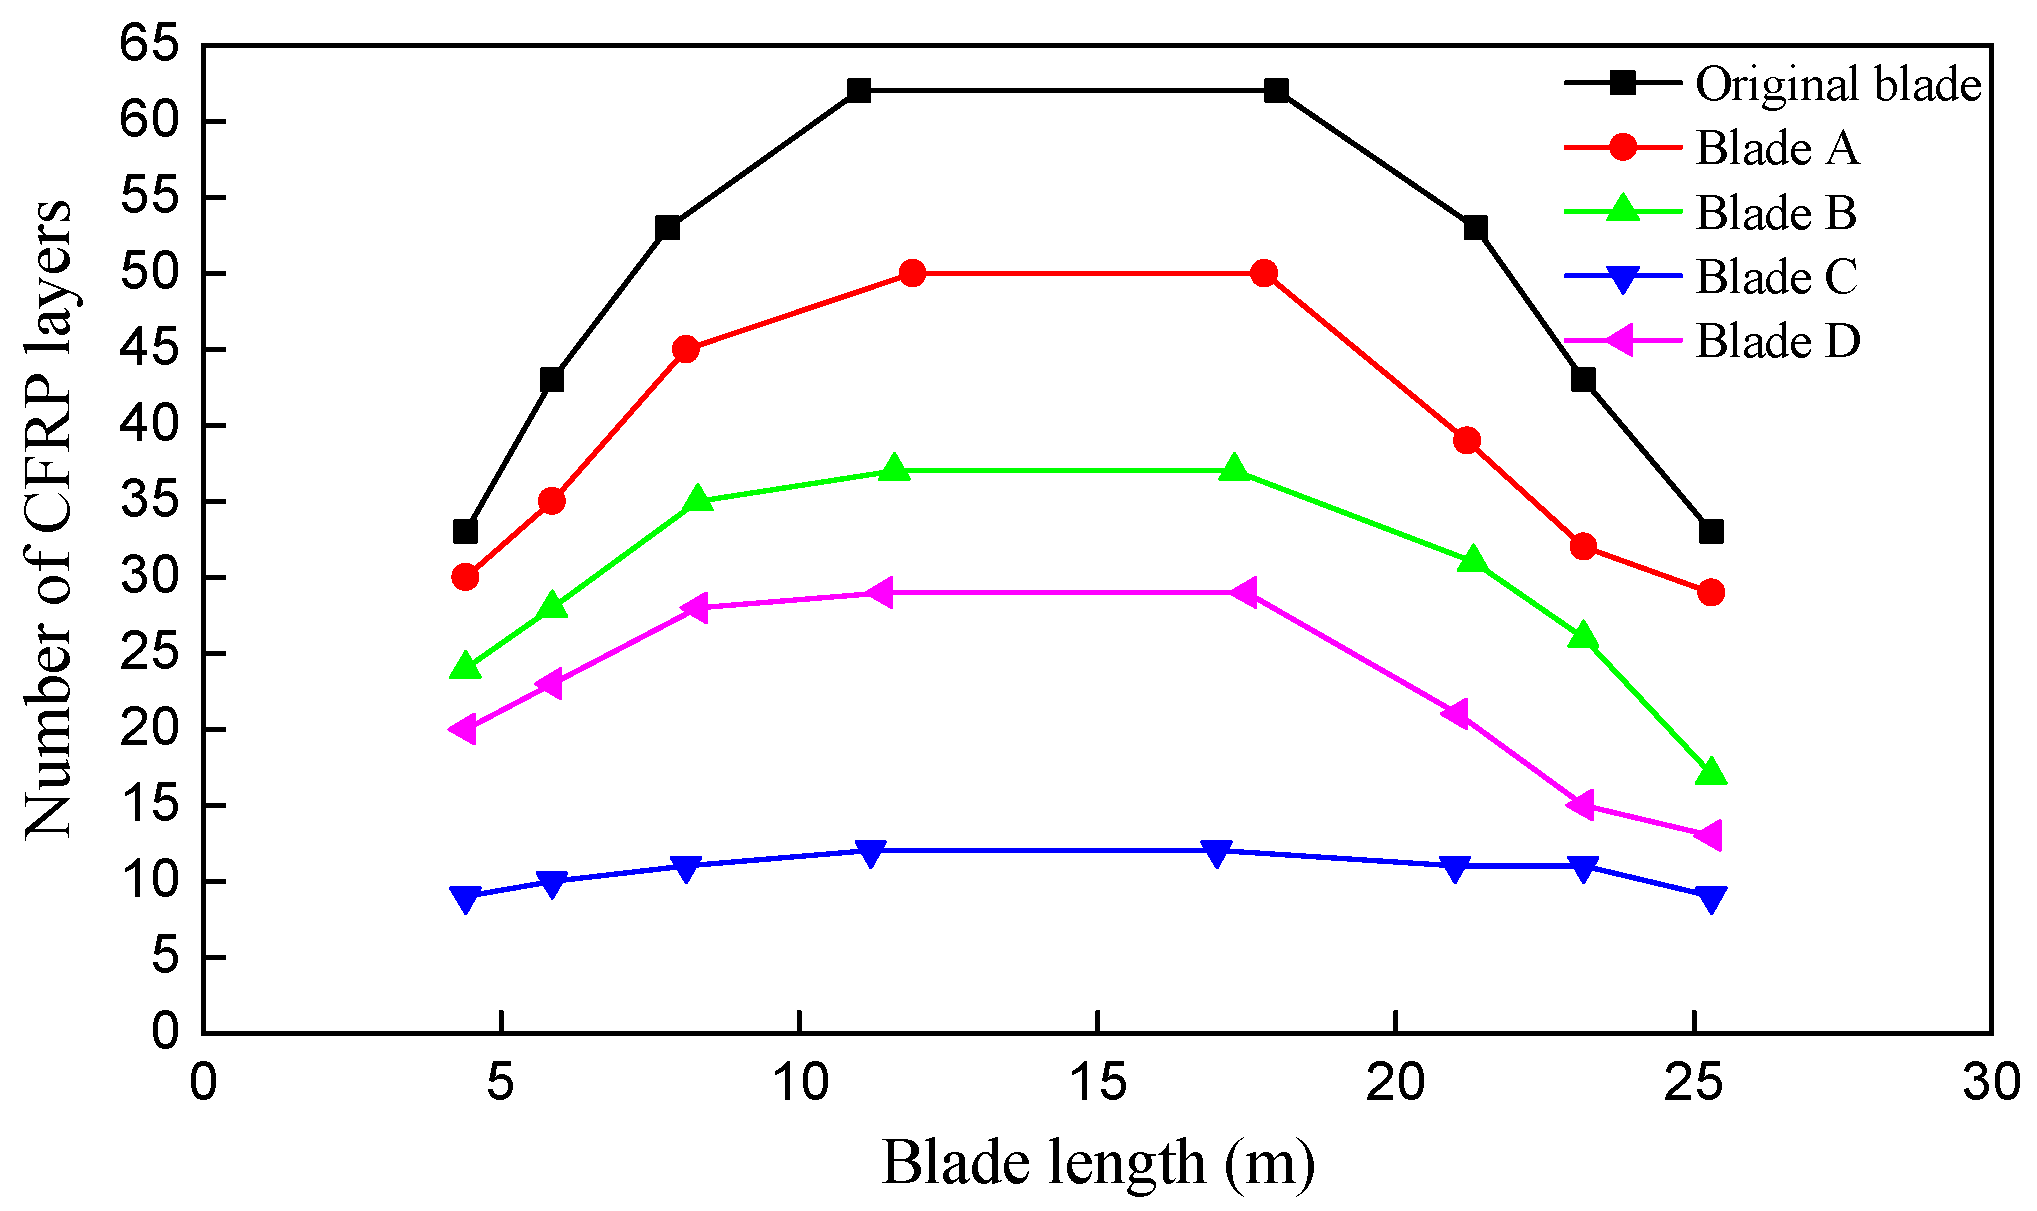
| x16 | 33 | 30 | 24 | 9 | 20 | - |
| x17 | 43 | 35 | 28 | 10 | 23 | - |
| x18 | 53 | 45 | 35 | 11 | 28 | - |
| x19 | 62 | 50 | 37 | 12 | 29 | - |
| x20 | 53 | 39 | 31 | 11 | 21 | - |
| x21 | 43 | 32 | 26 | 11 | 17 | - |
| x22 | 33 | 29 | 17 | 9 | 13 | - |
| x23 | 33 | 0 | 2 | 11 | 5 | - |
| x24 | 43 | 0 | 3 | 15 | 7 | - |
| x25 | 53 | 0 | 5 | 22 | 12 | - |
| x26 | 62 | 0 | 7 | 25 | 13 | - |
| x27 | 53 | 0 | 4 | 18 | 11 | - |
| x28 | 43 | 0 | 3 | 18 | 9 | - |
| x29 | 33 | 0 | 2 | 8 | 6 | - |
| x30 | 7.8 | 8.1 | 8.3 | 8.1 | 8.3 | m |
| x31 | 11.0 | 11.9 | 11.6 | 11.2 | 11.4 | m |
| x32 | 18.0 | 17.8 | 17.3 | 17.1 | 17.5 | m |
| x33 | 21.4 | 21.2 | 21.3 | 21.0 | 21.1 | m |
| x34 | 0.620 | 0.56 | 0.59 | 0.55 | 0.56 | m |
| x35 | 0.188 | 0.196 | 0.214 | 0.201 | 0.199 | m |
| AEP | 1.000 | 1.106 | 1.121 | 1.069 | 1.110 | - |
| Mass | 1.000 | 0.864 | 0.843 | 0.742 | 0.792 | - |
| Cost | 1.000 | 0.823 | 0.953 | 1.376 | 1.109 | - |
| Blade | Optimization Region εmax | Non-Optimization Region εmax | dmax (m) | λ1 | Fblade−1 (Hz) | ||||
|---|---|---|---|---|---|---|---|---|---|
| Case1 | Case2 | Case1 | Case2 | Case1 | Case2 | Case1 | Case2 | ||
| Original | 0.00343 | 0.00429 | 0.00306 | 0.00407 | 3.71 | 4.60 | 2.024 | 2.466 | 1.027 |
| A | 0.00407 | 0.00494 | 0.00389 | 0.00480 | 3.52 | 4.43 | 1.206 | 1.617 | 1.229 |
| B | 0.00255 | 0.00339 | 0.00373 | 0.00473 | 2.73 | 3.80 | 1.510 | 1.845 | 1.567 |
| C | 0.00234 | 0.00318 | 0.00347 | 0.00412 | 1.66 | 2.51 | 1.883 | 2.190 | 1.987 |
| D | 0.00249 | 0.00330 | 0.00363 | 0.00448 | 2.38 | 3.32 | 1.688 | 1.983 | 1.744 |
© 2017 by the authors; licensee MDPI, Basel, Switzerland. This article is an open access article distributed under the terms and conditions of the Creative Commons Attribution (CC-BY) license (http://creativecommons.org/licenses/by/4.0/).
Share and Cite
Zhu, J.; Cai, X.; Gu, R. Multi-Objective Aerodynamic and Structural Optimization of Horizontal-Axis Wind Turbine Blades. Energies 2017, 10, 101. https://doi.org/10.3390/en10010101
Zhu J, Cai X, Gu R. Multi-Objective Aerodynamic and Structural Optimization of Horizontal-Axis Wind Turbine Blades. Energies. 2017; 10(1):101. https://doi.org/10.3390/en10010101
Chicago/Turabian StyleZhu, Jie, Xin Cai, and Rongrong Gu. 2017. "Multi-Objective Aerodynamic and Structural Optimization of Horizontal-Axis Wind Turbine Blades" Energies 10, no. 1: 101. https://doi.org/10.3390/en10010101
APA StyleZhu, J., Cai, X., & Gu, R. (2017). Multi-Objective Aerodynamic and Structural Optimization of Horizontal-Axis Wind Turbine Blades. Energies, 10(1), 101. https://doi.org/10.3390/en10010101