Abstract
In a recent study evaluating the impact of image content on the consistency of eye movements in perceptual experiments (Farnand, 2013) image complexity was inversely related to scanpath consistency. This work involved a qualitative analysis of eye movements along with analysis of the number and duration of fixations. No quantitative analysis of scan path consistency was performed. Recently, Anderson et al. developed a quantitative tool - Recurrence Quantification Analysis - for analyzing eye movement patterns (Anderson et al., 2013). In the present study, the RQA method was applied to the fixation data of Farnand (2013). The results suggest that RQA analysis provides relevant quantitative information regarding the attentional focus of observers viewing pictorial images and, as such, a potentially powerfully tool for eye-tracking studies.
Introduction
Far more information is available to the human visual system than it can possibly handle at any moment, so we are constantly making on-line decisions about what to process. Understanding how humans parse their limited attentional resources can provide important insight into visual perception and cognition. One approach to gaining understanding of visual attention is the study of observers’ eye movements.
Buswell was the first researcher to evaluate and report the impact of image content on where people looked in pictures. He noted that the observer’s viewing objective and past experience influence the allocation of attention (Buswell, 1935, p.144). Yarbus stated, “the sequence and duration of fixations of the elements of the object are determined by the thought process accompanying assimilation of the information.” (Yarbus, 1961, p.190). In most viewing situations, ‘the thought process’ will be affected by the task being performed. In his seminal study of the impact of task on eye, Yarbus (1961) recorded the eye movements of an observer looking at a reproduction of the painting “They did not expect him” after receiving each of seven different instructions. He found that the observer concentrated on faces when asked to estimate ages of the people in the painting, while his eye wandered a great deal more when instructed to simply look at the picture, though the faces still drew attention.
In work to develop a framework for designing stimuli for perceptual experiments, eye tracking was used to evaluate the impact of image content on the consistency of eye movements. This work is described in detail in the dissertation of Farnand (Farnand, 2013) and summarized in a recent publication (Farnand and Fairchild, 2014). In this study, a series of experiments were conducted to evaluate the impact of pictorial scene complexity on fixation and experimental response consistency. (In this study, complexity was defined by the number of objects or areas of interest in an image. The initial experiment conducted in the research served to classify the complexity of the test images.) Analysis of the fixation data - number and duration of fixations on individual Areas of Interest in an image - of these experiments indicated that fixation consistency is tied to the number of possible focal points present; the ‘image complexity.’ The results further suggested that image complexity was inversely related to qualitative scanpath consistency. Images having one or a few possible focal points tended to have higher than average scanpath consistency and images having many or no possible focal points had lower than average consistency. These results are shown in Figure 1.
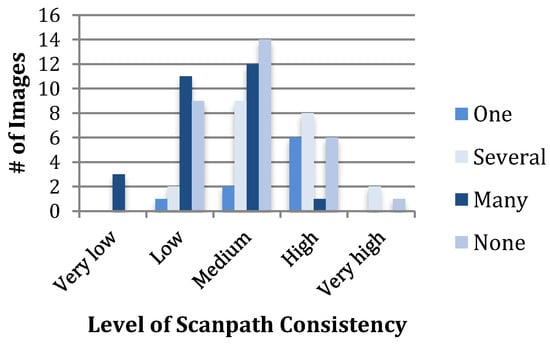
Figure 1.
The number of images in Farnand (2013) that were determined qualitatively to have Very Low to Very High scanpath consistency grouped by presence of focal points. ‘Several’ indicates 2-4 focal points while ‘Many’ indicates five or more.
In all of these studies, however, observations regarding scanpath consistency were based primarily on qualitative, visual assessment rather than quantitative metrics. Recently, Anderson et al. provided a more rigorous approach for evaluating scanpath consistency. Anderson et al. adapted techniques used in complex systems data analysis (Marwan & Kurths, 2002) to create a tool they refer to as Recurrence Quantification Analysis for analyzing eye movement patterns (Anderson et al., 2013). They state that their method allows for determining image positions that are repeatedly fixated and for identification of repeated sequences in scanpaths using ‘recurrence’ and ‘determinism’ metrics, respectively. For recurrence, the fixation data are analyzed to determine how often given image positions are re-fixated. The metric is defined as the percentage of recurrent fixations, or:
 where N is the number of fixations and R is the number of recurrent fixations.

Marwan and Kurths and Anderson et al. use Recurrence plots as a tool for visualization of recurrence data. Figure 2 is an example of a recurrence plot. Note that the upper and lower triangles of this plot mirror each other over the positive diagonal (i.e., fixations are self-recurrent). Recurrence data can, therefore, be evaluated either in the upper or lower triangle of the plot.
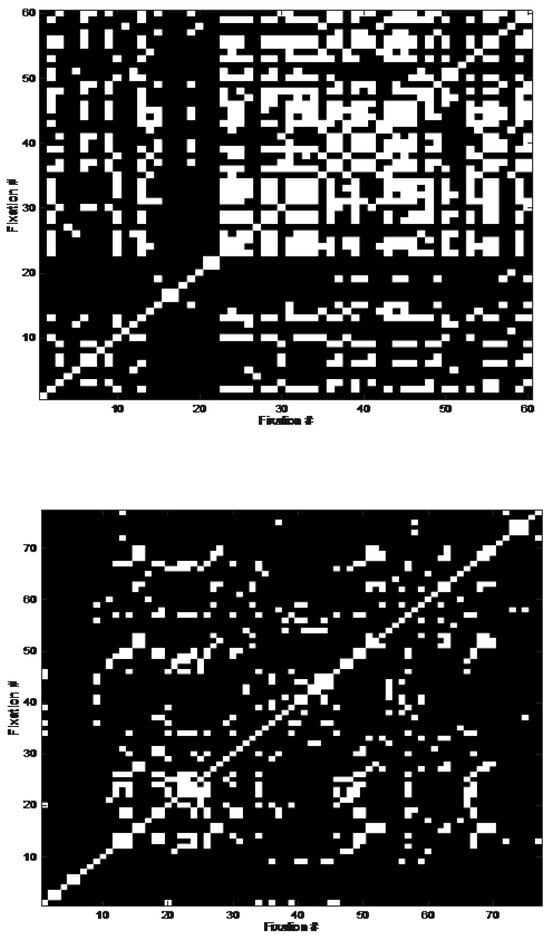
Figure 2.
The Recurrence plot generated by the rqa function in Matlab® for the closely-cropped renditions of the Flowers (top) and Clown (bottom) scenes. The Flowers scene is in the fifth row of the Still Life scenes in Figure 3 and the Clown scene is in the fourth row of the Interesting scenes. Note how fixations were highly concentrated on one area from fixation #23 through the end of the observation in the Flowers image. In the Clown image, note the diagonal line of fixations from (66,25) – (69,28). Although this image had a fairly low recurrence value, its determinism value was relatively high.
Dots that form diagonal lines on the recurrence plot, such as fixations (66,25) – (69,28) in Figure 2, represent repeating sequences of gaze patterns. The metric proposed by Anderson et al. to quantify these repeating sequences as determinism, which is defined as the percentage of recurrent points that fall on diagonal lines:
 where DL is the number of fixations that fall on diagonal lines of two points or more (L=2) and R is the number of recurrent fixations.

Anderson et al. found relationships between image content and recurrence and between determinism and task. They found that the recurrence values obtained for exterior scenes were lower and that determinism for interior scenes was higher than for other scene types. Also, they found that determinism was higher for task-based viewing than for free viewing. Based on their results, they suggest that the impact of scene content could be evaluated using the RQA method. In that work, they predicted that determinism would correlate with image ‘clutter,’ a term used by Rosenholtz et al. (2007) to describe image complexity. In subsequent research Wu et al., (2014) found that complexity and clutter affected fixations in scenes with meaningful content (social scenes and landscapes). They found that social scenes had higher recurrence and determinism relative to landscape scenes. They suggest that complex scenes promote ‘random exploration’ while simpler scenes resulted in structured viewing of a few objects. To further assess the relationship of complexity and eye movements, the RQA method was applied to the results of Farnand (2013).
Methods
Experiment 1 - Recurrence and Image Complexity
In the study by Farnand (2013) on designing stimuli for perceptual experiments, 24 observers were shown 29 of the images shown in Figure 3. Each row in Figure 3 includes three renditions of a scene: the full scene, a mid-cropped, and a closely-cropped image. One image from each row of each category in Figure 3 was used in the experiment. The images were 1660x1040 pixels in size.
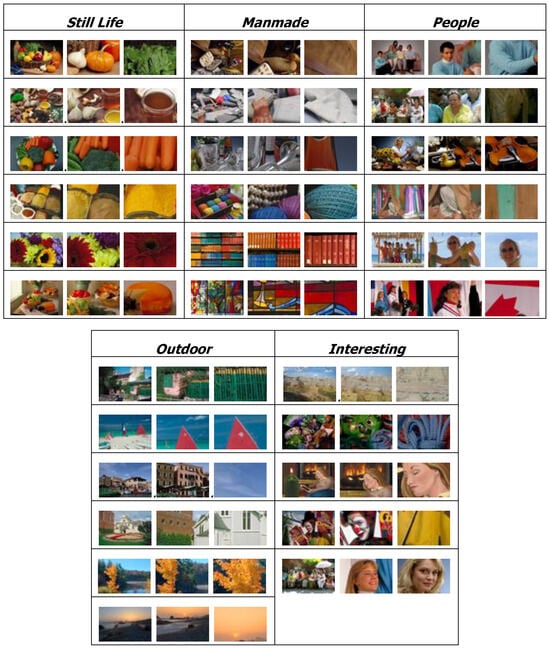
Figure 3.
Images used in Farnand, 2013. For each scene, the full scene, a mid-cropped, and a closely-cropped rendition were included. The majority of the scenes were obtained from RIT’s Corel® image database. Lexmark® contributed the Paint Girl scene, Row #3 in the People category. The last two scenes in the Outdoor category and the first in the Interesting category are images from Dr. Mark Fairchild’s HDR image database. The Firelight scene, third row in the Interesting category, was a painting (artist unknown) included in a study of fine art reproduction processes. And the scenes in the first four rows of the Manmade category and the second in the Interesting category are images included in international standards for assessing image quality.
The observers’ eye movements were tracked with an SMI RED250 eye-tracker with Experiment Center, and BeGaze software. Observers were seated in a fixed chair such that their viewing distance was approximately 60-70cm. Though this was not specifically controlled, little movement was possible without losing the eye track. The images were presented on a Dell Model E2210 22” LCD display. After the image was displayed for three seconds, the observers were asked to verbally describe the scene content in up to five words. The three second time interval and ‘up to five word’ description instruction were selected to be consistent with the protocol used by Einhauser et al. (2008). A gray screen (R=G=B=142 digital counts) was present while the observers provided their verbal responses.
The observers comprised RIT students, interns, and staff. Most had limited experience with eye-tracking. None had previous experience with formal image analysis. Informed consent was obtained from all participants and their parents, if under the age of eighteen.
The research conducted in Farnand (2013) included three crops of 29 scenes. However, the study results suggested that the presence of a focal point in the image was more closely correlated with consistent fixation results than the scene cropping level. This stemmed from the tendency for scenes viewed from afar to blend into one significant object while one object viewed too close lacked a point of focus, and because human faces, even painted ones, draw fixations, regardless of scene complexity.
Consequently, for the present study, the presence of possible focal points in each image presence of a focal point was used rather than crop. Focal point presence was assessed qualitatively and quantitatively. Qualitatively, it was assessed on a scale of 1 to 5 where ‘1’ represented a single focal point, ‘2’ a few possible focal points, ‘3’ many possible focal points, ‘4’ a few image areas but nothing that constituted a focal point, and ‘5’ represented an image having a single uniform area with no opportunity for focal points. Results from earlier research on the impact of instructions on the number of areas identified as important in photographic images (Farnand and Fairchild 2012, Farnand 2013) were used to classify the images. Images that had one or two areas identified as important by observers were classified as a ‘1’ or a ‘5.’ Images having three or four areas were classified as either a ‘2’ or a ‘4’. And images having five or more important areas were classified as a ‘3’. The lead author determined whether an image had one or no focal points (a ‘1’ or a ‘5’) and whether an image had a few focal points or a few image area but no focal points (a ‘2’ or a ‘4’). Figure 4 illustrates examples of each of these ratings.
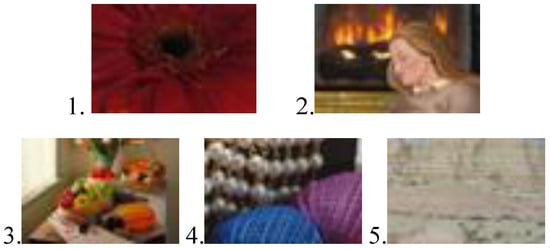
Figure 4.
Examples of 1-5 levels of focal point presence rating, top to bottom and left to right
Quantitatively, focal point presence was evaluated relative to the consistency of the main area of interest as determined from the Farnand (2013) fixation and descriptive keyword data. The number of different areas that were fixated most (number and duration of fixations) by observers was one measure of the consistency of the main area of interest. The second was the variability of the keywords used by the observers in describing the images. For example, image 1 in Figure 4 was typically described simply as ‘flower’ while the words: herbs, basket, veggies, tomatoes, cheese, tablecloth, and table, were all used to describe image 3.
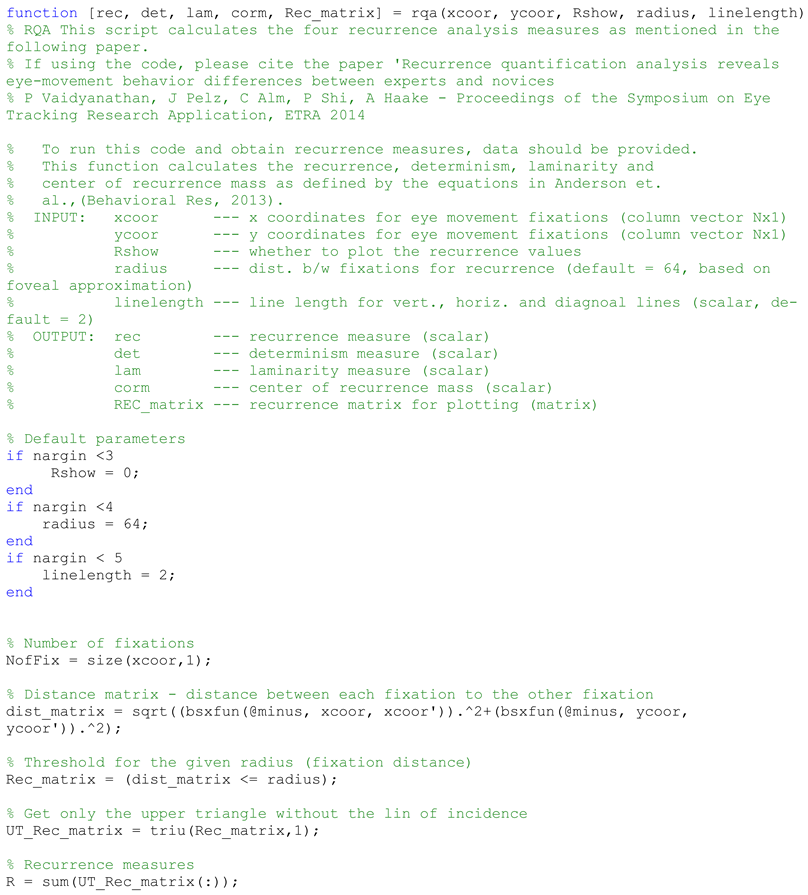
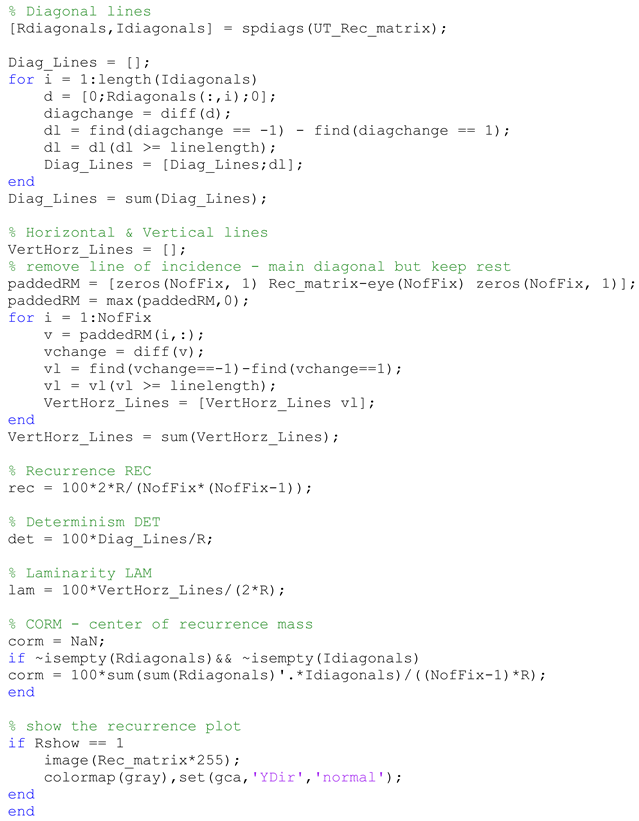
In the present study, the fixation data for each image were analyzed using the rqa function proposed by Vaidyanathan et al. (2014) using Matlab® technical computing software and based on the RQA approach of Anderson et al. (2013). This function, included in the Appendix, takes as input the x and y locations of the fixations as well as the specification for the distance between two fixations within which they are considered recurrent. This was specified such that two fixations within approximately 2o of visual angle would be considered recurrent. For the image size (1660 x 1040 pixels) and viewing distance (70cm) used in the experiment, a radius of 100 pixels was used.
The RQA results were compared to observer focus results as determined by the mean of the qualitative focal point rating and quantitative fixation location and keyword data for each image.
Experiment 2 - Recurrence and Viewing Task
To examine the effect of task on eye movements, the rqa function was used to evaluate fixation data gathered in the course of an experiment on viewing art images. In this preliminary experiment, the scene content included abstract and representational art images that generally filled the display (1680x1050). Six of the twelve observers were told that they would be answering questions about the images while the other half were simply asked to look at the images. The observers were allowed to view the images as long as they wished. The recurrence and determinism values for the two groups of observers were compared.
The same experimental setup as was used in Experiment 1 was used in this research – an SMI RED250 tracker and display. Viewing distance was not controlled but the eye-tracker required a consistent distance of about 70cm to detect the observers’ eyes. The observers were RIT students, staff, and interns, none of whom had experience with art analysis or eye-tracking.
Results
Experiment 1-Recurrence and Image Complexity
The focal point presence rating as determined by the mean of the qualitative focal rating and quantitative value (main area of interest consistency) for each image is plotted relative to the recurrence values reported by the rqa function in Figure 5. This graph indicates a negative correlation between focus and recurrence value (correlation coefficient of -0.65). Note that the relationship is negative because a small value for focal point presence indicates an image that has fewer (but at least one) possible focal points. There are two images that are not well predicted by the recurrence value: Paint Girl and Stained Glass full scenes, shown in Figure 6.
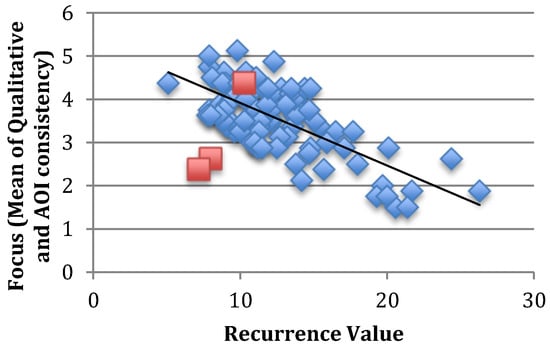
Figure 5.
Mean of the qualitative and quantitative values for attentional focus for the test images used in Farnand (2013) plotted relative to the recurrence values generated by the rqa function using the study’s fixation data as input. The two lower square data points represent the Paint Girl and Stained Glass full scenes, which are under-predicted for attentional focus by the recurrence value. The top square data point represents the closely-cropped Mason Lake scene, which is well-predicted by recurrence value, (but not by the determinism value – see Figure 8).

Figure 6.
The ‘Paint Girl’ full scene (left), courtesy of Lexmark. Stained Glass full scene (center), from the Corel database at RIT, Mason Lake, closely-cropped (right), courtesy of Dr. Mark Fairchild
Figure 7 shows limited refixation in the Paint Girl full scene image, as would be suggested by the hypothesis that increased image complexity would reduce the consistency of attention. In the 2013 study, this image seemed an exception to this general rule because observers tended to fixate on the woman’s face, as has been noted in eye tracking studies that include pictorial images containing faces since the time of Buswell (1935). In this research, however, the fixations apparently varied enough that they did not occur within the 100-pixel radius used in the rqa function. The difference between the two studies may be because of the size of the areas of interest. The images in the 2013 study were segmented into 8-10 areas, generally of about 300-400 pixel diameters. Or, it may be that, in the 2013 study, observers looked at the woman for an extensive period of time, but did not return their gaze after their initial examination.
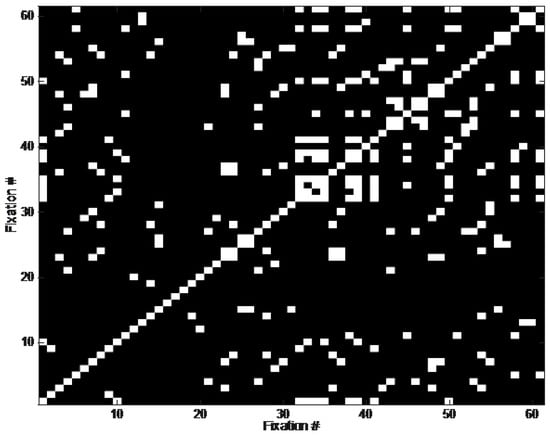
Figure 7.
Recurrence plot for the Paint Girl full scene
In Figure 8, the focal point presence rating for each image is plotted relative to the determinism values. This graph indicates a somewhat weaker relationship between focus and determinism value (correlation coefficient of -.53) than existed for focus and recurrence. The two images that are not well predicted by the recurrence value, Paint Girl and Stained Glass full scenes, are also not in good agreement here, although they are closer to the trendline than they were for recurrence. The closely-cropped Mason Lake image, Figure 6, is the furthest from the trendline for determinism. The recurrence plot for this image is shown in Figure 9. Generally, these results indicate that as images become more complex, the determinism value decreases. This result supports the findings of Farnand (2013) that images of increasing complexity will have reduced fixation consistency as well as the assertion of Anderson et al. that determinism should correlate with image clutter.
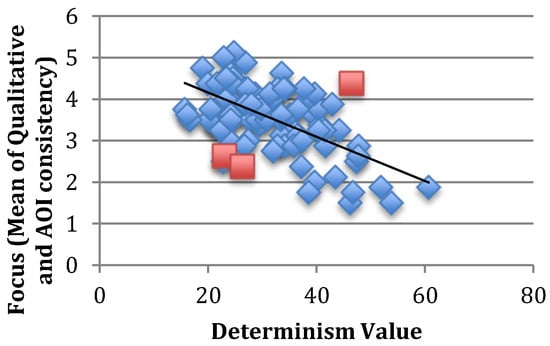
Figure 8.
Mean of the qualitative and quantitative values for attentional focus for the test images used in Farnand (2013) plotted relative to the determinism values. The right-most square point represents the closely-cropped rendition of the Mason Lake scene, which is over-predicted for attentional focus by the determinism value. (The other two squares represent the same images as in Figure 5.)
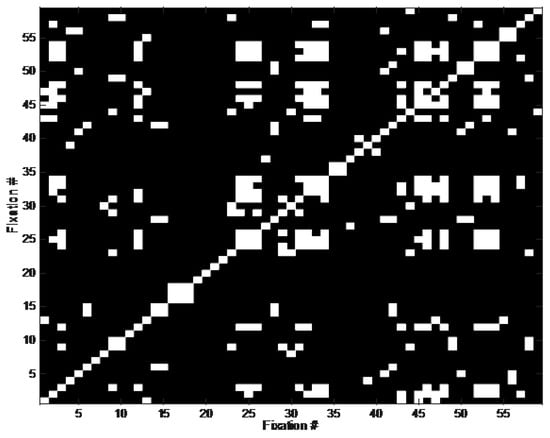
Figure 9.
Recurrence plot for the Mason Lake closely-cropped image.
In Figure 10, the focal point presence rating for each image is plotted relative to a weighted average of the recurrence and determinism values. (The determinism value is multiplied by the average recurrence value divided by the average determinism value to transform it to a scale similar to that of the recurrence values.) The results of the analysis indicate that the RQA approach would provide an approximation of the degree of attentional focus of observers viewing pictorial images. The recurrence and determinism results support the Farnand (2013) findings that images of increased complexity result in decreased attentional focus – observers vary more in the areas of the images to which they attend as image complexity increases.
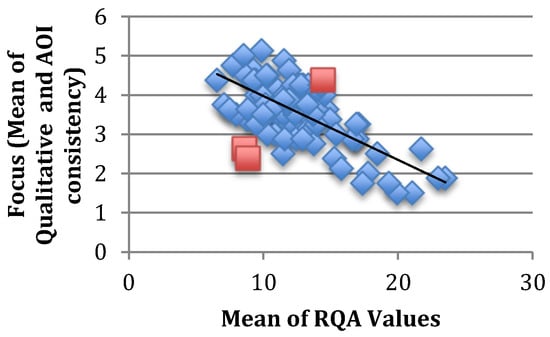
Figure 10.
Mean of the qualitative and quantitative values for attentional focus for the test images used in Farnand (2013) plotted relative to a weighted average of the recurrence and determinism values. The squares represent the Paint Girl and Stained Glass full scenes and the closely-cropped rendition of the Mason Lake scene.
Experiment 2 - Recurrence and Viewing Task
Recurrence and determinism values were obtained using fixation data gathered in the course of a preliminary experiment on viewing abstract and representational art images. This experiment included an assessment of the effect of task. Half of the observers performed a memory task and half of the observers were allowed to view the images freely.
The Recurrence values for observers in the memory task, shown on the abscissa in Figure 11, were roughly equal or slightly lower than for the observers assigned to free view the images. The one exception was a Rembrandt portrait, the furthest right point in Figure 11&Figure 12. This image had a simple composition, consisting of a gentleman against a dark background, which yielded the highest recurrence result for both groups of observers. While the viewers tasked with remembering the image contents could quickly ascertain what the painting contained, they also looked at the gentleman’s clothes and other aspects of the painting, while observers who were free viewing concentrated solely of the gentleman’s face.
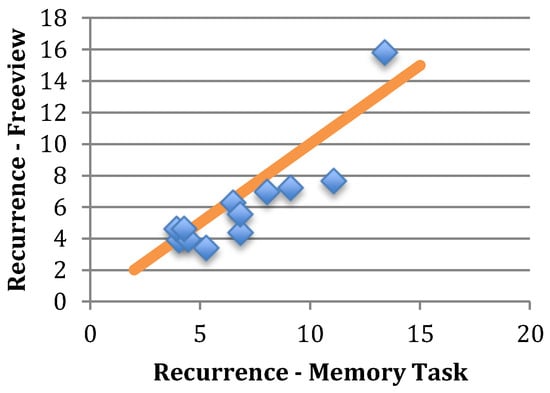
Figure 11.
Recurrence values for observers who freeviewed twelve paintings of various complexity and abstraction relative to observers who were told that they would be asked questions about the content of the paintings. The line defines where recurrence for observers free viewing images would match those tasked with remembering the image contents.
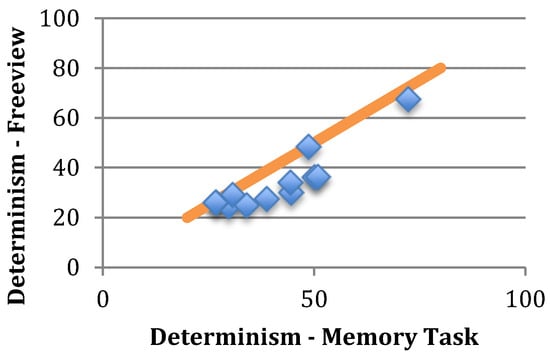
Figure 12.
Recurrence values for observers who free viewed twelve paintings of various complexity and abstraction relative to observers who were told that they would be asked questions about the content of the paintings. The line defines where recurrence for observers free viewing images would match those tasked with remembering the image contents.
The Determinism values were generally higher for the observers assigned to do the memory task, Figure 12, with the values being 30%-50% higher for half of the art images shown. They were roughly equal (less than 5% different) for one cubist painting, for one highly abstract painting, and one landscape. They were never lower.
These results are in agreement with those of Yarbus (1961) and Anderson et al. (2013). The results of these studies support the idea that observers assigned a viewing task will have different viewing patterns from those allowed to free view images and that those performing the specified viewing task have patterns more similar than those free viewing the images.
Conclusion
In this study, the Recurrence Quantification Analysis approach proposed by Anderson et al. (2013) was used to evaluate observer eye movement data collected in two experiments. In the first experiment, the recurrence and determinism results indicated that as the pictorial images become more complex, observer attention becomes less focused – observers vary more in the areas of the images to which they attend as image complexity increases. The results support both the findings of Farnand (2013) that images of increasing complexity will have reduced fixation consistency as well as the suggestion of Anderson et al. (2013) that determinism should correlate with image clutter. In the second experiment, the RQA results indicated that the observers assigned a viewing task had different viewing patterns from those who viewed the images freely and had viewing patterns that were more similar than the observers who freely viewed the images. These results are in agreement with those of Yarbus (1961) and DeAngelus and Pelz (2009) as well as those of Ballard, Hayhoe, and colleagues, whose research results indicate that task overrides bottom-up saliency (Rothkopf et al. 2007, for example).
The results suggest that RQA analysis provides relevant quantitative information regarding the attentional focus of observers viewing pictorial images, making this approach a promising tool for future eye-tracking studies. It provides results that are generally more objective than strictly qualitative analyses, however researchers must remain cognizant of their data. Also, it does not provide information regarding where the recurrence is taking place. Further analysis is needed to determine if the repeated fixations and scanpath segments align with focal points. Using this quantitative approach in concert with qualitative procedures may afford the strongest analysis.
Acknowledgments
The authors wish to thank Elena Fedorovskaya, Jason Menezes, and John Wikiera for their critical contribution to the Viewing Task experiment, and all of the observers who participated in the experiments in this study.
Appendix
rqa.m function
(Additional information available at: https://github.com/PVNathan/GazeBasedRQAMatlab)
References
- Anderson, N. C., W. F. Bischof, K. E. Laidlaw, E. F. Risko, and A. Kingstone. 2013. Recurrence quantification analysis of eye movements. Behavior Research Methods 45, 3: 842–856. [Google Scholar] [CrossRef] [PubMed]
- Buswell, G. T. 1935. How people look at pictures: A study of the psychology and perception in art. Chicago: University of Chicago Press. [Google Scholar]
- DeAngelus, M., and J. B. Pelz. 2009. Top-down control of eye movements: Yarbus revisited. Visual Cognition 17, 6/7: 790–811. [Google Scholar] [CrossRef]
- Einhauser, W., M. Spain, and P. Perona. 2008. Objects predict fixations better than early saliency. Journal of Vision 8, 14: 1–26. [Google Scholar] [CrossRef]
- Farnand, S., and M. Fairchild. 2012. The effect of experimental instructions on the number of areas identified as important in photographic images. In Conference on Colour in Graphics, Imaging, and Vision. Society for Imaging Science and Technology, January, Vol. 2012, No. 1, pp. 290–294. [Google Scholar]
- Farnand, S. P. 2013. Designing pictorial stimuli for perceptual image difference experiments. PhD Dissertation, Rochester Institute of Technology. [Google Scholar]
- Farnand, S. P., and M.D. Fairchild. 2014. Designing pictorial stimuli for perceptual experiments. Applied Optics 53, 13: C72–C82. [Google Scholar] [CrossRef] [PubMed]
- Larson, E. C., and D. M. Chandler. 2009. Most apparent distortion: a dual strategy for full-reference image quality assessment. In IS&T/SPIE Electronic Imaging (pp. 72420S-72420S). International Society for Optics and Photonics, January. [Google Scholar]
- Marwan, N., and J. Kurths. 2002. Nonlinear analysis of bivariate data with cross recurrence plots. Physics Letters A 302, 5: 299–307. [Google Scholar] [CrossRef]
- Rosenholtz, R., Y. Li, and L. Nakano. 2007. Measuring visual clutter. Journal of Vision 7, 2: 1–22. [Google Scholar] [CrossRef]
- Rothkopf, C. A., D. H. Ballard, and M. M. Hayhoe. 2007. Task and context determine where you look. Journal of Vision 7, 14: 1–20. [Google Scholar] [CrossRef] [PubMed]
- Vaidyanathan, P. 2016. https://github.com/PVNathan/GazeBasedRQAMatlab.
- Vaidyanathan, P., J. Pelz, C. Alm, P. Shi, and A. Haake. 2014. Recurrence quantification analysis reveals eye-movement behavior differences between experts and novices. In Proceedings of the Symposium on Eye Tracking Research and Applications. ACM, March, pp. 303–306. [Google Scholar]
- Wu, D. W. L., N. C. Anderson, W. F. Bischof, and A. Kingstone. 2014. Temporal dynamics of eye movements are related to differences in scene complexity and clutter. Journal of Vision 14, 9: 8-8. [Google Scholar] [CrossRef] [PubMed]
- Yarbus, A. L. 1961. Eye movements during the examination of complicated objects. Biofizika 6: 52–56. [Google Scholar]
Copyright © 2016. This article is licensed under a Creative Commons Attribution 4.0 International License.