Abstract
ELAN is a widely used and free (in both senses) annotation software for behavioral or other events that unfold over time. We report on and release a stand-alone program that expands on ELAN's capabilities in two ways: 1) it allows the researcher to plot and export time-course analysis data directly from ELAN's native annotation files, allowing for hassle-free data extraction in the time domain, e.g. for visual-world paradigm studies; and 2) it allows the researcher to weight ELAN's built-in annotator reliability rating based on the duration of the coded events. This software is released under an open license.
Introduction
ELAN annotation software
The annotation program ELAN (http://tla.mpi.nl/tools/tla-tools/elan/) is an open-source and free multimodal annotation program developed by the Max Planck Institute for Psycholinguistics in Nijmegen1 (Brugman, 2004; Wittenburg, 2006). It has become the de facto standard for linguists coding their language material, but is also used by researchers in ethology (Madsen & Persson, 2012), gesture research (Lausberg & Sloetjes, 2009), human–robot interaction (Lohse, 2010), sign language (Crasborn, Sloetjes, Auer & Wittenburg, 2006), surgery training (Bouarfa, Jonker & Dankelman, 2011) and others who need to make systematic annotations and subjective ratings over time and on an arbitrary number of analysis dimensions. It has also been used to code gaze behavior in the absence of eye-tracking, but also to store and complement the eyetracking data when the tracking loss is high and needs manual inspection (as we have done in Sandgren, Andersson, van de Weijer, Hansson & Sahlén, 2014).
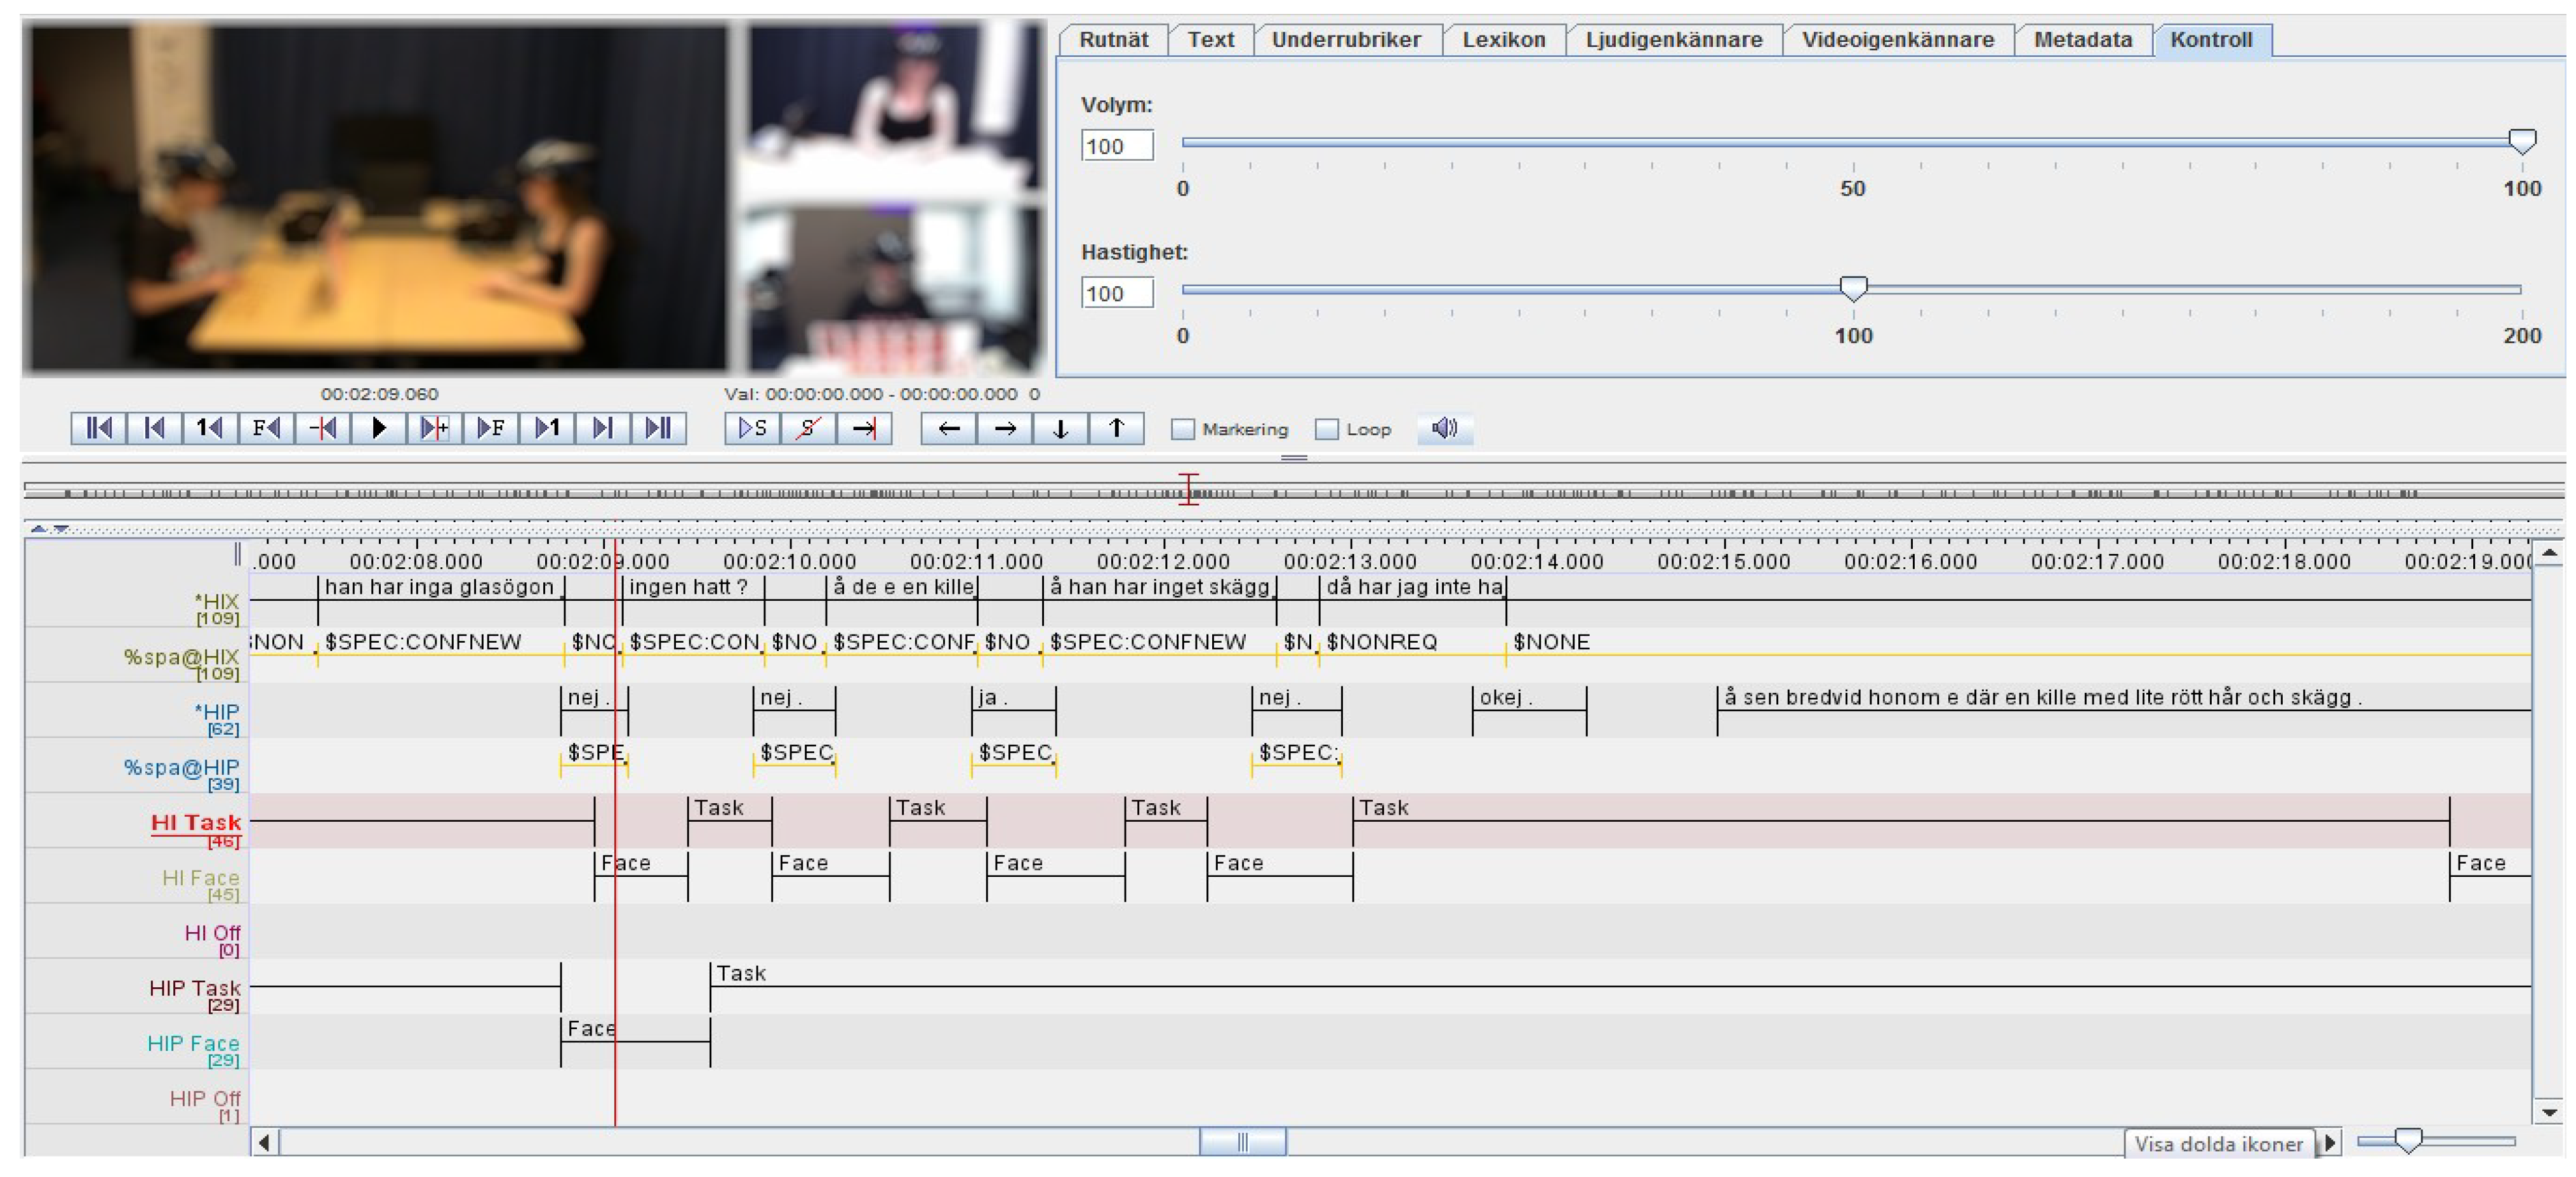
Most importantly, however, is that this software is agnostic to what data it handles, and allows the user to store, synchronize, and play back multiple sources of data. This allows a facilitated co-analysis of eye-tracking data together with video-based behavior annotation, auditory speech analysis, or additional biometric source data. Following that, the annotator then creates different annotation tiers that represent layers that store the annotations pertaining to the different dimensions of interest, e.g., “gaze target”, “estimated function of gaze”, “gesture type”, et c. After the user has completed the annotations, ELAN support various operations such as exporting all the aligned data, calculating interrater reliabilities, or calculating simple measures such as the number of occurrences of different annotations. Figure 1 shows the user interface of ELAN.

Figure 1.
the user interface of ELAN. The software supports multiple synchronized media sources and an arbitrary number of annotation tiers. Videos are blurred to protect participants.
Although the software is accessible to the nontechnical user, and very adept at aligning multiple data sources, the analysis capabilities are somewhat limited. For example, arranging data in an event-related timeseries format, which allows for statistically powerful analyses common in eye-tracking research, is not supported. Adding support for arranging, visualizing, and exporting data in such a manner would allow for better analyses for the researchers that don't have the skills or resources to programmatically extract and align their multimodal data.
This paper presents a stand-alone software tool for expanding the capabilities of ELAN, already with some success (Sandgren et al., 2014). Two features are implemented: one major one and one minor one. The major feature is the use of time-course analysis in favor of simpler frequency measures. The minor feature is an important correction to ELAN's interrater reliability calculation.
Time-course analysis
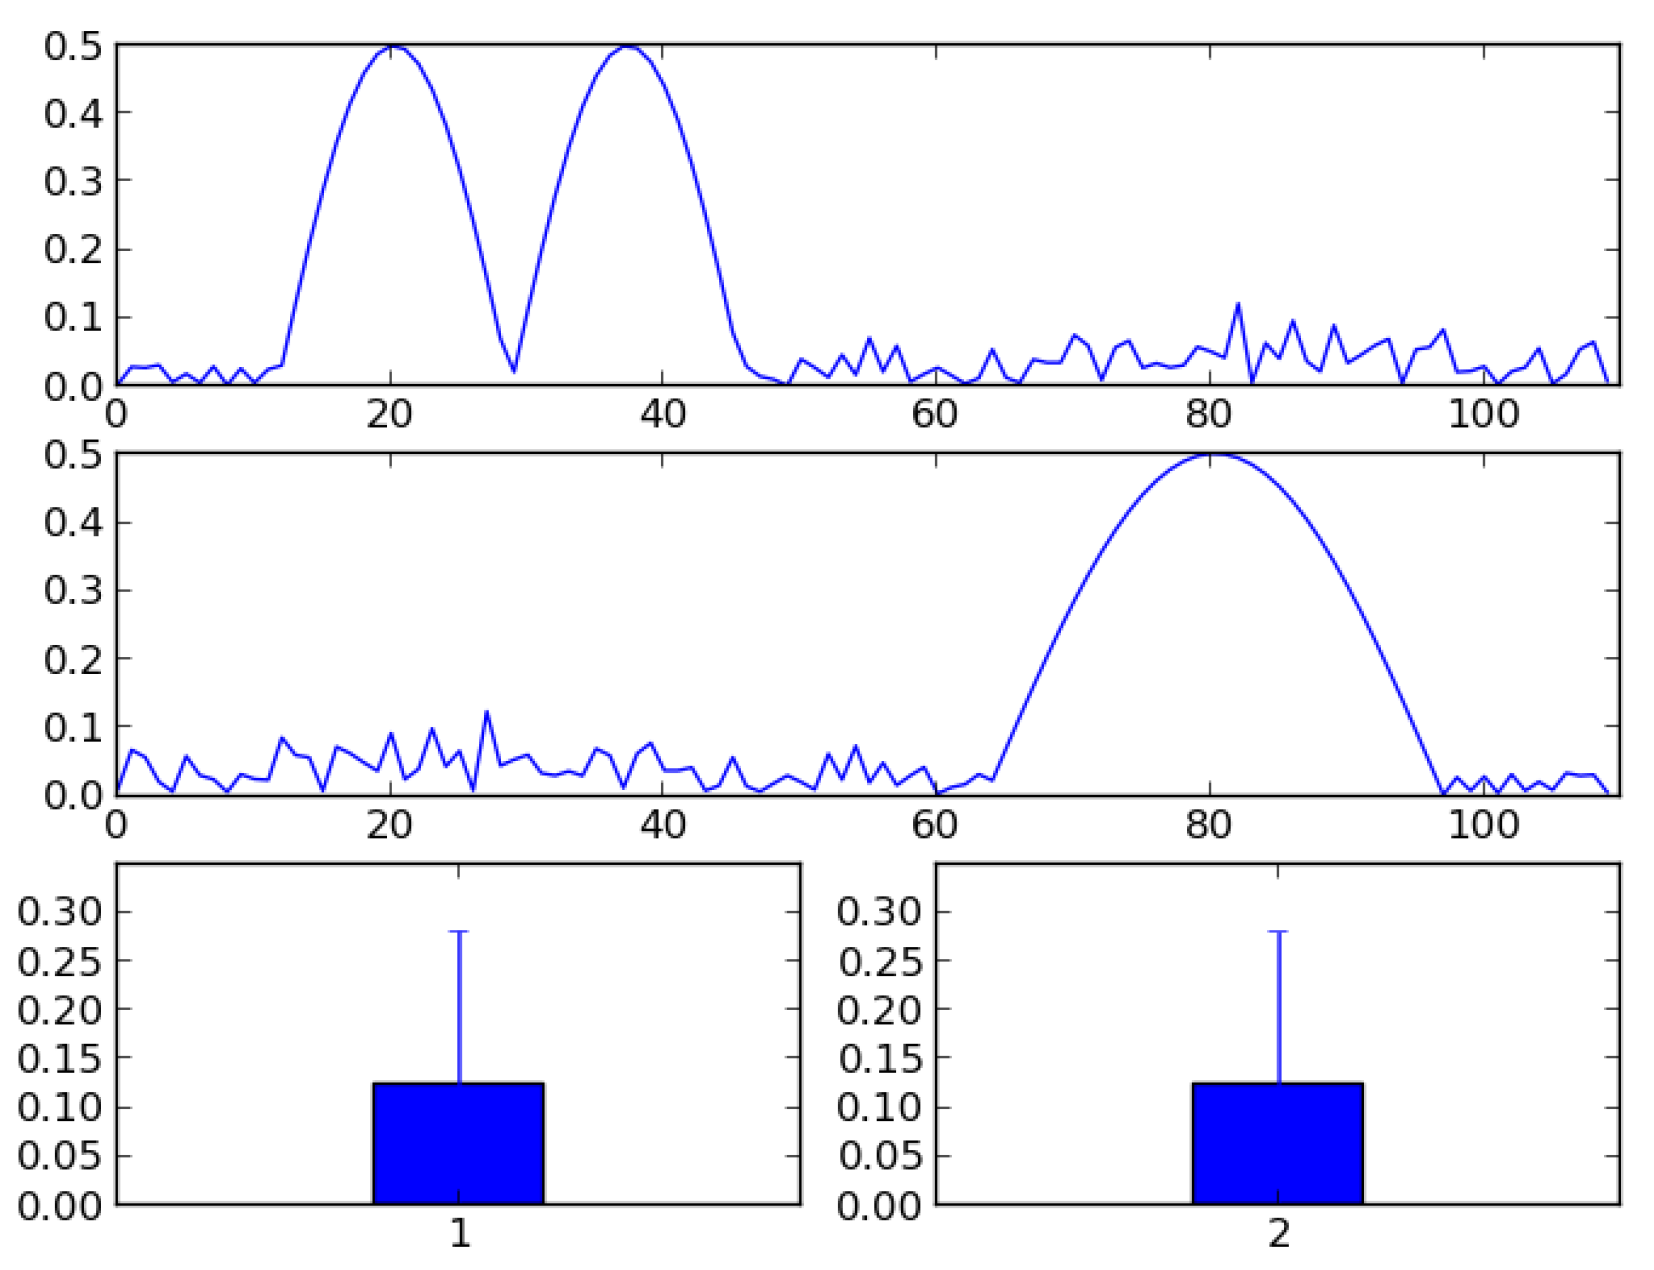
Many behavioral studies analyze their results in the form of count data, e.g., how many times a particularly behavior occurred given a particular time span or given the number of opportunities. Such frequency statistics are also supported by ELAN. However, such observations are often aggregated over time to some mean frequency and as such do not attend to the unfolding of the event over time, hence losing much interesting information. For example, a simple count measure indicates that a particular behavior has taken place, but it is oblivious to whether this behavior happened early or late in the temporal analysis window, or whether it is driven by one large response or several smaller responses. Aggregating across trials, but not over time, allows us to form an average response curve of otherwise binary reponses (e.g. in eye-tracking: whether the participant looked at an object or not). This curve may show a distinct peak at the onset, e.g., occurring at around t+1200 milliseconds in the temporal analysis window which may be, say, 10,000 milliseconds. The rise towards this peak may happen through a slow or a fast growth, and the decline from the peak may also be slow or fast. Data may also be unimodal, bimodal or multimodal. This temporal information may provide insights into how synchronized a particular behavior is, across situations, stimuli items and participants, or reveal whether similar or different mechanisms control the behavior. See Figure 2 for an illustration of how clearly different signals appear similar when ignoring the temporal information.

Figure 2.
data viewed as a signal over time and as an aggregated signal. The top and middle panels shows two distinctly different signals, unfolding differently over time. However, as bar graphs illustrating the aggregated means of the signals, they are identical.
Such event-related time-series analyses are today widely used in eye-tracking (Allopenna et al, 1998; Holmqvist et al, 2011) and in electro-encephalography (Luck, 2005; Simola, Holmqvist & Lindgren, 2009). Currently, direct support for plotting and exporting data preserving the temporal unfolding is not supported by
ELAN. A researcher wanting to take advantage of this information would have to write a custom analysis script for extracting and aligning this information from the ELAN's XML files, manually computing it, or visually inferring regularities of the events in the data stream.
Reliability calculation using ELAN
A person's annotations are always verified against one or several other annotators, to restrict the possibility that the main annotator operates on a set of particularly idiosyncratic criteria. This multiple annotation is done for either all of the data, or just a subset of the data. If the annotators are in agreement in their annotations, i.e., they label the same events with the same event code, then the annotations are said to be homogeneous and reliable. This homogeneity is quantified using Cohen's Kappa (Cohen, 1960), overlap percentages, or some other measure of inter-rater or reliability. ELAN's (in version 4.5.1, which prompted our work) built-in functionality of Compare annotators uses a simple, but also very understandable, reliability measure. It focuses on the proportion of overlap of two annotations, i.e., the degree to which two events are independently rated to occur during the same interval. If annotator a decides that the event ε occurs between time points t400 and t600, and annotator b decides that this event occurs between time points t500 and t700, then the proportion of overlap is given by the overlap (t500 – t600 = 100) divided by the maximum temporal extent (according to the two raters) of the event (t400 – t700 = 300). The final overlap proportion statistic for this single event, as provided by ELAN, is 100/300 = 0.33. This overlap statistic is intuitive, as a value of 1 means that both annotators have rated the same types of events to occur at exactly the same intervals. A value of 0 means that either the annotators have completely disagreed on the time intervals of the events, or they have disagreed on the type of event that occurs.
The problem with the current implementation in ELAN is that when a single reliability statistic is computed for all rated events, ELAN simply takes the average overlap proportion across all events equally. This has the effect that no distinction is made between short events (e.g., 10 milliseconds) and long events (e.g., 10 minutes).
To illustrate this problem, consider the following minimal example with just n=2 events, indexed by i:
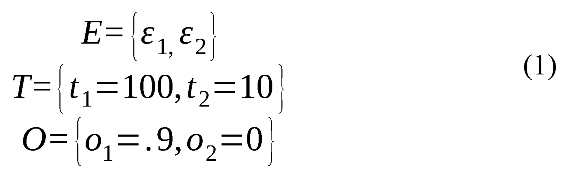
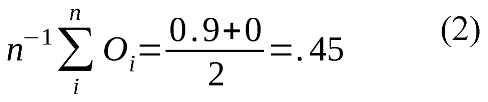
where E is a set of two events, each coded by two different raters, T a set of maximum durations for the events in E, and O a set of overlap proportions for the events in E. The overlap ratio for the current ELAN calculation is:
Whereas a temporally weighted overlap ratio would produce a reliability rating as follows:
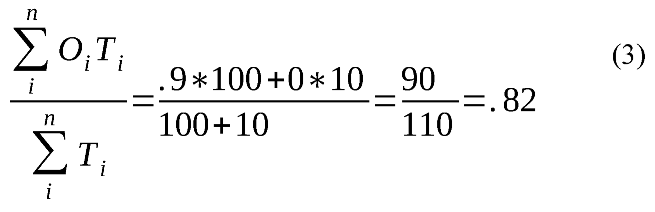
As can be seen from the above example, not taking the duration of events into account may produce very unintuitive (we would even argue false) reliability scores, although this example is extreme to illustrate the point. Even if the two raters agree about 90 time units out of the 110 time units they rate, they still only get a reliability of 45 % using ELAN's native method. The underestimation is large if the proportion of non-agreed (i.e., nonoverlapping) events are many (compared to agreed events) in number but short (again: compared to the agreed events) in durations. Applying this correction will then improve the reliability score. However, it is also possible to overestimate the reliability score. This occurs when the number of non-agreed events is relatively low, but on average longer than the mean duration for the agreed events. If an overlap measure is used to estimate the inter-rater reliability, we argue that a temporal weighting should also be performed.
It should be noted that this reliability metric is not the only metric used in research, and perhaps not even the most common. The most common would likely be Cohen’s Kappa, which provides a reliability metric based on two coders using two different responses (e.g., “yes” or “no”). One benefit with Cohen’s Kappa is that it takes into account the chance agreement of events occurring. If two coders would simply say “yes” or “That is a fixation!” to almost anything, then they would have a high agreement, regardless of the underlying data. Cohen’s Kappa addresses this by calculating a simple expected average response or base rate from each coder, which the agreement has to surpass. The drawback with this feature of Cohen’s Kappa, however, is that if it is easy to get a high chance agreement, then the estimated agreement can actually be low, unless the raters are clearly better than the chance agreement. We believe this can appear very unintuitive to a reader who is not very familiar to Cohen’s Kappa.
ELAN analysis companion (EAC)
The goal of our Python program is to add to ELAN's functionality by providing solutions for the two limitations of ELAN that have been presented, and present it in a GUI to make it easy for everybody to use. Ideally, had we known Java, this could have been implemented directly into ELAN. The two solutions of the program are presented in their own tabs in the GUI.
Time-course analysis
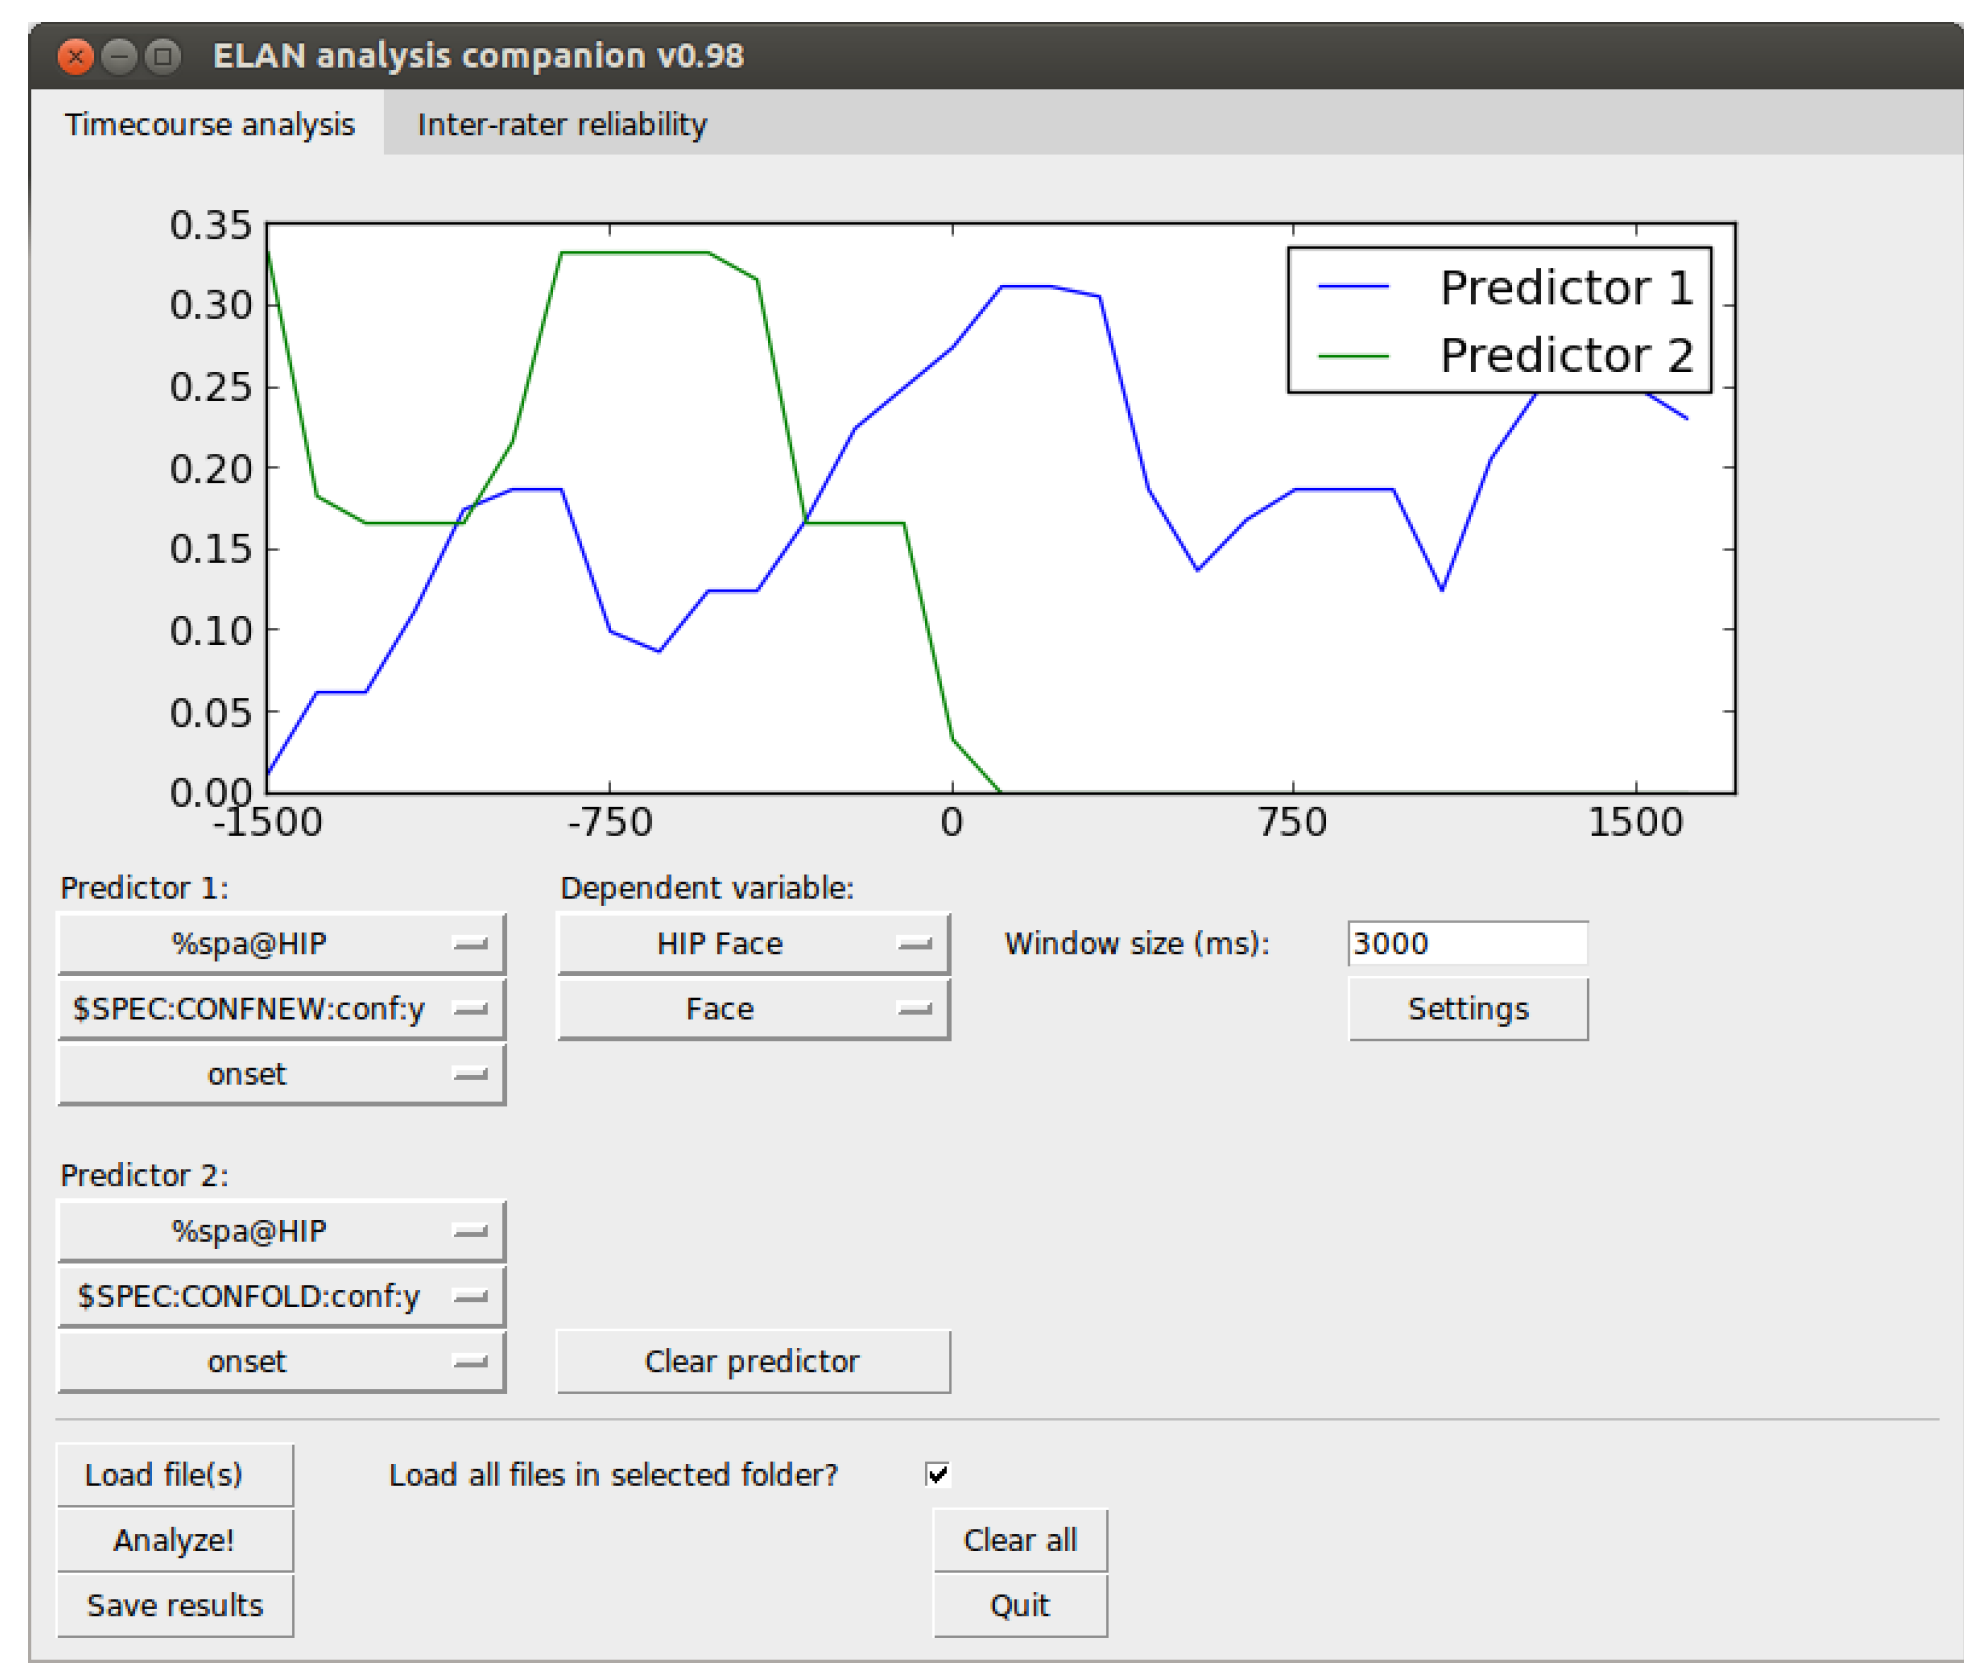
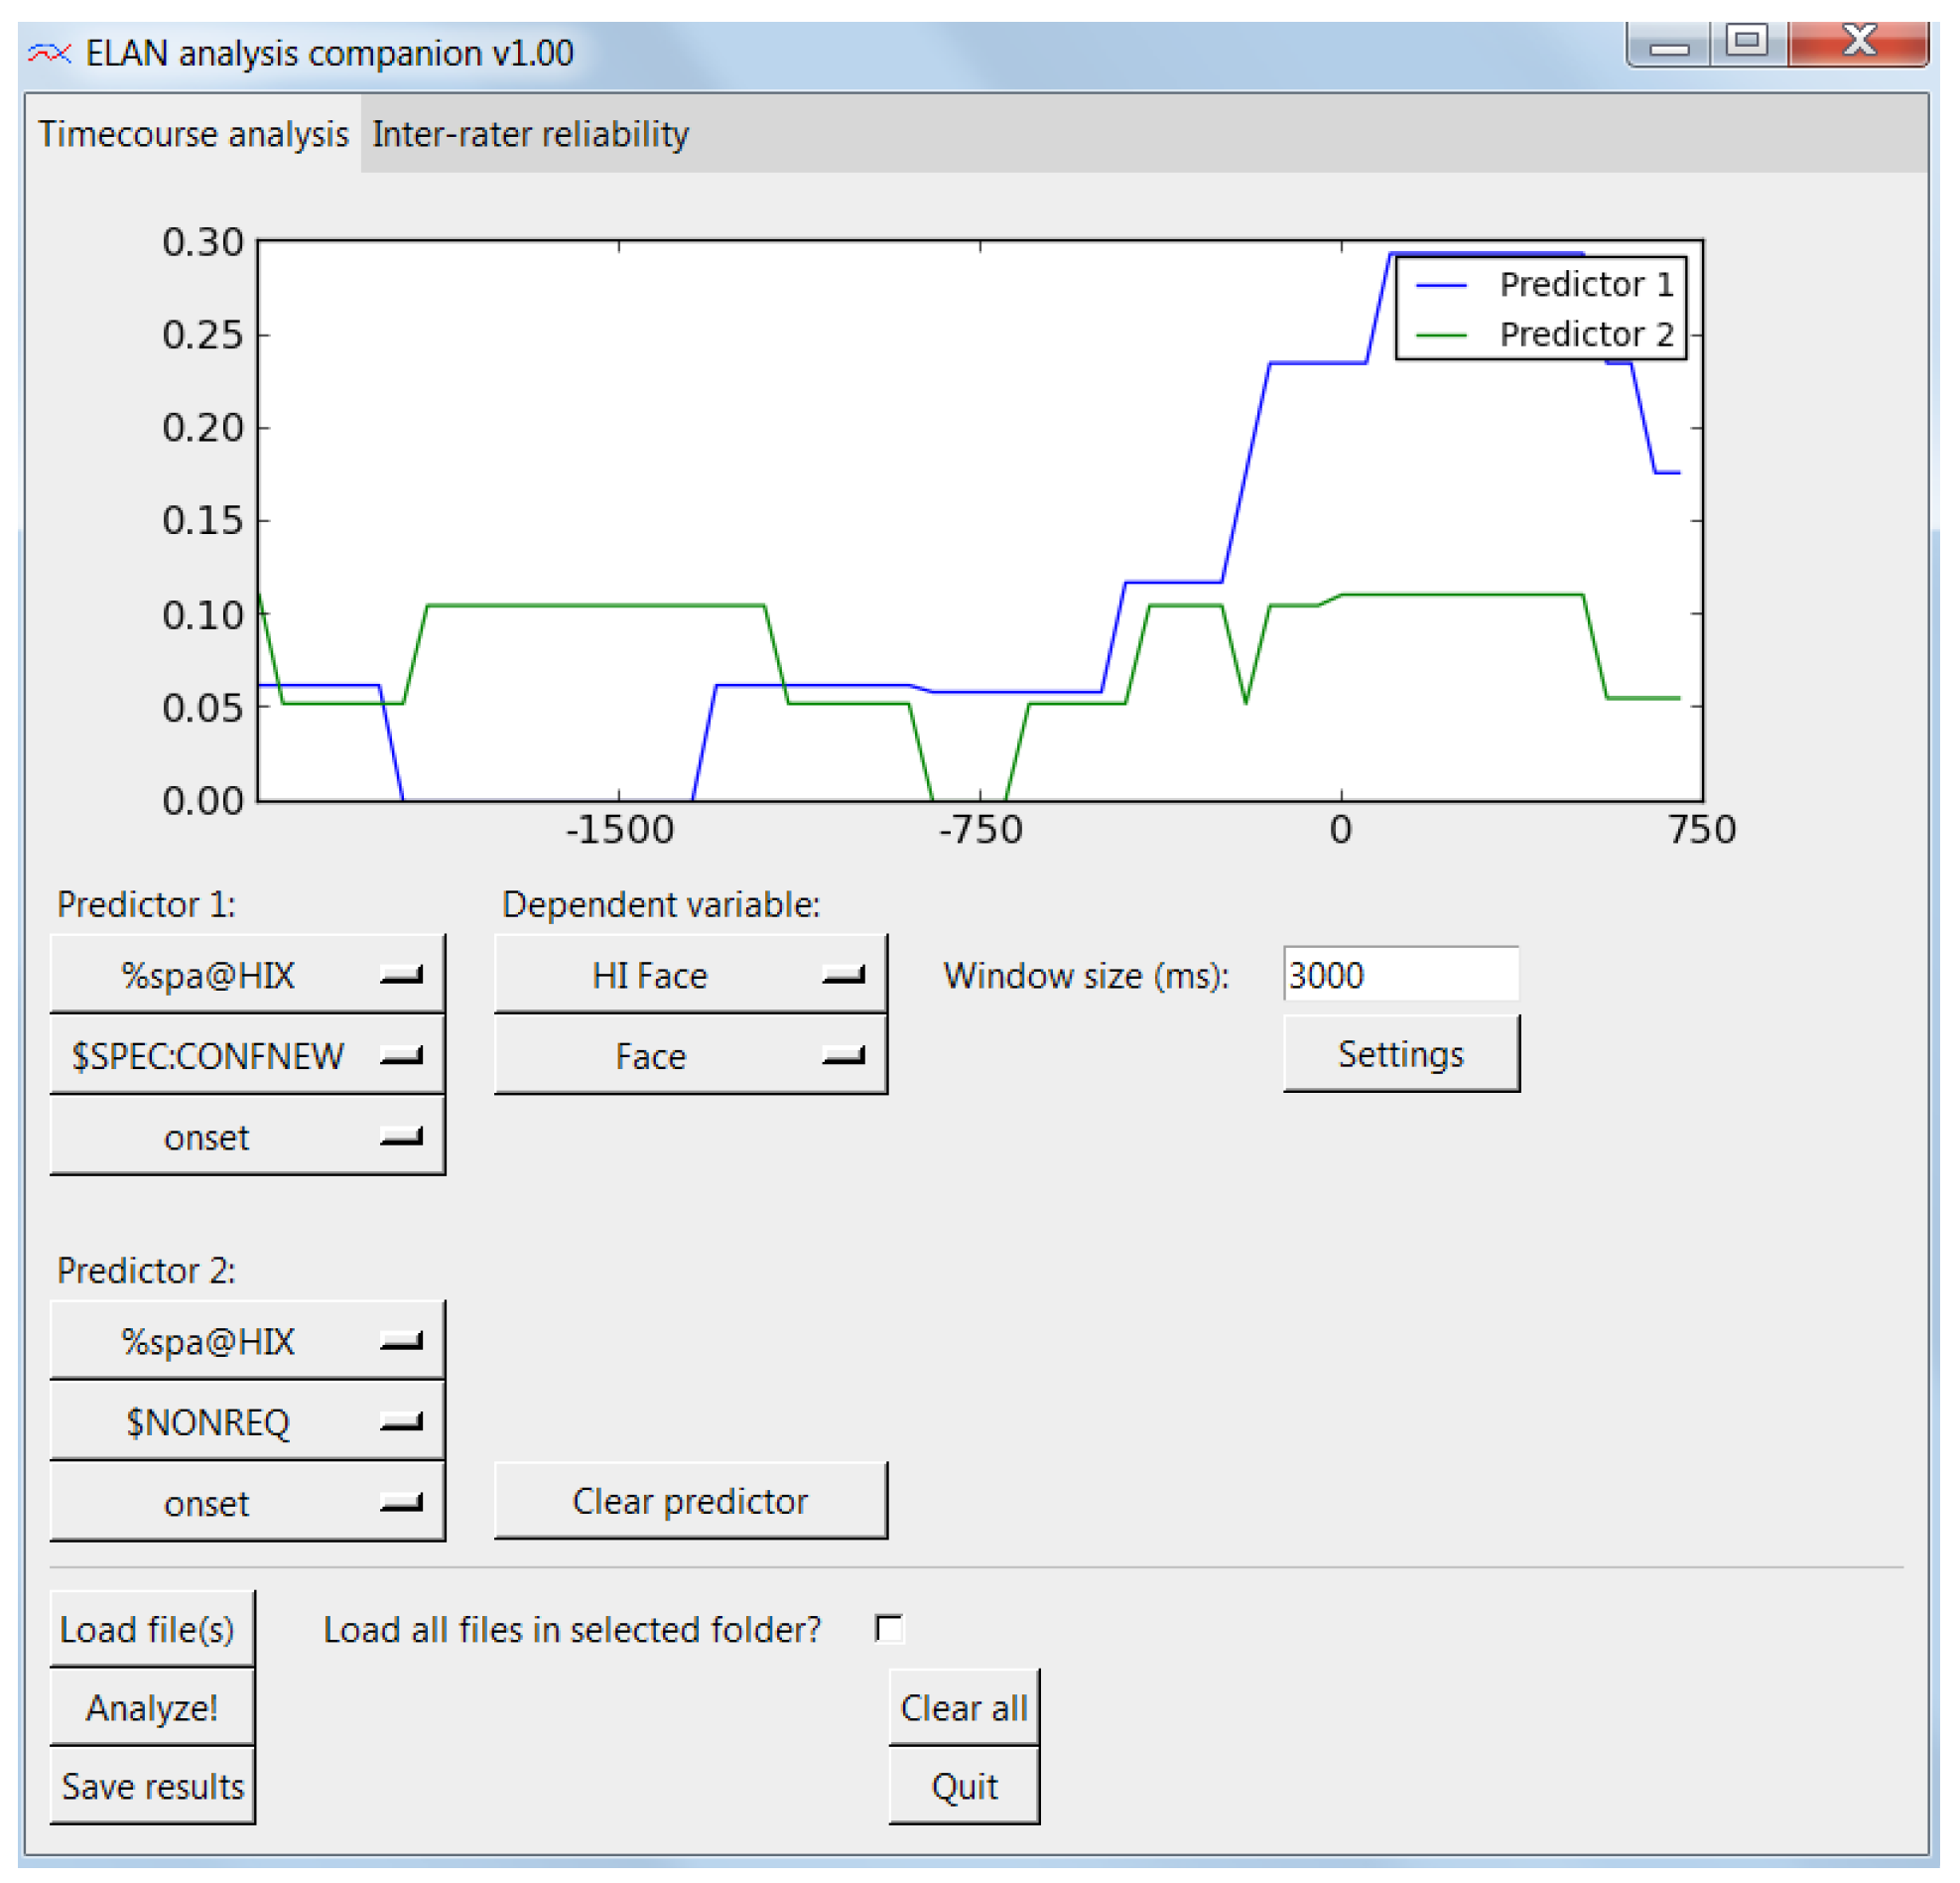
The time-course analysis tab allows the researcher to load a number of ELAN XML files (.eaf files) and calculate proportions of looks over time on the data. This view is shown in Figure 3. This requires the selection of a predictive tier, which is the ELAN tier that holds the event we wish to designate as predictive. Next, we select a predictive event from the list of events in the selected predictive tier. Finally we select whether the onset or the offset should be the trigger point of the temporal analysis window. As a concrete example, if we are interested in where a participant looks when another person speaks a particular utterance, then the onset of that utterance is the predictive trigger point. We are not interested in what happens at the time of some other event, but only what happens around this particular type of utterance.
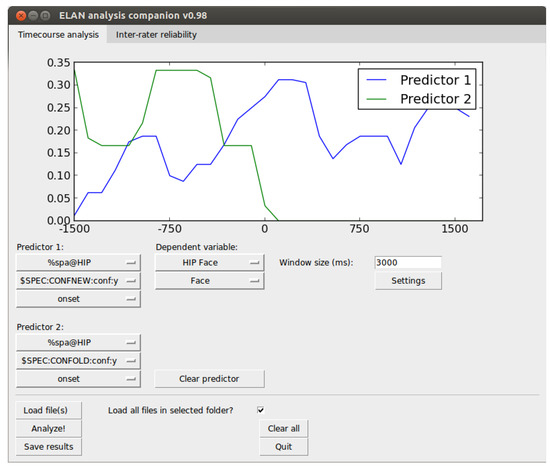
Figure 3.
user interface of the EAC time-course analysis tab. Predictors are selected to the left and the dependent variable to the right. The resulting time-course curves are presented in the top window.
When this predictor point is triggered, we want to capture the data around this point in an analysis window. In our case, we are interested in the gaze data (in ELAN in nominal form, e.g., name of AOI looked at). The analysis window is centered on the predictive trigger point and the size of the window is given by the window size setting. So, a 3000 ms window size means that the analysis window will extend 1500 ms from either side of the trigger point. Now, we need to select a dependent variable, which is the behavior we are interested in observing over time (here: the gaze). First, we start by selecting the ELAN tier that holds the relevant event, and then the event itself. If we are interested in contrasting the unfolding of the dependent variable over time with the unfolding of the same event in another predictive window, we can select a second predictor to be plotted at the same time.
When all required events and parameters are set, we can then press the “Analyze!” button to extract all the data and then plot it in the graph panel. The created graph is then an average curve for all the captured analysis windows. After having extracted the data, we can press the “Save results” button to export the data underlying the average curve we have just plotted. The output format is a UTF-8 text file with tab-separated values in a “long” file format, i.e., each time point is represented on a separate line for each participant (c.f. “a person-period data set”, Singer & Willett, 2003).
The algorithm behind the calculation of these results can be described by the following high-level pseudocode:
Pseudocode
- For each predictive event:
- ○
- Create a temporal analysis window of specified size, filled with null values and centered on the specified point of the predictive event-detection
- ○
- Mark all occurrences of the dependent event for each time point using the specified resolution and store the analysis window. Occurrences are marked as 1 and non-occurrences are marked as 0.
- ○
- Handle potential overlap between analysis windows based on specified overlap handling strategy, i.e. allowing re-use of values or blocking re-use.
- Create a mean analysis window from all analysis windows and plot it.
The particular key parameters that are used in the calculation are not only using the menus described up until here, but additional parameters are accessed by clicking the “Settings” button to open the settings dialog. The parameters that can be set here are defined as follows. Resolution is the minimal temporal resolution of the data, and data of higher temporal resolution will be downsampled to this resolution level. A resolution of r milliseconds for data sampled every n millisecond means that every (r/n):th sample will be used and the rest will be ignored, saving the computer memory for other samples. The overlap handling function specifies how the algorithm should behave if an analysis window expands across a region that has already been used in a previous analysis window. The alternatives are either to allow “double-dipping”, with the statistical complexity it brings, or to prevent time points to be used more than once by adhering to a "first come—first served" strategy. Bin size is simply to what degree the final results should be aggregated and pooled in bins. Data is always saved in bins (so to say), but these bins can be as small as the temporal resolution. This does not affect the plotting, which is always done at the level of the specified temporal resolution to produce smooth curves. Finally, the binning function is how the data should be pooled into the bins. The choices are either to take the mean, which is the average over the binary data in the analysis window, or to have the bins ceil the data to 1 if it is > 0. This latter alternative is good if the later statistical analysis requires binary (0,1) data.
Inter-rater reliability
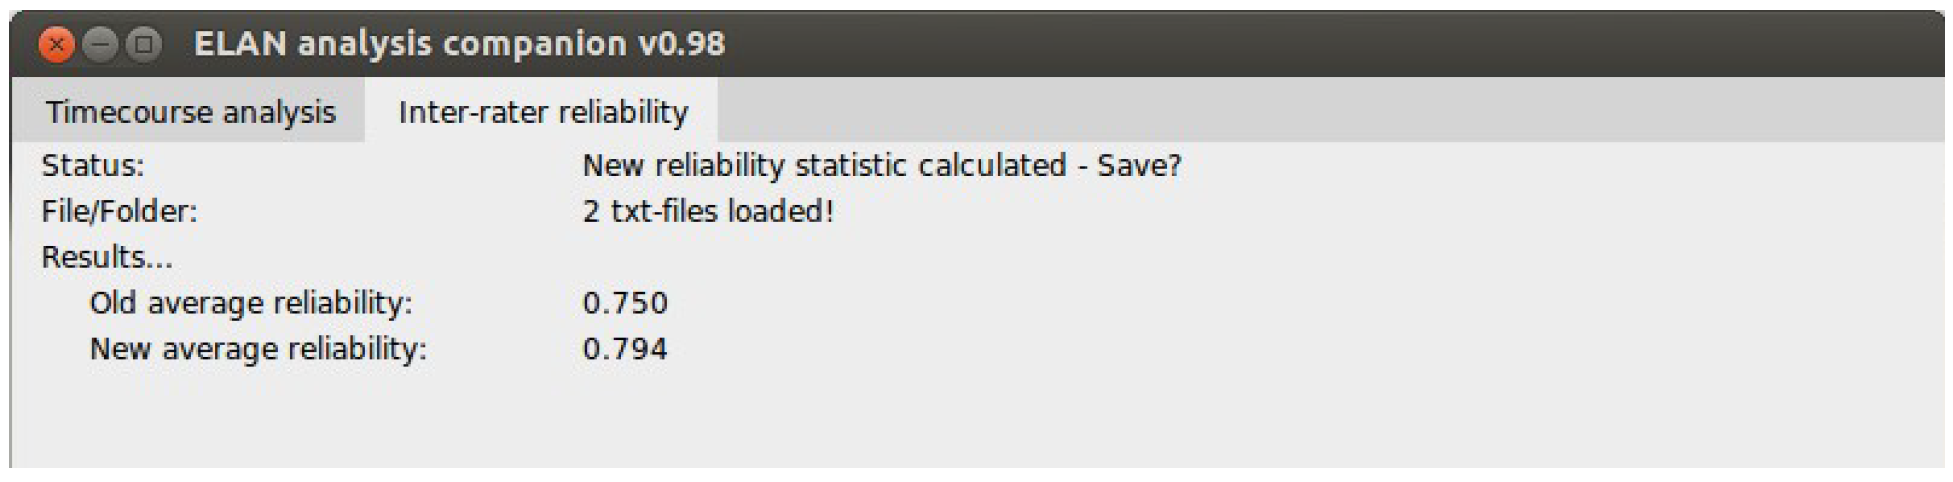
The input for the inter-rater reliability correction is are text files of annotator overlap exported by ELAN. These are simply placed in a folder and this software tool is directed to that folder. The tool reads each file and in turn applies the temporal weighting previously mentioned. In the end of each text file it appends a line describing the temporally weighted overlap ratio. Finally, the GUI reports back the new average reliability ratio. See Figure 4 for an illustration.
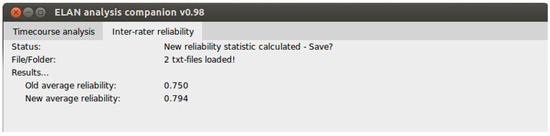
Figure 4.
a cropped view of the EAC tab for correcting interrater reliabilities.
The user is then free to save the results as corrected text files with “_corrected” appended to the file name.
Real research example
In the following example, we will go through a part of an actual experiment that used ELAN to synchronize different data sources and ultimately used the tool presented in this article to extract time-course curves that were later analyzed statistically.
Background
The experiment reported in Sandgren et al (2014) was a communication task where either hearing-impaired or normal-hearing adolescents communicated with a normal-hearing peer while playing a game in front of them. Thus, each session would produce two (one for each person) streams of gaze coordinates and one combined stream of audio data. The data was recorded using wearable eye-trackers: the HED-4 from SensoMotoric Instruments GmbH (Teltow, Germany). Because the participants were able to move freely while sitting in front of each other, there was no fixed coordinate system where one particular gaze vector always corresponded to gaze at the same object. Therefore, the primary desired output from the eyetrackers were a scene video of the field of view of each participant, with a gaze cursor indicating where the participant directed his or her gaze. Already there, it was clear that the data needed to be manually extracted or coded in some way.
Alignment
The material contained three video streams: two headmounted scene cameras from the respective participants, and a fixed video camera overlooking the two participants. The fixed camera also captured the combined audio stream of the two participants. It would have been possible to use all three videos simultaneously in ELAN, but the two scene videos were enough for our purpose. The two videos and the audio stream had to be synchronized, and this was done from within ELAN by choosing one data stream as a reference stream, and then adding offsets to the other streams until they align. One crucial part of this is that all streams should contain some known reference point to align against. In our case, this was achieved by having both participants look at the experiment leader as he clapped his hands once. This event was thus captured on both the scene videos as well as the audio track.
Coding scheme
For our purposes, we were interested in knowing how a hearing-impaired participant in the experiment direct his or her gaze at the timing of asking for additional information. So we needed to code at least the communicative function of the utterance of each participant, and also the gaze of each participant. The granularity requirements of the gaze coding were not very high, and a simple three-level coding scheme was used: “face” (for the face of the other participant), “task” (for the game pieces in front of them), and “off” for anything else. Each gaze target was given a tier in ELAN, which is equivalent to a dimension of analysis. If we had done this all over again, we would have collected all gaze (for each participant) in a single tier, and let the different gaze targets occur as events within this tier. The talking events of the participants were coded in tier “*HIX” and “*HIP” for the hearing-impaired and the normal-hearing participant, respectively, as simple audio-to-text transcriptions. The communicative functions of the utterances from the hearing-impaired participant were coded in tier “%spa@HIX” using a number of more specific events, such as “$SPEC:CONFNEW” for requests for confirmation of new information, and “$NONREQ” for non-requests.
Data extraction with EAC
We then used EAC to create curves of event-related gaze hits over time. These average curves were made up of several one-dimensional logical arrays, indicating, for every point in time in the analysis window, whether the participant gazed at the relevant target or not. Taking the average of these logical arrays produces a smoother curve indicating the proportion of looks to the target, given the particular point in time to the onset of the triggering event (the utterance). In the Sandgren, et al (2014) paper, the communicative function of “requests” were of interest. These were made up of three different types of requests for information, coded separately. So for this paper, the request data were extracted using the EAC software, once for each type, and then merged and plotted in a spreadsheet software. However, if only one type of event were of interest, the plot from EAC could have been used straight-away. It should be noted that the primary benefit of EAC is not the plotting, but the extraction of the eventrelated data.
For the sake of simplicity of this paper, we will replicate a subset of the analysis using the ELAN annotation file distributed with this software (HI3-HIP3strukt2.eaf), containing real data from this experiment. We want to contrast utterances from the hearing-impaired participant signaling requests for confirmation of new information with non-requests, and see how these correlate with the gaze from the hearingimpaired speaker to the other participant's face. To do this, we select two predicts, both from the “%spa@HIX” tier. The event for predictor 1 is “$SPEC:CONFNEW” for the request, and the event for predictor 2 is “$NONREQ” for non-requests. The trigger point of both events is the onset of the event. Now, we select the dependent variable, which is in the tier “HI Face”, and the only event inside which is “Face”. Finally, we set the other settings. We use a 3000 ms window size, as it is a fairly slowly unfolding event we are expecting here. We go inside the Settings dialog and select 10 ms resolution, which is enough for this purpose, we use a “first come first serve” overlap handling, bin the data in 50 ms bins, and round up any fractions to 1. We press Analyze and get the time-course curve which can be seen in Figure 5. This figure partially corresponds (as one of the three request types) to the lower panel of Figure 2 in Sandgren et al (2014).

Figure 5.
a partial replication of the analysis in Sandgren et al. (2014).
Software package and dependencies
Currently, to use this software tool the user must have three software packages installed: Python 2.7, Matplotlib 1.4.3 and NumPy 1.9.2, although other versions may work. Certain Python meta-packages, e.g., Python-xy, include all of these dependencies in a single installation. The software is tested against ELAN Annotation Format 2.6 and 2.7, and ELAN 4.5.1 for Windows.
The software tool can be found, preferably, at GitHub: https://github.com/richardandersson/EAC or alternatively: http://wiki.humlab.lu.se/dokuwiki/doku.php? id=people:richard-andersson:main
The software package includes four minimal data sets. The first set validates the handling of overlapping analysis windows, the second validates the bin handling, the third illustrates a time-course analysis, and the fourth the calculation of inter-rater reliability scores. More information on how to work through these examples is found in the software manual bundled with the package file.
Acknowledgments
The authors gratefully acknowledge the support from the Linnaeus Centre Thinking in Time: Cognition, Communication, and Learning, financed by the Swedish Research Council, grant no. 349-2007-8695 (RA & OS) and the Swedish strategic research programme eSSENCE (RA).
References
- Allopenna, P. D., J. S. Magnuson, and M. K. Tanenhaus. 1998. Tracking the time course of spoken word recognition: evidence for continuous mapping models. Journal of Memory and Language 38: 419–439. [Google Scholar]
- Bouarfa, L., P. P. Jonker, and J. Dankelman. 2011. Discovery of high-level tasks in the operating room. Journal of Biomedical Informatics 44, 3: 455–462. [Google Scholar] [CrossRef] [PubMed]
- Brugman, H., and A. Russel. 2004. Annotating Multimedia/Multi-modal resources with ELAN. In Proceedings of LREC 2004, Fourth International Conference on Language Resources and Evaluation. [Google Scholar]
- Crasborn, O., H. Sloetjes, E. Auer, and P. Wittenburg. 2006. Combining video and numeric data in the analysis of sign languages with the ELAN annotation software. Edited by Vetoori C. In Proceedings of the 2nd Workshop on the Representation and Processing of Sign languages: Lexicographic matters and didactic scenarios. ELRA, Paris. pp. 82–87. [Google Scholar]
- Holmqvist, K., M. Nyström, R. Andersson, R. Dewhurst, H. Jarodzka, and J. Van de Weijer. 2011. Eye tracking: a comprehensive guide to methods and measures. Oxford, UK: Oxford University Press. [Google Scholar]
- Lausberg, H., and H. Sloetjes. 2009. Coding gestural behavior with the NEUROGES-ELAN system. Behavior Research Methods, Instruments & Computers 41, 3: 841–849. [Google Scholar] [CrossRef]
- Lohse, M. 2010. Social, functional, and problem-related tasks in HRI–a comparative analysis of body orientation and gaze. 2nd AISB workshop on New Frontiers in Human-Robot Interaction; AISB, Leicester, UK. [Google Scholar]
- Luck, S. J. 2005. An Introduction to the Event-Related Potential Technique. Cambridge, MA: MIT Press. [Google Scholar]
- Madsen, E., and T. Persson. 2012. Contagious yawning in domestic dog puppies (Canis lupus familiaris): The effect of ontogeny and emotional closeness on lowlevel imitation in dogs. Animal Cognition 16: 233–240. [Google Scholar] [CrossRef]
- Sandgren, O., R. Andersson, J. van de Weijer, K. Hansson, and B. Sahlén. 2014. Coordination of gaze and speech in communication between children with hearing impairment and normal-hearing peers. Journal of Speech, Language, and Hearing Research 57, 3: 942–951. [Google Scholar] [PubMed]
- Simola, J., K. Holmqvist, and M. Lindgren. 2009. Right visual field advantage in parafoveal processing: Evidence from eye-fixation related potentials. Brain and Language 111: 101–113. [Google Scholar] [PubMed]
- Singer, J. D., and J. B. Willett. 2003. Applied Longitudinal Data Analysis: Modeling Change and Event Occurrence. New York, NY: Oxford University Press. [Google Scholar]
- Wittenburg, P., H. Brugman, A. Russel, A. Klassmann, and H. Sloetjes. 2006. ELAN: a Professional Framework for Multimodality Research. In Proceedings of LREC 2006, Fifth International Conference on Language Resources and Evaluation. [Google Scholar]
Copyright © 2016. This article is licensed under a Creative Commons Attribution 4.0 International License.