Abstract
Aim of this pilot study was to assess the driving performance and its relationship to the visual search behavior, i.e., eye and head movements, of patients with homonymous visual field defects (HVFDs) in comparison to healthy-sighted subjects during a simulated driving test. Eight HVFD patients and six healthy-sighted age- and gender-matched control subjects underwent a 40-minute driving test with nine hazardous situations. Eye and head movements were recorded during the drive. Four out of eight patients passed the driving test and showed a driving performance similar to that of the control group. One control group subject failed the test. Patients who passed the test showed an increased number of head and eye movements. Patients who failed the test showed a rightwards-bias in average lane position, probably in an attempt to maximize the safety margin to oncoming traffic. Our study supports the hypothesis that a considerable subgroup of subjects with HVFDs show a safe driving behavior, because they adapt their viewing behavior by increased visual scanning.
Introduction
Driving fitness is assessed based on visual functions, such as the extent of the visual field, visual acuity, contrast sensitivity, and color vision. Based on these assessments, patients with homonymous visual field defects (HVFDs), i.e., visual field defects affecting corresponding areas on both eyes, are considered unsafe drivers. Therefore, HVFD patients are prohibited from driving in many countries (Casson & Racette, 2000; Silveira, Jolly, Heard, Clunas, & Kay, 2007; International Council of Ophthalmology, 2006).
Only few countries, i.e., the Netherlands, Belgium, the UK, Canada and parts of the U.S., offer an on-road driving test to keep the driving license despite the visual field loss. Homonymous visual field defects occur as a result of stroke, brain tumors, or traumatic brain injury. Their prevalence has been estimated at 0.8% in a population aged 49 and above (Gilhotra, Mitchell, Healey, Cumming, & Currie, 2002). More specifically, HVFDs are found in approximately 8% of stroke patients (Gilhotra et al., 2002) and 25% of traumatic brain injury patients (Van Stavern, Biousse, Lynn, Simon, & Newman, 2001; Bruce, Zhang, Kedar, Newman, & Biousse, 2006).
Driving fitness of subjects with HVFDs has been studied in different ways, e.g., by means of selfreported accidents, police charts, driving simulation, and on-road studies. The majority of studies have reported difficulties with lane keeping, unstable steering, and inadequate hazard detection (Tant, Brouwer, Cornelissen, & Kooijman, 2002; Wood et al., 2009; Szlyk, Brigell, & Seiple, 1993; Tant, Cornelissen, Kooijman, & Brouwer, 2002; Bowers, Mandel, Goldstein, & Peli, 2009, 2010). A general consensus is that there is a wide variation regarding the driving fitness of patients with HVFDs, with the percentage of patients judged fit-todrive ranging between 17% (Tant, Brouwer, et al., 2002) and 73% (Wood et al., 2009). Hence, it was suggested that some patients are able to compensate for their visual impairment by means of eye and head movements towards collision-relevant objects (Wood et al., 2009; Papageorgiou, Hardiess, Mallot, & Schiefer, 2012; Racette & Casson, 2005; Kasneci, Sippel, Aehling, et al., 2014; Hamel et al., 2011).
The development of realistic driving simulators has shown that compensation for HVFDs is indeed possible by means of increased eye and head scanning towards collision-relevant objects (Papageorgiou, Hardiess, Mallot, & Schiefer, 2012; Bowers, Ananyev, Mandel, Goldstein, & Peli, 2014). Gaze compensation has also been confirmed under on-road conditions (Kasneci, Sippel, Aehling, et al., 2014; Wood et al., 2011). However, many studies did not report the correlation between the studied parameters and actual driving fitness (Bowers et al., 2009, 2014; Alberti, Peli, & Bowers, 2014), the simulation was not realistic enough to assess driving fitness (Papageorgiou, Hardiess, Mallot, & Schiefer, 2012), head and/or eye movements were analyzed from video footage (Kasneci, Sippel, Aehling, et al., 2014; Wood et al., 2011), or eye movements were not recorded (Bowers et al., 2014).
Aim of the present study was the investigation of driving fitness of HVFD patients and its relationship to visual scanning behavior under standardized conditions in one of the most advanced driving simulators worldwide. Driving fitness was assessed according to the requirements of the German driving test. In addition, we analyzed several driving-related performance parameters, such as lane keeping, steering stability, and speed. We hypothesized that (i) driving fitness and driving-related performance measures (e.g., speed, lane keeping ability) would be worse in subjects with HVFDs than in healthy-sighted subjects, (ii) HVFD patients with increased gaze movements would show a better driving performance and be rated as fit to drive more often, (iii) time since brain lesion would affect fitness to drive, and (iv) patients with HVFDs would show a tendency for higher collision rates with objects on the impaired side of the visual field.
Methods
Eight patients with HVFDs (three with right-sided and five with left-sided HVFDs; see demographic data and individual defect areas in Figure 1) were compared to six healthy-sighted ageand gender-matched control subjects. To each of the HVFD subjects, we assigned a control subject of the same gender and an age difference of at most 5 years. All participants were at least 18 years old, had best corrected monocular (near and distant) visual acuity of at least 20/25, and normal function and morphology of the anterior visual pathways.
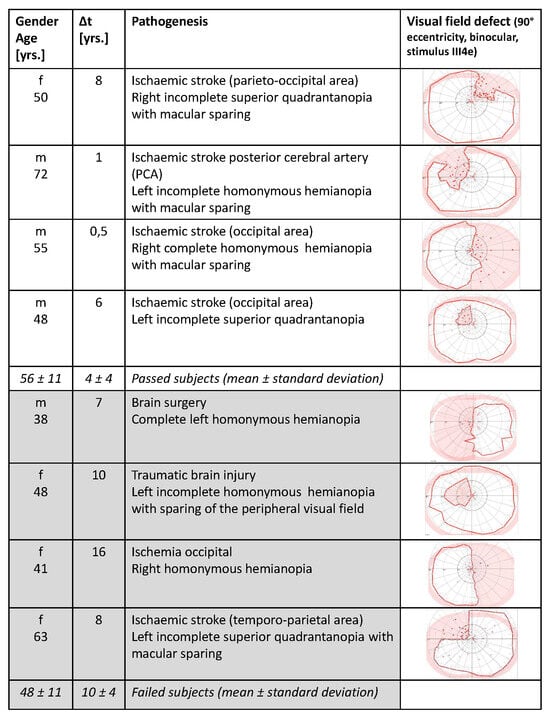
Figure 1.
Demographic data and binocular visual fields for the HVFD patients. ∆t denotes the time since brain lesion. Patients who failed the driving fitness test are shaded in gray.
Visual fields were assessed by means of binocular semi-automated 90° kinetic perimetry (SKP) obtained with the OCTOPUS 101 Perimeter (Fa. HAAG-STREIT, Koeniz, Switzerland). Only the stimulus III/4e (background luminance 10 cd/m2, angular velocity 3°/s) was used because this is the functionally relevant target typically used to define legal blindness and also the visual field extent in driving license forms in Germany.
Visual field results were evaluated by two experienced neuro-ophthalmologists. HVFDs included complete homonymous hemianopia (n=3), incomplete homonymous hemianopia (n=2), and incomplete homonymous quadrantanopia (n=3). Four patients had macular sparing. Patients with visual hemineglect, significant cognitive decline, or physical impairment, which could affect standard vehicle use, were excluded by means of neuropsychological testing including the Bells test, letter cancellation test, star cancellation test, and the mini-mental state examination (no cognitive impairment=24-30) (Vanier et al., 1990; Folstein, Folstein, & McHugh, 1975). All patients had owned a driving license for years, but none of them met the legal criteria for driving according to the recommendations of the German Ophthalmological Society.
Patients were recruited from the department of Neuro-Ophthalmology at the University of Tübingen (Germany). The research study was approved by the Institutional Review Board of the University of Tübingen (Germany) and was performed according to the Declaration of Helsinki. Following verbal and written explanation of the experimental protocol, all subjects gave their written consent, with the option of withdrawing from the study at any time. All subjects received a travel expense allowance, covering costs for traveling, parking, and other costs related to their participation in the study.
An advanced moving-base driving simulator at the Mercedes-Benz Technology Center in Sindelfingen, Germany (Zeeb, 2010) (Figure 2) was used for this study. It provides a 360° virtual environment, contains a whole car body, and simulates acceleration effects, which enable a very realistic driving experience. To the best of our knowledge, this is the first study that combines a most realistic driving experience (since the subjects experience full inertial characteristics of an actual motor vehicle) with the advantage of being exposed to identical experimental settings. Nine hazardous situations occurred at predefined positions of the driving route (37.5 km length). Average completion time was 37 (±2) min. The speed limit varied between 100 km/h and 50 km/h, respectively.
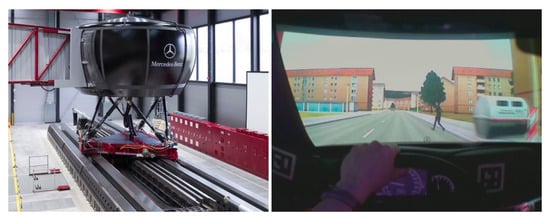
Figure 2.
Moving base driving simulator. The entire cabin is mounted on a hexapod, moving along the 12m rail resulting in up to 1g acceleration force. Virtual reality showing a pedestrian crossing the lane. Figures provided by Daimler AG.
In order to achieve a balance between a large number of hazardous situations, which is interesting for assessment of driving fitness, and a realistic driving test, the driving route consisted of two parts. The first part simulated a realistic driving scenario of 30.7 km distance with four hazardous situations, e.g., pedestrians suddenly appearing behind parked cars, or risky overtaking maneuvers of oncoming traffic. This part of the drive began with an introductory simple, straight road without oncoming traffic and gradually became more complex as it turned into an urban scenario, with denser traffic and more frequent traffic signs.
The second part of the drive (6.8 km distance) was more demanding and dense, since it involved five hazardous situations. A detailed description of the nine hazardous situations and their location on the driving route is presented in Table 1. Figure 2 shows an example of a hazardous situation, where a pedestrian is suddenly crossing the road from the right side. In order to prevent additional emotional stress, crashes were not simulated. Thus, even if the driver did not show a proper driving response, the hazardous situation was dissolved by the simulator (e.g., pedestrians leaped backwards or oncoming overtakers returned back into their lane).

Table 1.
Hazard description and their location during the driving course.
Under right-hand traffic conditions, hazardous objects approaching from the left side of the road would be visible earlier than objects from the right side, since they have to cross the left lane first. This would bias reaction times available for an adequate driving response. In order to avoid this effect, hazardous objects were hidden, e.g., behind parked vehicles or advertising pillars.
Eye movements were recorded by a mobile, headmounted Dikablis eye-tracking system by Ergoneers GmbH Manching, Germany (Dikablis 1.0.9). It was worn over the participants’ habitual glasses. The eye tracker performs video recordings of the eye as well as the driving scene, as seen from a position between the subject’s eyes above the bridge of the nose. Both videos can be superimposed after a calibration procedure in order to visualize the gaze position on the driving scene (see Supplementary Materials for an example video). Several difficulties regarding pupil detection have been previously reported when employing the above eye tracker in outdoor environments (Fuhl, Santini, Kübler, & Kasneci, 2015; Fuhl, Kübler, Sippel, Rosenstiel, & Kasneci, 2015; Kasneci, 2013). In (Kasneci, Sippel, Aehling, et al., 2014) for example, most of the recorded material had to be manually post-processed, since the tracker lost the pupil information due to changing illumination conditions and reflections on eye glasses. As in (Kübler et al., 2015), the controlled lighting conditions within the simulator environment allowed for good tracking even when glasses were worn. We employed a ninepoint calibration procedure with the subject seated in the driver’s seat. Calibration targets were included in the projection of the virtual driving scene.
Head position and orientation was recorded by means of an optical laserBIRD head-tracker (Ascension Technology Corporation, Burlington, USA). A sensor attached to a headband detects laser beams emitted from a scanner mounted over the passenger seat (with theoretical millimeter accuracy).
After the experiment, a certified driving instructor, who was masked to the participants medical status, evaluated the video material and rated the driving fitness of the subjects as passed or failed according to the standard requirements of the official German driving test (Bundesministerium für Justiz und Verbraucherschutz (Federal Ministry for Justice and Consumer Protection), 2013). The same driving instructor rated all subjects and recorded reasons for failing the test as well as the situation that led to test failure where applicable.
Due to missing data related to recordings of eye and head movements or early experiment abortion due to motion sickness, 118 (of theoretically 126 possible) hazardous situations were analyzed. The exact number of hazardous situations for each participant is shown in Figure 3. Although one control subject completed only the three first hazardous situations, the subject still drove about 25 km. One of the HL subjects had to quit the drive after the 7th hazardous situation due to motion sickness. Since both subjects drove a large part of the route, an extensive analysis of their driving and viewing behavior was possible. It is noteworthy here that even in motion-base simulators, where both visual and vestibular cues are delivered, the time span between onset of the visual or motor cues may be too long. Hence, sickness might still be experienced. It has not been investigated yet, whether patients with HVFDs experience altered levels of simulator sickness compared to control subjects. However, there is evidence that individuals who have difficulties with visuospatial tasks, such as HVFD patients, are more likely to experience simulator sickness (Parker & Harm, 1992). On the other hand, one might hypothesize that reduced optic flow in the visual system of patients with HVFD will result in a lower sickness rate. Due to the limited number of participants in the present study, neither of the two hypotheses can be confirmed by our data.
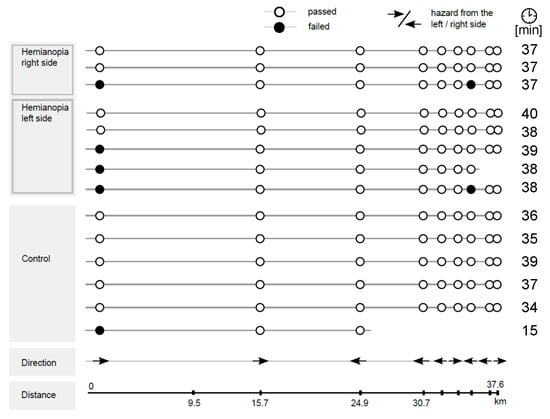
Figure 3.
Driving test result for each participant (rows) and each hazardous situation (columns). The last column shows the time each participant needed to complete the driving test. Arrows represent the direction from which the traffic hazard is approaching. Cases associated with a driving test failure are marked in black. Subjects are divided into the following subgroups: HC: control group, HR: HVFD patients with a right-sided visual field defect, HL: HVFD patients with a left-sided defect.
Eye-tracking calibration was accurate (within 5° ) for about 20 min. Afterwards, 2/3 of the recordings required offline calibration adjustment due to displacement of the eye tracker. A Bayesian online clustering algorithm (Tafaj, Kasneci, Rosenstiel, & Bogdan, 2012; Kasneci, Kasneci, Kübler, & Rosenstiel, 2015; Tafaj, Kübler, Kasneci, Rosenstiel, & Bogdan, 2013) was employed to identify fixations and saccades in the eye-tracking signal. The parameters of the model were adapted to the individual viewing behavior during the introductory part of the course.
Since prior studies with HVFDs patients reported that HVFD patients have difficulties with lane keeping (Wood et al., 2009; Bowers et al., 2009, 2010), we analyzed the average lane position during the drive. Furthermore, according to the adaptive integrated drivervehicle interface project (Östlund et al., 2005), the time to line crossing (TLC) of second order (Van Winsum, Brookhuis, & de Waard, 2000) was calculated. TLC reflects the driver’s ability to keep the lane and corresponds to the time remaining until either lane boundary is crossed by any of the wheels, when speed and steering wheel angle are not changed. In addition, heart rate, and galvanic skin conductance were measured; the analysis of these parameters has been published elsewhere (Kübler et al., 2014). The statistical analysis of head movement metrics was performed based on a linear mixed effects model in GnuR using lme4 (Bates, Mächler, Bolker, & Walker, 2015), eye movement metrics were evaluated by Anova. We chose an α-level of 5% for statistical significance.
Results
Fitness to drive
Four out of eight HVFD patients passed the driving assessment. One out of six control subjects failed. Figure 3 shows the driving assessment for each participant at each hazardous situation. Interestingly, there was no tendency for higher collision rates with vehicles on the blind side in the group of HVFD patients. Most subjects failed the driving test due to failure at the first situation, suggesting that they were unprepared for what was coming and drove more carefully afterwards. This may be the main reason for the lack of a side bias. Furthermore, no correlation was found between the mean time since brain lesion and driving fitness.
Gaze patterns
Head movements. Analysis of head movements over the whole drive showed that patients who passed the driving test performed significantly (Anova with Tukeys correction: p = 0.048) more head movements than patients who failed the driving test (Figure 4). On the other hand, patients who failed the driving test showed no increase in head movements when compared to the control group (p = 0.601).
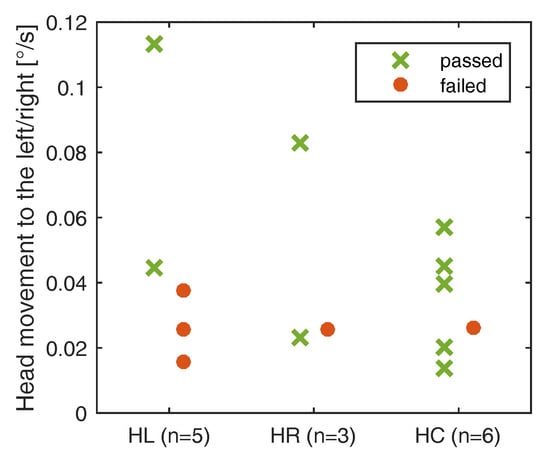
Figure 4.
Head movements to the left/right. For each of the subject subgroups, the mean and standard deviation of the magnitude of head orientation change per second is shown. The individual measurements contributing to the mean are shown as crosses. Subjects are divided into the following subgroups: HC: control group, HR: HVFD patients with a rightsided visual field defect, HL: HVFD patients with a left-sided defect.
Eye movements. Patients who failed the driving test showed an average eye position bias to the right side of the road (Figure 5) even though most of them had a left-sided HVFD. There was no difference in the horizontal eye position distribution between patients who passed the driving test and the control group, Figure 5.
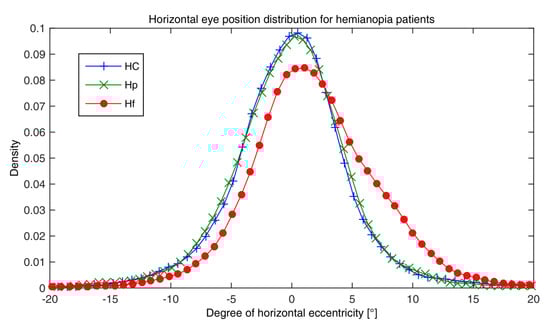
Figure 5.
Horizontal eye distribution of the control group (HC), HVFD patients who passed the driving test (Hp) and HVFD patients who failed (Hf) the driving test.
Saccadic length was significantly larger in patients who passed the driving test compared to those who failed (mean values 530 vs. 413, Table 2 and Figure 6). To compare the visual scanning behavior between the subject subgroups, we analyzed four additional parameters related to eye movements as shown in Figure 6: (i) average fixation duration in ms, (ii) the number of fixations per minute, (iii) the ratio between horizontal and vertical fixations, and (iv) the horizontal saccadic orientation, i.e., saccadic orientation relative to the x-axis.
Table 2.
ANOVA results for the gaze parameters and driving speed. Reported are the experiment groups tested against each other, the degree of freedom (df) and value of the F-statistic and the resulting p-value. * marks significant results (level 0.05).
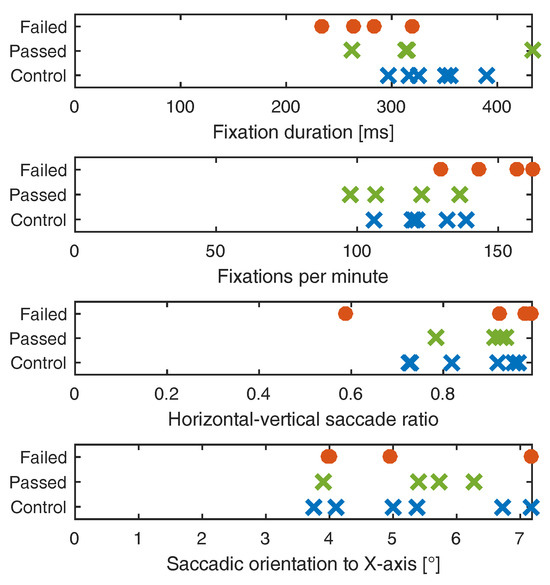
Figure 6.
Measures derived from eye tracking for the control group (HC), HVFD patients who passed the driving test (Hp) and HVFD patients who failed the driving test (Hf).
The above analysis showed that patients who failed the driving test performed significantly shorter fixations than control subjects who passed the test (mean value 328 ms vs. 408 ms, Table 6), whereas no difference was found between patients who passed and control subjects who passed the task (mean values 397 ms vs. 408 ms). We also found that patients who failed performed significantly more fixations per minute than control subjects who passed (148 vs. 123). In contrast, the number of fixation per minute was similar between patients who passed and control subjects who passed (116 vs. 123). We found differences between the subject groups in terms of the horizontal-vertical saccade ratio and the average saccade orientation. These metrics capture the amount of horizontal scanning, a theoretically reasonable compensatory strategy for the HVFD. Furthermore, no correlation was found for compensatory saccades towards the visual field defect side.
Driving performance measures
Lane position. The average lateral position of the vehicle on the lane is shown in Figure 7. The average lane position of control subjects was considered as reference, which in some cases deviated from the middle of the lane (curves and evasive driving). Our analysis revealed that HVFD patients who failed the driving test maintained a lane position to the right of the control group during curves and to a lesser extent on straight road segments.
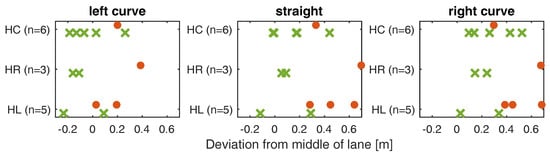
Figure 7.
Average lane position during left curves (left), on a straight road (middle) and during right curves (right). The means and standard deviations for subjects who passed and failed the driving task are depicted as crosses (green) and circles (red), respectively. HC: control group, HR: HVFD patients with a right-sided visual field defect, HL: HVFD patients with a left-sided defect.
Time to Line Crossing (TLC). Figure 8 presents the TLC for all participants. Regarding this parameter, which indicates the steering stability, there were no differences between patient and control groups. Further steering steadiness measures, such as lane position variance and steering reversals, did not reveal clear trends either and are therefore not depicted here.
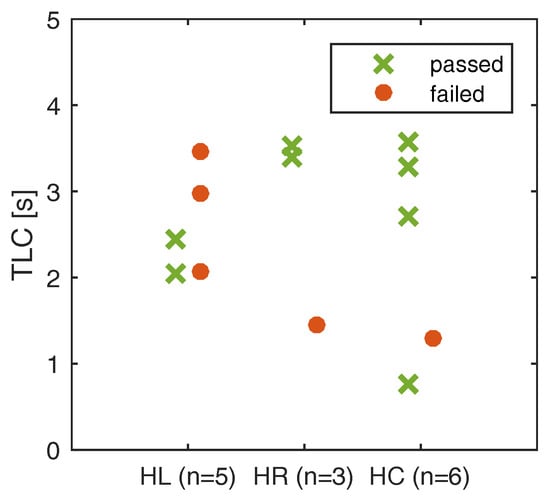
Figure 8.
Time to line crossing (TLC) for the patient groups and the control subjects. The means and standard deviations for subjects who passed and failed the driving task are depicted as crosses (green) and circles (red), respectively. HC: control group, HR: HVFD patients with a right-sided visual field defect, HL: HVFD patients with a left-sided defect.
Speed. The average speed driven is shown in Figure 9 and reveals that most patients do not have difficulties identifying and keeping speed limits. More specifically, there were no significant differences between control subjects and HVFD patients who passed the driving test (mean value 62 km/h vs. 60 km/h, Table 2) and between HVFD subjects who passed and those who failed (mean value 60 km/h vs. 59 km/h). In particularly, HVFD patients did not show a speed reduction.
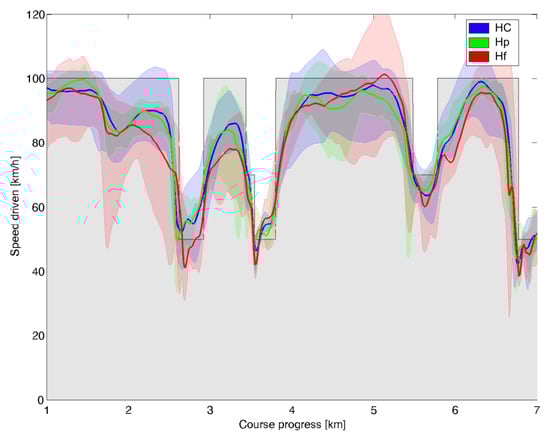
Figure 9.
Speed driven during the first seven kilometers. The line indicates the average speed in the group, the boundaries of the colored area show the minimum and maximum speed. HC: control group, Hp: HVFD patients who passed the driving test, Hf: HVFD patients who failed the driving test.
Discussion
Prior on-road and simulator studies (Bowers et al., 2014; Alberti et al., 2014; Wood et al., 2011; Coeckelbergh, Brouwer, Cornelissen, Van Wolffelaar, & Kooijman, 2002) on the driving ability of subjects with binocular visual field loss have either reported the percentage of patients who were fit to drive without recording their eye and head movements, or evaluated various driving behaviors (e.g., hazard detection performance, lane keeping ability, steering steadiness) without linking them to a driving test outcome measure. In the above studies, patients with HVFDs were usually averaged as one group compared to normal subjects. However, as reported in a recent study by Kasneci et al. (Kasneci, Sippel, Aehling, et al., 2014), who investigated driving performance and visual search behavior during an on-road driving test, there is evidence for differences between patients who are fit to drive and patients showing unsafe driving behavior, regarding both visual exploration strategy and driving behavior. Hence, in the present study, we aimed at identifying the exploratory patterns and driving performance measures that are associated with successful driving performance in a simulated test. The study parameters were compared across healthy-sighted subjects, patients who passed, and patients who failed the test. Since our study was conducted in an advanced, moving-base driving simulator, we attempted to provide a realistic driving experience under standardized conditions. In addition, eye and head tracking allowed a robust analysis of the visual exploratory behavior.
Fitness to drive
When HVFD patients are analyzed as a group, they have more inadequate driving responses in hazardous situations compared to control subjects. However, when driving behavior is analyzed individually, half of the patients are rated as fit to drive.
Prior simulator studies reported various results and the discrepancies found between them and the present study are mainly due to the different design of the simulator and stimuli, variable patient inclusion criteria, different study parameters, and number of patients. Some studies have reported higher success rates for HVFDs patients in simulated environments, possibly due to the simplified design or lower visual and cognitive demands, which have not allowed a discrimination between patients who compensate and those who are unable to do so (Schulte, Strasburger, Müller-Oehring, Kasten, & Sabel, 1999). Our findings are not consistent with Schulte et al. (Schulte et al., 1999) who found no driving-related disabilities in six patients with HVFDs. However, the simulator task was a simplification of a real-world driving situation with a restricted field of view (16 × 21) and few unexpected events. In a collision avoidance experiment, (Papageorgiou, Hardiess, Ackermann, et al., 2012) reported higher avoidance rates for HVFD patients (up to 77%). However, that simulation was not realistic enough. Hence, a certain level of visual and cognitive load seems to be necessary, in order to force patients to use their compensatory gaze potential. On the other hand, some studies have reported very low success rates for HVFD patients (Szlyk et al., 1993; Lövsund, Hedin, & Törnros, 1991). Lövsund et al. (Lövsund et al., 1991) found that only three out of 26 patients with HVFDs were able to compensate during a detection task. However, the above study used static stimuli that were not part of the driving scene. Similarly, Szlyk et al. (Szlyk et al., 1993) reported that performance of patients with HVFDs was worse than or similar to an older control group. However, they included three patients with hemineglect, two months post-stroke and the test had a shorter duration (5 min).
Similar considerations apply for some on-road studies. Tant et al. (Tant, Brouwer, et al., 2002) and Kooijman et al. (Kooijman et al., 2004) report a pass rate of HVFD patients less than 15%. These studies, however, included patients whose driving was suspected to be unsafe (Tant, Brouwer, et al., 2002; Kooijman et al., 2004). On the other hand, Wood et al. (Wood et al., 2009) recently reported a higher fit-todrive rates of patients with homonymous hemianopia (HH, 73%) and homonymous quadrantanopia (QH, 88%). However, 44% of initially eligible patients did not participate in the study, and might have been problematic drivers. Other possible explanations for the lower pass rates in the present study compared to the Wood study (Wood et al., 2009), are the different design possibly the hazardous situations have been more demanding in the simulator, the use of different and subjective schemes for rating the safety of the drivers, and the possibility that patients have driven more carefully on-road.
In conclusion, the fact that some patients with HVFDs, who did not meet the legal requirements for driving, were judged as fit-to-drive in this simulator test, confirms previous hypotheses that visual-field related parameters per se are inadequate for assessment of driving fitness and more individualized approaches are required (Wood et al., 2009; Papageorgiou, Hardiess, Mallot, & Schiefer, 2012; Kasneci, Sippel, Aehling, et al., 2014). Similarly, the prediction of driving safety in patients with HVFDs by evaluating the causative brain lesion on clinical neuroimaging has not been successful (Vaphiades et al., 2014). While imaging studies do suggest that certain brain regions are linked with specific parameters of driving performance, this may not necessarily result in an unsafe driver (Vaphiades et al., 2014). Finally, in our scenario, there was no association between the HVFD side and the side of the hazardous event that caused a failure of the driving test. However, we did not explicitly perform a detection task and we included only nine safety critical situations in an attempt to achieve realistic driving conditions. Therefore, a direct comparison of detection rates with previous studies cannot be performed (Bowers et al., 2009; Papageorgiou, Hardiess, Mallot, & Schiefer, 2012).
Gaze patterns (eye and head movements)
In accordance with previous studies, our results confirm increased head movements and longer saccades in patients who were judged as fit-to-drive (Papageorgiou, Hardiess, Mallot, & Schiefer, 2012; Kasneci, Sippel, Aehling, et al., 2014; Wood et al., 2011; Kooijman et al., 2004). Compensation by increased saccadic amplitudes in patients with HVFDs has been reported by various authors in less advanced driving simulator settings (Papageorgiou, Hardiess, Ackermann, et al., 2012; Bahill, Adler, & Stark, 1975; Hardiess, Papageorgiou, Schiefer, & Mallot, 2010). Furthermore, in a previous simulated collision avoidance task (Papageorgiou, Hardiess, Ackermann, et al., 2012), the authors reported larger mean gaze eccentricity in the group of adequately compensating patients (who had few collisions) compared to the control group. However, in the latter study, we had only reported the average gaze (combined eye and head) position. Recently, Bowers et al. (Bowers et al., 2014) also quantified head scanning and found that HH drivers had impaired detection of blind side stationary pedestrians at simulated intersections, either due to not scanning or an insufficient scan magnitude. The same authors found that successful detection of a pedestrian moving on a collision course in the blind field was associated with a saccadic eye movement towards the target (Bowers et al., 2009). Pedestrians were presented at a relatively small eccentricity of 14°, which was likely to be within the range of a typical eye saccade (rarely greater than 15° in normal individuals) (Bahill et al., 1975; Bronstad, Bowers, Albu, Goldstein, & Peli, 2011). Similarly, in another simulator study, more frequent compensatory saccades to the VFD side but no head movements were found for one patient who had no collisions (Hamel et al., 2011). However, the horizontal field of view was much smaller (58° versus 360° in the present study), therefore, the contribution of head movements to gaze compensation might have been underestimated. Possibly for the same reason (i.e., the smaller stimulus area) Zangemeister et al. (Zangemeister, Meienberg, Stark, & Hoyt, 1982) have reported smaller head movement proportions in combined head-eye saccades, and suggested that head movement programming is more time-consuming for HVFD patients. However, other studies investigating visual search behavior of patients with HVFDs in everyday tasks have confirmed the use of compensatory eye and head movements (Kasneci, Sippel, Heister, et al., 2014). An extreme example of the efficient exploration strategies following a long-standing brain lesion is congenital occipital hemianopia. The condition is usually discovered as an incidental finding during a routine perimetric examination or a routine physical examination of a healthy young adult. Those patients with very long-standing occipital hemianopia usually employ one large saccade that overshoots the target. This way they hold their direction of gaze so that the seeing hemifields overlap the target and they use their half visual field to scan and inspect both right and left sides of space (Hoyt, 1985). Interestingly, the majority of patients who failed the driving test had left-sided visual field defects and showed a rightward deviation of eye position. Recent evidence suggests that under demanding visual search conditions, inappropriate right-directed saccades are performed not only by neglect patients, but also by right brain-damaged patients without neglect on paper-and-pencil tests (Bourgeois et al., 2015). Although the patients who participated in our study had no neglect according to the standardized paper-and-pencil tests, attentionally demanding tasks may have triggered more subtle visuospatial bias. The rightward gaze bias may also be linked to the more rightward lane position discussed below. However, the visual field defects in the present study are quite heterogeneous and the patient sample relatively small, hence no clear conclusion can be drawn.
In accordance with this study, video recordings from our recent on-road test revealed that patients with HVFDs who passed the driving test performed more head and shoulder movements towards their blind side (Kasneci, Sippel, Aehling, et al., 2014). Identical results of an earlier study also provided a direct association between efficient exploration (eye and head) movements and an adequate behavioral response, namely the successful outcome of an on-road driving test (Kasneci, Sippel, Aehling, et al., 2014; Wood et al., 2011). The present study provides additional evidence based on the accuracy and standardization that can be achieved in a simulator.
In accordance with previous literature, our findings indicate that patients with homonymous visual field defects perform more and shorter fixations than control subjects (Coeckelbergh, Cornelissen, Brouwer, & Kooijman, 2002). This effect seems to be even stronger in the group of patients who failed the driving test. It seems that fixation duration in unsafe HVFD drivers is not long enough, in order to allow acquisition of the relevant visual information. Increasing the number of fixations is an inadequate compensation strategy for the present task, either due to their shorter duration (see above), or due to a problematic selection of targets, i.e., collision-relevant stimuli.
It is noteworthy that no correlation was found between the mean time since brain lesion and driving fitness. While one patient successfully employed compensatory strategies after only half a year, other patients did not succeed even after 10 years’ time. It was unlikely that any significant effect would be revealed, because our patient group was homogeneous and the time span after lesion onset was at least six months. Studies suggest that six months post-injury is the time span, after which spontaneous recovery of visual field is unusual in vascular lesions and patients have adapted a compensatory eye movement strategy (Pambakian, Mannan, Hodgson, & Kennard, 2004; Zhang, Kedar, Lynn, Newman, & Biousse, 2006).
Driving performance measures
Problems with steering stability and lane keeping in patients with hemianopia have been reported for simulator and on-road studies (Tant, Brouwer, et al., 2002; Szlyk et al., 1993; Kasneci, Sippel, Aehling, et al., 2014; Kooijman et al., 2004). A previous study (Wood et al., 2011) showed that safe hemianopic drivers maintained a central lane position, and we also found that HVFD drivers who failed the driving test (with leftand right-sided HVFDs) maintained a lane position towards the right side of the road. This deviation was observed on all road segment types, and was more obvious during curves. One explanation is that drivers try to increase their safety margin towards the oncoming traffic; however, for patients who cannot compensate, this behavior leads to an unacceptable rightward lateral deviation and test failure. Bowers et al. (Bowers et al., 2010) found that all drivers with HVFDs adopted a lane position toward their seeing field, but their study did not determine whether lane positioning characteristics vary between safe and unsafe hemianopic drivers (Bowers et al., 2010).
Our findings are consistent with the on-road study of Kooijman et al. (Kooijman et al., 2004), who observed unacceptable lateral deviations in eight out of 28 subjects with HVFDs and did not find a relationship between the side of the lateral deviation and the side of the HH. Similar on-road results were also reported by Tant et al. (Tant, Brouwer, et al., 2002), who observed that only patients with right HH drove too close to the right side of the road. Thus, the oncoming traffic seems to be a source of feedback and correction for the deviant lateral position (Tant, Brouwer, et al., 2002).
Speed management skills have been reported to be problematic in patients with HVFDs, as safe drivers drove at higher speeds in the Wood et al. study (Wood et al., 2011). Other authors have reported that patients with HVFDs dramatically reduce speed in an attempt to compensate, which may result in the subjects vehicle being an unacceptable obstacle for other traffic participants (Tant, Brouwer, et al., 2002). No difficulties were found in our study population in accordance with previous simulator experiments (Szlyk et al., 1993; Schulte et al., 1999) and a recent on-road study (Kasneci, Sippel, Aehling, et al., 2014). Variable findings regarding speed could be attributed to our small sample size or different task design, i.e., speed limits, road segment types and subjectivity of observers assessments.
Study limitations
Despite the considerable total number of 14 participants in this study, our findings should be interpreted in the light of some limitations. The number of subjects in the subgroups was relatively small to derive significant differences between them. Furthermore, we included patients with both hemianopia and quadrantanopia. Although we designed and scored the driving test as close to real-world conditions as possible, the validity of the measures generated in the simulator still has to be established. Furthermore, subjects were aware that they were performing a driving test, which may have influenced their typical driving behavior and alertness. However, the simulator provided us a unique possibility of standardizing the traffic scenario, and therefore, establishing the same driving conditions for all participants. Further limitations arise due to the employed eye-tracking device. The tracking accuracy was approximately 5° at a sampling rate of 25 Hz. For the detailed analysis of further eye movement parameters, mobile eye trackers at higher sampling rates would have to be employed.
Conclusion
Our study supports the hypothesis that a considerable subgroup of subjects with HVFDs shows a safe driving behavior due to increased head and eye movements scanning. To our knowledge, this is the first study to quantitatively assess both eye and head movements in an advanced moving-base driving simulator with unexpected appearance of traffic hazards. Furthermore, individual performance differences in terms of driving fitness could be related to visual exploratory behavior. Our study showed an effect of visual field defects on the horizontal gaze distribution and lane position and a correlation to the outcome of a driving test. These results indicate the need for individualized driving assessments for patients with HVFDs, since patients who are able to compensate might be eligible for a restricted driving license. In addition, the present findings will assist in the development of training interventions and diagnostic tools for the clinical setting. Novel examination methods should assess the compensatory eye and head movements, in order to enable the clinicians to accurately identify patients eligible for on-road assessments.
Acknowledgments
The authors would like to thank Pfizer and MSD Sharp & Dohme GmbH for supporting and enabling this study. We further thank Daimler AG for this collaboration, the driving instructor Helmut Hanne, and the ophthalmologists Christian Heine and Kai Januschowski. The second author would like to gratefully acknowledge financial support by the Margarete-von-Wrangell program of the MWK BadenWürttemberg.
References
- Alberti, C. F.; Peli, E.; Bowers, A. R. Driving with hemianopia: III. Detection of stationary and approaching pedestrians in a simulator. Investigative Ophthalmology & Visual Science 2014, 55(1), 368–374. [Google Scholar]
- Bahill, A. T.; Adler, D.; Stark, L. Most naturally occurring human saccades have magnitudes of 15 degrees or less. Investigative Ophthalmology & Visual Science 1975, 14(6), 468–469. [Google Scholar]
- Bates, D.; Mächler, M.; Bolker, B.; Walker, S. Fitting linear mixed-effects models using lme4. Journal of Statistical Software 2015, 67(1), 1–48. [Google Scholar] [CrossRef]
- Bourgeois, A.; Chica, A. B.; Migliaccio, R.; Bayle, D. J.; Duret, C.; Pradat-Diehl, P.; Bartolomeo, P. Inappropriate rightward saccades after right hemisphere damage: Oculomotor analysis and anatomical correlates. Neuropsychologia 2015, 73, 1–11. [Google Scholar] [CrossRef]
- Bowers, A. R.; Ananyev, E.; Mandel, A. J.; Goldstein, R. B.; Peli, E. Driving with hemianopia: IV. Head scanning and detection at intersections in a simulator. Invest Ophthalmol Vis Sci 2014, 55(3), 1540–1548. [Google Scholar] [CrossRef] [PubMed]
- Bowers, A. R.; Mandel, A. J.; Goldstein, R. B.; Peli, E. Driving with hemianopia, I: Detection performance in a driving simulator. Investigative Ophthalmology & Visual Science 2009, 50(11), 5137–5147. [Google Scholar]
- Bowers, A. R.; Mandel, A. J.; Goldstein, R. B.; Peli, E. Driving with hemianopia, II: Lane position and steering in a driving simulator. Investigative Ophthalmology & Visual Science 2010, 51(12), 6605–6613. [Google Scholar]
- Bronstad, P.; Bowers, A.; Albu, A.; Goldstein, R.; Peli, E. Hazard detection by drivers with paracentral homonymous field loss: A small case series. J Clin Exp Ophthalmol. S 2011, 5. [Google Scholar] [CrossRef]
- Bruce, B. B.; Zhang, X.; Kedar, S.; Newman, N. J.; Biousse, V. Traumatic homonymous hemianopia. Journal of Neurology, Neurosurgery & Psychiatry 2006, 77(8), 986–988. [Google Scholar]
- Bundesministerium für Justiz und Verbraucherschutz (Federal Ministry for Justice and Consumer Protection). Verordnung über die Zulassung von Personen zum Straßenverkehr (Fahrerlaubnis-Verordnung—FeV); BMJV in cooperation with juris GmbH, 2013; Available online: http://www.gesetze-im-internet.de/bundesrecht/.
- Casson, E. J.; Racette, L. Vision standards for driving in canada and the united states. a review for the canadian ophthalmological society. Canadian Journal of Ophthalmology/Journal Canadien d’Ophtalmologie 2000, 35(4), 192–203. [Google Scholar] [CrossRef]
- Coeckelbergh, T. R.; Brouwer, W. H.; Cornelissen, F. W.; Van Wolffelaar, P.; Kooijman, A. C. The effect of visual field defects on driving performance: A driving simulator study. Archives of ophthalmology 2002, 120(11), 1509–1516. [Google Scholar] [CrossRef]
- Coeckelbergh, T. R.; Cornelissen, F. W.; Brouwer, W. H.; Kooijman, A. C. The effect of visual field defects on eye movements and practical fitness to drive. Vision research 2002, 42(5), 669–677. [Google Scholar] [CrossRef]
- Folstein, M. F.; Folstein, S. E.; McHugh, P. R. Minimental state: A practical method for grading the cognitive state of patients for the clinician. Journal of psychiatric research 1975, 12(3), 189–198. [Google Scholar] [CrossRef] [PubMed]
- Fuhl, W.; Kübler, T.; Sippel, K.; Rosenstiel, W.; Kasneci, E. ExCuSe: Robust Pupil Detection in Real-World Scenarios. In Computer analysis of images and patterns; 2015; pp. 39–51. [Google Scholar]
- Fuhl, W.; Santini, T. C.; Kübler, T.; Kasneci, E. ElSe: Ellipse Selection for Robust Pupil Detection in RealWorld Environments (arXiv:1511.06575). 2015. Available online: http://arxiv.org/abs/1511.06575.
- Gilhotra, J. S.; Mitchell, P.; Healey, P. R.; Cumming, R. G.; Currie, J. Homonymous visual field defects and stroke in an older population. Stroke 2002, 33(10), 2417–2420. [Google Scholar] [CrossRef] [PubMed]
- Hamel, J.; Kraft, A.; Ohl, S.; De Beukelaer, S.; Audebert, H. J.; Brandt, S. A. Driving simulation in the clinic: Testing visual exploratory behavior in daily life activities in patients with visual field defects. Journal of visualized experiments: JoVE 2011, (67), e4427. [Google Scholar]
- Hardiess, G.; Papageorgiou, E.; Schiefer, U.; Mallot, H. A. Functional compensation of visual field deficits in hemianopic patients under the influence of different task demands. Vision research 2010, 50(12), 1158–1172. [Google Scholar] [CrossRef]
- Hoyt, W. F. Congenital occipital hemianopia. Neuro-Ophthalmol Jpn 1985, 2, 252–259. [Google Scholar]
- International Council of Ophthalmology. Visual standards: Vision requirements for driving safety; International Council of Ophthalmology, 2006; Available online: www.icoph.org/pdf/visionfordriving.pdf.
- Kasneci, E. Towards the automated recognition of assistance need for drivers with impaired visual field; University of Tübingen: Wilhelmstr. 32, 72074 Tübingen, 2013; Volume 32, p. 72074.
- Kasneci, E.; Kasneci, G.; Kübler, T. C.; Rosenstiel, W. Koprinkova-Hristova, P., Mladenov, V., Kasabov, N. K., Eds.; Online recognition of fixations, saccades, and smooth pursuits for automated analysis of traffic hazard perception. In Artificial neural networks; Springer International Publishing, 2015; Vol. 4, pp. 411–434. [Google Scholar]
- Kasneci, E.; Sippel, K.; Aehling, K.; Heister, M.; Rosenstiel, W.; Schiefer, U.; Papageorgiou, E. Driving with Binocular Visual Field Loss? A Study on a Supervised On-Road Parcours with Simultaneous Eye and Head Tracking. PLoS ONE 2014, 9(2), e87470. [Google Scholar] [CrossRef]
- Kasneci, E.; Sippel, K.; Heister, M.; Aehling, K.; Rosenstiel, W.; Schiefer, U.; Papageorgiou, E. Homonymous visual field loss and its impact on visual exploration: A supermarket study. Translational vision science & technology 2014, 3(6). [Google Scholar]
- Kooijman, A.; Brouwer, W.; Coeckelbergh, T.; Tant, M.; Cornelissen, F.; Bredewoud, R.; Melis-Dankers, B. Compensatory viewing training improves practical fitness to drive of subjects with impaired vision. Visual Impairment Research 2004, 6(1), 1–27. [Google Scholar] [CrossRef][Green Version]
- Kübler, T. C.; Kasneci, E.; Rosenstiel, W.; Heister, M.; Aehling, K.; Nagel, K.; Papageorgiou, E. Driving with glaucoma: Task performance and gaze movements. Optometry & Vision Science 2015, 92(11), 1037–1046. [Google Scholar]
- Kübler, T. C.; Kasneci, E.; Rosenstiel, W.; Schiefer, U.; Nagel, K.; Papageorgiou, E. Stress-indicators and exploratory gaze for the analysis of hazard perception in patients with visual field loss. Transportation Research Part F: Traffic Psychology and Behaviour 2014, 24, 231–243. [Google Scholar]
- Lövsund, P.; Hedin, A.; Törnros, J. Effects on driving performance of visual field defects: A driving simulator study. Accident Analysis & Prevention 1991, 23(4), 331–342. [Google Scholar]
- Östlund, J.; Peters, B.; Thorslund, B.; Engström, J.; Markkula, G.; Keinath, A.; Foehl, U. Driving performance assessment-methods and metrics, 2005.
- Pambakian, A.; Mannan, S.; Hodgson, T.; Kennard, C. Saccadic visual search training: A treatment for patients with homonymous hemianopia. Journal of Neurology, Neurosurgery & Psychiatry 2004, 75(10), 1443–1448. [Google Scholar]
- Papageorgiou, E.; Hardiess, G.; Ackermann, H.; Wiethoelter, H.; Dietz, K.; Mallot, H. A.; Schiefer, U. Collision avoidance in persons with homonymous visual field defects under virtual reality conditions. Vision Research 2012, 52(1), 20–30. [Google Scholar] [CrossRef] [PubMed]
- Papageorgiou, E.; Hardiess, G.; Mallot, H. A.; Schiefer, U. Gaze patterns predicting successful collision avoidance in patients with homonymous visual field defects. Vision research 2012, 65, 25–37. [Google Scholar] [CrossRef] [PubMed]
- Parker, D. E.; Harm, D. L. Mental rotation: A key to mitigation of motion sickness in the virtual environment? Presence (Cambridge, Mass.) 1992, 1(3), 329. [Google Scholar] [CrossRef]
- Racette, L.; Casson, E. J. The impact of visual field loss on driving performance: Evidence from on-road driving assessments. Optometry & Vision Science 2005, 82(8), 668–674. [Google Scholar]
- Schulte, T.; Strasburger, H.; Müller-Oehring, E. M.; Kasten, E.; Sabel, B. A. Automobile driving performance of brain-injured patients with visual field defects1. American journal of physical medicine & rehabilitation 1999, 78(2), 136–142. [Google Scholar]
- Silveira, S.; Jolly, N.; Heard, R.; Clunas, N. J.; Kay, L. Current licensing authority standards for peripheral visual field and safe on-road senior aged automobile driving performance. Clinical & Experimental Ophthalmology 2007, 35(7), 612–620. [Google Scholar]
- Szlyk, J. P.; Brigell, M.; Seiple, W. Effects of age and hemianopic visual field loss on driving. Optometry & Vision Science 1993, 70(12), 1031–1037. [Google Scholar]
- Tafaj, E.; Kasneci, G.; Rosenstiel, W.; Bogdan, M. Bayesian online clustering of eye movement data. In Proceedings of the Symposium on Eye Tracking Research and Applications; New York, NY, USA, ACM, 2012; pp. 285–288. [Google Scholar]
- Tafaj, E.; Kübler, T. C.; Kasneci, G.; Rosenstiel, W.; Bogdan, M. Mladenov, V., Koprinkova-Hristova, P., Palm, G., Villa, A. E., Appollini, B., Kasabov, N., Eds.; Online Classification of Eye Tracking Data for Automated Analysis of Traffic Hazard Perception. In Artificial Neural Networks and Machine Learning ICANN 2013; Springer Berlin Heidelberg, 2013; Vol. 8131, pp. 442–450. [Google Scholar]
- Tant, M.; Brouwer, W.; Cornelissen, F.; Kooijman, A. Driving and visuospatial performance in people with hemianopia. Neuropsychological rehabilitation 2002, 12(5), 419–437. [Google Scholar] [CrossRef]
- Tant, M.; Cornelissen, F.; Kooijman, A.; Brouwer, W. H. Hemianopic visual field defects elicit hemianopic scanning. Vision research 2002, 42(10), 1339–1348. [Google Scholar] [CrossRef] [PubMed]
- Vanier, M.; Gauthier, L.; Lambert, J.; Pepin, E.; Robillard, A.; Dubouloz, C.; Joannette, Y. Evaluation of left visuospatial neglect: Norms and discrimination power of two tests. Neuropsychology 1990, 4(2), 87. [Google Scholar] [CrossRef]
- Van Stavern, G. P.; Biousse, V.; Lynn, M. J.; Simon, D. J.; Newman, N. J. Neuro-ophthalmic manifestations of head trauma. Journal of Neuro-ophthalmology 2001, 21(2), 112–117. [Google Scholar] [CrossRef]
- Van Winsum, W.; Brookhuis, K. A.; de Waard, D. A comparison of different ways to approximate time-toline crossing (tlc) during car driving. Accident Analysis & Prevention 2000, 32(1), 47–56. [Google Scholar]
- Vaphiades, M. S.; Kline, L. B.; McGwin, G.; Owsley, C.; Shah, R.; Wood, J. M. Prediction of driving safety in individuals with homonymous hemianopia and quadrantanopia from clinical neuroimaging. Journal of ophthalmology 2014, 2014. [Google Scholar] [CrossRef]
- Wood, J. M.; McGwin, G., Jr.; Elgin, J.; Vaphiades, M. S.; Braswell, R. A.; DeCarlo, D. K.; Owsley, C. Onroad driving performance by persons with hemianopia and quadrantanopia. Investigative Ophthalmology & Visual Science 2009, 50(2), 577–585. [Google Scholar]
- Wood, J. M.; McGwin, G., Jr.; Elgin, J.; Vaphiades, M. S.; Braswell, R. A.; DeCarlo, D. K.; Owsley, C. Hemianopic and quadrantanopic field loss, eye and head movements, and driving. Investigative ophthalmology & visual science 2011, 52(3), 1220–1225. [Google Scholar]
- Zangemeister, W.; Meienberg, O.; Stark, L.; Hoyt, W. Eye-head coordination in homonymous hemianopia. Journal of neurology 1982, 226(4), 243–254. [Google Scholar] [CrossRef]
- Zeeb, E. Daimlers new full-scale, high-dynamic driving simulator a technical overview; INRETS, 2010. [Google Scholar]
- Zhang, X.; Kedar, S.; Lynn, M.; Newman, N.; Biousse, V. Natural history of homonymous hemianopia. Neurology 2006, 66(6), 901–905. [Google Scholar] [CrossRef] [PubMed]


Copyright © 2015. This article is licensed under a Creative Commons Attribution 4.0 International License.