In Experiment 1, the influence of noise in the recordings from the Eyelink II system on the detection of eye movements is investigated by comparing dummy eyes mounted on a dummy head, dummy eyes mounted on a human head and human eyes.
Method
Participants. Test runs with the dummy eye setup with the author as the participant showed that the rate of false microsaccade detections depended on the calibration of the system. To best mimic the setup of a typical microsaccade study, data were therefore collected across several participants (each with their own calibration). Eleven students from the university of Leuven and author FH took part in the experiment. The students all provided written consent for participation in the study, which was approved by the local ethics committee. They received 8.50 Euro for their participation.
Apparatus. Eye movements were recorded using an Eyelink II setup (SR research), consisting of two PCs and a head-mounted eye tracking device. One of the PCs recorded eye movements at a sampling rate of 500Hz in the pupil-only mode, while the other PC was used to present the stimuli to the participants. These stimuli were presented on a 21 inch Iiyama computer monitor at a 75Hz refresh rate placed at a distance of 57cm from the participant. Dummy eye recordings were obtained using a custom-built pair of glasses, constructed from a pair of reading glasses, white stickon paper and black insulation tape for the pupils, as shown in
Figure 1a. Before deciding on the size of dummy eye pupil to use, various size pupils were tested, suggesting that the results were only weakly influenced by the size of the dummy pupils. Because larger pupils could be more easily cut into a circular shape, a slightly larger diameter (1.5cm) was used. This somewhat large size compared to human pupils was, in part, compensated for by the larger distance from the dummy eyes where the cameras had to be placed due to the space taken by the glasses. The dummy pupils were placed in the center of a white background (oval shape) measuring 5.5cm by 3.2cm. Head movements of the participants were restricted with a chin rest that could be adjusted to the participant’s height.
Stimuli. As in earlier studies (e.g.,
Engbert & Kliegl, 2003;
Hermens & Walker, 2010), a cueing paradigm was adopted. Participants maintained fixation on a centrally presented fixation symbol (1 by 1 degree in visual angle; see
Figure 1b), which turned into an arrow, after which a peripherally presented target (star shape, 0.7 by 0.7 degrees in visual angle) was presented inside one of four laterally positioned place-holders (circles), presented at a distance of 9 degrees from visual fixation. The stimuli were presented in all of the recording conditions, including those in which recordings were made from the dummy eyes.
Design and procedure. Participants performed six blocks of 60 trials. Half of the blocks used the head motion correction of the Eyelink II system, whereas in the other half of the blocks this option was switched off. This motion correction option makes use of a sensor on the head-band worn by the participant and four markers on the corners of the screen, which provides information about the location of the head-band with respect of the screen. Orthogonally to this manipulation, the type of input to the eye tracking system was varied. Before each block, participants performed the nine-point calibration procedure of the Eyelink II system, in which they fixated a series of sequentially presented dots on the computer screen, until calibration was considered ‘good’ by the system (no obvious problems) and the recorded eye positions were aligned with a three by three grid corresponding to the locations of the fixation targets. After calibration, there were three possibilities. Either the head-band of the eye tracker was moved to the dummy-head (
Figure 1a) and the block was completed while the system recorded from the dummy eyes. Alternatively, after calibration, participants put on the dummy eye glasses, after which the block continued while the system recorded from the dummy eyes. In these blocks, participants were instructed to sit with their chin in the chin rest, close their eyes, and to try and sit as still as possible. In a third condition calibration was followed by the standard cueing task while the system recorded from the participants’ eyes. Also in this task, participants were asked to sit in the chin rest and to avoid moving their head. The cueing task is illustrated in
Figure 1b (see also,
Hermens & Walker, 2010). Participants were asked to fixate a central fixation target that changed into an arrow after 1000 to 1500ms. Participants remained fixated until the appearance of a peripheral target that they were asked to fixate as quickly as possible after it appeared. Peripheral targets appeared equally often left or right of fixation (never above or below fixation). They were paired with a valid arrow cue (pointing in the same direction as the target) on 80% of the trials and with an invalid cue (pointing in the opposite direction) on the remaining 20% of the trials. Note that while a cueing paradigm was used, it is not believed that this paradigm is critical for the present results. Instead, it provides a means to collect fixation data across intervals of a typical duration in microsaccade research.
The order of the six blocks was randomized across participants, leading to a similar distribution of the conditions across participants without the need for keeping a record of the order of presentation. Recording of eye movements during each trial continued until the detection of a large eye movement, based on a combined 80 deg/sec velocity and 3,000 deg/sec
2 criterion (similar to
Hermens & Walker, 2010). In all blocks, drift correction was performed before each tenth trial, which involved participants fixating a centrally presented fixation target, confirmed by a key-press by the experimenter (similar to
Hermens & Walker, 2010). This correction shifts all recorded eye positions according to the recorded position of gaze. While influencing the accurate localization of each recorded gaze position, it is not expected to influence detections of shifts of gaze, as required for microsaccade detection. In between blocks, participants were allowed a short break.
Data analysis. The recorded eye gaze positions during the fixation intervals (presentation of the fixation target and presentation of the cue; interval durations between 2500ms and 3500ms) were analyzed for microsaccades using the algorithm by Engbert and colleagues (
Engbert & Kliegl, 2003;
Engbert & Mergenthaler, 2006). In the algorithm, the two-dimensional velocity of each eye is compared to a threshold based on the observed variance in the recorded eye position on that trial (adopted to have blinks excluded to prevent undefined thresholds). Sections of the eye trace with a velocity exceeding a 6 median-based SD threshold, temporally overlapping in both eyes for at least 1 sample, and lasting for at least 6ms (3 data samples) were classified as microsaccades. For statistical comparisons across more than two levels univariate repeated measures ANOVAs were used and a Greenhouse-Geisser correction when appropriate. For t-tests, Hedges’s g is reported as a measure of effect size, computed using the effect size toolbox for Matlab (
Hentschke & Stüttgen, 2011).
Results
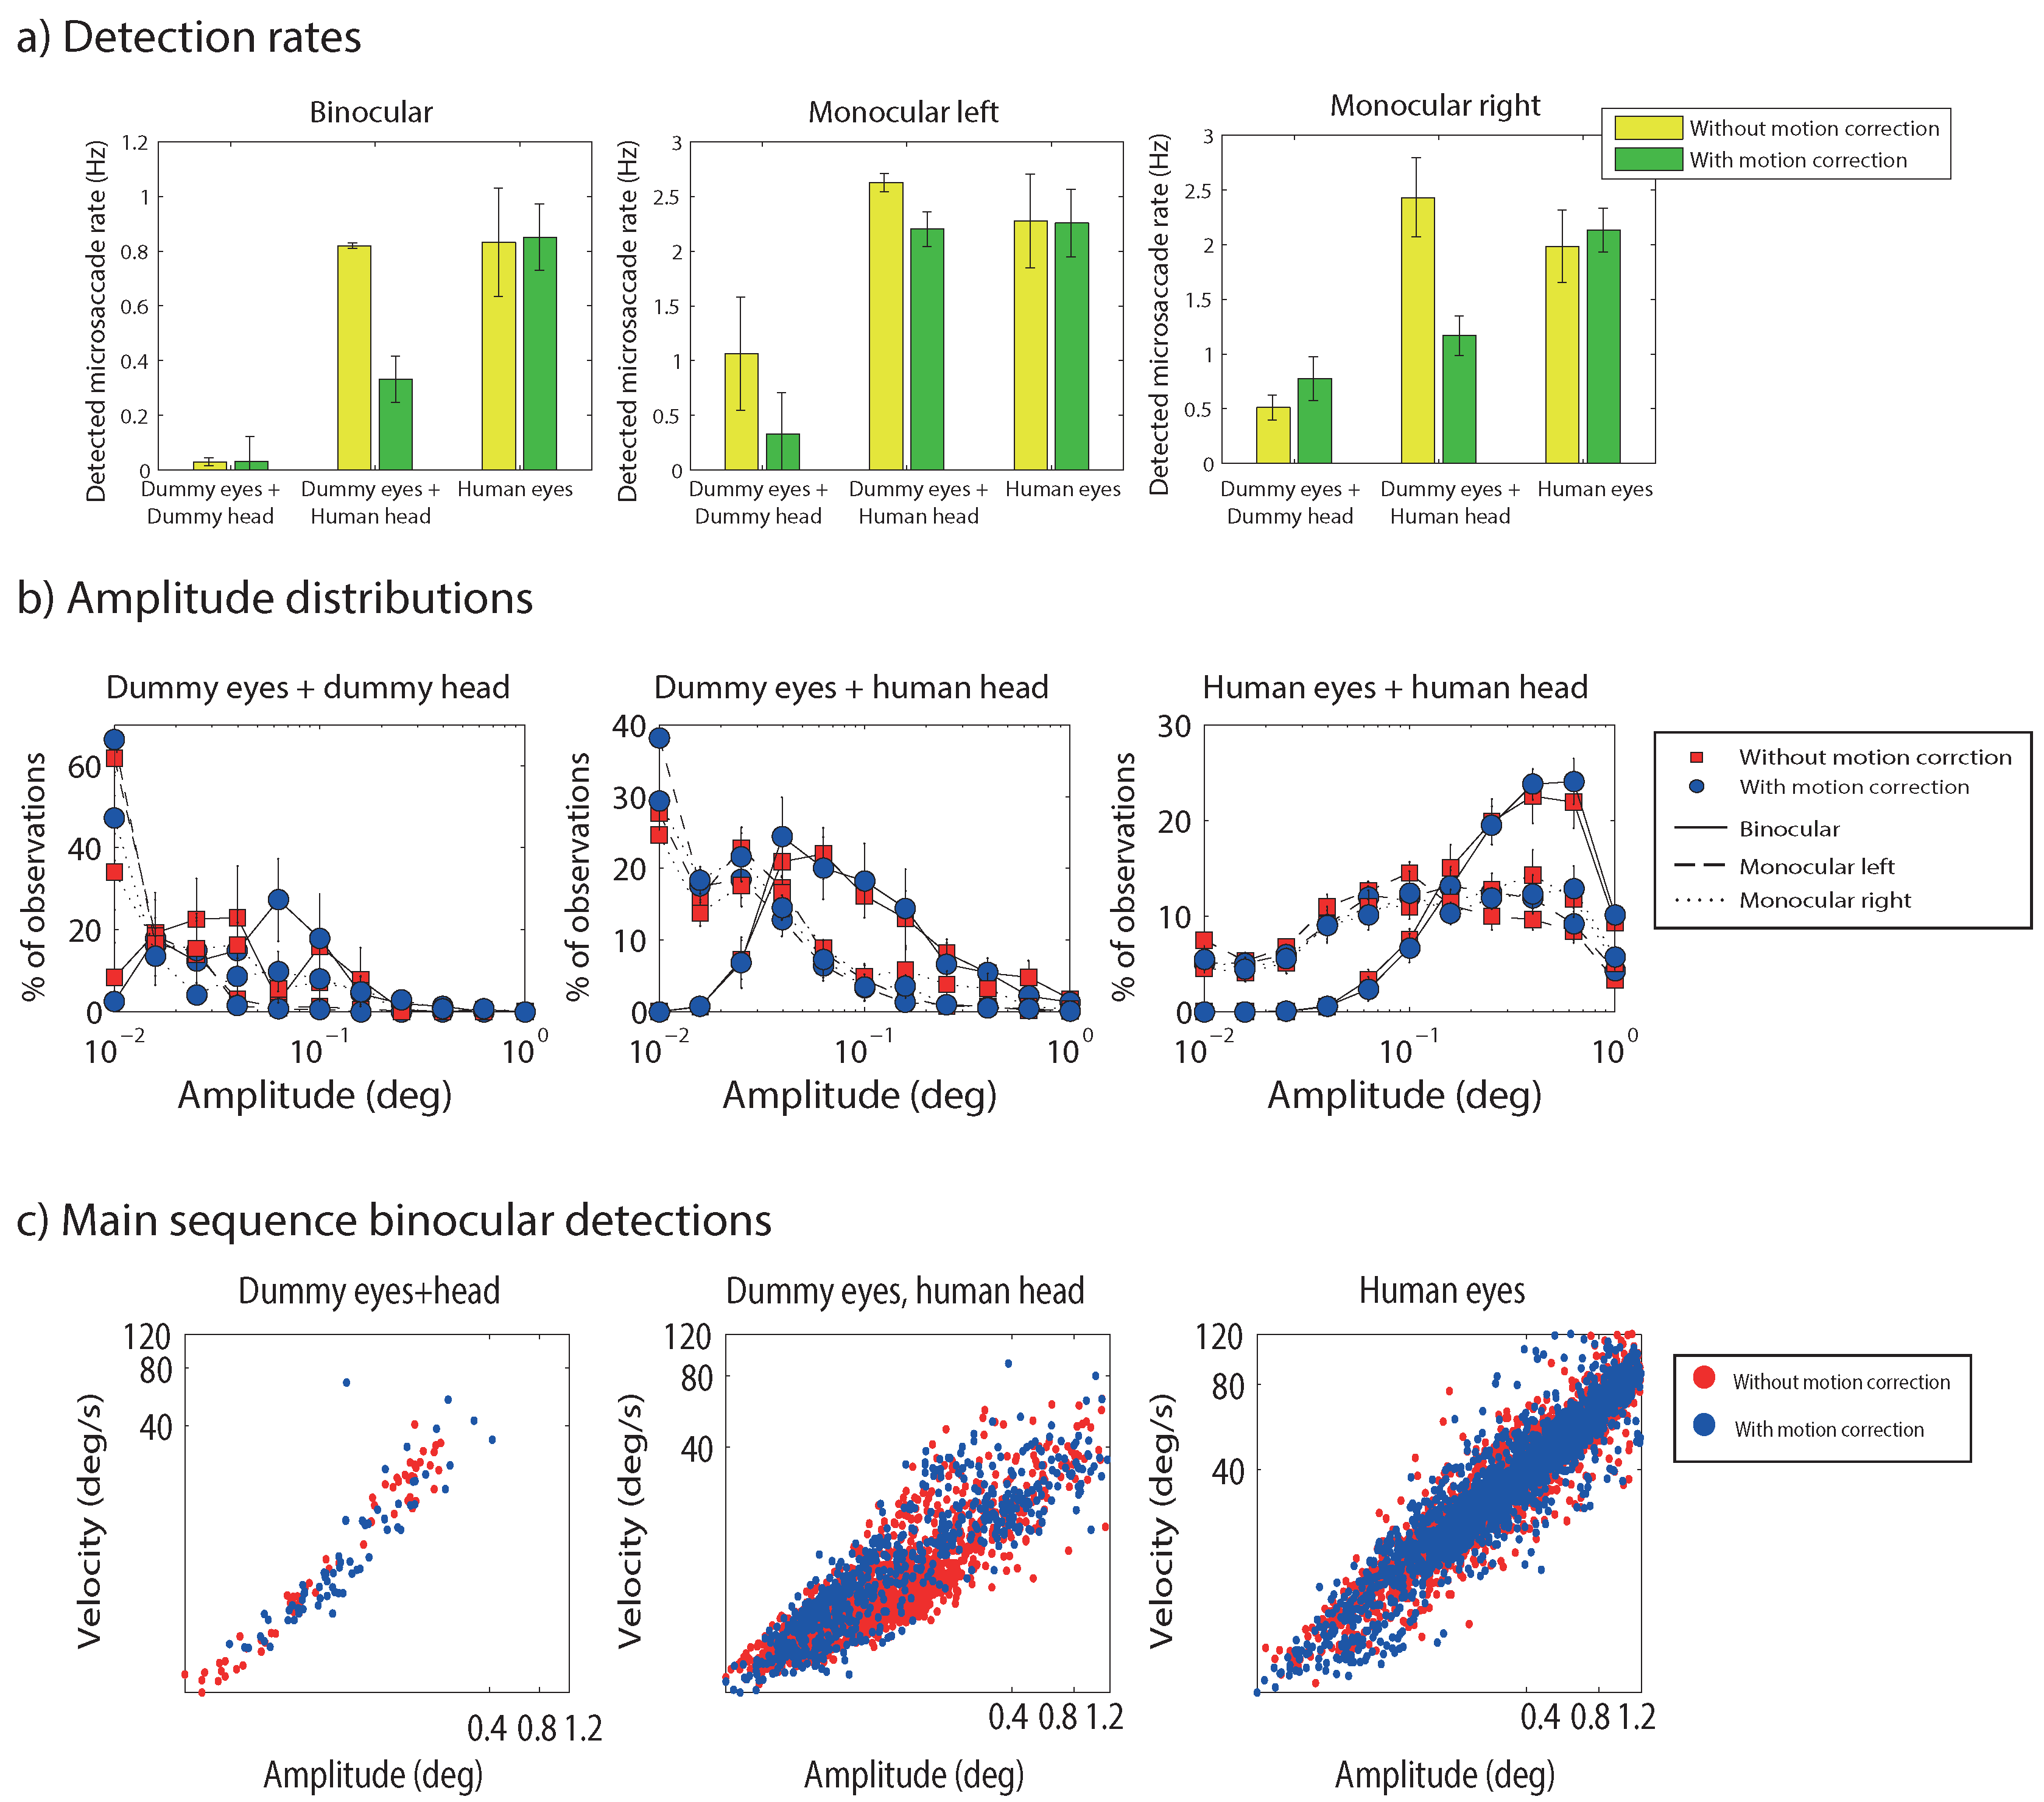
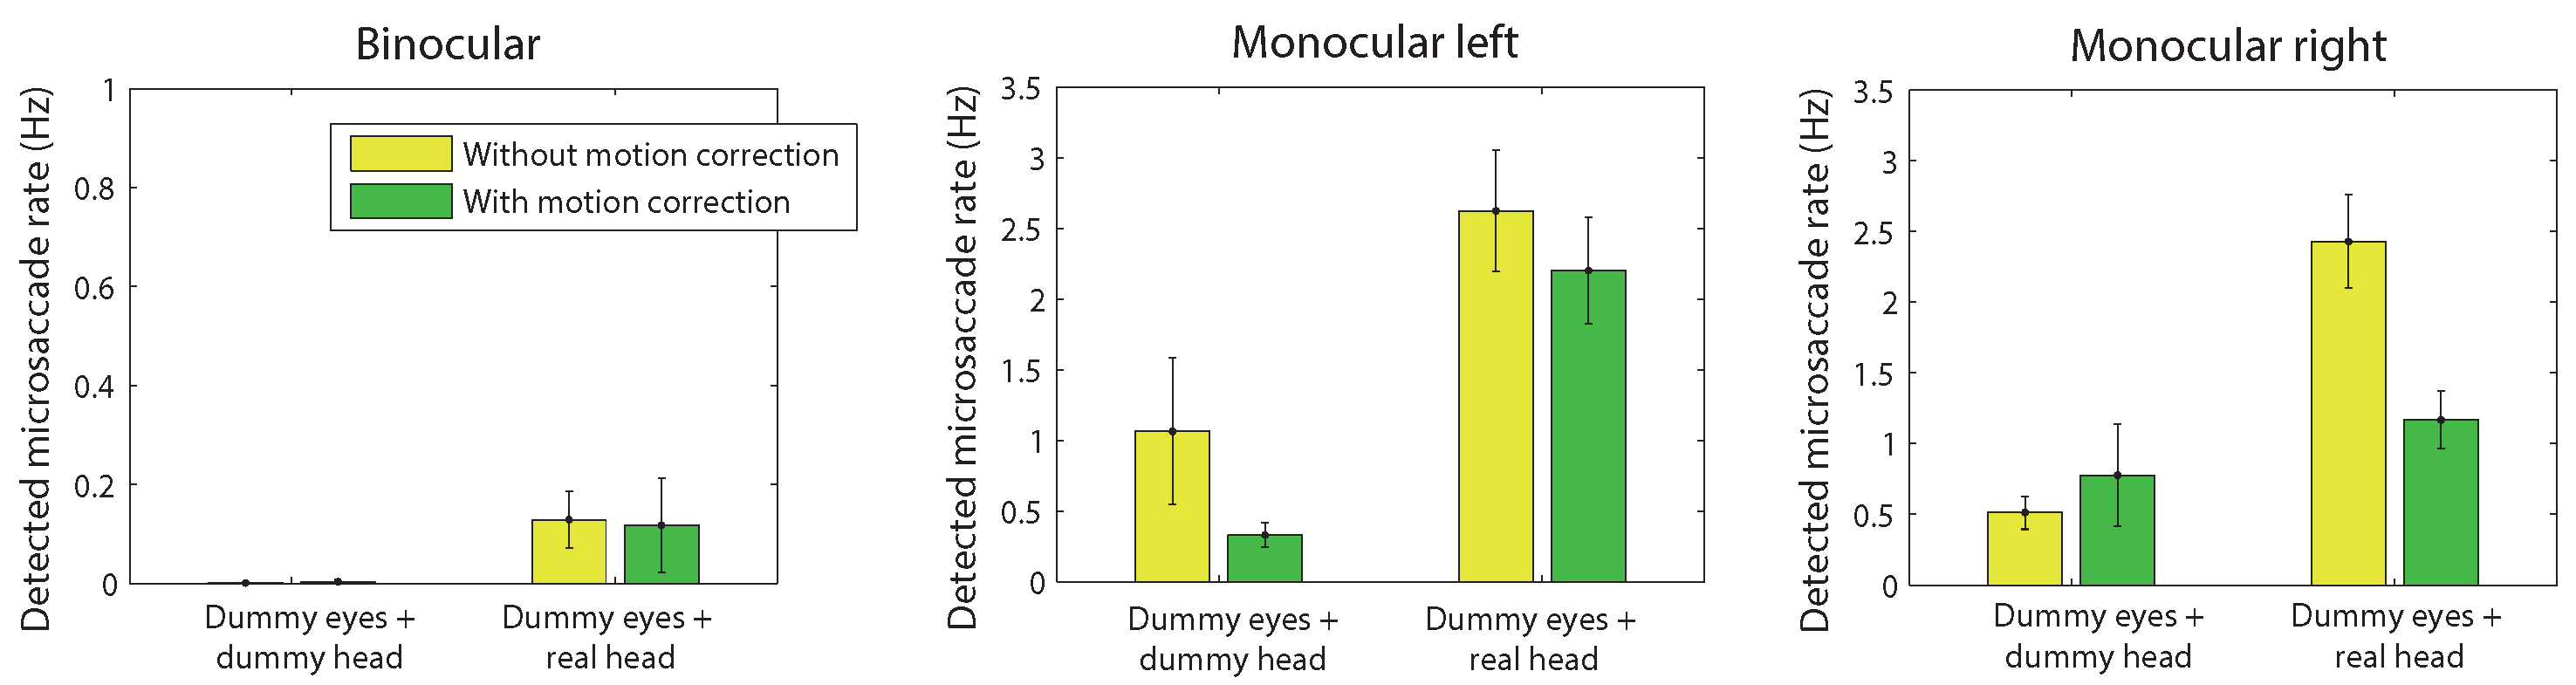
Figure 2a plots microsaccade rates (in Hz) across the different conditions until target onset. In agreement with
Hermens and Walker (
2010), low detection rates were found when the dummy eyes were mounted onto the dummy head. In contrast, high detection rates were observed when the dummy eyes were mounted on a human head, suggesting that head movements led to incorrect microsaccade detections. Rates for head-mounted dummy eyes were almost as high as when eye movements were recorded from human eyes. Note that these results do not automatically mean that all microsaccades in the human eyes condition were due to head movements. The reason is that the threshold for detection depends on the overall variability in the signal, which may be lower for head movement related signals than for eye movement signals. The high false detection rates are important, because the head-mounted dummy eyes reflect trials without microsccades. Such trials are not uncommon considering that microsaccade rates vary across participants between around 0.2 Hz to 2.5 Hz (
Engbert & Kliegl, 2003) and typical trials last around 2 to 3 seconds. The data therefore suggest that thresholds set on a trial by trial basis should be avoided, and instead thresholds are better estimated on the basis of the entire distribution of thresholds for each participant. I will return to this issue later. To access the statistical significance of the differences between conditions, a repeated measures ANOVA was conducted, taking into account the different experimental factors. This analysis, however, showed several significant interactions, which makes the main effects difficult to interpret. Subsequent analyses were therefore performed in the form of pairwise comparisons. These comparisons suggested that the effect of the motion correction approached significance (given Bonferroni corrections) for the dummy eyes mounted on the human head for binocular and monocularly right eye movements (t(11) = 2.57, p = 0.026, Hedges’s g = 0.88; and t(11) = 3.21, p = 0.008, Hedges’s g = 1.28). The effect of recording mode (dummy eye+dummy head, dummy eye+human head, human eye+human head) was significant for most comparisons (except in some of the monocular conditions). Significant differences were also found for the contrasts between binocular and monocular recordings (dummy eyes + dummy head, uncorrected: F(1,11) = 8.31, p = 0.015, partial η
2 = 0.43; dummy eyes + dummy head, corrected: F(1,11) = 8.63, p = 0.013, partial η
2 = 0.44; dummy eyes + dummy head, uncorrected: F(1,11) = 119.2, p < 0.001, partial η
2 = 0.92; dummy eyes + dummy head, corrected: F(1,11) = 76.8, p < 0.001, partial η
2 = 0.86; human eyes, uncorrected: F(1,11) = 131.5, p < 0.001, partial η
2 = 0.92; human eyes, corrected: F(1,11) = 80.0, p < 0.001, partial η
2 = 0.88). This indicates that incorrect detections are significantly higher when recording from only one eye, and that binocular recording and detection is effective in reducing the number of false detections.
Figure 2b shows the distribution of the amplitudes of detected microsaccades across the different conditions. Most of these distributions peak at low amplitudes, except for binocular microsaccades from the dummy eyes on a human head and binocular detections from human eyes. Part of the differences between the amplitudes of dummy eyes and human eyes may be due to the procedure used to detect microsaccades in the dummy eyes. Because the dummy eyes were stationary, the calibration procedure had to be performed on human eyes. After moving the head-band with the cameras from the participant to the dummy head or by changing the orientation of the cameras to focus on the dummy eyes on the glasses, the cameras often had to be moved slightly away from the head due to the extra space taken by the glasses onto which the dummy eyes were mounted. Because of this larger distance, the amplitude of the dummy eye movements may be underestimated. The microsaccade detection algorithm adjusts its thresholds to the data, so detection rates are less likely to be less influenced by the slightly larger distance of the cameras to the eyes. While the magnitude of amplitudes of dummy eye microsaccades may be less informative, the shape of the distribution suggests a difference between dummy eye movements and human eye movements.
A method sometimes suggested to examine whether detected microsaccades are actual saccades, is to examine the relationship between saccade amplitude and peak velocity, known as the main sequence (
Zuber et al., 1965), typically plotted on a log-log scale.
Figure 2c examines this relationship across the different conditions. Details about the best fitting regression lines for these (log transformed) data are provided in
Table 1. The data plots suggest that signals classified by the algorithm as (micro)saccades are likely to result in a linear pattern linking saccade amplitude and peak velocity, regardless of their source. One difference that may be noticed are the intermediate values for the slopes for the human eyes, so in order to use the main sequence to determine whether detected signals are actual saccades, it may be necessary not just to examine the linear relationship, but also to compare the slope with earlier observations or to the slope for large amplitude saccades in the same participant.
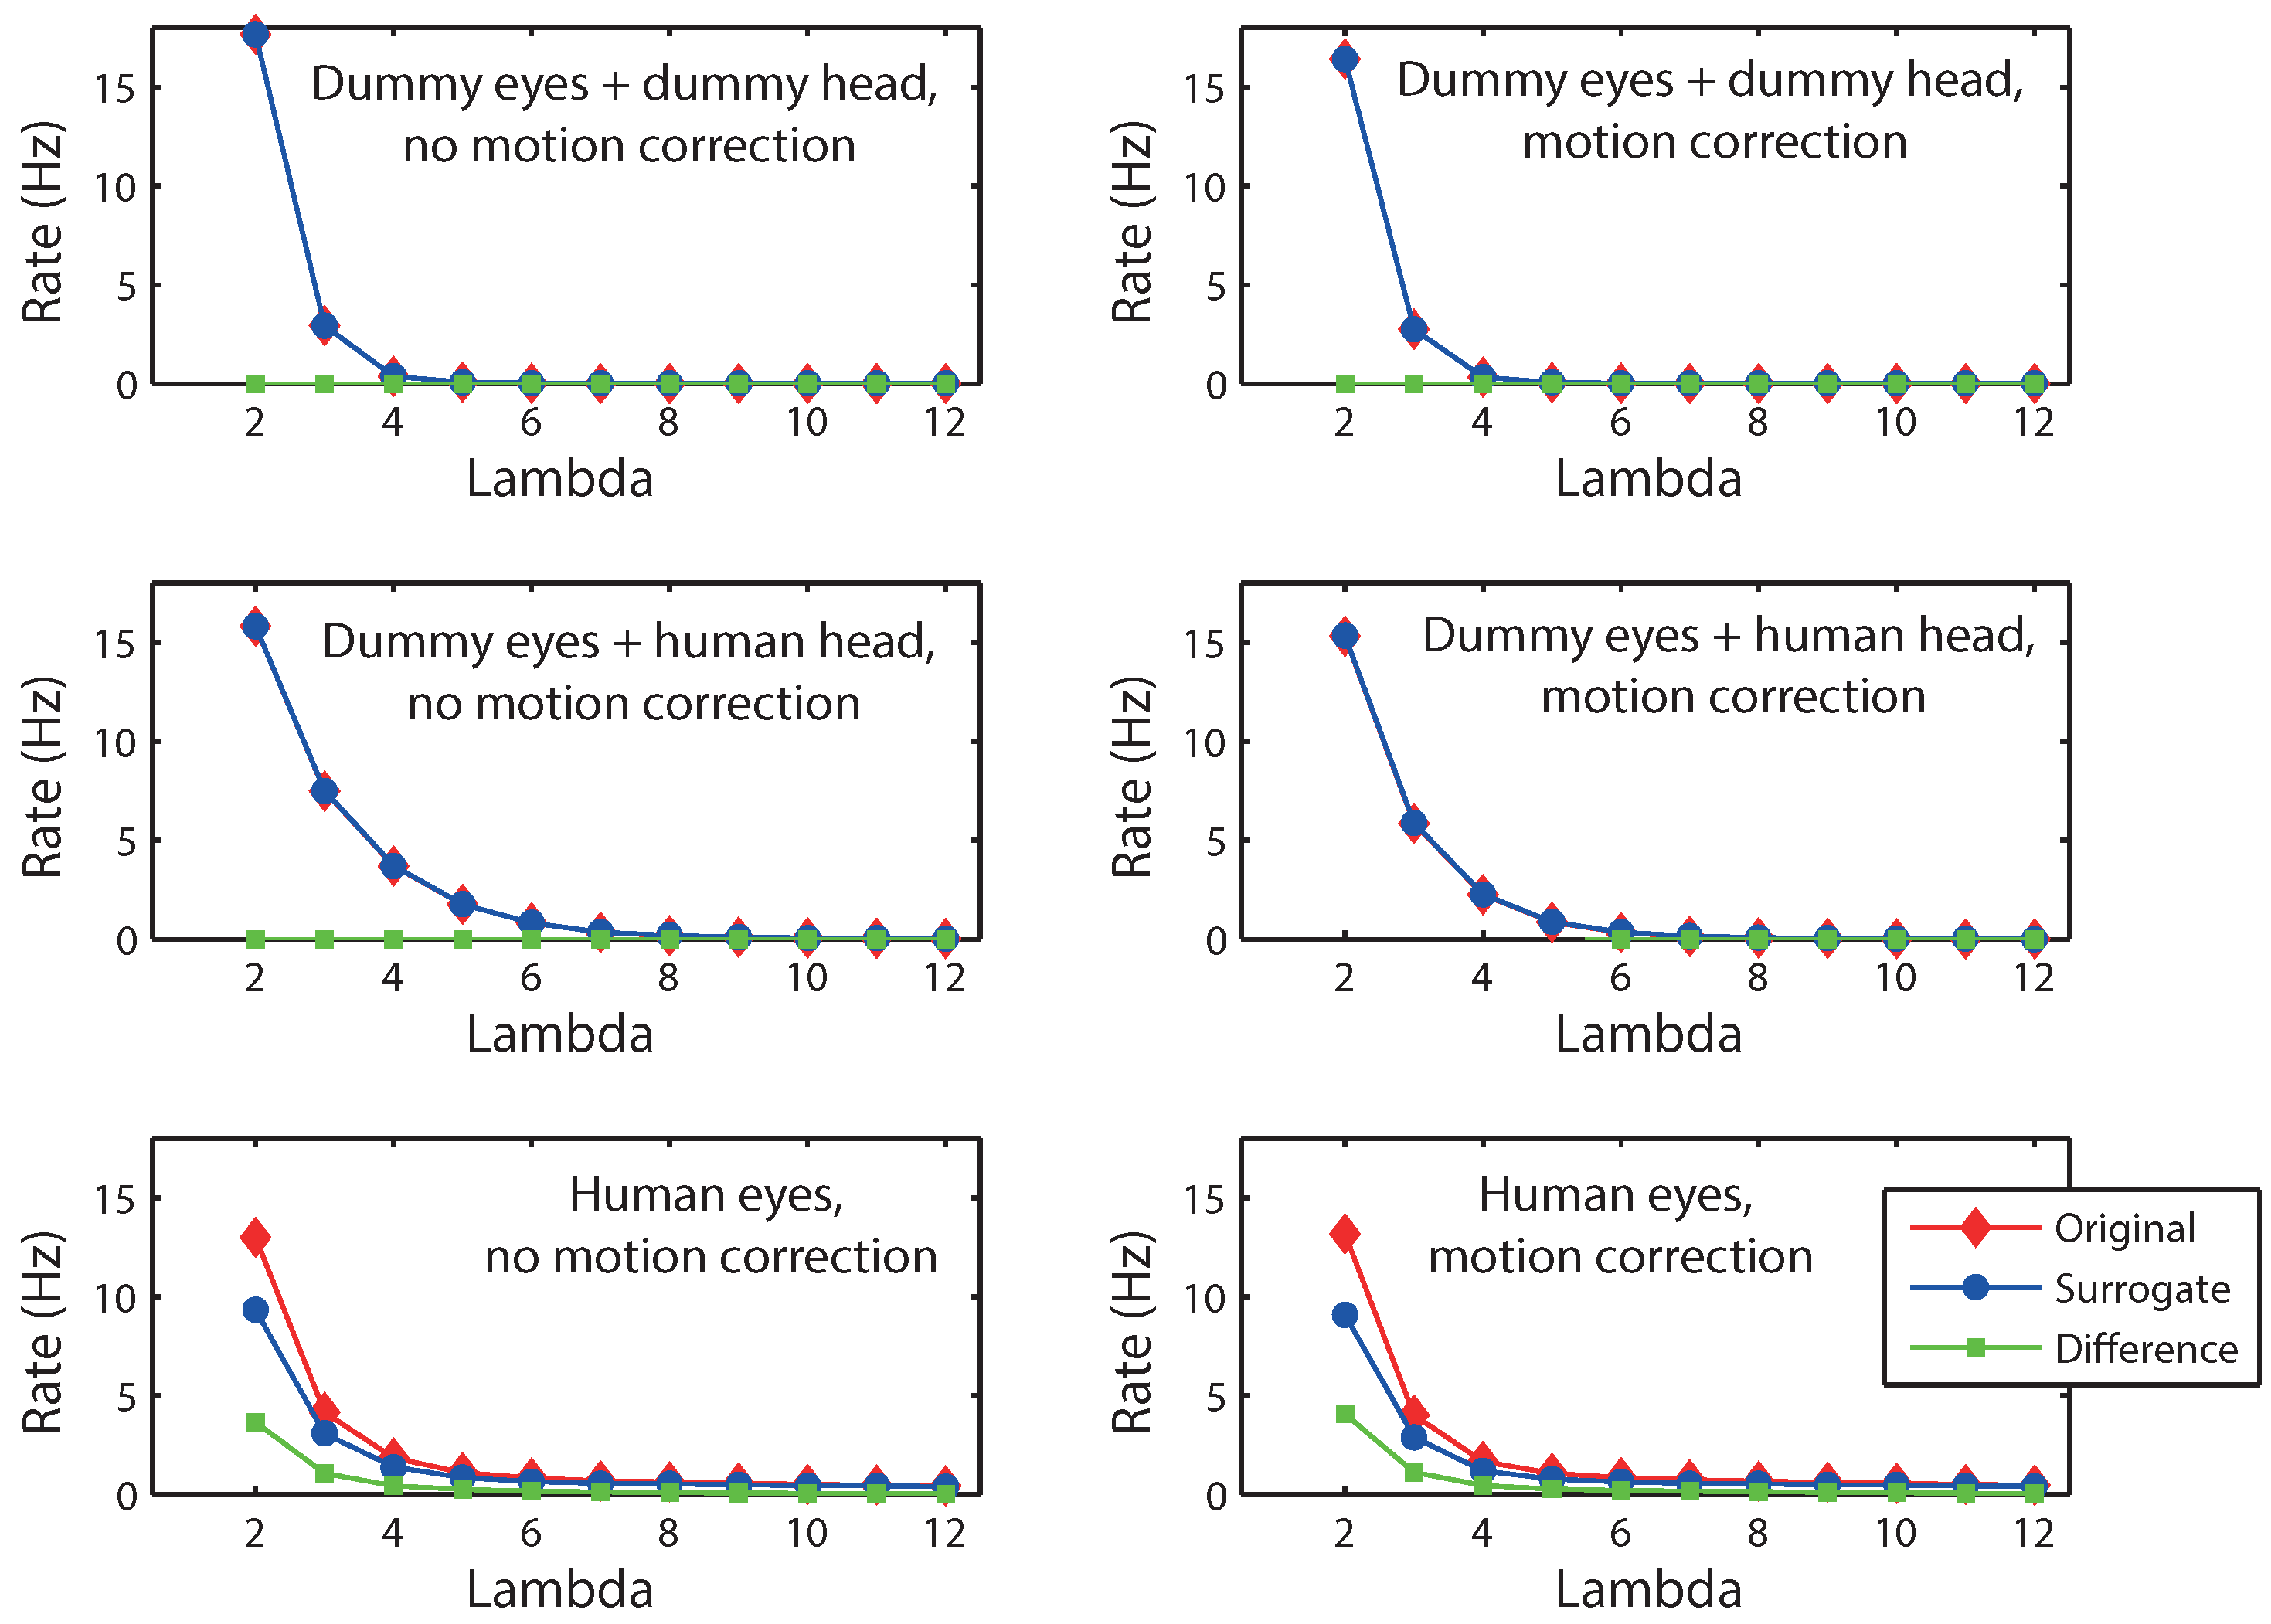
As a further method to detect microsaccades against noise, constrained shuffling of the data to generate surrogate data has been proposed (
Engbert & Mergenthaler, 2006;
Mergenthaler & Engbert, 2010). In particular, the method shuffles the velocity samples such that the distribution of velocity values is maintained and the autocorrelation function of the surrogate data approximates that of the original data (
Engbert & Mergenthaler, 2006).
Figure 3 shows the results when this procedure is applied to the present dummy eye and human data. For the human eyes, surrogate detection rates are lower than for the original data, suggesting that meaningful signals are being picked up from the data that are no longer present when the order of the data is disturbed. For dummy eyes (either on a dummy head or on a human head), no such reduction in the rate for surrogate data is found, suggesting that signals that are detected are not specific to the order of the samples, probably because they reflect random variations rather than an actual signal. Interestingly, whereas the analysis by
Engbert and Mergenthaler (
2006) revealed a maximum difference between the original and surrogate detection rates (at λ = 5), the difference between rates for the present data monotonically decreases with λ. It is unclear at this point what causes this difference in the results. The results, however, do suggest that surrogate data can be used (on a distribution level) to distinguish between eye movement signals and noise.
An often made assumption is that microsaccades occur simultaneously in both eyes. This assumption is used in the final step of the algorithm by Engbert and colleagues (
Engbert & Kliegl, 2003;
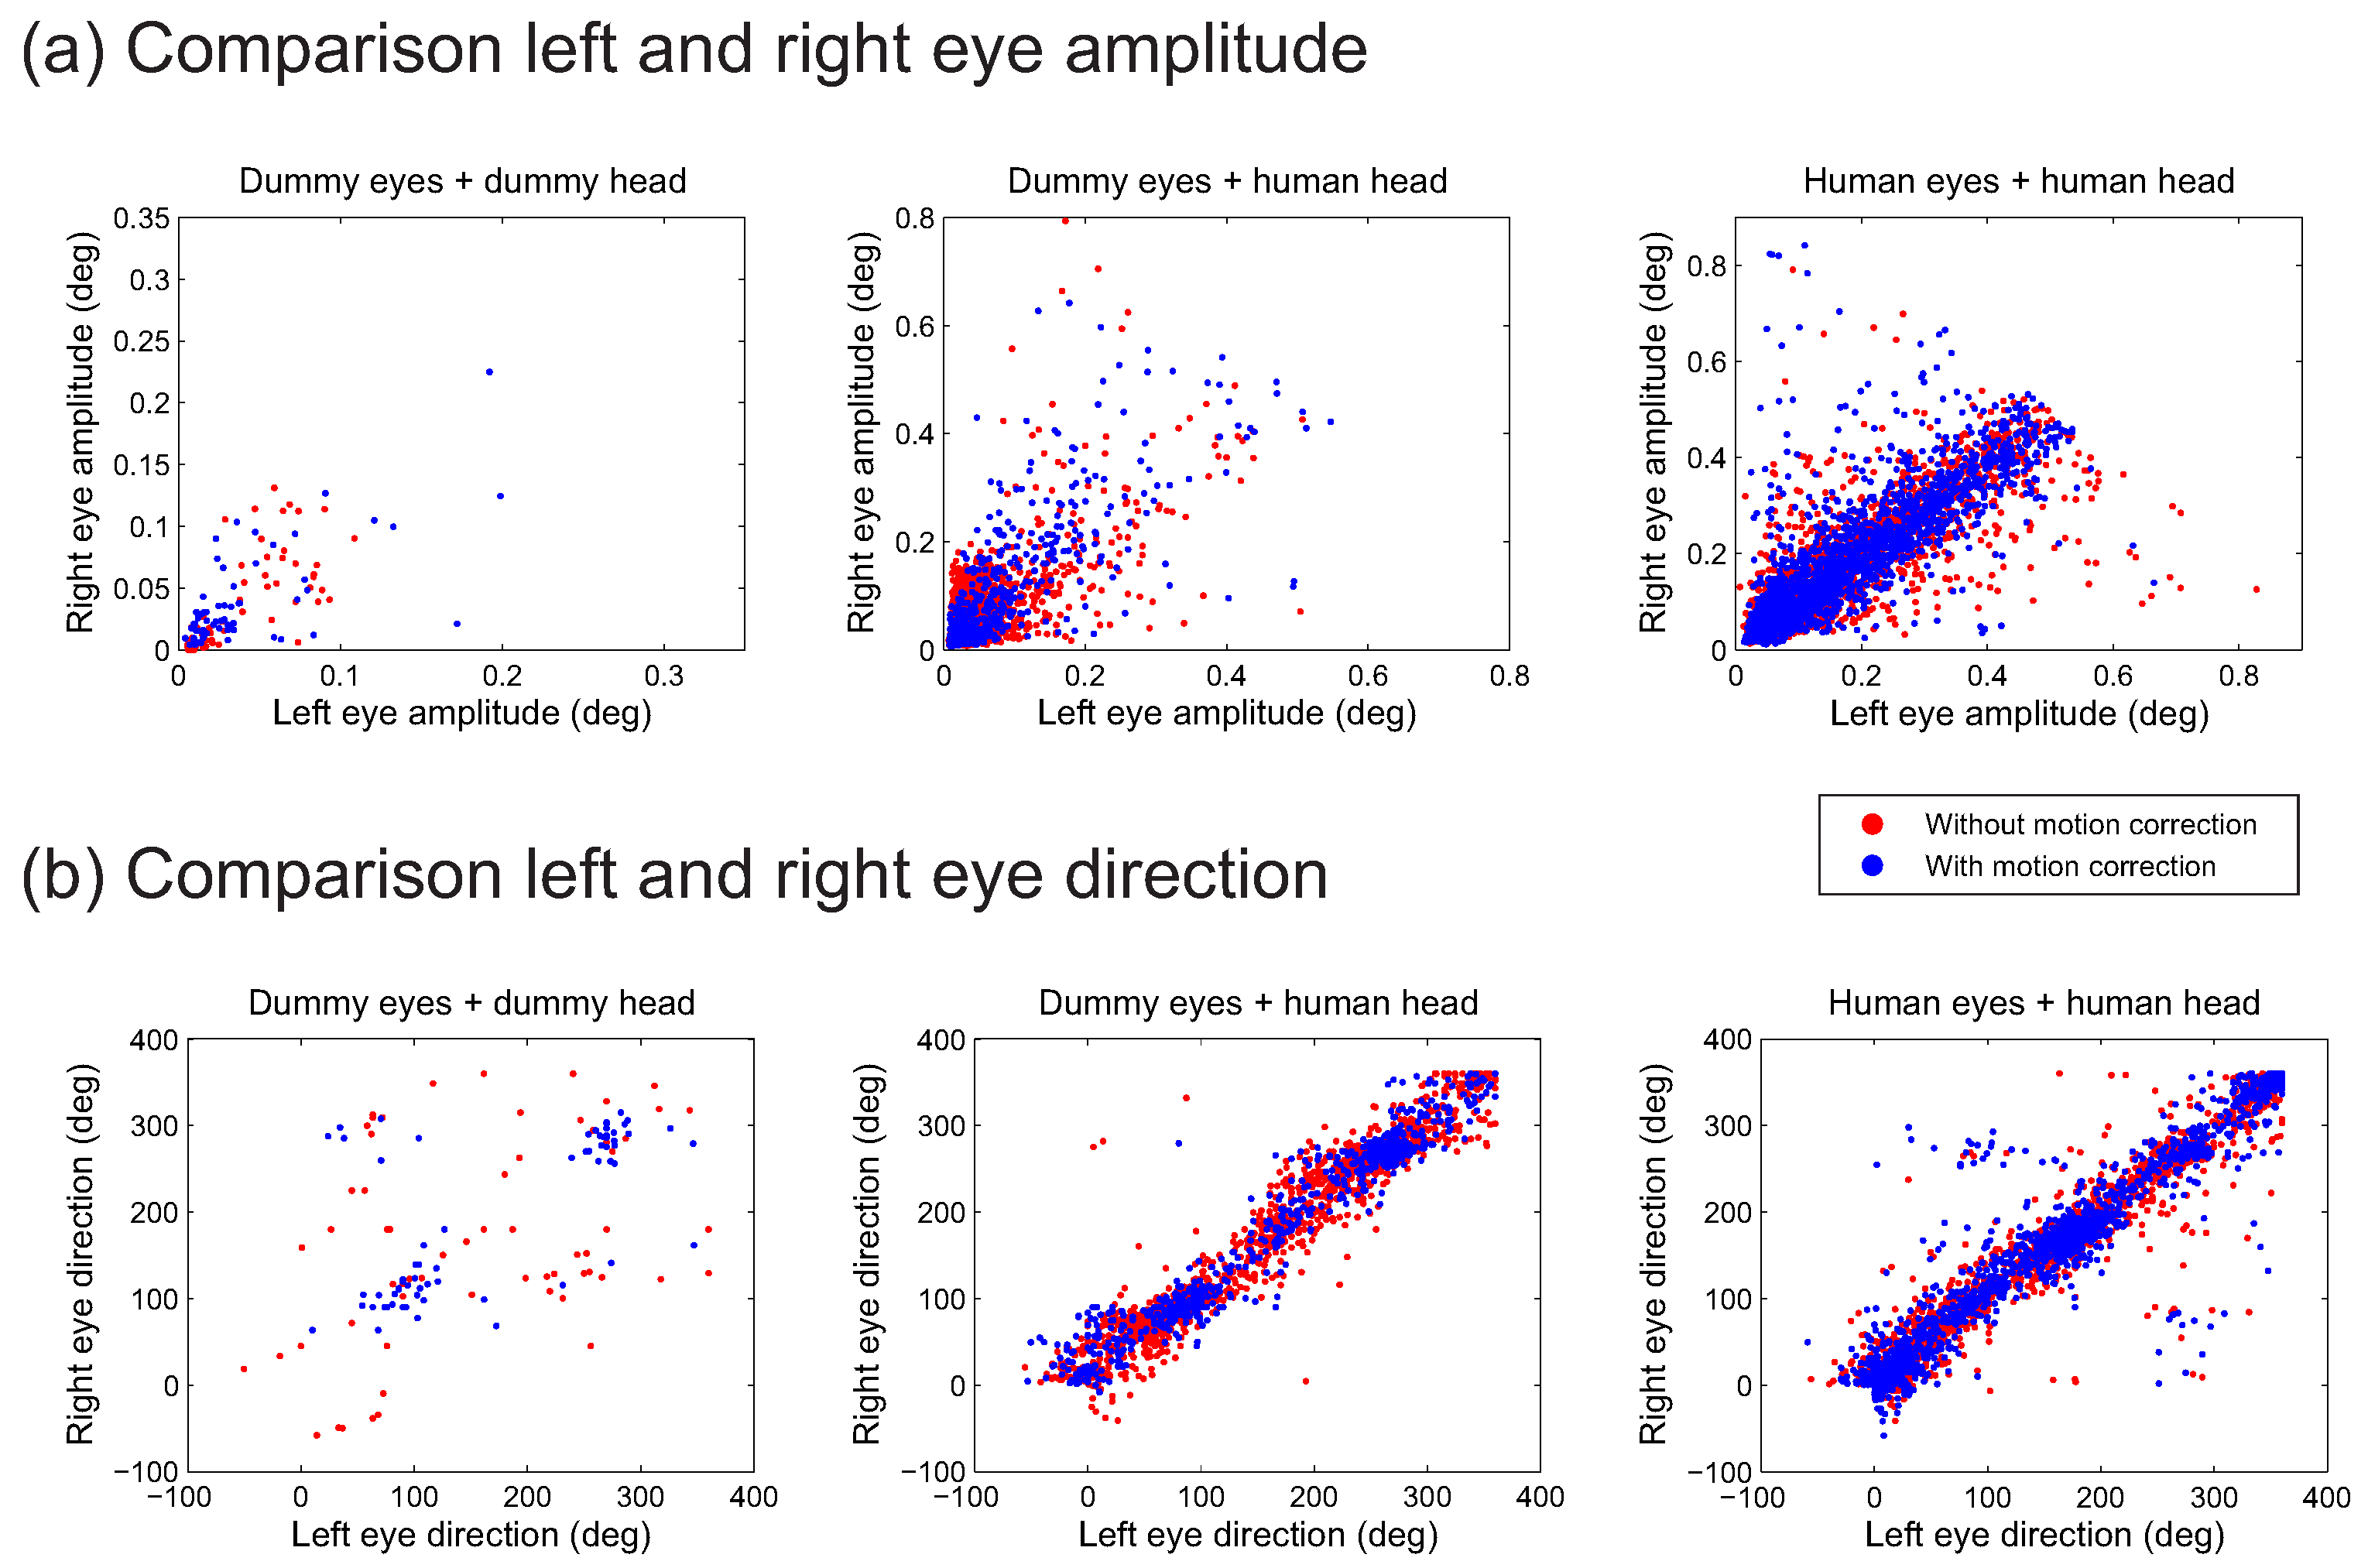
Engbert & Mergenthaler, 2006), requiring at least one sample overlap between the eye movements in the two eyes. To improve detection other overlaps may be considered, such as similarities in amplitude and or saccade direction. To examine this overlap for microsaccades across the different conditions,
Figure 4 provides scatterplots of the amplitude (in degrees of visual angle) and direction (expressed as an angle between 0 and 360 degrees) of the two eyes, while
Table 2 provides the correlation of the measures between the two eyes. For many of the conditions, the correlations between the two eyes are high (
r ≥ 0.68), meaning that not only do the movements occur in the two eyes at the same time, they also have similar amplitudes and directions. The correlation is somewhat lower for detections in the dummy eyes on the dummy head, but otherwise, the plots suggest that comparisons of movements between the two eyes will not aid the distinction between actual and falsely detected microsaccades. A likely reason is that in all instances, the signals leading to the detected microsaccades have a common source, which can either be the brain signaling to both eyes that an eye movement has to be made, or the movement of the pupils with respect to the cameras due to head movement.
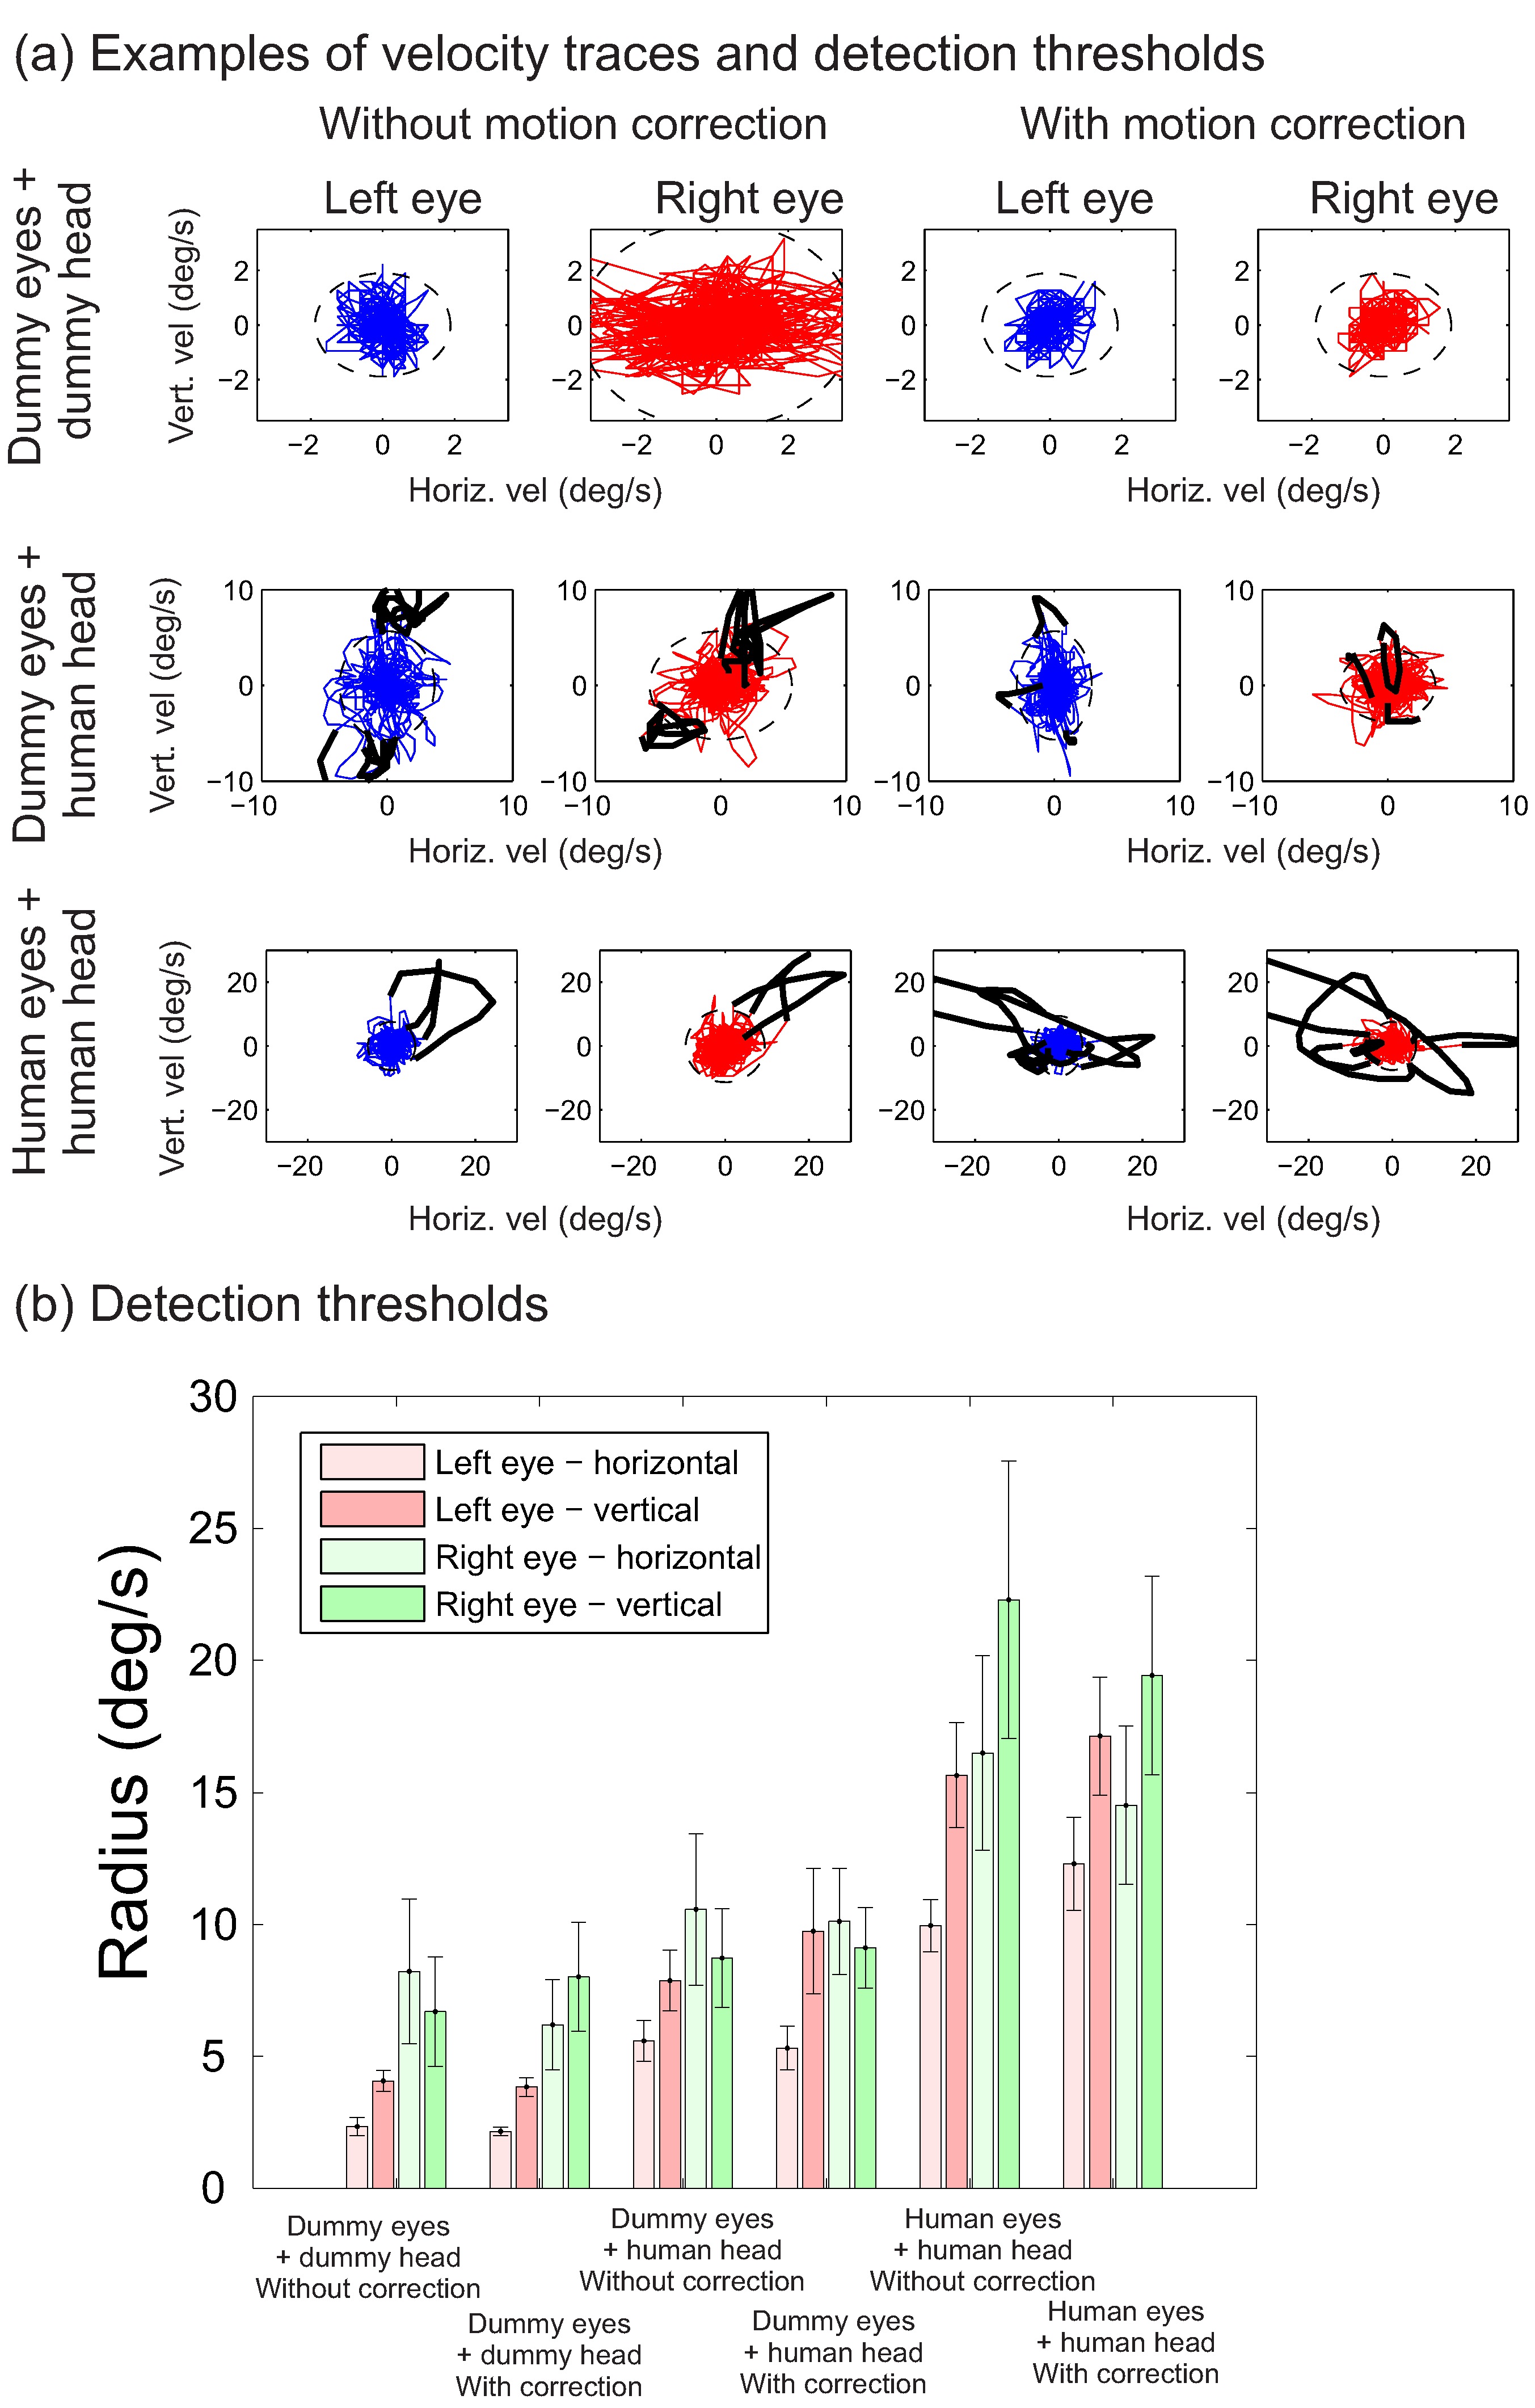
As mentioned earlier, the high rate of detections for the dummy eyes mounted on a human head is likely to relate to lower detection thresholds in these conditions, compared to the human eyes conditions. This point is illustrated in
Figure 5a, showing velocity traces for six trials across the different conditions, together with the threshold (dashed ellipses; note that the axes are scaled to best fit the velocities). These example traces from one of the participants suggest that thresholds are lower for dummy eyes than for human eyes. To examine this possible difference in thresholds further,
Figure 5b plots the average threshold across participants for each of the conditions. To determine whether these thresholds differ across conditions, the thresholds for the two eyes and the two directions (horizontal versus vertical) were pooled into one mean for each condition and a repeated measures ANOVA was used to test the effects of the source of the recordings (dummy eyes + dummy head, dummy eyes + human head, human eyes) and whether motion correction was used. A significant main effect of the source of the recordings was found (F(1.38, 15.13) = 21.11, p<0.001, partial η
2 = 0.66), without a main effect of the motion correction (F(1,11) = 0.042, p = 0.96, partial η
2<0.01) and without an interaction between the two factors (F(2,22) = 0.23, p = 0.79, partial η
2 = 0.021). Posthoc tests, involving pairwise comparisons between the different recording sources using a two by two repeated measures ANOVA, testing the effects of recording source and motion correction, showed significant differences in the thresholds across each of the conditions without an effect of motion correction and no interaction (dummy eyes + dummy head versus dummy eyes + human head: F(1,11) = 10.36, p = 0.008, partial η
2 = 0.49; dummy eyes + human head versus human eyes: F(1,11) = 16.23, p = 0.002, partial η
2 = 0.60; dummy eyes + dummy head versus human eyes: F(1,11) = 27.78, p<0.001, partial η
2 = 0.72).
In the analyses so far, thresholds for microsaccade detection were set on a trial by trial basis taking into account the level of noise in the data for that trial. The data with the dummy eyes on the human head indiccates that in the absence of microsccades, this method may result in thresholds that are too low to avoid incorrect detections of microsaccades due to head movements. An alternative method of setting thresholds would be to take into account thresholds across all trials, and to extract an estimate of the overall threshold for detection for that person. To evaluate this method, thresholds were set to the median of the human eyes conditions for each participant and then applied to the dummy eye conditions, resulting in the detection rates shown in
Figure 6. Binocular detections for the dummy eyes on a dummy head condition were already low previously, and vanished completely when median thresholds were used. Binocular detections for dummy eyes on the human head (simulating head motion) are lower when the median threshold method is used, but incorrect detections still occur at a rate of about 0.1 to 0.2 Hz. Monocular detections are high for median thresholds and are best avoided.
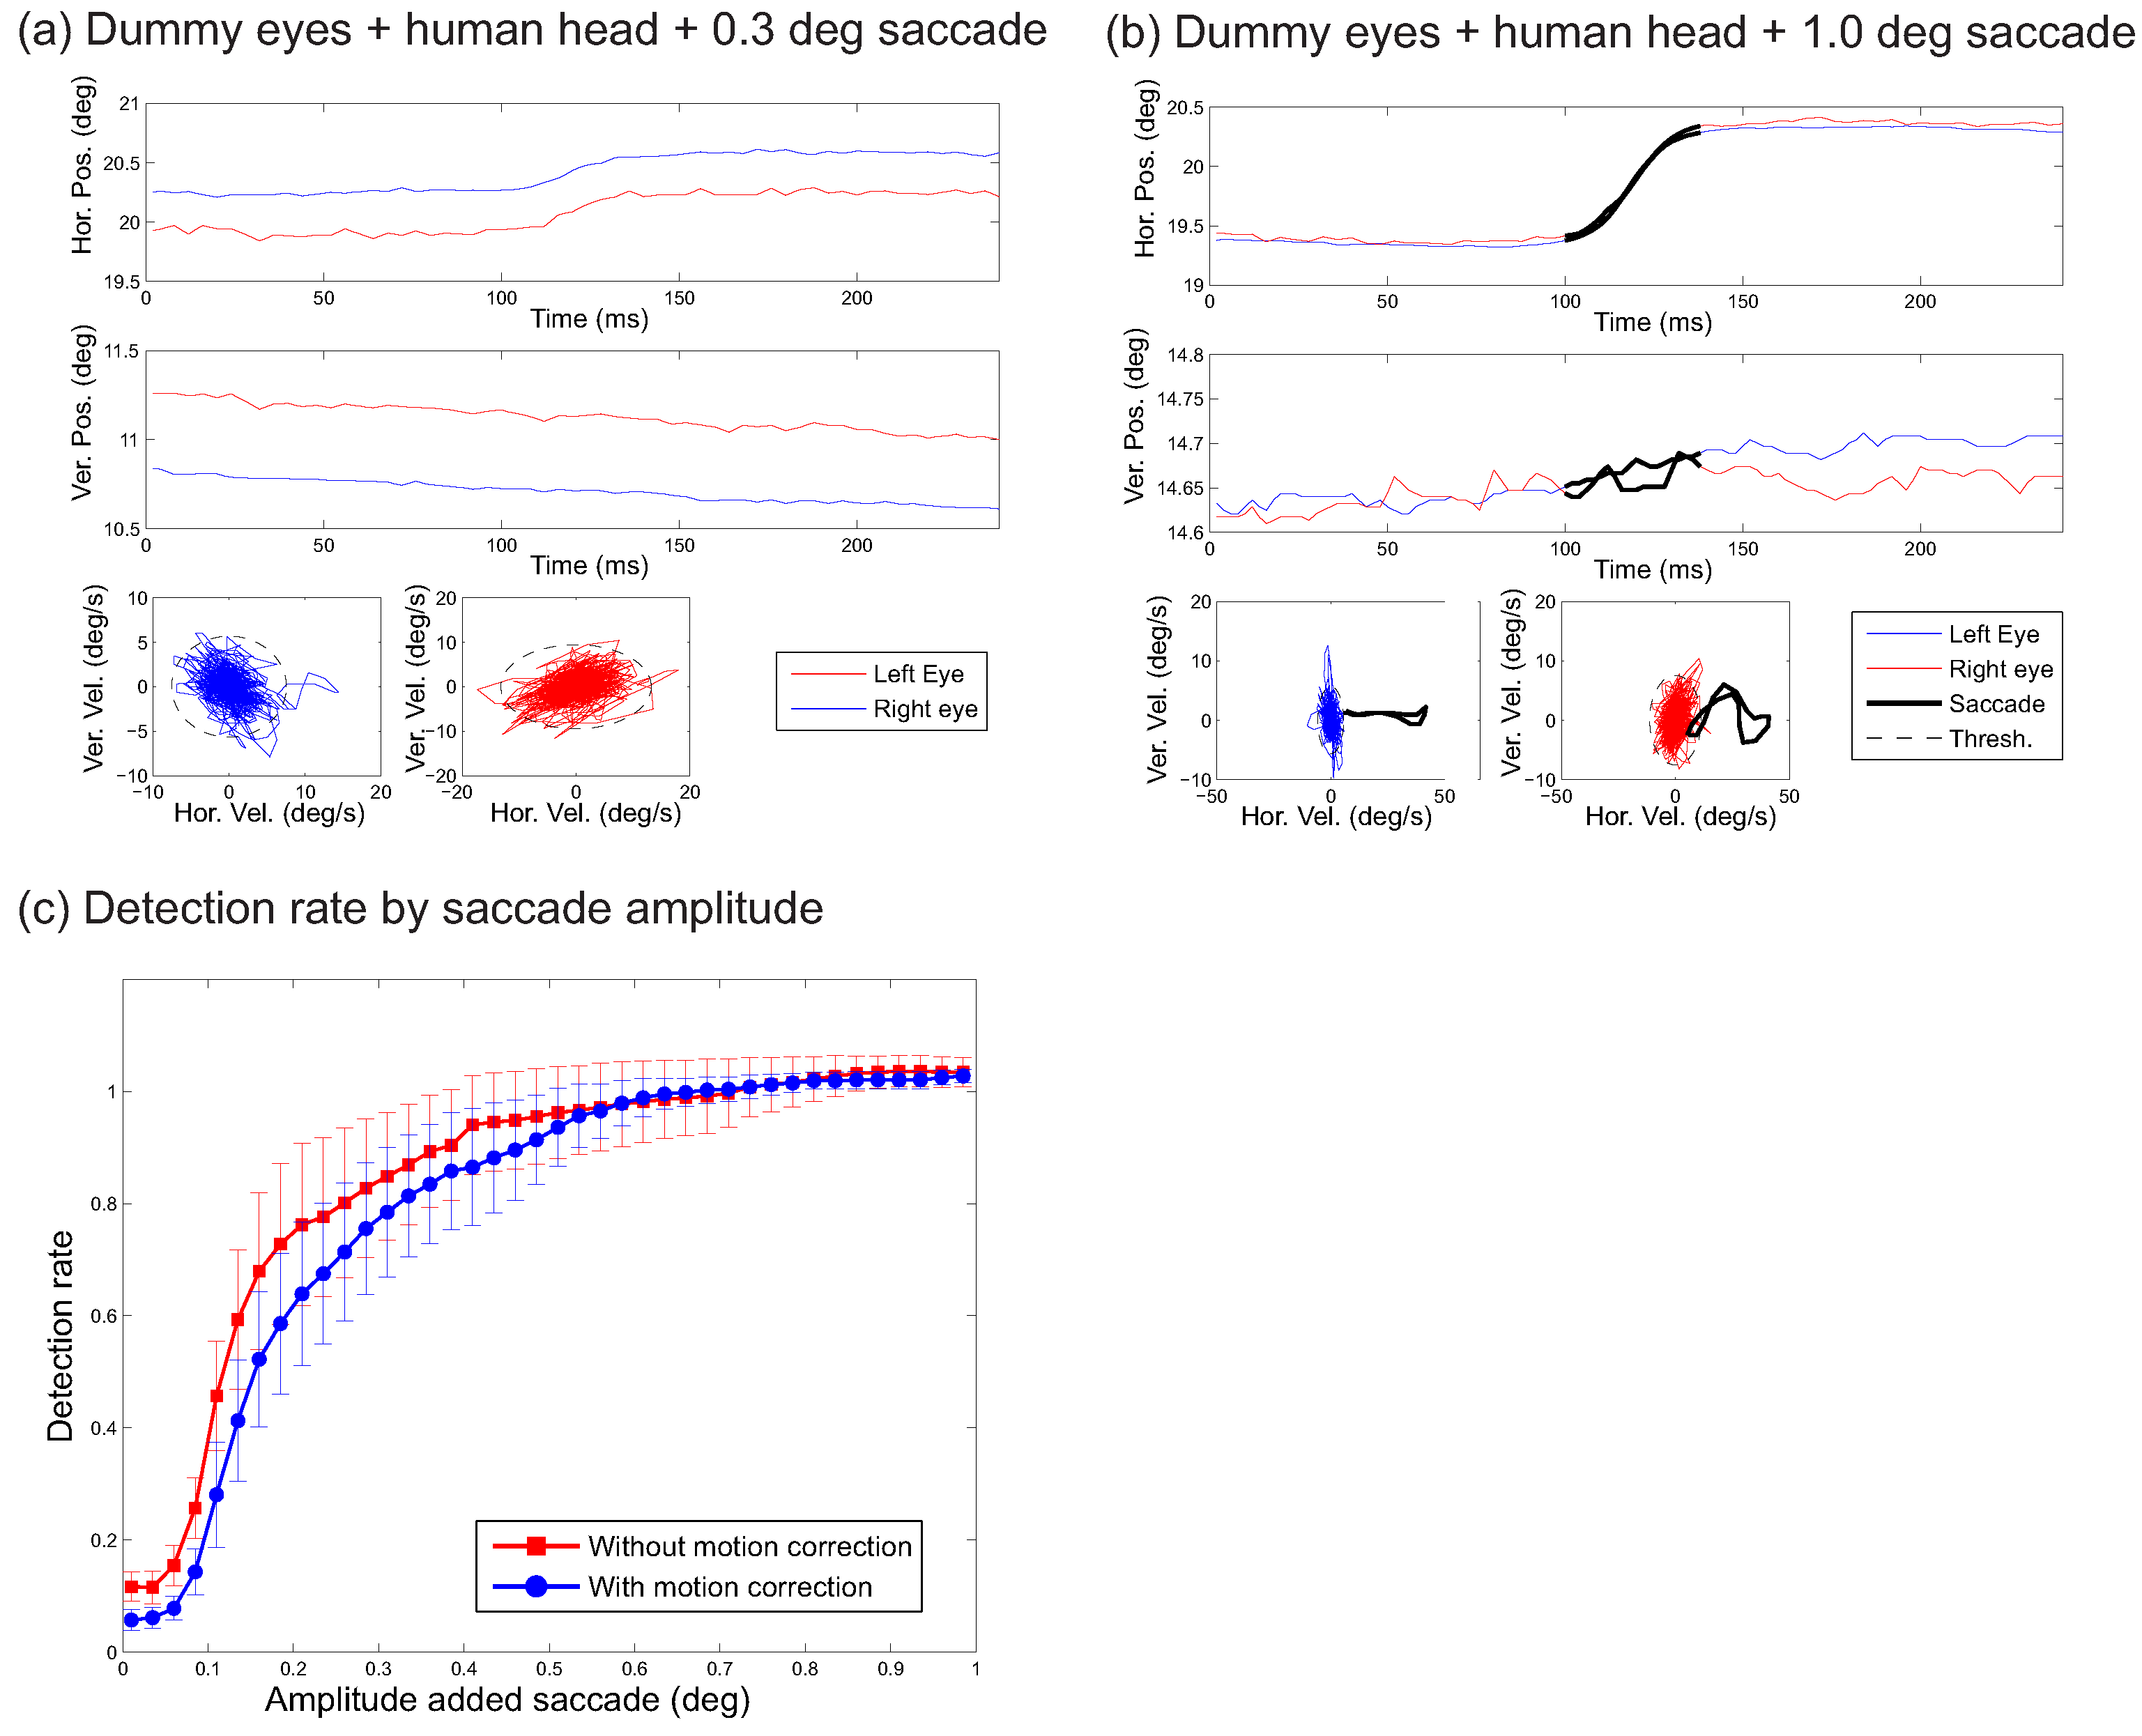
The recordings of the dummy eyes can also be used to examine what amplitudes of saccades can be reliably detected in the presence of system noise and head movements.
Figure 7a and
Figure 7b show how this may be done. The two plots show the recorded eye position over time (top) together with the horizontal and vertical velocity (bottom).
Figure 7a shows a signal to which a 0.3 degrees amplitude saccade was added in the form of a sigmoid function (A sigmoid function was used to create a uniform shape for the added saccade. Visual inspection suggested that the sigmoid functions provided an excellent fit of the profile of the saccades) whose parameters (except for the amplitude) were fitted on response saccades of the corresponding participant (across all trials in the human eyes conditions).
Figure 7b shows a similar plot, but now for an added 1.0 degree saccade. The ellipses around the velocity trace indicate the detection threshold, and the black sections of the trace in the 1.0 degree saccade plot (
Figure 7b) indicate that the 1.0 degree saccade is detected, but the 0.3 saccade is not. To examine how the head movements influence the detection of saccades of various amplitudes, sigmoid functions saccades were added to each trial of the dummy eyes + head movement condition for each participant, and the number of detected microsaccades within an interval around the inserted saccades was counted.
Figure 7c shows this number of detected microsaccades as a function of the amplitude of the inserted microsaccade, showing an increasing function approaching a level slightly above 1 (detection of signals additional to the inserted saccade). Interestingly, the use of the head motion correction leads to slightly lower detection rates (t(39) = 5.54, p<0.001, Hedges’s g = 0.16; across the 40 samples shown in
Figure 7c).
The large number of microsaccade detections in the absence of eye movements due to head movements is worrisome, as is the lack of distinctive features between head movement and eye movement detections among the features considered so far, such as the direction of the microsaccades in the two eyes. Using a median threshold across all trials helped to reduce the number of false detections. Another possible method of reduing the number of incorrect detections may be to rely on both the corneal reflection signal and the pupil center estimate (as used, for example, by Kimmel et al., 2012). Experiment 2 will examine whether microsaccade detections in the absence of eye movements can be avoided by including the corneal reflection signal.


