Abstract
Several studies have shown that eye movements (EM) are functionally involved in visual imagery. In this study we investigate the impact of a simulated homonymous hemianopia paradigm (SH) with and without foveal masking on scanpath eye movements during visual mental imagery. EM of twenty subjects were recorded under SH condition during viewing and subsequent visual imagery of complex pictures. Using evaluated string editing methods viewing and imagery scanpaths were compared. Our results show that scanpath EM are involved in visual mental imagery and reflect the picture content even under SH. In contrast, additional foveal masking significantly reduces the similarity between viewing and imagery scanpath. This points toward a detrimental effect of foveal masking on subsequent visual imagery performance.
Introduction
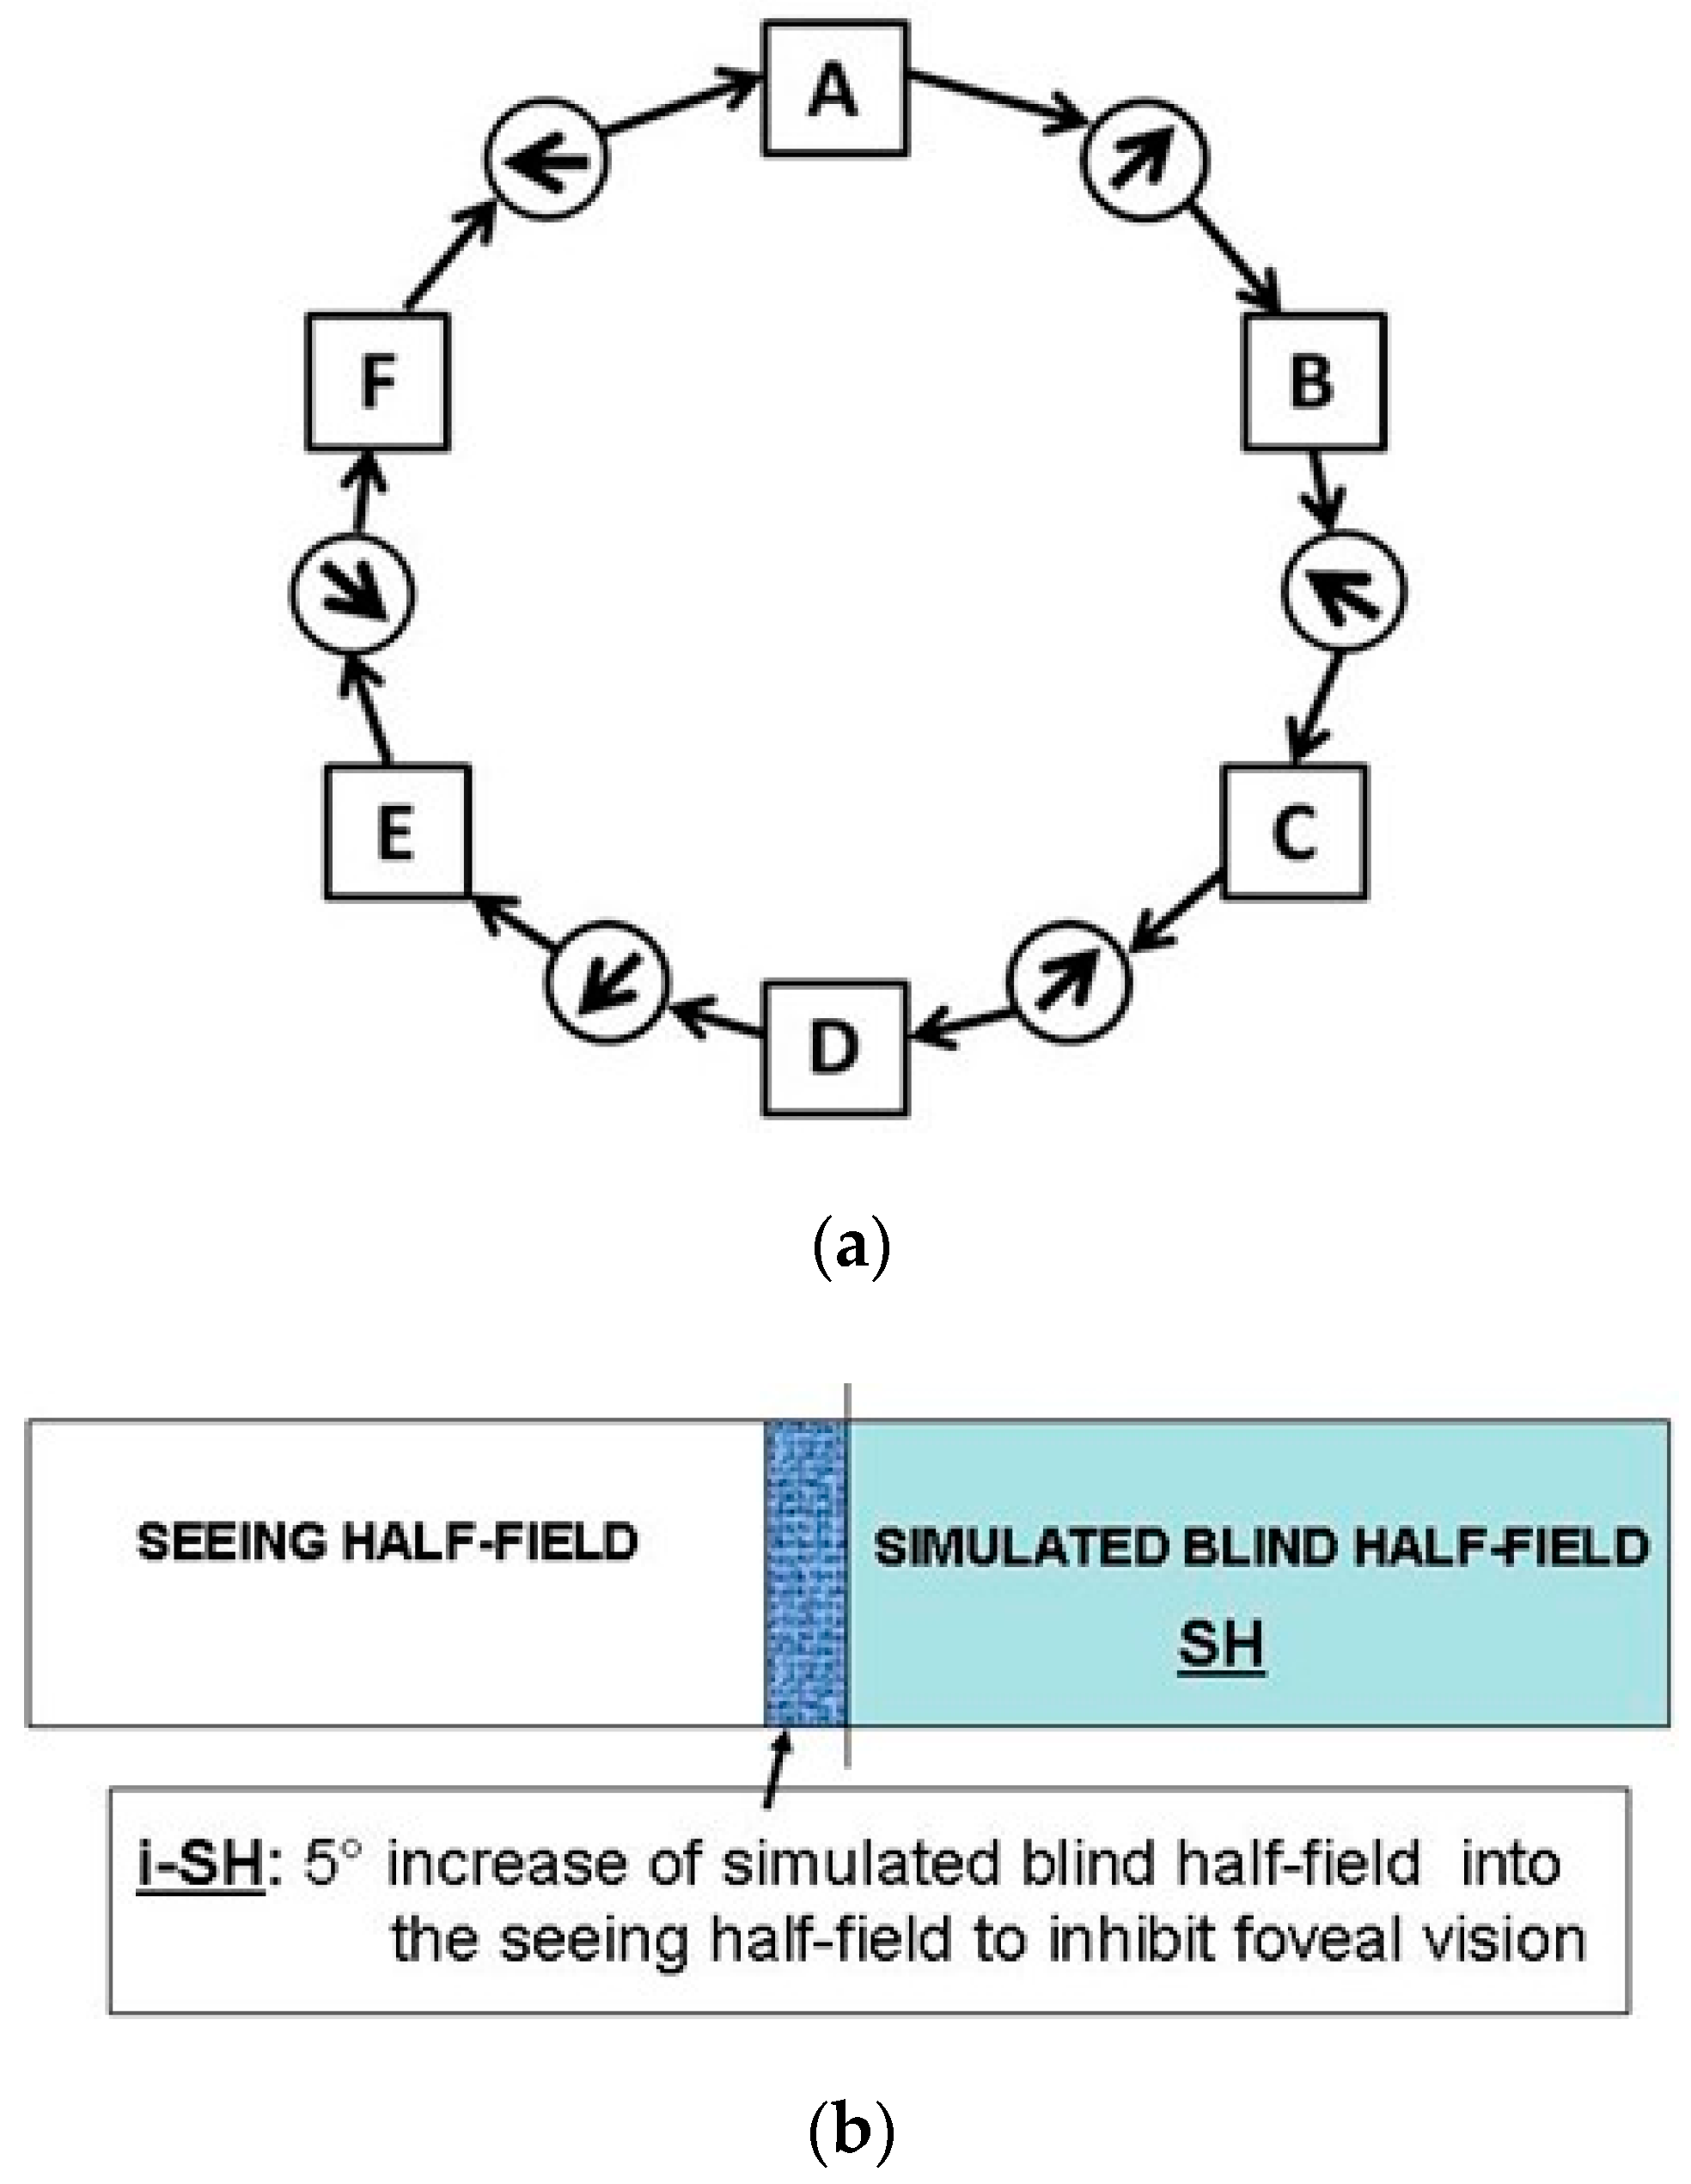
Eye movements (EM) are essential to perceive our visual environment. Visual exploration consists of succession of saccades that depend on both external visual or “bottom up” stimuli and cognitive “top down” control. Yarbus revealed in 1967 that during visual perception EM are directed to the most informative features of an image or scene. Following this approach Noton and Stark introduced the term “scanpath” - defined as repetitive sequence of fixations and saccades (Figure 1a). In their studies they found marked similarities in intrasubjective scanpaths of subjects when repetitively viewing the same images. The “scanpath theory” for internal representations proposes that eye movements of each fixation are stored along with the visual representation and are used as spatial index for the proper arrangement of parts of an image (Noton & Stark, 1971a, 1971b). Thus, an internal cognitive representation controls the scanpath. The foveal regions of interest (ROI) are sequentially scanned by a string of fixations and shifted by a string of saccades seeking the key features of an actual inspected scene or image (”feature ring hypothesis“; Figure 1a). Based upon this model recognition of objects works through a “top down” activated step-by-step scanning that corresponds to the internal representation. Visual mental imagery is a complex cognitive process which occurs when we use our„mind´s eye” to visualize objects or scenes in their absence. In 1968 Hebb hypothesized that concerning visual mental imagery EM must play an essential “organisatory” role. He suggested that “visualizing” is a reinstatement of the perceptual process (Hebb, 1968). A recent fMRI study demonstrated clearly that visual imagery is mediated via top-down activation and that top-down control mechanisms engaged during visual imagery activate similar precise neural populations within high-level visual cortex as activated during perception condition (Stokes, Thompson, Cusack, & Duncan, 2009). However, the functional mechanisms and neuronal correlates of visual imagery are discussed controversially (Bartolomeo, 2008).
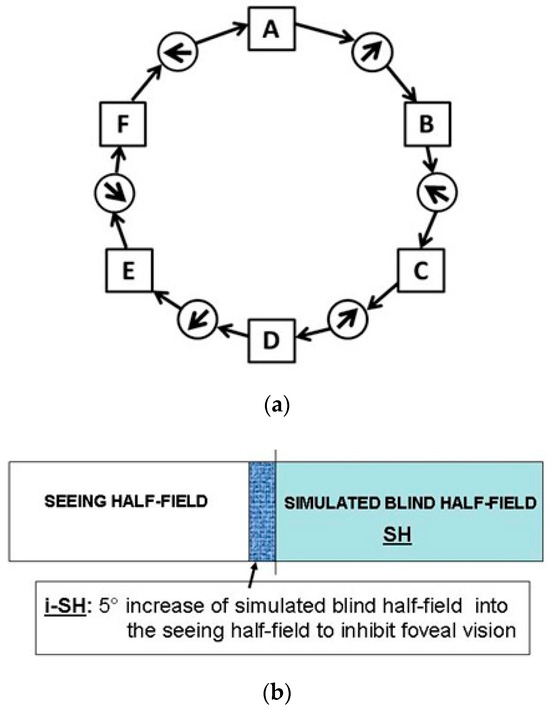
Figure 1.
(a) Scanpath Theory-Feature Ring. Eye fixations shown as connected sequence resulting in a sequential string of visited regions of interest (ROIs) (lettered squares) and saccadic eye movements (circles with arrows) shown by solid arrows. (b) SH and i-SH.
A recent model integrating active vision and visual mental imagery postulates that visual perception and visual imagery share common mechanisms. According to the model, these are subserved by the same neural substrates such as associative brain areas including the secondary visual cortex and retinotopic areas in the occipital pole V1 (Kosslyn, 1994; Kosslyn, Thompson, Kim, & Alpert, 1995). Recently, many studies underline the importance of EM scanpaths, demonstrating a functional role in visual mental imagery (Mast & Kosslyn, 2002). Brandt and Stark showed that there are in fact eye movements during visual imagery that represent the actual image and even reflect the image‘s content. Using string editing analyzes, they found similarities between the eye‘s scanpath in visual mental imagery and perception in naïve subjects. In addition, it was shown that EM are functionally involved in mental imagery processes and reflect the conditions in which the subject has previously studied the stimuli (Laeng & Teodorescu, 2002). In these experiments scanpaths of participants who were allowed to move their eyes freely during inspection and imaging that were highly correlated to those during visual imagery of the same visual object. Participants who maintained fixation while studying the image, made almost no EM in the later visual imagery condition. Furthermore, it was shown that the more similar the imagery and perception scanpaths, the better the subjects performed in a subsequent spatial memory task. However, it has been argued that the effort to maintain fixation might have limited their visual imagery. We previously demonstrated that in patients with homonymous hemianopia scanpath EM performed within viewing and subsequent visual imagery are similar to healthy subjects (Gbadamosi & Zangemeister, 2001; Zangemeister et al. 1995). This indicated a strong top-down component even in patients with sensory deficit of homonymous hemianopia. Patients that suffer from hemianopia due to unilateral brain damage mostly preserve vision in the foveal region, a phenomenon known as foveal or macular sparing. This phenomenon could be explained by the assumption of a bilateral representation of the fovea in the cerebral cortex (Bouma, 1970; Brysbaert, 1994). Macular sparing could at least partly explain the integrity of visual imagery scanpath in homonymous hemianopics. Thus, preceding foveal scanning according to Noton and Stark’s theory and subsequent high level vision processing with proper generation of internal visual representations is not disturbed in hemianopia. In the present study we investigated scanpath eye movements during viewing and visual imagery of complex images under a virtual homonymous hemianopia paradigm that simulates exactly the sensory deficits of a real homonymous hemianopia (Zangemeister and Oechsner, 1997 and 1999; Zangemeister and Utz, 2002; Schuett, Kentridge, Zihl, & Heywood, 2009a, 2009b; Tant, Cornelissen, Kooijman, & Brouwer, 2002). Furthermore, we investigated the impact of additional foveal masking and the influence of oral given tasks on subsequent visual imagery performance and scanpath EM (Rayner & Bertera, 1979). A larger mask of 10° led to similar, but less efficient results, such as longer latencies to achieve and maintain fast and stable saccades towards the blind hemifield (Zangemeister and Utz, 2002). Previously, we already reported on method and design of the presented simulated hemianopia paradigm and demonstrated preliminary results from scanpath eye movements (Zangemeister & Liman 2007). In this study we investigate the impact of a simulated homonymous hemianopia paradigm (SH) with and without foveal masking on scanpath eye movements during visual mental imagery. We hypothesized that a SH including foveal masking negatively influences subsequent scanpath performance during visual mental imagery.
Methods
Participants
Twenty subjects without any current or preceding visual, neurological or psychiatric disorders participated in our experiments. The age range was 24 to 51 years (10 females, 10 males). All subjects were naïve about the fact that their eye movements were recorded and gave their informed consent in accordance with the Declaration of Helsinki.
Apparatus and EM recording
A 22-in. monitor (74Hz) was used. To prevent head movements, a head fixation device that tightly strapped the head to circular head holder was attached to the forehead. Participants were seated comfortably with a viewing distance of 57 cm (1° equals to 1cm). Under standardized conditions, the eye movements were recorded with infrared reflection oculography (OBER 1000). The sampling rate was 200 Hz and the spatial resolution 0.1° of visual angel. Visual fixations were registered for at least 150 ms Eye blinks, which appeared in the original data, were removed by computer editing. Prior to each recording session a calibration was performed and repeated before each session block or task.
Simulating Homonymous Hemianopia (SH)
Left- and right-sided homonymous hemianopia was simulated with a gaze-contingent visual display paradigm which completely blanks one side relative to the current eye position (Figure 1b). Using the horizontal eye movement recording as trigger we generated a “visual field defect” simulating a homonymous hemianopia of 50% blank screen off the foveal eye position (accuracy ± 0.5 deg., delay 14 ms). A simulated visual field defect which matched the background colour (black to dark grey) was chosen to ensure no relevant visual information content was present. In patients with real homonymous hemianopia the foveal visual field (0.5-1°) of fixation and infrequent macular field (1-5°) is spared (Zihl, 2000). For definite exclusion of high-resolution viewing in our increased SH and foveal masking paradigm, we applied an additional 5 degree increase to the simulation of homonymous hemianopia (Figure 1b).
Experimental Protocol and stimuli
Prior to each session and block, calibration and counterbalances were performed and accuracy of SH was tested. Calibration was repeated up to three times prior to each session and in cases of mismatch. Criterion for successful calibration was resting of EM within the fixation cross of at least 150ms. Initially subjects had two minutes to get used to the SH. Each subject was measured during a standardized routine that consisted of one stimulus presentation phase, one center fixation phase for calibration and one imagery phase. We used eight different stimuli of 29° horizontal visual angle that were all bordered by a reference frame. Stimuli ranged from realistic to abstract art pictures. For each stimulus subjects there was a 5 second viewing phase, followed by 2 second centre fixation and 5 seconds of visual imagery. In the imagery or “visualization” phase the subjects were asked to recall the picture by looking at the blank reference frame on the monitor and scan it freely from their imagination (Figure 2). Three sessions were performed. Each session consisted of three blocks à 8 trials including consecutive viewing, fixation and imagery. Duration of one session was 20 minutes. The first session was before iSH (pre), the third after iSH (post). During the second session half of the subjects were confronted with a SH increase of (+) 5 deg (iSH) in all blocks:
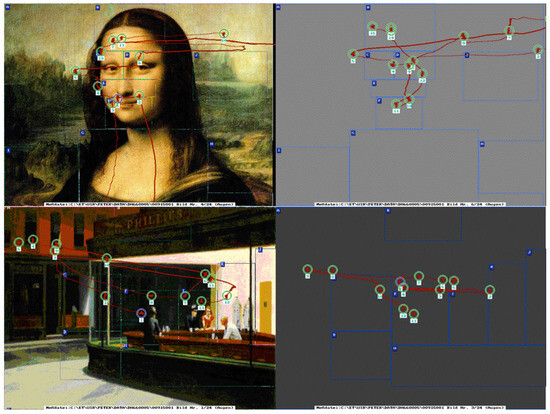
Figure 2.
Demonstration of eye movement scanpaths of picture viewing (left) and subsequent visual imagery of two famous art works: the Mona Lisa by Leonardo da Vinci, and Edward Hopper´s Nighthawks 1942, Oil on canvas, 30 x 60, in The Art Institute of Chicago. Visual stimuli in this study ranged from realistic to abstract art pictures.
Within each block every stimulus was followed by written instructions for a task. The first task (“easy”) was to look at the whole picture. For the second task (“detailed”) subjects were asked to memorize the specific details of each picture. For the last task (“recollection”) subjects were instructed to look for relationships between specific items.
Comparisons of Scanpath EM
Most frequently used methods for the comparison of scanpaths first divides the presented picture into ROIs and attaches unique labels such as letters to each region (Choi, Mosley, & Stark, 1995; Hacisalihzade, Allen, & Stark, 1993; Zangemeister, Oechsner, & Freksa, 1995; Zangemeister, Sherman, & Stark, 1995). This way the two dimensional fixation-saccade sequence is reduced to a one dimensional sequence of letters: if fixations are located in the ROIs “D”, “C”, “A” and “B”, the resulting sequence is “DCAB”. For definition of ROI’s we chose geometrical, “a priori” and “a posteriori” or intelligent regionalization (Figure 3). In the “a posteriori” definition, the principal interesting features of the visual stimuli are regionalized into different ROIs. Substitution of each fixation with the letter of the ROI in which it is located leads from the sequence of fixations to a sequence of ROI labels. Afterwards, these strings representing the gaze sequences can be compared using string editing analysis (Sankoff & Kruskal, 1983; Wagner & Fischer, 1974).
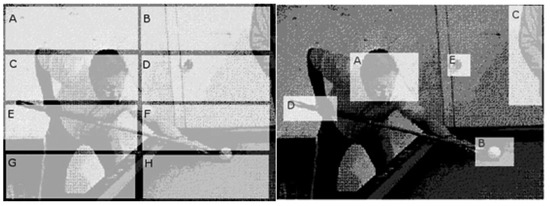
Figure 3.
For comparison of scanpaths the presented picture is divided into ROIs. A unique label is attached to a region (e.g., letters). In that way the two-dimensional fixation-saccade sequence is reduced to a one-dimensional sequence of letters. For definition of ROI´s two regionalization were used: geometrical (left) or “a priori”, and “a posteriori” or intelligent (right).
Global/Local ratio. G/l ratio, e. g. the ratio between saccades of >1,1°/ <1,1° is a measure to distinguish between global versus local viewing strategies as described earlier (Zangemeister, Sherman et al., 1995).
Region string editing (RSE)
In string editing analyses the minimal number of editing operations such as deleting, inserting or substituting of letters needed to transfer one string into the other is calculated. For example, “ROOM” is turned to “GLOOM” inserting “G” at the beginning and substituting “R for “L”. Weights (or “costs”) are assigned to these editing operations. Insertion and deletion cost “1”, substitution “2”. Thus, between “ROOM” and “GLOOM” there is a string distance (D) of 3 (Brandt & Stark, 1997; Choi et al., 1995; Gbadamosi & Zangemeister, 2001; Josephson & Holmes, 2002). Similarity of scanpaths is presented in the range of 0 to 1 (For a detailed description of the calculation of similarity using maximum distance of two strings see Choi et al., 1995).
For string editing a “string compression” variant exists. In the compressed form of region string editing (cRSE) a sequence of equal strings produced by multiple fixations in one ROI is reduced to one string.
Data Analysis
The analysis was carried out using SPSS 16. For experimental programming of post experimental analysis of eye movements MATLAB (Mathworks, Natick, MA) was used. As the number of subjects permitted no meaningful conclusions on the normality of the data distribution, non-parametric statistical tests were applied throughout. In the visual imagery evaluation for comparing the similarities of the computed strings (viewing, imagery) Kruskal -Wallis ANOVA on Ranks were used. We calculated the viewing/ imagery scanpath similarities using string editing comparison methods mentioned above. The evaluation of basic saccade parameters was performed using Mann - Whitney rank sum test. For more than 2 groups we used Kruskal and Wallis Test with post hoc Dunn´s test for pair wise group comparison. A p-value less than 0.05 were considered to be a statistically significant difference.
Results
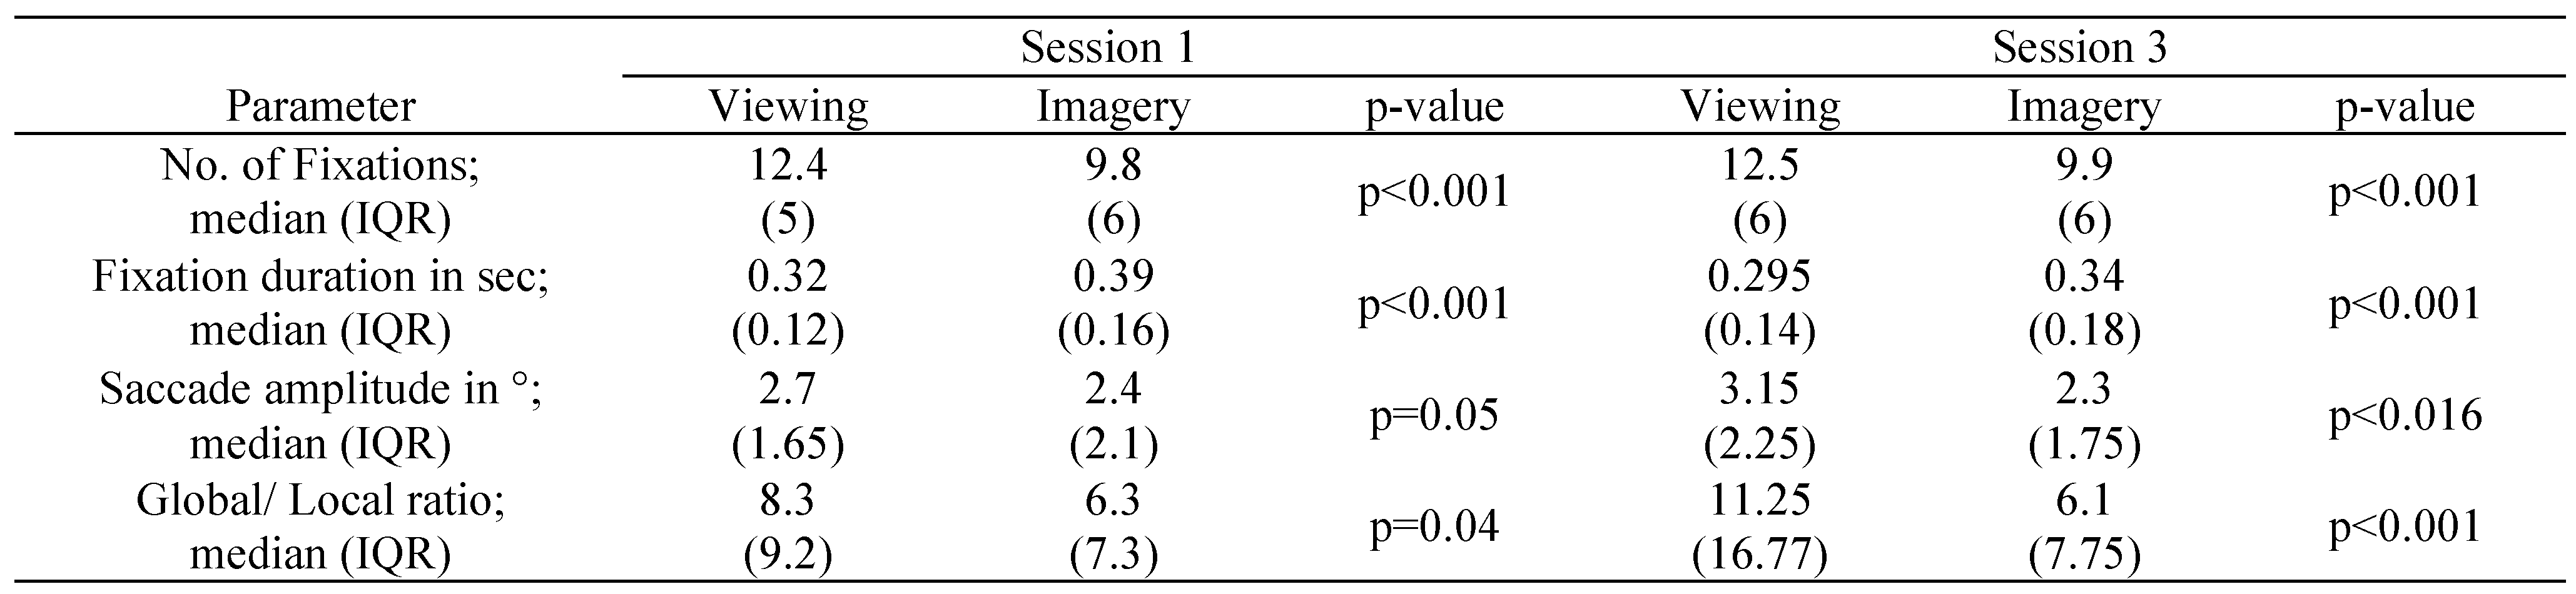
Basic Scanpath Parameters of Visual Imagery in simulated hemianopia (Table 1)
For all subjects eye movements and basic scanpath parameters differ significantly between visual mental imagery and viewing in the present simulated homonymous hemianopia paradigm. We compared saccade amplitude, number of fixations, fixation duration and global/ local ratio. We found significantly lower numbers of fixations, saccade amplitudes and g/l ratio during visual mental imagery. Correspondingly, the fixation duration was significantly higher in visual imagery scanpaths than in the viewing condition. These results were consistently reproducible for all picture stimuli. Furthermore, there was a significant decrease in fixation duration between session 1 and 3 in the visual imagery as well as in the viewing condition. Compared to session 1, we found a non-significant trend for higher G/l ratio and higher saccade amplitude in the viewing condition in session 3.

Table 1.
Group comparison of basic scanpath parameters of visual imagery and viewing in SH subjects (IQR, interquartile range). Significant differences were found between number of fixations, duration of fixation, saccades amplitudes and global/local ratio in eye movements during visual imagery versus eye movements during regular viewing of stimuli.
 |
String similarity Scanpath Analysis (Table 2)
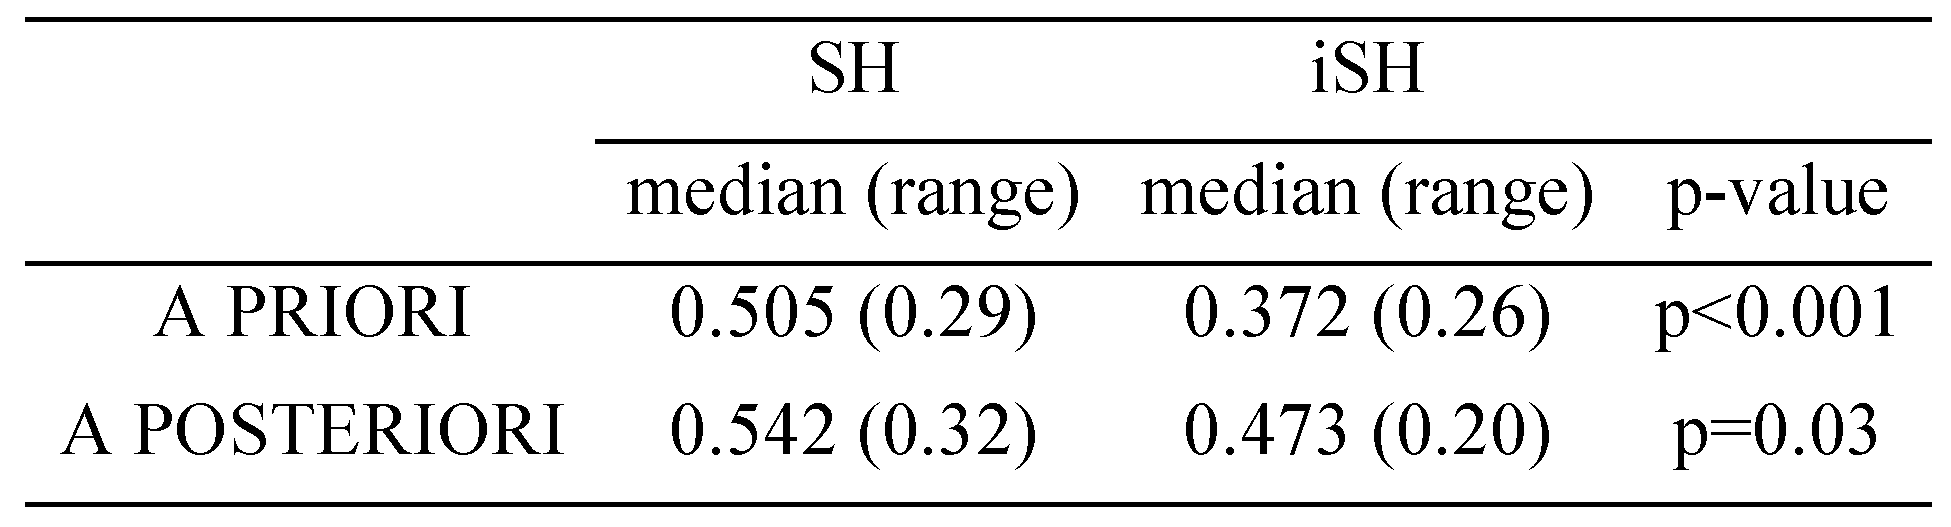
Using string editing methods for scanpath evaluation we found high similarity values between viewing and visual imagery throughout all our scanpath analyses. We detected similar string similarities between all simulated homonymous hemianopia sessions for geometrical “a priori” regionalization and semantic “a posteriori” regionalization. Comparing the regionalization form, e.g. string similarities of viewing and imagery scanpath between geometrical “a priori” and semantic “a posteriori” regionalization, throughout there was a significant difference (p<0.001) (Tab.2). These findings were reproducible and consistent for regional string editing both in single subject analysis as in single-stimulus (picture) analysis. Evaluation of scanpaths after applying an additional 5 degree visual field defect (iSH) showed lower string similarities between viewing and imaging scanpaths in the iSH group than in subjects with SH. These results were significant for both ROI regionalizations.
Table 2.
Comparison of scanpath similarity of visual imagery and viewing in SH subjects with and without 5increased simulated visual field (iSH) demonstrates especially for the a priori analysis a highly significant difference between SH and iSH.
Table 2.
Comparison of scanpath similarity of visual imagery and viewing in SH subjects with and without 5increased simulated visual field (iSH) demonstrates especially for the a priori analysis a highly significant difference between SH and iSH.
 |
Effect of oral given tasks and picture content (Table 3)
We determined the influence of three oral given tasks, e.g. easy or (”Look at the whole picture!”), detailed (“Look for the specific details of each picture!”) and recollection (“Look for relationships between items”) on string similarity and basic eye movement parameters in our simulated homonymous hemianopia paradigm. We found an effect on scanpath similarity between viewing and visual imagery as indicated by a significant higher string similarity in session 1 in the easy condition compared to the detailed condition. For the other sessions with task performance, string-editing analysis did not detect any statistical relevant differences in similarity between viewing and visual imagery scanpath.
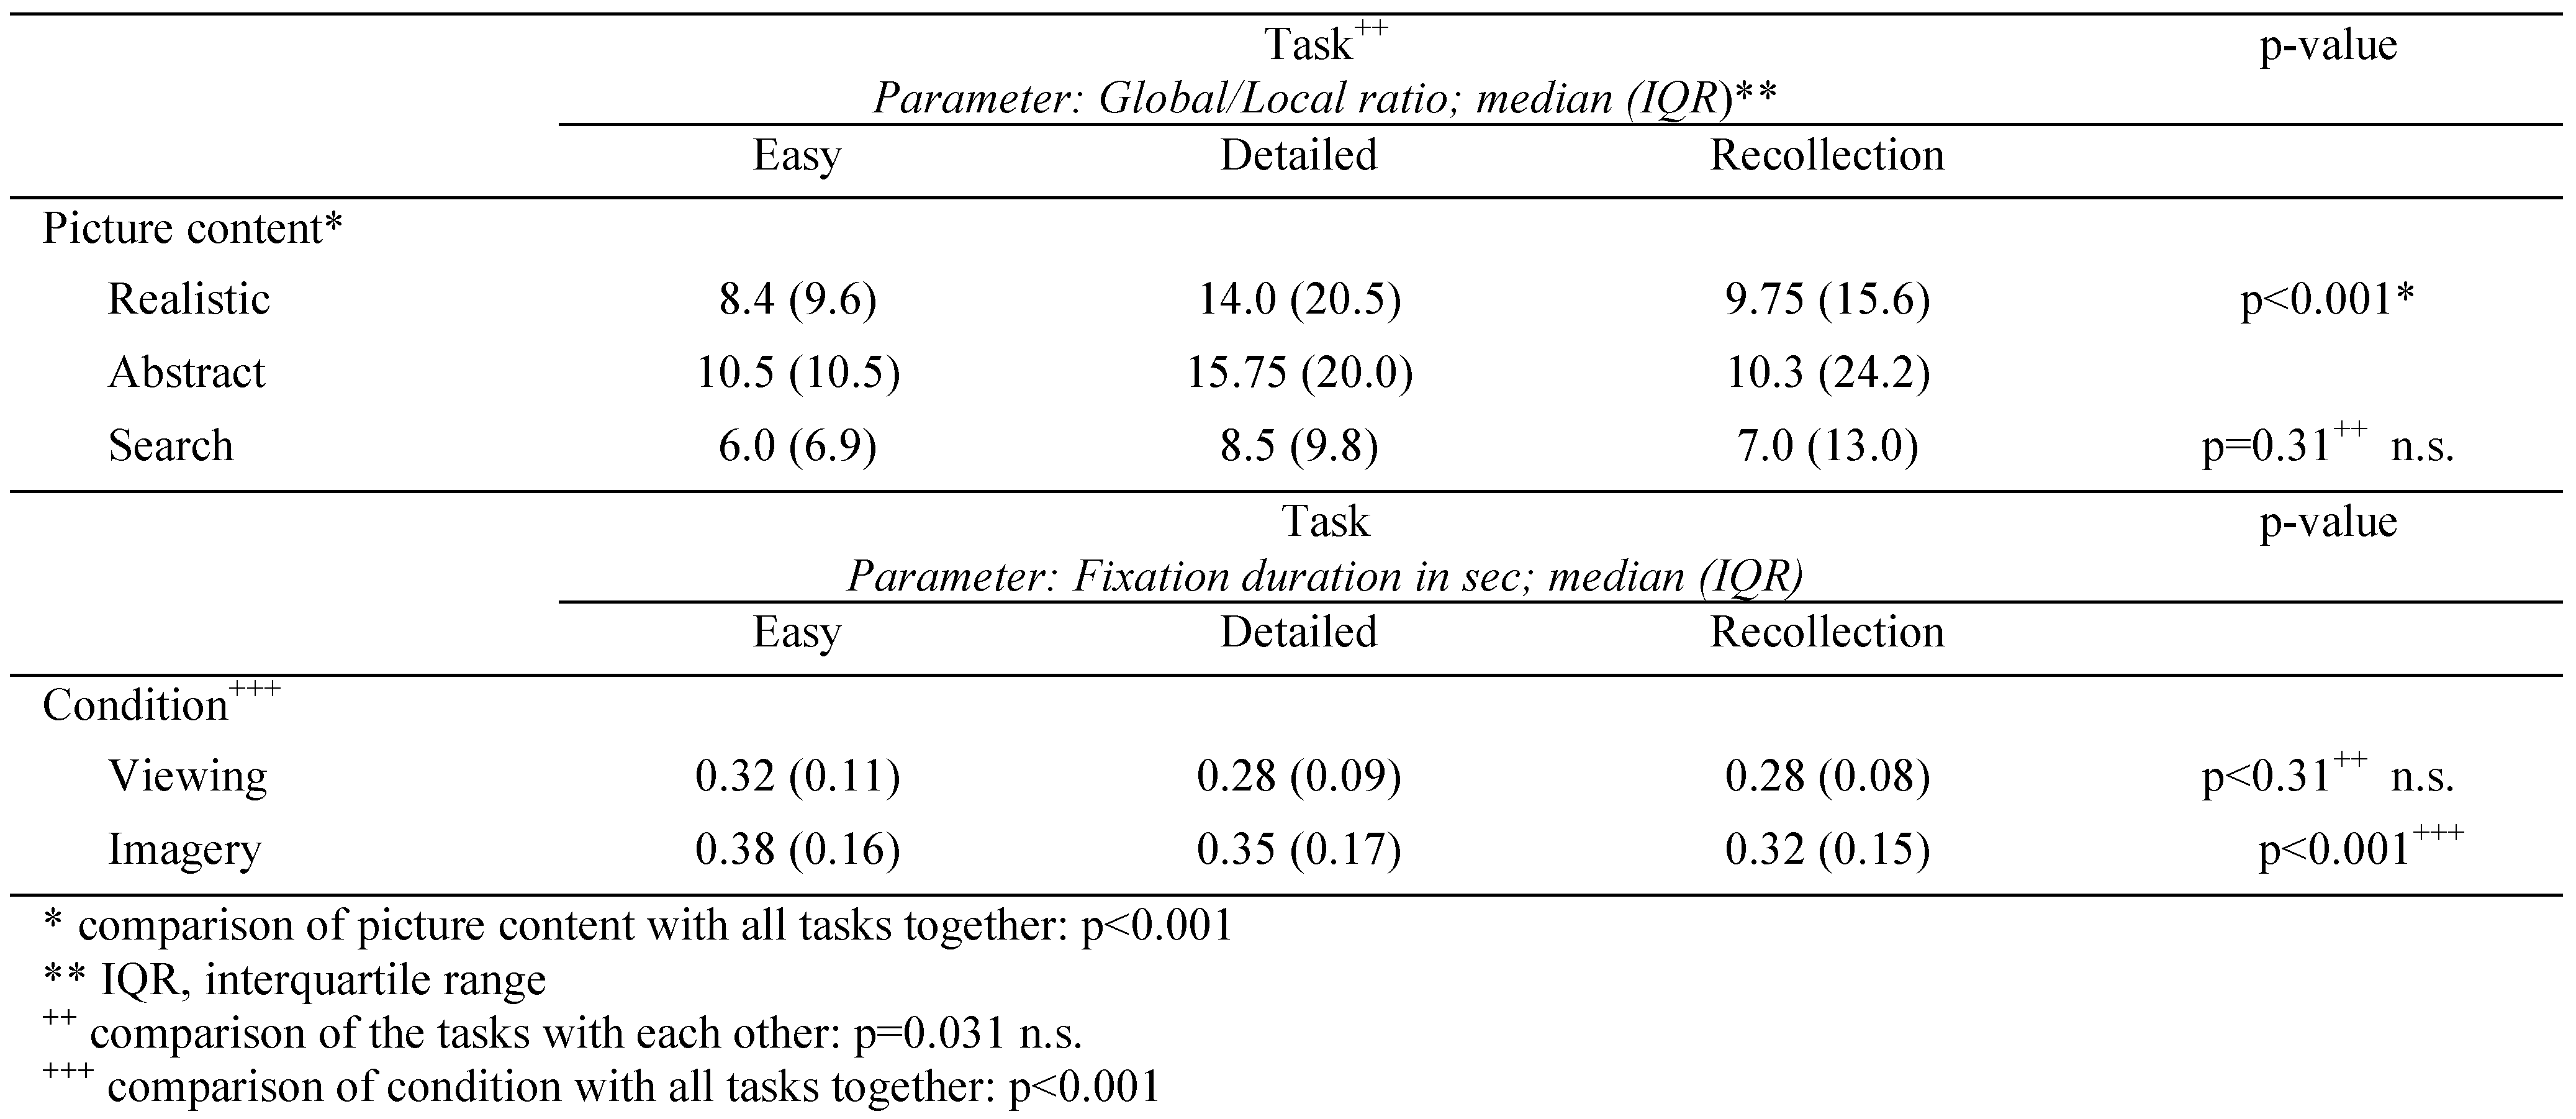
In further analysis of basic eye movement scanpath parameters we found a significant effect of tasks (easy, detailed, recollection) and picture content (realistic, abstract, search) on fixation duration and g/l ratio using Kruskal-Wallis-Test followed by pair wise group comparisons. Simulated homonymous hemianopia subjects demonstrated a significantly increased median g/l ratio for abstract and realistic picture content. Further, they showed significant decreased fixation duration for detailed and recollection tasks. Picture content and viewing condition were the main influencing variables. Significant differences were found for comparison of global/ local ratio of picture content (realistic, abstract, search), with all tasks together (easy, detailed, recollection); as well as for comparison of fixation duration of condition (viewing, imagery) with all tasks together (easy, detailed, recollection). Differences within the task groups (easy, detailed, recollection) were not significant neither for global/local ratio nor for fixation duration. In summary, the highest g/l ratio was detected for abstract picture content and for detailed viewing task in our simulated homonymous hemianopia paradigm.
Table 3.
Group comparisons of basic scanpath parameters between task and content, and task and condition in SH subjects. Picture content and viewing condition were the main influencing variables. Significant differences were found for comparison of global/local ratio between picture content (realistic, abstract, search), and all tasks together (easy, detailed, recollection); as well as for fixation duration between condition (viewing, imagery) and all tasks together (easy, detailed, recollection). Differences within the task groups (easy, detailed, recollection) were not significant neither for global/local ratio nor for fixation duration.
 |
Discussion
EM in visual imagery
Using string editing methods for scanpath evaluation we found high similarity values between viewing and visual imagery throughout all our scanpath analyses. Evaluation of scanpaths after applying an additional 5 deg. visual field defect (iSH) showed lower string similarities between viewing and imaging scanpaths in the iSH group than in subjects with SH. These results were significant for both ROI regionalizations.
The high similarity values of viewing and imagery scanpath in our SH subjects point to a strong top-down component as we described earlier in real homonymous hemianopia patients and normal subjects. We formerly showed that top-down mechanisms are preserved even in patients with real homonymous hemianopia after e.g. occipital ischemic stroke (Gbadamosi & Zangemeister, 2001). Here, we find analogous results in SH subjects with pure “simulated” sensory deficit that corroborate our earlier studies (Zangemeister & Oechsener, 1997 and 1999; Zangemeister & Utz 2002). This finding gives further support to Noton and Stark´ s “scanpath theory” that eye movements are controlled by centrally coded processes rather than depending only randomly on peripheral features (bottom-up; Noton & Stark, 1971b). Findings that showed similarities between scanpaths performed by a viewer while encoding and recognizing the same images supported the hypothesis that the performed scanpath is encoded along with the visual features it explores (Ellis & Stark, 1978; Stark & Eliis, 1981). Further, visual patterns are thought as representations in memory as a network of features and the attention shifts between them. This network is replayed and compared to the external stimuli when recognizing the image later. Contrarily, different theories seek to explain the guidance of EM by bottom-up mechanisms like the “saliency map model” that hypothesized that shifts of attention and EM are initiated toward the point with the highest saliency (Findlay & Walker, 1999; Henderson, 2003). However, recent findings underline the importance of repetitive scanpath sequences in modeling eye movements (Foulsham & Underwood, 2008).
Additional support to the “scanpath theory” are given by two studies reporting similarity between EM sequences made while viewing stimuli and those made when imagining them later (Brandt & Stark, 1997; Laeng & Teodorescu, 2002). Brandt et al. were the first to describe the similarity between spontaneous EM in visual imagery and perception (Brandt & Stark, 1997). They found that EM during visual imagery reflect the content of the visual scene. Furthermore, it has been shown that the frontal eye field analogue in monkeys showed a marked increase in metabolic activity during visual imagery (Gulyas, Persson, S., & Eriksson, 1992). Laeng and Teodorescu give further evidence that EM during visual imagery are not random but re-enact those of perception. Moreover, their findings as well as a study by Fuehr et al. (2004) demonstrate that EM are functionally involved in mental imagery processes. In their study subjects who were not allowed to perform EM during visual imagery were less accurate in subsequent memory test for visual details. Thus, eye movements during visual imagery seem to be important and play a functional role when we generate mental images. This adds further information to the growing evidence that many mechanisms including oculomotor strategies involved in perception are also used in mental imagery (Mast, Ganis, Christie& Kosslyn, 2003).
EM characteristics in visual imagery
Scanpath EM during visual mental imagery exhibit specific characteristics. The highly significant differences in visual imagery scanpath compared to corresponding basic viewing scanpath parameters could be summarized as a “miniaturization” or “minimization” of viewing scanpath. The different characteristics of visual imagery scanpath include smaller saccades as well as longer and less fixations. Miniaturization of scanpath in visual imagery has previously been described in healthy subjects and real homonymous hemianopia subjects (Brandt & Stark, 1997; Gbadamosi & Zangemeister, 2001). The authors concluded that different spatial and temporal characteristics of imagery scanpath reflect the underlying cognitive process of mental image generation. Thus, visualization and mental reconstruction of a visual scene or an image may not require the same temporal resolution or full-scale amplitudes for EM as in perception and correct relative spatial distances of motor activity are sufficient to support an undistorted mental image. Also, longer fixation durations suggest a longer perceptual processing time during mental visual imagery than in active viewing. The process of reconstructing the mental image seems to require prolonged fixations. Rayner and coworkers formerly described that EM parameters like fixation duration are strongly affected by the cognitive process during process during fixation (Rayner & McConkie, 1976). However, a recent study provides further evidence that oculomotor information encoded during visual perception is crucial for the process of proper mental image generation and they are used as spatial reference (Laeng & Teodorescu, 2002). Furthermore, a recent study could show that primary saccades are frequently followed by secondary saccades. In addition, microsaccades often occur during fixation (Ohl, Brandt & Kliegl 2011). Thus, this is a limitation of our study that has to be mentioned due to the fact that the scanpath definition neglects those two types of eye movements. Moreover, the secondary (micro-) saccades could be crucial for computation of the global/local ratio.
Task and picture content effects on scanpaths
Experiments by Zangemeister and Stark studied the task effect on scanpaths patterns in non-professional and professional subjects while viewing abstract and realistic images (Zangemeister, Sherman & Stark, 1995). They found a strong top-down component in more sophisticated viewers when looking at images. Sophisticated viewers used to favor a more global scanpath strategy. Here, we could demonstrate a major effect of oral given task on basic scanpath parameters in SH subjects, but minor influence on scanpath similarity of visual imagery and viewing. The global/local ratio as an indicator for global versus local scanning strategies, significantly differs between tasks. As we expected the task effect in the “detailed” condition elicited a more global scanning of the whole image. This effect was stronger in abstract than in realistic or search pictures reflecting in parts the visual content of the inspected image as previously described (Zangemeister, Sherman & Stark, 1995; Privitera & Zangemeister, 2007). Interestingly, we found lower scanpath similarity in the “detailed” condition. Evidently, an oral given task, such as “Look for details!” favors a more bottom-up approach. However, we found less heterogeneity in similarity values concluding that the validity of string editing methods is limited for evaluation of task effects on scanpath similarity.
ROI definition in string editing methods
String editing is a widely accepted method for scanpath evaluation (Barton, Radcliffe, Cherkasova, Edelman, & Intriligator, 2006; Brandt & Stark, 1997; Choi et al., 1995). Our data demonstrates that both ROI definitions (geometrical “a priori” and semantic “a posteriori”) seem to be eligible for scanpath comparisons of visual imagery and perception. Throughout, we found higher similarity values and higher differences using semantic the “a posteriori” ROI definition. We concluded that the semantic ROI definition is more valid to investigate effects on top down guided gaze strategies in favor of the scanpath theory.
SH and additional foveal masking
In this study one further interest was the behaviour concerning scanpath EM in subjects that had to deal with a simulated homonymous hemianopia model. However, there seems to be no relevant difference in top down gaze control compared to our previous studies in homonymous hemianopia patients and normal subjects. Top down processes are of essential importance in the perception process in subjects that have to deal with homonymous hemianopia (Zangemeister, Oechsner & Stark, 1995, 1996). Besides top-down strategies, compensatory EM into the blind hemifield play a crucial role in gaze strategies of patients (Pambakian & Mannan, 2000; Zangemeister, Meienberg, Stark, & Hoyt, 1982; Zihl, 2000). Tant and coworkers as well as Zangemeister and Utz (2002) demonstrated clear parallels between simulated and real hemianopia suggesting that scanning behaviour in homonymous hemianopia is primarily visually elicited and not caused by additional brain damage (Tant & & Brouwer, 2002). A larger mask of 10° led to similar, but less efficient results, such as longer latencies to achieve and maintain fast stable saccades towards the blind hemifield (Zangemeister & Utz, 2002).
Recent studies investigating simulated homonymous hemianopia support that the sensory hemianopic visual field defect is the major component of impairments of reading and visual exploration strategies found in real homonymous hemianopia patients (Schuett & Heywood, 2009a, 2009b). However, in this study we focus on scanpath comparison between visual imagery and image perception. Furthermore, we could show that an additional visual field defect with complete foveal masking has significant detrimental effects on subsequent visual imagery performance, indicated by decreased similarity between viewing and visual imagery scanpath. We conclude that missing foveal information in the preceding viewing condition deeply affects the generation of the “mental image” and therefore the consecutive top-down guided visual imagery scanpath. This conclusion puts our results in the context of the question whether visual perception and imagery shares identical cortical structures and common central processing mechanism. This topic and specifically representations of images in our mind have been the issue in the “imagery debate” (Kosslyn, Ganis, & Thompson, 2001; Pylyshyn, 2002). Kosslyn and coworkers propose an integrated model of visual imagery and perception. They postulated a retinotopically organized “visual buffer” in V1 that could serve as the visual working memory presenting visual information from outside during perception and from inside like mental images during visual imagery generated by higher level cortical areas (Kosslyn, 1995). They claimed that the internal image is constructed in the “visual buffer”. Patterns of activation are formed in the visual buffer either by image generating process from long-term memory or perceptual encoding process. Distance, location, and orientation of the internal image can be represented in this visual buffer and it is possible to shift attention to certain parts or aspects of it. Neural findings support that visual imagery and visual perception share common structures and mechanisms and the fact that areas of primary visual cortex preserve spatiality from the retina (Ganis, Keenan, Kosslyn, & Pascual-Leone, 2000; Ganis, Thompson, & Kosslyn, 2004). EM during imagery may then be connected to internal attention shifts in the visual buffer.
Rayner et al. showed for the first time that missing foveal vision drastically affects reading abilities (Rayner & Bertera, 1979). Foveal masking during scene perception could demonstrate that the information for foveal stimulus identification generally is extracted during the early part of fixations (van Diepen, Ruelens, & d'Ydewalle, 1999). In their experiments an ovoid noise mask was used to replace foveal information after different preset delays following the onset of fixations. They showed that exploration is particularly disturbed when foveal masking occurs early during fixations. Considering our results, visual imagery and “filling of the visual buffer” in high level vision may be disturbed if high resolution inspection of important image features (ROIs) during preceding perception is constricted due to foveal masking. However, this hypothesis needs further validation from future EM and fMRI studies as well as further foveal masking paradigms.
In conclusion, our results show that scanpath EM are involved in visual mental imagery and reflect the picture content even under SH. In contrast, additional foveal masking significantly reduces the similarity between viewing and imagery scanpath. This points toward a negative effect of foveal masking on subsequent visual imagery performance.
References
- Bartolomeo, P. 2008. The neural correlates of visual mental imagery: an ongoing debate. Cortex 44, 2: 107–108. [Google Scholar] [CrossRef]
- Barton, J. J., N. Radcliffe, M. V. Cherkasova, J. Edelman, and J. M. Intriligator. 2006. Information processing during face recognition: the effects of familiarity, inversion, and morphing on scanning fixations. Perception 35, 8: 1089–1105. [Google Scholar] [CrossRef] [PubMed]
- Bouma, H. 1970. Interaction effects in parafoveal letter recognition. Nature 226, 5241: 177–178. [Google Scholar] [CrossRef] [PubMed]
- Brandt, S. A., and L. W. Stark. 1997. Spontaneous eye movements during visual imagery reflect the content of the visual scene. Journal of Cognitive Neuroscience 9, 1: 27–38. [Google Scholar] [CrossRef] [PubMed]
- Brysbaert, M. 1994. Interhemispheric transfer and the processing of foveally presented stimuli. Behavioral Brain Research 64, 1–2: 151–161. [Google Scholar]
- Choi, Y. S., A. D. Mosley, and L. W. Stark. 1995. String editing analysis of human visual search. Optomery & Vision Science 72, 7: 439–451. [Google Scholar]
- Ellis, S. R., and L. Stark. 1978. Eye movements during the viewing of Necker cubes. Perception 7, 5: 575–581. [Google Scholar] [CrossRef]
- Findlay, J. M., and R. Walker. 1999. A model of saccade generation based on parallel processing and competitive inhibition. Behavioral Brain Research 22, 4: 661–674; discussion 674–721. [Google Scholar] [CrossRef]
- Foulsham, T., and G. Underwood. 2008. What can saliency models predict about eye movements? Spatial and sequential aspects of fixations during encoding and recognition. Journal of Vision 8, 2: 6 1–17. [Google Scholar] [CrossRef]
- Fuehr, M. K., and W. H. Zangemeister. 2005. Eye movements in patients with neglect compared to hemianopia show space-centred attention when fixating rotating objects. Neurological Research 27: 302–309. [Google Scholar] [CrossRef]
- Ganis, G., J. P. Keenan, S. M. Kosslyn, and A. Pascual-Leone. 2000. Transcranial magnetic stimulation of primary motor cortex affects mental rotation. Cerebral Cortex 10, 2: 175–180. [Google Scholar] [CrossRef]
- Ganis, G., W. L. Thompson, and S. M. Kosslyn. 2004. Brain areas underlying visual mental imagery and visual perception: an fMRI study. Cognitive Brain Research 20, 2: 226–241. [Google Scholar] [PubMed]
- Gbadamosi, J., and W. H. Zangemeister. 2001. Visual imagery in hemianopic patients. Journal of Cognitive Neuroscience 13, 7: 855–866. [Google Scholar] [PubMed]
- Gulyas, B., H. Persson, S.-E. S., and L. Eriksson. 1992. Neuroimaging studies in visual imagery of reading with positron emission tomography (PET), nuclear magnetic resonance (MR) imaging and brain electric activity mapping (BEAM). European Journal of Neuroscience 5, Suppl. S22. [Google Scholar]
- Hacisalihzade, S. S., J. S. Allen, and L. W. Stark. 1993. Computer analysis of eye movements. Computer Methods and Programs in Biomedicine 40, 3: 181–187. [Google Scholar] [PubMed]
- Hebb, D. O. 1968. Concerning imagery. Psychological Review 75, 6: 466–477. [Google Scholar]
- Henderson, J. M. 2003. Human gaze control during real-world scene perception. Trends in Cognitive Science 7, 11: 498–504. [Google Scholar]
- Josephson, S., and M. E. Holmes. 2002. Attention to repeated images on the World-Wide Web: another look at scanpath theory. Behavior Research Methods, Instruments, & Computers 34, 4: 539–548. [Google Scholar]
- Kosslyn, S. M. 1994. Image and Brain. Cambridge: MIT Press. [Google Scholar]
- Kosslyn, S. M., G. Ganis, and W. L. Thompson. 2001. Neural foundations of imagery. Nature Reviews Neuroscience 2, 9: 635–642. [Google Scholar] [CrossRef]
- Kosslyn, S. M., W. L. Thompson, I. J. Kim, and N. M. Alpert. 1995. Topographical representations of mental images in primary visual cortex. Nature 378, 6556: 496–498. [Google Scholar]
- Laeng, B., and D. S. Teodorescu. 2002. Eye scanpaths during visual imagery reenact those of perception of the same visual scene. Cognitive Science 26, 2: 207–231. [Google Scholar]
- Mast, F. W., G. Ganis, S. Christie, and S. M. Kosslyn. 2003. Four types of visual mental imagery processing in upright and tilted observers. Cognitive Brain Research 17, 2: 238–247. [Google Scholar] [PubMed]
- Mast, F. W., and S. M. Kosslyn. 2002. Eye movements during visual mental imagery. Trends in Cognitive Science 6, 7: 271–272. [Google Scholar]
- Noton, D., and L. Stark. 1971a. Eye movements and visual perception. Scientific American 224, 6: 35–43. [Google Scholar] [PubMed]
- Noton, D., and L. Stark. 1971b. Scanpaths in eye movements during pattern perception. Science 171, 968: 308–311. [Google Scholar] [PubMed]
- Ohl, S., S. A. Brandt, and R. Kliegl. 2011. Secondary (micro-) saccades: the influence of primary saccade end point and target eccentricity on the process of postsaccadic fixation. Vision Research 51: 2340–2347. [Google Scholar]
- Pambakian, A. L., D. S. Wooding, N. Patel, A. B. Morland, C. Kennard, and S. K. Mannan. 2000. Scanning the visual world: a study of patients with homonymous hemianopia. Journal of Neurology, Neurosurgery & Psychiatry 69, 6: 751–759. [Google Scholar]
- Privitera, C. M., L. W. Stark, and W. H. Zangemeister. 2007. Bonnard´s representation of the perception of substance. Journal of Eye Movement Research 1: 1–6. [Google Scholar]
- Pylyshyn, Z. W. 2002. Mental imagery: in search of a theory. Behavioral Brain Science 25, 2: 157–182; discussion 182–237. [Google Scholar]
- Rayner, K., and J. H. Bertera. 1979. Reading without a fovea. Science 206, 4417: 468–469. [Google Scholar] [CrossRef]
- Rayner, K., and G. W. McConkie. 1976. What guides a reader's eye movements? Vision Research 16, 8: 829–837. [Google Scholar] [CrossRef]
- Sankoff, D., and J. B. Kruskal. 1983. Time warps, string edits, and macromolecules: the theory and practice of sequence comparison. Addison-Wesley Pub. Co., Advanced Book Program. [Google Scholar]
- Schuett, S., R. W. Kentridge, J. Zihl, and C. A. Heywood. 2009a. Adaptation of eye-movements to simulated hemianopia in reading and visual exploration: transfer or specificity? Neuropsychologia 47, 7: 1712–1720. [Google Scholar] [CrossRef]
- Schuett, S., R. W. Kentridge, J. Zihl, and C. A. Heywood. 2009b. Are hemianopic reading and visual exploration impairments visually elicited? New insights from eye movements in simulated hemianopia. Neuropsychologia 47, 3: 733–746. [Google Scholar] [CrossRef] [PubMed]
- Stark, L., and S. R. Ellis. 1981. Edited by D. F. Fisher, R. A. Monty and J. W. Senders. Scanpaths revisited: cognitive models direct active looking. In Eye movements: cognition and visual perception. Hillsdale, NJ: Lawrence Erlbaum: pp. 193–227. [Google Scholar]
- Stokes, M., R. Thompson, R. Cusack, and J. Duncan. 2009. Top-down activation of shape-specific population codes in visual cortex during mental imagery. Journal of Neuroscience 29, 5: 1565–1572. [Google Scholar] [CrossRef]
- Tant, M. L., F. W. Cornelissen, A. C. Kooijman, and W. H. Brouwer. 2002. Hemianopic visual field defects elicit hemianopic scanning. Vision Research 42, 10: 1339–1348. [Google Scholar] [CrossRef] [PubMed]
- Van Diepen, P. M., L. Ruelens, and G. d'Ydewalle. 1999. Brief foveal masking during scene perception. Acta Psychologica (Amsterdam) 101, 1: 91–103. [Google Scholar] [CrossRef]
- Wagner, R. A., and M. J. Fischer. 1974. The string-tostring correction problem. Journal of the ACM 168–173, 21. [Google Scholar]
- Yarbus, A. L. 1967. Eye movements and vision. New York: Plenum Press. [Google Scholar]
- Zangemeister, W. H., F. Dannheim, and K. Kunze. 1986. Edited by E. L. Keller and D. Zee. Adaptation of gaze to eccentric fixation in homonymous hemianopia. In Adaptive Processes in Visual and Oculomotor Systems. Advances in Bioscience. Amsterdam-New York: Elsevier: vol. 57, pp. 247–252. [Google Scholar]
- Zangemeister, W. H., O. Meienberg, L. Stark, and W. F. Hoyt. 1982. Eye-head coordination in homonymous hemianopia. Journal of Neurology 226, 4: 243–254. [Google Scholar] [CrossRef]
- Zangemeister, W. H., U. Oechsner, and C. Freksa. 1995. Short-term adaptation of eye movements in patients with visual hemifield defects indicates high level control of human scanpath. Optomery & Vision Science 72, 7: 467–477. [Google Scholar]
- Zangemeister, W. H., K. Sherman, and L. Stark. 1995. Evidence for a global scanpath strategy in viewing abstract compared with realistic images. Neuropsychologia 33, 8: 1009–1025. [Google Scholar] [CrossRef]
- Zangemeister, W. H., and U. Oechsner. 1997. Virtual reality hemianopic scotomas induce eccentric fixation: Scanpath strategies to optimize high level vision in healthy subjects. IEEE 97CH36136-EMBS, 551–560. [Google Scholar]
- Zangemeister, W. H., and U. Oechsner. 1999. Edited by Becker and et al. Adaptation to visual field defects with virtual reality scotoma in healthy subjects. In Current Oculomotor Research. New York: Plenum Press: pp. 89–92. [Google Scholar]
- Zangemeister, W. H., and P. Utz. 2002. An increase in a virtual hemianopic field defect by10 degree: it enhances the efficiency of secondary adaptive gaze strategies. Current Psychology of Cognition 21: 281–303. [Google Scholar]
- Zangemeister, W. H., and T. Liman. 2007. Foveal versus parafoveal scanpaths of visual imagery in virtual hemianopic subjects. Computers in Biology and Medicine 37: 975–982. [Google Scholar] [CrossRef] [PubMed]
- Zihl, J. 1981. Recovery of visual functions in patients with cerebral blindness. Effect of specific practice with saccadic localization. Experimental Brain Research 44, 2: 159–169. [Google Scholar] [CrossRef] [PubMed]
- Zihl, J. 2000. Rehabilitation of visual disorders after brain injury. Hove, UK: Psychology Press. [Google Scholar]


Copyright © 2012. This article is licensed under a Creative Commons Attribution 4.0 International License.