Abstract
When viewing a scene or searching for a target, an observer usually makes a series of saccades that quickly shift the orientation of the eyes. The present study explored how one saccade affects subsequent saccades within a dynamic neural field model of the superior colliculus (SC). The SC contains an oculocentric motor map that encodes the vector of saccades and remaps to the new fixation location after each saccade. Our simulations demonstrated that the observation that saccades which reverse their vectors are slower to initiate than those which repeat vectors can be explained by the aforementioned remapping process and the internal dynamics of the SC. How this finding connects to the study of inhibition of return is discussed and suggestions for future studies are presented.
Introduction
When viewing a scene or searching for a target, an observer makes a series of rapid eye movements (saccades) interspersed by short intervals during which the eyes remain still. While awake, humans, on average, make 3-4 saccades per second. This unique eye movement behavior is ecologically important as it shifts the orientation of the eyes and brings visual information to the most sensitive part of the eye (i.e., fovea) for detailed processing.
Previous behavioral, neurophysiological and computational efforts have greatly advanced our understanding of the underlying mechanisms of saccade generation. In the present study, we asked a slightly different theoretical question. Namely, how does one saccade affect the generation of subsequent saccades, or, similarly, what are the after effects of saccades? This question was explored within a dynamic neural field (DNF) model of the superior colliculus (SC), which is a key component of the oculomotor system.
Saccades and the Superior Colliculus
The control of saccades involves a complex collection of brain areas, including the parietal and frontal cortices, basal ganglia, thalamus, SC, cerebellum, and brainstem reticular formation (Munoz & Fecteau, 2002). The SC is especially important in controlling eye movements, partly because it receives inputs from both the outside visual world and higher brain areas, making it a perfect candidate for studying how bottom-up (exogenous) and top-down (endogenous) inputs interact in saccade programming (Trappenberg, Dorris, Munoz, & Klein, 2001).
Single-unit recording studies have shown that the intermediate layer of each superior colliculus (SCi) contains a motor map that encodes the direction and amplitude of saccades into the contralateral visual field (e.g., Robinson, 1972). In this motor map, two types of neurons are known to play a critical role in the generation of saccades. Fixation neurons, located at the rostral pole of each colliculus, discharge tonically during active fixation and cease discharge shortly before saccade onset (Munoz & Wurtz, 1993). Buildup neurons, responsible for saccade preparation, are located more caudally and have a long-lead discharge increase before saccades (Munoz & Wurtz, 1995a; 1995b). These saccade-related SCi neurons are connected in such a manner that proximal neurons excite each other and distal neurons inhibit each other (for a review, see Munoz & Fecteau, 2002). This laterally connected motor map acts in a “winner-take-all” fashion, with competition between different inputs resulting in the initiation of a saccade to the response field of a winning node. Before any input (exogenous or endogenous) reaches the SCi (i.e., the eyes are maintaining active fixation), fixation neurons at the rostral pole discharge tonically, whereas the caudal areas of both colliculi remain “silent”. When any input arrives at the caudal area of the SCi, neuronal activity at the excited sites starts to increase and fixation neuron activity begins to decrease. When sufficient input has arrived, the excited caudal site (buildup neurons) will eventually dominate the map and shut down the rest of the map, including fixation neurons. When this activity crosses a particular activity threshold, a saccade is initiated through an output signal to the brainstem reticular formation (Munoz & Fecteau, 2002).
Computational Explorations of Saccade Initiation
Several computational approaches have been used to explore various saccade-related behaviors (e.g., Findlay & Walker, 1999; Kopecz & Schöner, 1995). We believe the most fruitful theoretical approach connects neuronal and behavioral findings in a computationally explicit model implemented in terms of networks of artificial neurons. One such technique is the dynamic neural field (DNF) modeling approach (e.g., Amari, 1977; Wilson & Cowan, 1973). Such a technique can capture the lateral interaction in the SC and has been successfully used to explore various saccade-related behaviors in a variety of experimental paradigms (Arai, Keller, & Edelman, 1994; Das, Keller, & Arai, 1996; Kopecz, 1995; Kopecz & Schöner, 1995; Meeter, Van der Stigchel, & Theeuwes, 2010; Trappenberg et al., 2001; Wilimzig, Schneider, & Schoener, 2006). Using a behavioral distractor paradigm and monkey single-unit recording data, Trappenberg et al. (2001) parameterized the lateral interaction structure of the monkey SCi. With a Mexican-hat shaped interaction kernel, the authors effectively reproduced not only cell recordings, but also behavioral performance data (e.g., saccadic reaction times, SRTs) in various experimental paradigms. We chose to use this model in the present study because: a) the lateral interaction kernel is constrained by neurophysiological data; b) it maintains a good balance between simplicity and theoretical explicitness; c) it is capable of reproducing, and making predictions about, both neuronal and behavioral data.
Why Are Return Saccades Slower to Initiate than Forward Saccades
As mentioned earlier, the purpose of the present paper is to explore the aftereffects of saccades. More specifically, how does a given saccade affect the behavior of subsequent saccades? One such aftereffect that is frequently observed in the literature on oculomotor behavior is that saccades which repeat the previous vectors are faster to initiate than those which reverse vectors (Anderson, Yadav, & Carpenter, 2008; Dodd, Van der Stigchel, & Hollingworth, 2009; Hooge, Over, van Wezel, & Frens, 2005; Hooge & Frens, 2000; Klein & MacInnes, 1999; MacInnes & Klein, 2003; Smith & Henderson, 2009; for an exception, see Dorris, Taylor, Klein, & Munoz, 1999). For convenience, we will refer to saccades which repeat the vector of the immediately preceding saccade as “forward saccades” and those which reverse vector as “return saccades” (In our usage, “vector” has a direction and amplitude. Consequently, both forward and return saccades, as explored and modeled here, have the same amplitude as the previous saccade.).
Here we propose an explicit theory that explains why forward saccades are faster to initiate than return saccades, simply on the basis of the “leftover” activity in the SCi associated with the immediately preceding saccade (as illustrated in Figure 1A). When the eyes are actively fixating a location in visual space (e.g., A in Figure 1A), fixation neurons at the rostral pole of the SCi (F') discharge tonically and take over the network. To initiate a saccade to another spatial location (e.g., B in Figure 1A), inputs (which can be either exogenous or endogenous) arrive at neurons in the SCi representing this location (B' in Figure 1A). Shortly before a saccade to the new location (B) is initiated, the neuronal activity at B' in the SCi approaches, and eventually exceeds, the threshold for initiating a saccade. After the saccade is executed, neurons in the SCi are remapped to the new foveal location, which was the target of the saccade and is now represented by firing of fixation neurons at the rostral pole. Thus, the neurons in the SCi that originally drove the saccade (B' in Figure 1A), now represent a new spatial location (C in Figure 1A) which is, relative to the new fixation, in the same direction and of the same amplitude as the previous saccade. Although the discharge of fixation neurons at the rostral pole (F') starts to increase shortly before the saccade is completed, neuronal activity at B' does not die out immediately. In our model (see below), this leftover activity leads to asymmetric activation in the SCi and, as a result, saccades in the forward direction, particularly those with the same amplitude as the previous saccade, might be facilitated, while those directed back to the vicinity of the previous fixation location (reverse vector) might be impeded.
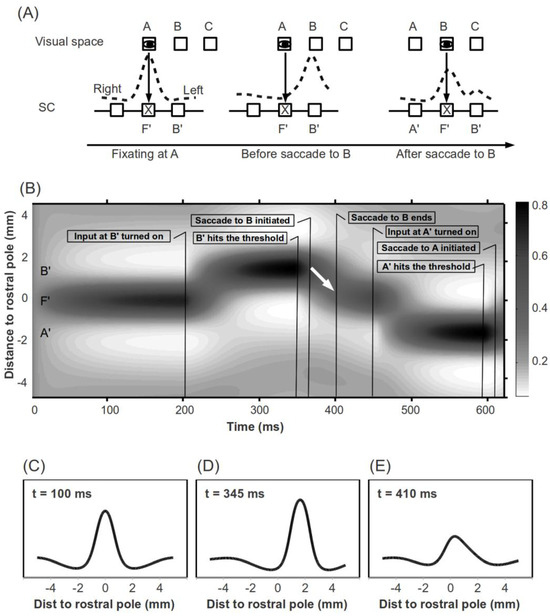
Figure 1.
(A) Remapping of space in the SCi after a saccade results in asymmetric activation. Eyes mark the fixated spatial location. X's mark the rostral pole of the SCi. For convenience, the right colliculus is drawn on the left. (B) Illustration of a sample simulation trial. On the Y-axis, positive and negative values denote the right and left colliculi, respectively. The white arrow marks a hill of activity “Moving” toward the rostral pole during the first saccade. (C), (D) and (E) Network activity during active fixation (t = 100 ms) shortly before a first saccade is initiated (t = 345 ms) and shortly after this saccade ends (t = 410 ms). The scales on the X axis denote distance from the rostral pole (mm). As clearly shown in (E), the SCi is asymmetrically activated shortly following a saccade, as illustrated in (A).
One may argue that the activity associated with a saccade decays so quickly that by the end of a saccade there should be little or no activity remaining at the activated SCi site. However, neurophysiological results (Munoz & Wurtz, 1995b) and our simulations demonstrate that this is not necessarily the case (see Figure 2A). The SCi is a “push-pull” network; as pointed out by Munoz and Fecteau (2002), “the amount of activity expressed in the intermediate layers remains reasonably constant; with only the distribution of this activity changing. Therefore, if the activity of one node is strong, then the inhibition of distant nodes will be strong.” (pp. 4-5). That is, the leftover activity associated with a saccade will lead to a peak and a trough. For forward and return saccades, the inputs to the SCi will be at the peak and trough, respectively. This baseline difference will transfer into observable behavioral differences nonlinearly, if the time interval between saccades is short enough. The remainder of this paper will explore this theory computationally with simulations of various experimental paradigms.
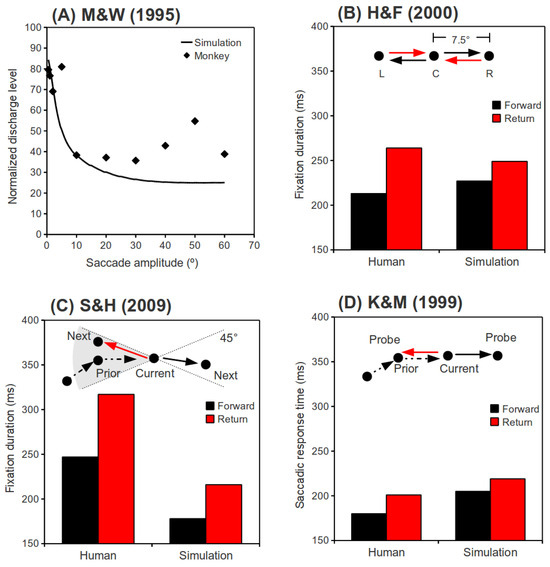
Figure 2.
(A) Normalized discharge level at the end of a saccade as a function of saccade amplitude. Monkey data is adapted from Munoz and Wurtz (1995a). (B) Behavioral data of a single participant from Hooge and Frens (2000, Experiment 2a) and associated simulation results. Saccades L→C and R→C are “Return” saccades, and saccades C→R and C→L are “Forward” saccades. (C) Behavioral data from Smith and Henderson (2009, Experiment 1) and associated simulation results. Only saccades with roughly the same amplitude as their preceding saccades are plotted. Saccades landing in a 45° binned region centered in the direction from the “Current” to the “Prior” fixation are “Return” saccades, while saccades landing in a 45° binned region centered in the direction from the “Prior” to the “Current” fixation are “Forward” saccades. (D) Behavioral data from Klein and MacInnes (1999, Experiment 1) and associated simulation results. While participants were searching for a camouflaged target, saccades were visually directed to the “Prior” fixation location (“Return” saccades), or a location on a circle defined by the “Current” and the “Prior” fixations, but at 180° (angular distance) from the “Prior” fixation ( “Forward” saccades).
Note that the present paper is not the first one to adopt this general framework, a similar idea has been expressed in Klein and MacInnes (1999; see also Smith & Henderson, 2009):
“Because oculomotor responses are likely initiated by a winner-take-all algorithm mediated by lateral inhibition (and implemented in the superior colliculus), any asymmetric preparation would result in inhibition of the least prepared saccades.”.(p. 351)
Model Architecture
The present simulations utilize a 1-dimensional DNF model with parameters similar to previous work (Trappenberg et al., 2001). Precisely the same DNF model of the SCi was recently used by Satel, Wang, Trappenberg and Klein (2011). Importantly, Satel et al. (2011) were exploring the effects of attenuated inputs on the behavior of the model while in the present paper we are exploring the aftereffects of saccades on the behavior of the model. Whether the effects explored in these two papers represent two contributions that underly oculomotor inhibition of return (IOR) is addressed in the General Discussion.
In this model, n=1001 nodes were used to represent 5 mm of each colliculus, with nodes laterally connected in a manner such that proximal nodes excite each other while distal nodes inhibit each other. The connection strength, or weight (wij), between two nodes i and j was set with two Gaussians (Equation 1). The following parameters for internal connectivity were used in all simulations: a = 72, b = 24, c = 6.4, σa = 0.6, σb = 1.8. Although this lateral interaction was chosen to approximate cell recordings in the SCi of monkeys in Trappenberg et al. (2001), it is not an exact fit to the physiology data.

The dynamics of the internal state ui(t) of node i is described in Equation 2, where τ =10 ms, is a time constant defining the rate of relaxation, wij is the connection strength (weight) between node i and node j, rj(t) is the activity level (average firing rate) of node j, Ii(t) represents the external input to node i, and u0 = 0 is a constant resting level. The activity of node i, ri(t), as a function of its internal state ui(t), is defined by a sigmoidal gain function (Equation 3), where β = 0.07 and θ = 0 were used in our simulations.
The activity of buildup neurons in response to a visual stimulus is characterized by two peaks. The first peak represents the incoming visual input, which decays exponentially, and the second peak represents a sustained “move signal”, presumably from higher cortical areas. These two distinct inputs were labeled exogenous and endogenous inputs in previous studies (e.g., Kopecz, 1995; Kopecz & Schöner, 1995; Satel et al., 2011; Trappenberg et al., 2001). This distinction was ignored in the present exploration because our theory is about the dynamics within the SC and our simulations do not depend on the sources of inputs to the SC. For simplicity, sustained (endogenous-like) inputs are used in all of our simulations. These inputs are assumed to have a Gaussian spatial shape, centered at location i. As a consequence, the input to other nodes (k) in the network depends on the distance between i and k, as represented by Equation 4. Whenever the activity of a node reaches a threshold of 80% of its maximum firing rate, a saccade to its response field is initiated after a 20 ms efferent delay. In our simulations, the input strength (d) and the input width (σd) were varied between different experimental tasks.
The activity of fixation neurons is characterized by tonic discharge during active fixation, a pause during saccades, and reactivation shortly before a saccade ends (Munoz & Wurtz, 1993). An assumption made in our simulations was that the reactivation of fixation neurons is crucial for the maintenance of fixation at the saccade target location. Thus, in our simulations, input is fed to the fixation neurons whenever a buildup neuron in the caudal area reaches the saccade initiation threshold.
Simulations
Residual Activity after Saccades
One critical aspect of our theory is that it depends on how much activity remains at a SCi site when a saccade to its response field ends. As can be seen in Figure 1E, this residual activity and its decay rate determines how long the “asymmetric activation” in the SCi lasts. To determine the sensitivity of this residual activity to the amplitude of saccades, we simulated saccades with various amplitudes and recorded the activity level of the associated nodes at the end of these saccades. Constant inputs to fixation neurons at the rostral pole (d = 6, σd = 0.6) and buildup neurons at various caudal sites (d = 12, σd = 0.6) were used. Saccade duration as a function of saccade amplitude was estimated with the following equation, duration = 1.8*amplitude + 17 (Chu & Kaneko, 1995).
Our simulation predictions are presented along with neurophysiological data (Munoz & Wurtz, 1995b, Figure 9B) in Figure 2A. Normalized discharge level (activity remaining) at the end of a saccade was plotted against the amplitude of the saccade. As can be seen in this figure, more activity remains in the SCi immediately following small, than following large, saccades. This is the result of two factors. First, node activity decays exponentially once external input to the network ceases. Because the duration of small saccades is shorter than large saccades, by the end of a large saccade more time will have elapsed and hence activity will have decayed more than for small saccades. Second, and more importantly, due to long-distance inhibition, the leftover activity associated with a large saccade is quickly inhibited by the fixation neuron activity at the rostral pole. However, due to short-distance excitation, the leftover activity associated with small saccades collaborates and merges with the fixation neuron activity and even drags the fixation activity toward itself (see Figure 1E). Consequently, the leftover activity has a larger and longer lasting effect on behavior following small saccades than following large saccades. That is, the mechanism we are proposing is confined to relatively small (15° and less) saccades. One might wonder how often this mechanism applies to real-world saccadic explorations of the environment. Given the fact that the amplitudes of normal saccades are Poisson, or exponentially, distributed with means around 6° visual angle or less (e.g., Carpenter, 1988; von Wartburg et al., 2007), this mechanism will influence the initiation time of the majority of the saccades we make.
Simulation of Behavioral Findings
We further explored our theory by comparing our simulation results to behavioral findings. Our simulation method was relatively straight forward; a sample trial in which a first saccade is followed by a return saccade is illustrated in Figure 1B. At the beginning of each trial, an input was given to the rostral pole fixation neurons (F' in Figure 1A) to maintain active fixation. Two hundred milliseconds later, an input was fed to a caudal site (B') to initiate a first saccade. At the same time, the input to fixation neurons was turned off. When activity at the excited caudal site (B') crossed the saccade initiation threshold, input to this site was turned off and input to fixation neurons (F') was switched back on, so that fixation would start at the end of a saccade. Under optimal conditions, this input change, together with the lateral interaction in the SCi, will result in what looks like a “hill of activity” moving toward the rostral pole (marked with a white arrow in Figure 1B; see the Appendix for a brief exploration of this phenomenon). After a 20 ms efferent delay, a saccade was initiated to the response field of the SC site which reached threshold (B' in Figure 1A) and its duration was estimated with the following equation: duration = 2.2*amplitude + 21 (Carpenter, 1988). Then, after various time intervals (0-100 ms), another input was fed to the symmetrically opposite site in the SCi (A' in Figure 1A) to initiate a return saccade. 20 ms after the activity at this site (A') reached threshold, a second saccade was initiated to the response field of this site (A in Figure 1A). The amplitude and direction of the first and second saccades, as well as the fixation duration preceded the second saccade, were recorded for each trial for further analysis. Our simulations of three behavioral experiments (Hooge & Frens, 2000, Experiment 2a; Klein & MacInnes, 1999, Experiment 1; Smith & Henderson, 2009, Experiment 1) are summarized below. In these simulations, inputs for fixation and buildup neurons were fixed at d = 6, σd = 0.6 and d = 10.5, σd = 0.6, respectively.
Hooge and Frens (2000). In Hooge and Frens (2000, Experiment 2a), participants were asked to saccade between three loci as quickly as possible (as illustrated in Figure 2B). They found a latency cost for saccades that reversed vectors, as compared to those that repeated vectors. This cost was labeled “inhibition of saccade return” (ISR). In our simulations of this behavioral experiment, two consecutive saccades with randomly selected directions (left or right) were simulated in each trial. For both directions, the saccade amplitude was fixed at 7.5°, as in Hooge and Frens (2000, Experiment 2a). The time interval between the termination of the first saccade and the onset of the signal (input) to initiate the second saccade, which was randomly selected to repeat vectors (forward saccade) or return to the initial fixation (return saccade), was randomized between 0 and 100 ms. For convenience, we will refer to this time interval as the “input delay of the second saccade.” The fixation duration preceded the second saccade, as a function of the relative direction of the second saccade (“Return” or “Forward”), is plotted in Figure 2B along with the behavioral results from Hooge and Frens (2000, Experiment 2a).
Smith and Henderson (2009). In Smith and Henderson (2009, Experiment 1), participants freely inspected photographic scenes while their eye movements were monitored. The freely made saccades were later analyzed to reveal how a saccade was affected by its immediately preceding saccade. It was found that saccades that went back to the vicinity of their preceding fixation locations took longer to initiate than those which roughly repeated the vector of their preceding saccades, a finding that was labeled “saccadic momentum.” For simplicity, we compared our simulation results to only two data points from Smith and Henderson (2009, Figure 4): the 0° (“Return” saccades) and 180° (“Forward” saccades) data bins with 0° amplitude differences (see Figure 2C). Although saccade amplitudes were not reported in Smith and Henderson (2009), we used their reported image size (25.7° × 19.4°) to estimate the amplitudes based on the findings of von Wartburg et al. (2007). These amplitudes were characterized by an exponential distribution with a mean of 5.5°. Small amplitude (< 1°) and very large amplitude (> 30°) saccades were excluded from our simulations, because they were excluded from analysis in Smith and Henderson (2009), or were not made by their participants. In our simulations, the direction (left or right) and amplitude of the two consecutive saccades in each trial were randomized. Because we wanted to compare return and forward saccades with comparable amplitudes, only trials in which the two saccades had an amplitude difference of less than 1° were included in our analysis. The time interval between the end of the first saccade and the input onset of the second saccade was randomized between 0 and 100 ms. Simulation results, along with the behavioral data from Smith and Henderson (2009), are presented in Figure 2C.
Klein and MacInnes (1999). In Klein and MacInnes (1999), participant's eye movements were monitored on line while they searched for a camouflaged target. After a few saccades, a probe was presented at the immediately preceding fixation location, or at one of 5 equi-eccentric novel locations, and a saccadic response was required (Experiment 1). Klein & MacInnes (1999) reported that saccades to probes at a previously fixated location took longer to initiate than saccade to probes at equi-eccentric locations that had not been fixated, a difference that they attributed to inhibition of return. Here, we have only simulated saccades to probes (exogenous) that landed at the last fixation location, or an equi-eccentric new location lying in the same direction of the last saccade (denoting the 180° condition by Klein and MacInnes, 1999). This restriction is necessary because our model is, so far, one-dimensional. A 2-dimensional version would be required to explore vector differences between successive saccades other than 0° and 180°. Partly because the search task was very difficult, saccade amplitudes were small in this experiment; re-analysis of Klein and MacInnes' (1999) raw data files revealed that the average amplitude for the last saccade before the probe was 2.8°. Thus, as in our simulations of Smith and Henderson (2009), the amplitudes were randomly drawn from an exponential distribution, with a mean of 2.8° in the present simulation. One consequence of the probe method used by Klein and MacInnes (1999) is that successive saccades in each trial of our simulations will necessarily have the same amplitude. In Klein and MacInnes (1999), the probe was presented about 20 ms after the last saccade, and neuroscientific data (e.g., Dorris, Pare, & Munoz, 1997) suggests that it would take about 70 ms for this visual input to reach the SCi. Thus, the time interval between the end of the first saccade and the input signal of the second saccade was fixed at 90 ms in our simulations. The simulation results along with the behavioral data from Klein and MacInnes (1999) are presented in Figure 2D.
Summary of Behavioral Simulations. Our behavioral simulation results are compared to behavioral data in Figure 2B-D. As clearly shown in these figures, our simulations successfully reproduced the pattern of behavioral findings in Hooge and Frens (2000), Smith and Henderson (2009) and Klein and MacInnes (1999).
Whereas we successfully reproduced the pattern of results in each study (forward saccades were initiated more rapidly than return saccades), in each case the simulation produced a smaller difference than was present in the target study. For a variety of reasons these differences do not challenge our model. First and foremost, the purpose of these simulations is to demonstrate a theory (or a principle) rather than to fit behavioral data. Consequently, the present exploration did not fiddle with model parameters. Only two critical parameters were varied in our simulation of behavioral experiments, namely, the amplitudes of the two consecutive saccades, and the input delay for the second saccade. The remaining parameters were fixed as described on p. 4-5. Second, the SCi receives input from the retina, the primary visual cortex, and other cortical areas (e.g., FEF, LIP). Because the mechanism explored here is about the internal dynamics of the SC, the difference between these input sources was ignored in the simulations. Third, a 1-dimensional neural network was used in the simulations; some variations in behavioral data which is collected in 2-dimensional space (e.g., Smith and Henderson, 2009) cannot be captured by the model.
As mentioned in the previous paragraph, only the amplitudes of the two consecutive saccades and the input delay for the second saccade were varied in our behavioral simulations. The three behavioral studies were chosen to demonstrate how varying one, or both, of these parameters will produce virtually the same pattern of results. In our simulations of Hooge and Frens (2000), the amplitudes of the two saccades were fixed across trials, while the input delay for the second saccade was varied across trials. In the simulations of Klein and MacInnes (1999), the amplitude of the two saccades varied across trials, while the input delay for the second saccade was held constant (90 ms). In the simulations of Smith and Henderson (2009), both parameters were varied. Despite these variations, the pattern of results observed in our simulations was very consistent, suggesting the findings in our simulations are robust. We did not include stochastic dynamics in our simulations because our theory is about the internal dynamics of the SC and adding noise to our model will not change the pattern of results in our simulations. It is worth noting that with one relatively low-level mechanism we have simulated behavioral effects that have, in the literature, been given three different names: inhibition of saccade return, saccadic momentum and inhibition of return. Whether or not these different effects are, in the minds of their proponents, caused by different mechanisms (some possibilities will be entertained in the general discussion), what we have shown here is that all three effects can be reproduced by the internal dynamics we have attributed to the SCi.
Spatio-temporal Characteristics
In the previous section, we demonstrated that saccades that go back to their immediately preceding fixation locations are initiated more slowly than those which repeat their vectors. How long will this behavioral effect last? What will happen if the two consecutive saccades differ in size? Because the leftover activity in the SCi following a saccade decays relatively quickly, it is reasonable to predict that the behavioral effect (i.e., return saccades being slower to initiate) will not last very long. In our simulations, the time interval between the end of the first saccade and the input onset of the second saccade (see Figure 1B) was varied between 20, 70 and 170 ms. The amplitude of the first saccade was varied between 2°, 5°, 10°, 20° and 30°, and the amplitude of the second saccade was varied between 2°, 3°, 5°, 7°, 10°, 15°, 20°, 25° and 30°. As in previous simulations, inputs for fixation (d = 6, σd = 0.6) and buildup (d = 10.5, σd = 0.6) neurons were fixed in all trials. Our simulation findings are presented in Figure 3.
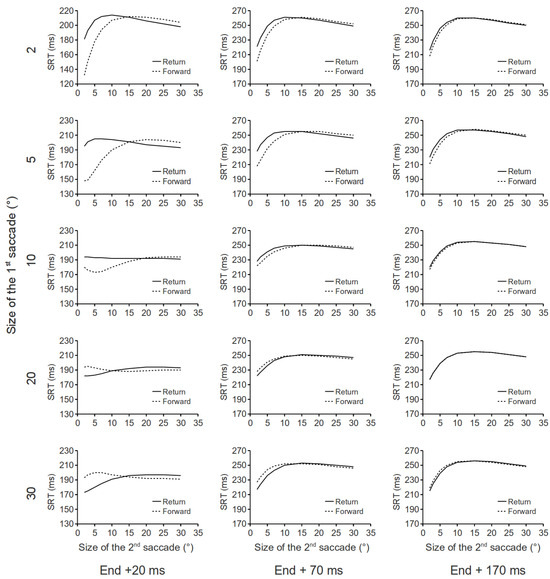
Figure 3.
Parametric testing of the aftereffects of a saccade in our DNF model. In each panel saccadic RT is plotted as a function of the amplitude of the second saccade. Timing of the input to the network for the 2nd saccade is represented in the columns and amplitude of the preceding saccade is represented in the rows.
Several interesting findings are revealed in Figure 3. First, following small saccades, small return saccades are slower to initiate, as compared to small forward saccades. However, large return saccades are faster to initiate as compared to large forward saccades. Second, following large saccades, the opposite pattern of results was obtained. That is, small return saccades are faster to initiate as compared to small forward saccades; large return saccades are slower to initiate as compared to large forward saccades. Third, these effects decay quickly as a function of the input delay of the second saccade. Further simulations showed that, regardless of the size of the first saccade, there is virtually no SRT difference between forward and return saccades when the input delay of the second saccade exceeds 270 ms. Note that some of these effects critically depend on the lateral interaction kernel in our DNF model. For example, the leftover activity associated with large saccades competes with the building up of activity at the rostral pole. Because our lateral interaction kernel has a Mexican hat shape, at the rostral pole, nodes closer to the leftover activity will get stronger inhibition, as compared to these which are further away. As a result, small return saccades are faster to initiate than small forward saccades. Note that the results in Figure 3 are derived from simulations that only consider the spatio-temporal dynamics within the SCi. The inclusion of other brain systems involved in saccade initiation might interact with these predictions.
General Discussion
Why Are Forward Saccades Initiated More Rapidly?
Although researchers have frequently reported the behavioral effect that return saccades are initiated less rapidly than forward saccades, there is no consensus regarding the mechanism underlying this effect. IOR is the name of an effect that also implies the mechanism: inhibition at locations recently oriented to. For argument's sake, let's say the inhibition is in the salience map that guides orienting. This would be the mechanism proposed by Klein (1988; Klein & MacInnes, 1999; MacInnes & Klein, 2003) to be responsible for the delay and hypothesized to be a foraging facilitator. By calling the effect they studied “inhibition of saccade return” Hooge and Frens (2000) would seem to have adopted a similar inhibitory mechanism: “ISR can be seen as a low-level short-term memory for locations already fixated.” (p. 3423). Yet they would later suggest a mechanism akin to a refractory period (Hooge et al, 2005). In contrast to the mechanism proposed by Posner and Cohen (1984) which is initiated by peripheral stimulation, ISR is initiated by overt orienting. Whether they would attribute their effects to inhibition, refractoriness or habituation (Dukewich, 2009), Klein and MacInnes (1999) and Hooge and Frens (2000) both localize the effect at the location that the eyes had most recently left. This is in contrast to Smith and Henderson (2009), whose saccadic momentum effect is described as an “oculomotor bias to continue moving the eyes in the same direction.” Like our proposal, this mechanism is located in the forward rather than backward direction.
In contrast to our model, which is computationally explicit, all the above mentioned proposals are vague, verbal statements from which it is difficult to generate quantitative predictions with confidence. Our simulations demonstrate that the delay experienced by return saccades, as compared to forward saccades, could simply be a consequence of the passive remapping of space in the SCi and the lateral interaction within the SCi. This theory does not agree with IOR and ISR which assume a local inhibition. As shown in Figure 1A, due to the lateral interaction in the SC, following a saccade, the excited colliculus has residual activation, while the other colliculus has a decrease of activity (inhibition). Both inhibition and excitation contribute to the exhibited behavioral effect. In fact, Anderson et al. (2008) have demonstrated that the SRT difference between forward and return saccades is contributed by both forward saccades being faster and return saccades being slower. Furthermore, our theory does not agree with “saccadic momentum” as a general phenomenon. As demonstrated in Figure 3, our model predicts that the size of a saccade matters. Following small saccades, large reversal saccades are faster to initiate than large forward saccades. The converse is also true: Following large saccades, small reversal saccades are faster to initiate than forward saccades. Further behavioral study is needed to test these predictions (Some support for these predictions can be derived by comparing Experiment 2a and 2b from Hooge and Frens (2000). It must be noted, however, that all the saccades in Experiment 2a were 7.5° while the smallest saccades in Experiment 2b was 15°. Using their methodology, we would love to see more complete exploration of the parameter space illustrated in Figure 3).
To sum up, the execution of a saccade will lead to asymmetric activation in the SC and relatively small forward saccades being initiated more rapidly than return saccades.
Another IOR mechanism?
IOR was originally explored in the cue-target paradigm and was characterized by slower responses (manual or saccadic) to previously cued than to uncued targets. Recent physiological (e.g., Dorris, Klein, Everling, & Munoz, 2002; Fecteau & Munoz, 2005), behavioral (e.g., Dukewich & Boehnke, 2008), computational (Satel et al., 2011), and theoretical (Dukewich, 2009) developments suggest that IOR in the cue-target paradigm may be largely due to a reduction of target-elicited sensory input, namely, short-term depression (STD) of sensory inputs. This “sensory STD” mechanism of IOR affects the strength of inputs to motor programming maps (e.g., in the SC). The sensory STD mechanism, by its nature, is retinotopic. However, depending on the experimental setup, on a behavioral level, this mechanism may appear to be spatiotopic (e.g., Maylor & Hockey, 1985), retinotopic (e.g., Souto & Kerzel, 2009), or both (Mathôt & Theeuwes, 2010).
The effect explored in the present study (i.e., saccades which reverse vectors are slower to initiate than those which repeat vectors) is phenomenologically similar to IOR “effects” observed in the cue-target paradigm. However, the underlying mechanism of this effect is quite different. This mechanism is a “motor” mechanism implemented in the SCi; it has little, if anything, to do with the sensory input itself. On a behavioral level, this mechanism operates on a “spatiotopic” coordinate system.
The critical question is, can we call this motor aftereffect an “IOR” mechanism? We believe so. First, this mechanism is about orienting and its behavioral consequence is similar to the IOR “effect” observed in the cue-target paradigm. Second, this mechanism biases orienting away from previously fixated locations; this is exactly the function as IOR most nowadays scholars agree upon.
IOR in Saccade-Saccade Paradigms
In the IOR literature, a large set of experimental paradigms have been recruited to explore how previous orienting behavior affects subsequent deployment of attention. One such experimental paradigm is the saccade-saccade paradigm. In a saccade-saccade paradigm, participants are required to make a saccadic response to the cue, then saccade back to the central fixation position, followed by a final saccadic response to the target. The cues and targets can be exogenous (i.e., brightening of a peripheral box) or endogenous (i.e., an arrow in the central box pointing to one of the peripheral boxes). The findings in this paradigm are similar to those in the cue-target paradigm, with slower (saccadic) responses to cued targets, as compared to uncued targets (but see Dorris et al., 1999, for an exception with highly practiced monkeys). This effect was believed to be caused by the response to the cue (see Taylor & Klein, 1998; Taylor & Klein, 2000). However, previous researchers have overlooked the fact that following the saccade back to central fixation, saccades to the uncued location are forward saccades while those to the cued location are return saccades. The observed “IOR” effect in this case then, is likely caused (or contaminated) by the saccade back to the central box, rather than the saccade to the cued box. This is especially true when both cues and targets are endogenous stimuli (see Taylor & Klein, 2000, for an example). The mechanism explored here is relatively short-lived (see Figure 3). In a saccade-saccade paradigm, this mechanism will make no (or little) contribution to the IOR effect when saccades to the final target are preceded by a long fixation.
Contrary to common IOR findings (i.e., slower responses to cued relative to uncued targets) one frequently cited study which investigated the saccade-saccade task with monkeys, reported faster SRTs to cued targets (Dorris et al., 1999). This finding does not challenge our theory because the time interval between the end of the saccade back to the central box and the input onset for the saccade to the target was longer than 300 ms, so the mechanism discussed here will have little, or no, behavioral effect on the saccade to the target. The observed effect in that study is likely caused by the same mechanism underlying the IOR effect in traditional cue-target paradigms (i.e., STD elicited by the cue and cue-back sensory input signals). Note that the authors used exogenous stimuli for the cues and targets, and the saccade back from the cued location to fixation was also guided by an exogenous stimulus. Due to this exogenous “cue-back”, the upstream pathway responsible for the uncued peripheral box was actually “cued”. Thus, while participants were fixating the central box, awaiting the appearance of the target, the cued box still has an old sensory STD process and the uncued box has a new sensory STD process. As a result, responses to cued targets were faster, and the difference between cued and uncued targets were relatively unaffected by cue-target SOAs (see Dorris et al., 1999, Figure 3A). With a similar experimental task, the opposite pattern of results (i.e., significant “IOR” effect of 21 ms), was reported in Taylor and Klein (2000) with human participants. A closer look at their experimental setup reveals that only 500 ms was allocated for participants to saccade back to the central fixation box. While the authors did not report how fast these saccades were, similar experiments in our lab suggest that, on average, these saccades will take about 330 ms to complete. That is, the time interval between the end of the saccade back and the onset of the target should be relatively short in a large portion of trials in Taylor and Klein (2000). As a result, the mechanism discussed in the present paper should have contributed to their observed “IOR” effect.
IOR in Visual Search
In contrast to visual search theorists who have claimed that there is no need for a “memory mechanism” which discourages return of attention to previously inspected locations (or items) (e.g., Horowitz & Wolfe, 1998), many researchers believe that IOR is one such mechanism (e.g., Klein, 1988; Koch & Ullman, 1985). The most direct evidence comes from the findings of a “probe-following-search” paradigm during which participant’s eye movements are monitored (for a review, see Wang & Klein, 2010). The experimental paradigm used in this line of research is described in our simulations of Klein and MacInnes (1999). We believe the behavioral findings in this line of research (i.e., forward saccades in response to probes being faster than return saccades) may have been caused, at least in part, by the mechanism explored in the present study.
A search task usually involves multiple saccades. For convenience, based on their ordinal positions relative to the current fixation, previous fixations have been labeled as 1-back (the immediately preceding fixation), 2-back (the fixation prior to the last one), … n-back, in previous studies. One critical characteristic of the mechanism explored here is that it tends to be short-lived, at least on a behavioral scale, raising the question of whether it explains slower return to fixations beyond the 1-back fixation (as in Dodd et al., 2009; Klein & MacInnes, 1999). One of the consequences of the mechanism presented here is that it encourages saccades to repeat direction (e.g., Hooge et al., 2005; Klein & MacInnes, 1999). As a result, a saccade to the 2-back fixation location will necessarily be larger than the most recent saccade and this difference will, on average, increase for further back saccades. However, saccades made in search tend to be small in size, so a 2-back (or 3-back) saccade will be still in range where a return saccade is slower than a forward saccade (see Figure 3). Furthermore, our theory predicts that the number of intervening saccades does not matter too much, saccades to the target location will be slower than those which repeat the vector of their immediately preceding saccade, so long as the target location is in the vicinity of the immediately preceding fixation location and the time interval is sufficiently short.
Limitations of the Present Study
As mentioned earlier, the mechanism proposed here will have little or no effect if a return saccade is preceded by a long fixation (>300 ms). However, this prediction is challenged by several studies. In MacInnes and Klein (2003), a “probe-following-search” task (Klein & MacInnnes, 1999) was tested and participants were instructed to stop searching when they found something “interesting”. Probes were delivered 500 ms later. Because the mechanism proposed here is short-lived it does not predict the results of this study: slower responses to probes presented at the immediately preceding fixation locations, as compared to those at locations straight ahead (47 ms). Similarly, Rafal, Egly and Rhodes (1994) explored IOR in saccade-saccade paradigms and an IOR-like effect (27 ms) was observed when the pre-target fixation duration was 500 or 750 ms (Experiment 2). Our model does not predict this pattern either.
It is worth noting that our model is ONLY about the SC; it is possible that the slower initiation of return saccades is also contributed to by other cortical maps, especially the FEF, which plays a critical role in voluntary control of eye movements (Munoz & Schall, 2003). Besides, previous study showed that visual stimulation temporarily releases inhibitory inputs from substantia nigra, pars reticulata (SNr) to the SC (e.g., Jiang, Stein, & McHaffie, 2003). Following visually guided saccades, the residual activity at the excited SCi sites, and thus the asymmetric activation in the SCi, will last longer than would have been predicted by our model.
Furthermore, we want to mention some technical limitations of the present study. First, a 1-dimensional model was used in the present exploration. Although this one dimensionality does not undermine the theory we are proposing, we are unable to systematically explore how a saccade affects the latency of subsequent saccades with varied directional deviations without extending the model into two dimensions. Second, in our model, periodic boundary conditions were used to minimize boundary effects. Thus, in the model representation, the caudal area of the two colliculi is connected. This might have caused an underestimation of the residual activity associated with large saccades (see Figure 2A).
Implications for Future Studies
In the present paper, we have demonstrated that the internal dynamics of the SC can explain why saccades that reverse vectors often have longer latencies than those which repeat vectors. In addition to emphasizing how this finding relates to the IOR literature, we would like to end this paper with a few research proposals.
First, our simulations produce (at least) two novel predictions: a) following small saccades, large return saccades are faster to initiate than large forward saccades; b) following large saccades, small return saccades are faster to initiate than small forward saccades (see Figure 3). These effects depend critically on the Mexican-hat shaped lateral interaction kernel used in our DNF model. This lateral interaction kernel is backed by previous single-unit recording studies (e.g., Trappenberg et al., 2001). With these two predictions in mind, it is also possible to validate this lateral interaction kernel with behavioral experiments.
Second, the mechanism discussed here is about the internal dynamics of the SC and will be put into play whenever a saccade is made. So, this mechanism will affect the behavioral observations of any IOR experiment which involves multiple saccades. In a cue-saccade paradigm in which participants maintain fixation until a target appears in the periphery, the IOR effect is largely caused by sensory STD at the cued retinotopic location reducing the target input to the SC. If a saccadic response is also required to the cue, as in a saccade-saccade paradigm with exogenous cues and targets, the mechanism we are proposing will come into play and increase the observed “IOR” effect. However, this additional effect will appear only if: a) the saccade back to the central fixation is not guided by a visual onset at the central fixation, because such a stimulus will cause STD at the uncued location; b) the time interval between the end of the saccade back to the central fixation and the onset of the target is relatively short.
Third, in saliency-based computational models of orienting (e.g., Itti & Koch, 2001; Koch & Ullman, 1985), IOR is regarded as a low-level mechanism that could overcome the salience of a “winning” item once it has been inspected. In the case of overt orienting, the performance of such models would be significantly improved if the mechanism described here is considered.
Acknowledgments
We are grateful to two anonymous reviewers for their helpful comments and suggestions on an earlier version of this paper. Z. Wang was supported by the China Scholarship Council (CSC), T. P. Trappenberg and R. M. Klein were supported by the Natural Sciences and Engineering Research Council of Canada (NSERC).
Appendix: Moving Hill or Jumping Hill?
Early observations in cats showed a “hill” of activity moving toward the rostral pole of the SC during saccades (e.g., Munoz, Pelisson, & Guitton, 1991). However, this phenomenon was not consistently observed in the primate SC (e.g., Anderson, Keller, Gandhi, & Das, 1998; Choi & Guitton, 2009; Munoz & Wurtz, 1995a; Soetedjo, Kaneko, & Fuchs, 2002) and the ecological significance of this “moving hill” is controversial. Our simulation results suggest that the “moving hill” does not encode the trajectory of saccades (Munoz et al., 1991), nor does it encode the distance between the current gaze position and the target location during multi-step gaze shifts (Bergeron, Matsuo, & Guitton, 2003); it is a byproduct of the input changes and the lateral interaction in the SC (see Figure 1B). From a computational perspective, whether a “moving hill” appears during a saccade depends on the lateral interaction kernel, the amplitude of the saccade and the width of the input signals. Figure 4A and B illustrates the network activity before, during and after a 10° and 25° saccade. A moving hill was obvious during the 10° saccade while the activity during the 25° is more like a “jumping hill”.

Figure 4.
Moving hill and jumping hill during a saccade. In these simulations, input for fixation and buildup neurons were set to d = 10, σd = 0.7 and d = 12, σd = 0.7, respectively. “Onset” means the time when a saccade starts and “End” means the time when a saccade ends.
Figure 4.
Moving hill and jumping hill during a saccade. In these simulations, input for fixation and buildup neurons were set to d = 10, σd = 0.7 and d = 12, σd = 0.7, respectively. “Onset” means the time when a saccade starts and “End” means the time when a saccade ends.

References
- Amari, S. 1977. Dynamics of pattern formation in lateral-inhibition type neural fields. Biological Cybernetics 27, 2: 77–87. [Google Scholar] [CrossRef] [PubMed]
- Anderson, A., H. Yadav, and R. Carpenter. 2008. Directional prediction by the saccadic system. Current Biology 18, 8: 614–618. [Google Scholar] [CrossRef] [PubMed]
- Anderson, R. W., E. L. Keller, N. J. Gandhi, and S. Das. 1998. Two-dimensional saccade-related population activity in superior colliculus in monkey. Journal of Neurophysioogy 80, 2: 798–817. [Google Scholar] [CrossRef]
- Arai, K., E. L. Keller, and J. A. Edelman. 1994. Two-dimensional neural network model of the primate saccadic system. Neural Networks 7, 6–7: 1115–1135. [Google Scholar] [CrossRef]
- Bergeron, A., S. Matsuo, and D. Guitton. 2003. Superior colliculus encodes distance to target, not saccade amplitude, in multi-step gaze shifts. Nature Neuroscience 6, 4: 404. [Google Scholar] [CrossRef]
- Carpenter, R. H. 1988. Movements of the Eyes, 2nd ed. London: Pion Ltd. [Google Scholar]
- Choi, W. Y., and D. Guitton. 2009. Firing patterns in superior colliculus of head-unrestrained monkey during normal and perturbed gaze saccades reveal short-latency feedback and a sluggish rostral shift in activity. Journal of Neurophysioogyl 29, 22: 7166–7180. [Google Scholar] [CrossRef]
- Chu, L., and C. R. S. Kaneko. 1995. Do the saccadic system and the vestibulo-ocular reflex of monkeys share a common neural integrator? Neuroscience Letters 187, 3: 193–196. [Google Scholar] [CrossRef]
- Das, S., E. L. Keller, and K. Arai. 1996. A distributed model of the saccadic system: The effects of internal noise. Neurocomputing 11, 2–4: 245–269. [Google Scholar] [CrossRef]
- Dodd, M. D., S. Van der Stigchel, and A. Hollingworth. 2009. Novelty is not always the best policy: Inhibition of return and facilitation of return as a function of visual task. Psychological Science 20, 3: 333–339. [Google Scholar] [CrossRef]
- Dorris, M. C., R. M. Klein, S. Everling, and D. P. Munoz. 2002. Contribution of the primate superior colliculus to inhibition of return. Journal of Cognitive Neuroscience 14, 8: 1256–1263. [Google Scholar] [CrossRef]
- Dorris, M. C., M. Pare, and D. P. Munoz. 1997. Neuronal activity in monkey superior colliculus related to the initiation of saccadic eye movements. The Journal of Neuroscience 17, 21: 8566–8579. [Google Scholar] [CrossRef] [PubMed]
- Dorris, M. C., T. L. Taylor, R. M. Klein, and D. P. Munoz. 1999. Influence of previous visual stimulus or saccade on saccadic reaction times in monkey. Journal of Neurophysiology 81, 5: 2429–2436. [Google Scholar] [CrossRef][Green Version]
- Dukewich, K., and S. Boehnke. 2008. Cue repetition increases inhibition of return. Neuroscience Letters 448, 3: 231–235. [Google Scholar] [CrossRef] [PubMed]
- Dukewich, K. R. 2009. Reconceptualizing inhibition of return as habituation of the orienting response. Psychonomic Bulletin & Review 16, 2: 238–251. [Google Scholar]
- Fecteau, J. H., and D. P. Munoz. 2005. Correlates of capture of attention and inhibition of return across stages of visual processing. Journal of Cognitive Neuroscience 17, 11: 1714–1727. [Google Scholar] [CrossRef]
- Findlay, J. M., and R. Walker. 1999. A model of saccade generation based on parallel processing and competitive inhibition. The Behavioral and Brain Sciences 22, 4: 661–674; discussion 674–721. [Google Scholar] [CrossRef]
- Hooge, I. T. C., E. A. B. Over, R. J. A. van Wezel, and M. A. Frens. 2005. Inhibition of return is not a foraging facilitator in saccadic search and free viewing. Vision Research 45, 14: 1901–1908. [Google Scholar] [CrossRef]
- Hooge, I., and M. Frens. 2000. Inhibition of saccade return (ISR): Spatio-temporal properties of saccade programming. Vision Research 40, 24: 3415–3426. [Google Scholar] [CrossRef]
- Horowitz, T., and J. Wolfe. 1998. Visual search has no memory. Nature 394, 6693: 575–577. [Google Scholar] [CrossRef]
- Itti, L., and C. Koch. 2001. Computational modelling of visual attention. Nature Reviews Neuroscience 2, 3: 194–203. [Google Scholar] [CrossRef]
- Jiang, H., B. E. Stein, and J. G. McHaffie. 2003. Opposing basal ganglia processes shape midbrain visuomotor activity bilaterally. Nature 423, 6943: 982–986. [Google Scholar] [CrossRef] [PubMed]
- Klein, R. 1988. Inhibitory tagging system facilitates visual search. Nature 334, 6181: 430–431. [Google Scholar] [CrossRef] [PubMed]
- Klein, R. M., and J. W. MacInnes. 1999. Inhibition of return is a foraging facilitator in visual search. Psychological Science 10, 4: 346–352. [Google Scholar] [CrossRef]
- Koch, C., and S. Ullman. 1985. Shifts in selective visual attention: Towards the underlying neural circuitry. Human Neurobiology 4, 4: 219–27. [Google Scholar]
- Kopecz, K. 1995. Saccadic reaction times in gap/overlap paradigms: a model based on integration of intentional and visual information on neural, dynamic fields. Vision Research 35, 20: 2911–2925. [Google Scholar] [CrossRef]
- Kopecz, K., and G. Schöner. 1995. Saccadic motor planning by integrating visual information and pre-information on neural dynamic fields. Biological Cybernetics 73, 1: 49–60. [Google Scholar] [CrossRef]
- MacInnes, J. W., and R. M. Klein. 2003. Inhibition of return biases orienting during the search of complex scenes. The Scientific World Journal 3: 75–86. [Google Scholar] [CrossRef]
- Mathôt, S., and J. Theeuwes. 2010. Gradual remapping results in early retinotopic and late spatiotopic inhibition of return. Psychological Science 21, 12: 1793–1798. [Google Scholar] [CrossRef]
- Maylor, E. A., and R. Hockey. 1985. Inhibitory component of externally controlled covert orienting in visual space. Journal of Experimental Psychology: Human Perception and Performance 11, 6: 777–787. [Google Scholar] [CrossRef]
- Meeter, M., S. Van der Stigchel, and J. Theeuwes. 2010. A competitive integration model of exogenous and endogenous eye movements. Biological Cybernetics 102, 4: 271–291. [Google Scholar] [CrossRef][Green Version]
- Munoz, D. P., and R. H. Wurtz. 1993. Fixation cells in monkey superior colliculus. I. Characteristics of cell discharge. Journal of Neurophysiology 70, 2: 559–575. [Google Scholar] [CrossRef] [PubMed]
- Munoz, D. P., and R. H. Wurtz. 1995a. Saccade-related activity in monkey superior colliculus. II. Spread of activity during saccades. Journal of Neurophysiology 73, 6: 2334–2348. [Google Scholar] [CrossRef] [PubMed]
- Munoz, D. P., and R. H. Wurtz. 1995b. Saccade-related activity in monkey superior colliculus. I. Characteristics of burst and buildup cells. Journal of Neurophysiology 73, 6: 2313–2333. [Google Scholar] [CrossRef] [PubMed]
- Munoz, D. P., D. Pelisson, and D. Guitton. 1991. Movement of neural activity on the superior colliculus motor map during gaze shifts. Science 251, 4999: 1358–1360. [Google Scholar] [CrossRef]
- Munoz, D. P., and J. D. Schall. 2003. Edited by W. C. Hall and A. K. Moschovakis. Concurrent, distributed control of saccade initiation in the frontal eye field and superior colliculus. In The superior colliculus: New approaches for studying sensorimotor integration. New York: CRC Press: pp. 55–82. [Google Scholar]
- Munoz, D. P., and J. H. Fecteau. 2002. Vying for dominance: Dynamic interactions control visual fixation and saccadic initiation in the superior colliculus. In The Brain’s eye: Neurobiological and clinical aspects of oculomotor research. Elsevier: Vol. 140, pp. 3–19. [Google Scholar]
- Rafal, R., R. Egly, and D. Rhodes. 1994. Effects of inhibition of return on voluntary and visually guided saccades. Canadian Journal of Experimental Psychology 48, 2: 284–300. [Google Scholar] [CrossRef]
- Robinson, D. A. 1972. Eye movements evoked by collicular stimulation in the alert monkey. Vision Research 12, 11: 1795–1808. [Google Scholar] [CrossRef] [PubMed]
- Satel, J., Z. Wang, T. P. Trappenberg, and R. M. Klein. 2011. Modeling inhibition of return as short-term depression of early sensory input to the superior colliculus. Vision Research 51, 9: 987–996. [Google Scholar] [CrossRef][Green Version]
- Smith, T. J., and J. M. Henderson. 2009. Facilitation of return during scene viewing. Visual Cognition 17, 6: 1083–1108. [Google Scholar] [CrossRef]
- Soetedjo, R., C. R. S. Kaneko, and A. F. Fuchs. 2002. Evidence against a moving hill in the superior colliculus during saccadic eye movements in the monkey. Journal of Neurophysiology 87, 6: 2778–2789. [Google Scholar] [CrossRef]
- Souto, D., and D. Kerzel. 2009. Involuntary cueing effects during smooth pursuit: Facilitation and inhibition of return in oculocentric coordinates. Experimental Brain Research 192, 1: 25–31. [Google Scholar] [CrossRef]
- Taylor, T., and R. Klein. 1998. On the causes and effects of inhibition of return. Psychonomic Bulletin & Review 5, 4: 625–643. [Google Scholar]
- Taylor, T. L., and R. M. Klein. 2000. Visual and motor effects in inhibition of return. Journal of Experimental Psychology: Human Perception and Performance 26, 5: 1639–1656. [Google Scholar] [CrossRef]
- Trappenberg, T., M. Dorris, D. Munoz, and R. Klein. 2001. A model of saccade initiation based on the competitive integration of exogenous and endogenous signals in the superior colliculus. Journal of Cognitive Neuroscience 13, 2: 256–271. [Google Scholar] [CrossRef] [PubMed]
- Wang, Z., and R. M. Klein. 2010. Searching for inhibition of return in visual search: A review. Vision Research 50, 2: 220–228. [Google Scholar] [CrossRef]
- von Wartburg, R., P. Wurtz, T. Pflugshaupt, T. Nyffeler, M. Lüthi, and R. M. Müri. 2007. Size matters: Saccades during scene perception. Perception 36, 3: 355–365. [Google Scholar] [CrossRef] [PubMed]
- Wilimzig, C., S. Schneider, and G. Schoener. 2006. The time course of saccadic decision making: Dynamic field theory. Neural Networks 19, 8: 1059–1074. [Google Scholar] [CrossRef]
- Wilson, H. R., and J. D. Cowan. 1973. A mathematical theory of the functional dynamics of cortical and thalamic nervous tissue. Biological Cybernetics 13, 2: 55–80. [Google Scholar] [CrossRef]


Copyright © 2011. This article is licensed under a Creative Commons Attribution 4.0 International License.